quantitative image analysis for geologic core description
TRANSCRIPT
Journal of Sedimentary Research, 2017, v. 87, 460–485
Research Article
DOI: http://dx.doi.org/10.2110/jsr.2017.25
QUANTITATIVE IMAGE ANALYSIS FOR GEOLOGIC CORE DESCRIPTION
ROGER J. BARNABY
DigitalStratigraphy, 415 West 15th Street, Houston, Texas 77008, U.S.A.
e-mail: [email protected]
ABSTRACT: Many basic rock properties—such as lithology, bedding, grain size, sorting, and porosity—are expressedin geologic cores by changes in color, brightness, and texture. Quantitative descriptive rock properties can thus bederived from digital core images. Despite the widespread availability of high-resolution core images and imageanalysis software, these data are underutilized by geoscientists tasked with describing core.This paper demonstrates the application of image analysis for quantitative core description using examples from
three different carbonate reservoirs: (1) evaporite-rich dolostone from the First Eocene, Kuwait–Saudi ArabiaPartitioned Zone, (2) vuggy dolostone from the Cretaceous Toca Formation, offshore Angola, (3) thin-beddedlimestone and mudrock from the Ordovician Utica Formation, Ohio, USA. In each example, quantitative data areextracted from core images using ImageJ or WellCAD software. The image-derived descriptive parameters areconsistent with petrophysical log and core data, supporting the validity of this approach to core description.Image-analysis-guided core description offers many advantages over traditional hand-drawn core description: 1)
hand-drawn core descriptions tend to be qualitative and core-log integration is difficult and imprecise, whereas imageanalysis generates quantitative descriptive data that are directly comparable with petrophysical datasets; 2) imageanalysis can characterize fine-scale geologic heterogeneity that is difficult or impossible to resolve using log and coreplug data and hand-drawn core descriptions; 3) image analysis allows geologists to generate preliminary descriptionsprior to actual core viewing, a more efficient workflow that minimizes time expended in offsite core viewing, perhapsin remote locations with limited time available; 4) integration of image-derived core data with petrophysical log andcore data allows rigorous evaluation of core data quality—before, during, and after the process of core description.Image analysis thus provides a valuable tool for geoscientists to efficiently generate quantitative, petrophysically
significant core descriptions.
INTRODUCTION
Digital images—white light (WL) and ultraviolet (UV) color photo-
graphs and X-ray computed tomography (CT) scans—are routinely
acquired from whole and slabbed cores. These images contain detailed
information on many basic rock properties. This paper demonstrates how
image analysis can extract quantitative data that allow geologists to
generate core descriptions that are integrated with log and core data.
Advances in high-performance Windows PC tablets (8–16 GB RAM, 64
bit, i7 processors, solid-state hard drives) and WellCAD and ImageJ
software provide an ideal platform for geoscientists to generate integrated
core descriptions. Geologic descriptions are drafted using a stylus on a PC
tablet, directly on top of or adjacent to images and petrophysical core and
log data. The initial image analysis, data integration, and preliminary core
description can be performed using a computer prior to core viewing,
optimizing the time expended at offsite core facilities, which may require
expensive travel to remote and/or dangerous locations. Further image
analysis can be performed as the core is being described.
The resulting quantitative core descriptions can be directly compared
with log- and core-based petrophysical data. Image analysis provides high-
resolution information on fine-scale geological heterogeneity that is
unavailable from standard wireline and core analyses and traditional core
descriptions. Image-derived quantitative core descriptions are useful to
evaluate core datasets for possible errors or data problems. Lastly, although
hand-drawn geologic core descriptions may be of interest to other
geologists, they have limited utility for coworkers in other disciplines, such
as petrophysicists, reservoir modelers, and petroleum engineers who
require digital geologic descriptions and interpretations.
To illustrate the application of image analysis to geologic core
description, this paper describes three examples from heterogeneous
carbonate reservoirs that are difficult to quantitatively characterize using
log and core data and traditional hand-drawn geologic descriptions. The
first example is from the First Eocene Formation in Wafra Field, Kuwait–
Saudi Arabia Partitioned Zone. The objective of this study was to quantify
possible changes to the mineralogy, reservoir quality, and fluid saturation
due to steamflooding. The second example, utilizing vuggy Toca
dolostones from offshore Angola, demonstrates how image analysis of
CT scans can characterize vuggy pore systems. The third example, from
the Utica Formation, Ohio, USA, demonstrates how image analysis can
efficiently characterize laminated to thin-bedded unconventional mudrock
reservoirs.
METHODOLOGY
For the Wafra and Toca studies, wireline logs—gamma ray (GR),
resistivity (RES), neutron porosity (NPHI), density (RHOB), photoelectric
Published Online: May 2017Copyright � 2017, SEPM (Society for Sedimentary Geology) 1527-1404/17/087-460/$03.00

absorption (PEF), caliper (CAL), and borehole image (FMI) were
available; in addition to core gamma ray and core plug analyses (porosity,
permeability, grain density, and saturation). Log-derived mineralogy,
porosity, and water saturation were calculated from these data. For the
Utica study, the only petrophysical data utilized were core gamma ray.
Because log depth differs from core depth, core-log integration requires
depth shifting to ensure that all comparable data are at the same depth.
WellCAD software was used for loading, depth shifting, and integration of
all log, core, and image data. The wireline logs were first loaded into the
document. The FMI logs were then loaded and depth shifted to match the
wireline logs. Next, the core gamma and core plug porosity data were
loaded and depth shifted to match the wireline GR log and log-derived
porosity. Lastly, images from the CT scans and core photographs were
loaded and further depth shifted as required to match the FMI log. This
integrated dataset allows quantitative comparison of images, logs, core
data, and geologic descriptions.
Color WL photographs of slabbed core were available for every study.
The core photographs are 32 bit (red, green, blue) RGB images at 72
pixels/inch (3 pixels/mm). For the Wafra and Toca studies, full-diameter
core CT scans, acquired at a resolution of 300 scans/ft. (1 scan/mm), were
available. These scans are 8 bit grayscale images, also at 72 pixels/inch (3
pixels/mm). This study used the outside circumference of the CT image for
analysis, because it could be directly compared with the borehole image for
depth shifting.
Photo-editing software was used to crop images from the core box
photographs and then mosaic the photographs into a continuous image.
The CT scans, generally in 3 ft. (0.9 m) lengths, were also compiled into a
continuous image. The continuous images from core photographs and CT
scans were then sliced into uniform 1 ft. (0.3 m) lengths in order to
generate digital log curves of the image analysis with a 1 ft. (0.3 m) vertical
resolution, similar to the log and core plug datasets. Because 72 pixels/inch
(3 pixels/mm) core photographs and CT scans were used for the analysis,
small-scale features , 9 pixels2 in area (e.g. , 0.002 inch2, , 1.0 mm2)
were filtered out from the analytical results. The images provided adequate
resolution for the macro-scale features of interest.
Quantitative image analysis of core photographs and CT scans for the
First Eocene and Toca studies was performed using ImageJ—a freeware,
public-domain program that was initially developed at the National
Institute of Health (NIH). ImageJ has an open software architecture; its
power is derived from user-written plugins and macros that are customized
to solve specific image processing and analysis applications. This study
utilized both publicly available freeware and a Chevron proprietary version
of ImageJ for image processing and analysis. A Macintosh spinoff version
of the NIH software, Image SXM, has customized features similar to those
utilized by this study from Chevron proprietary software. Image SXM is
available for free distribution and is documented in detail by Heilbronner
and Barrett (2014).
In CT scans, the density contrast between evaporite minerals, open vugs,
and the host dolostone can be distinguished due to the attenuation of X-
rays that pass through the material and are then filtered to create a
monochromatic image. Anhydrite attenuates the X-ray beam and displays
corresponding low grayscale (white to light gray) values on CT scans.
Conversely, open vugs do not impede the X-rays and display high
grayscale values (dark gray to black). Dolostone exhibits mid-range
FIG. 1.—Location map for Wafra Field and generalized stratigraphic column. First Eocene is the shallowest reservoir interval. Modified from Saller et al. (2014).
QUANTITATIVE IMAGE ANALYSIS FOR GEOLOGIC CORE DESCRIPTIONJ S R 461

grayscale values (medium gray). CT scan images from the Wafra and Toca
studies were segmented according to grayscale values using ImageJ
software. The area for each phase was then computed for each 1 ft. vertical
slice to quantify the mineralogy and vuggy porosity. The results are
presented as a log curve with a data point for every foot.
White-light photographs of core slabs were similarly analyzed using
ImageJ software. The images were first processed and corrected for
exposure. For the Wafra study, the color contrast between white anhydrite
nodules and gray-colored gypsum overgrowths was used to define hue,
saturation, and brightness (HSB) parameters to distinguish anhydrite from
gypsum. ImageJ software was used to segment the images according to the
HSB parameters. The area of each mineral phase was then computed for
each 1 ft. vertical slice. The results are presented as a log curve with a data
point for every foot.
Because oil stain rapidly fades after core is slabbed, WL (and UV)
photographs of freshly slabbed core provide better information on oil stain
than actual core viewing, which may be months after the core was slabbed.
In the Wafra cores, oil stain is the only dark-colored component, thus it can
be readily quantified on the basis of color. Color, as defined by HSB, was
used to segment the images, using ImageJ software, which then computed
the area of oil stain for each 1 ft. (0.3 m) vertical slice. The results are
presented as a log curve with data at a 1 foot vertical spacing.
The Utica Formation consists of light-colored, laminated to thin-bedded
limestones interbedded with dark mudrock. In this example, core
photographs were loaded into WellCAD software, where the image-
analysis application was used to extract a single log curve representing
median grayscale values at a specified vertical interval of 0.01 ft. (3 mm).
High grayscale values represent limestone and low values represent
mudrock. This dense vertical sampling captured laminated and thin-bedded
vertical heterogeneity that is difficult to assess with traditional hand-drawn
core descriptions, wireline logs, and standard-diameter core plugs.
QUANTITATIVE IMAGE ANALYSIS
Example 1: First Eocene Formation, Kuwait–Saudi Arabia
Description.—The First Eocene is the shallowest reservoir in Wafra
Field (Fig. 1). Reservoir geology and production are described by Saller et
al. (2014) and Meddaugh et al. (2007, 2011a, 2011b). The reservoir (Fig.
2) consists of cyclic peritidal dolostones with intercrystalline porosity.
Porosity and permeability values range up to 50% and 6000 mD.
Evaporites are present as dispersed and coalesced nodules and up to 5-ft-
thick (1.5 m) bedded units. Anhydrite is the dominant evaporite mineral;
gypsum occurs as a thin (0.4 inch, 1 cm thick) outer rind on evaporite
nodules.
Because of poor primary oil recovery (Champenoy et al. 2011; Rubin
2011), steamflooding in the First Eocene Wafra reservoir began in 2006
(Barge 2009; Meddaugh 2011b). Steam was injected into a zone 50 ft thick
(15 m) where porous dolostones are overlain by tight, finely crystalline
dolostone and bedded evaporite, which provide a vertical barrier to
steamflood (Fig. 2). The previously cored ‘‘Well A’’ was used to monitor
the thermal buildup (Figs. 3, 4) associated with steam injection (Meddaugh
et al. 2011a, 2011b). In the first three years, the temperature in the
steamflooded zone increased by nearly 2008C. To monitor the effects of
steamflood on the reservoir fluid and rock properties, ‘‘Well B’’ was drilled
in 2012, at a lateral distance of 70 ft. (21 m) away from the previously
cored Well A (Fig. 3). Core was acquired in order to petrographically and
petrophysically compare the pre- and post-steamflood cores, with the intent
of quantifying possible steamflood-induced changes in mineralogy,
FIG. 2.—Stratigraphic summary from Bachtel
(2014 unpublished). First Eocene Formation
consists of cyclic interbedded restricted platform
dolomitized peritidal facies. The steamflood test
interval occurs in porous subtidal peloid dolo-
packstones in upper Sequence 2 that are overlain
by tight finely crystalline dolomites from mud-
dominated intertidal facies and bedded anhydrite.
R.J. BARNABY462 J S R

reservoir quality, and fluid saturation and to evaluate the steamflood sweep
efficiency.
Comparison of the two closely spaced cores indicates that the
depositional facies, rock fabric, and diagenetic features are nearly identical.
In the interval above the steamflood zone, the two cores display similar
properties with respect to oil stain, saturation, mineralogy, and porosity. In
the steamflood zone, however, the post-steamflood core exhibits a
significant decrease in oil stain compared to the correlative interval in
the pre-steamflood core (Fig. 5). Evaporite nodules in the pre-steamflood
core consist of white masses of anhydrite with a medium gray outer rind,
up to 0.4 inch (1 cm) thick, composed of gypsum. In the steamflooded
core, evaporite nodules exhibit a tan oil stain and gypsum is absent.
Results.—CT scan images were segmented according to grayscale to
delineate total evaporite content (Fig. 6). The amount of visual evaporite
was calculated using ImageJ and presented as a log curve (Fig. 7). The
image-derived mineral volumes are consistent with the log-derived
mineralogy based on multimin analysis.
Because anhydrite is white and gypsum is medium gray, the two
minerals can be distinguished in core photographs (Figs. 8, 9). The two
minerals are also identified in thin sections using standard petrographic
techniques (Figs. 8–10). ImageJ was used to segment the core photographs
to delineate anhydrite and gypsum (Fig. 11). The amount of each mineral
phase was computed at 1 foot (0.3 m) intervals, generating a quantitative
curve for the amount of gypsum and anhydrite (Fig. 12). The image-
derived mineral volumes are consistent with log-derived mineralogy using
multimin analysis.
Image analysis indicates that the pre-steamflood core from Well A
locally contains up to 28% gypsum, with an average value of 12% over
the steamflood-equivalent zone, whereas little to no gypsum occurs over
this interval in the post-steamflood core from Well B (Fig. 13). Thin-
section petrography (Fig. 10) provides direct evidence of gypsum
dissolution. Intervals that exhibit gypsum dissolution display a
corresponding increase in porosity (Fig. 13). Core plugs and logs
indicate that porosity increased as much as 10–15% locally, with an
average of 2–3% porosity increase.
Comparison of the log-derived porosities for the pre- and post-
steamflood wells confirms an increase in porosity due to gypsum
dissolution (Fig. 14). In post-steamflood Well B, the porosities are skewed
to higher average and median values than the porosity values from the pre-
steamflood well. A cross plot of the log-derived total porosity (PHIT)
curves for the steamflooded zones confirms the interpretation that selective
dissolution of gypsum created porosity (Fig. 15). The two wells exhibit
similar porosities where only minor gypsum (, 7.5%) was present.
However, for the gypsum-rich lithologies (gypsum . 7.5%), the porosity
values in the post-steamflood well are up to 10–15% greater than in the
pre-steamflood well.
The amount of oil stain was computed from the core photographs using
ImageJ. Comparison of the core photographs and the segmented images
(Fig. 16) demonstrates how core-plug saturations will differ from image
analysis due to small-scale heterogeneity. Although both techniques yield
quantitative results, they are based on entirely different sample volumes:
1.5 inch (3.7 cm) core plugs vs. 1 ft. (0.3 m) core photographs. In general,
the results from the two techniques are consistent (Fig. 17).
Within the steamflooded reservoir, quantitative image analysis docu-
ments locally up to 95% reduction in oil stain, with an average of 66% oil-
stain reduction (Fig. 17). Core-plug oil saturation analyses are consistent
with these calculations. Core plugs from the steamflood zone indicate
locally up to 95% recovery, with an average of 76% recovery over the
interval, while log analyses indicate a slightly lower average of 57% oil
recovery (Fig. 17). Image analysis of oil stain from core photographs can
thus yield results comparable with log and core data.
Discussion.—Image analysis of core photographs indicates extensive
gypsum dissolution in Wafra Field due to steamflood, which caused a
corresponding increase in porosity. Quantitative image-derived estimates
of the amount of gypsum dissolution are supported by petrophysical core
and log data. These interpretations imply significant mobilization of
gypsum during steamflood, which is supported by reports of CaSO4 scale
buildup causing production problems. Thin-section petrography and image
analysis indicate that gypsum dissolution is confined to the outer periphery
of evaporite nodules, which could impact enhanced oil recovery by
channeling steamflood and reducing matrix sweep. This demonstrates that
image analysis has valuable high-resolution reservoir description capabil-
ities that are unmatched by other techniques.
Quantitative analysis of core photographs indicates that steamflood
caused, on average, a 66% reduction in oil stain (Fig 17). This is consistent
with log- and core-derived estimates of oil recovery ranging from 57% to
76%, respectively. Moreover, image analysis yields a high-resolution,
better than 0.05 inch (1 mm), characterization of the heterogeneous
distribution of residual oil (Fig. 16) than is possible using logs and
standard-diameter core plugs. This high-resolution characterization of oil
recovery is critical for evaluating the effectiveness of matrix sweep by
steamflood. It also provides a framework for further investigations of fine-
FIG. 3.—Base map for Wafra First Eocene steamflood test that initiated in 2006.
The design shows an inverted five-spot pattern, with the steam injector well in the
center flanked by four producers. Well Awas cored in 2004, prior to steamflood, and
served as an observation well to monitor temperature buildup during steam injection.
Post-steamflood Well B was cored in 2012 at a lateral distance of 70 ft. from the
previous core. From Barge et al. (2009).
QUANTITATIVE IMAGE ANALYSIS FOR GEOLOGIC CORE DESCRIPTIONJ S R 463

FIG. 4.—Temperature-observation well (Well A) exhibiting reservoir heating due to steam injection through time, and the stratigraphic intervals of offset injector and
production wells. From Barge (2010) unpublished report.
R.J. BARNABY464 J S R

scale geological heterogeneity using high-resolution CT plug scans, micro-
permeameter analysis, and detailed petrography.
Example 2: Cretaceous Toca Dolostones: Offshore Angola
Vuggy pore systems can create permeabilities that are orders of
magnitude greater than matrix porosity (Lucia 1999), and control reservoir
performance. Vuggy reservoirs are challenging to accurately describe using
wireline logs, core plugs, and hand-drawn geologic core descriptions.
While the neutron porosity (NPHI) and density (RHOB) logs quantify the
total volume of porosity, these logs cannot distinguish between matrix and
vuggy porosity. Core plugs tend to underestimate vuggy porosity due to
sampling bias, because of the difficulty in cutting intact plug samples from
vuggy rocks. Traditional hand-drawn geologic core descriptions must rely
on qualitative terms (e.g., rare, common, abundant) to describe the amount
of vuggy porosity.
An example from the Toca Formation, in the Congo Basin of offshore
Angola, serves to illustrate the application of image analysis in
characterizing vuggy pore systems. An overview of Toca geology is
provided by Harris (2000). Toca reservoirs consist of vuggy dolomitized
skeletal grainstones and packstones. Abundant vugs, up to 10 cm or more
in diameter, are evident in CT scans, core photographs, thin sections, and
borehole images (Figs. 18–20).
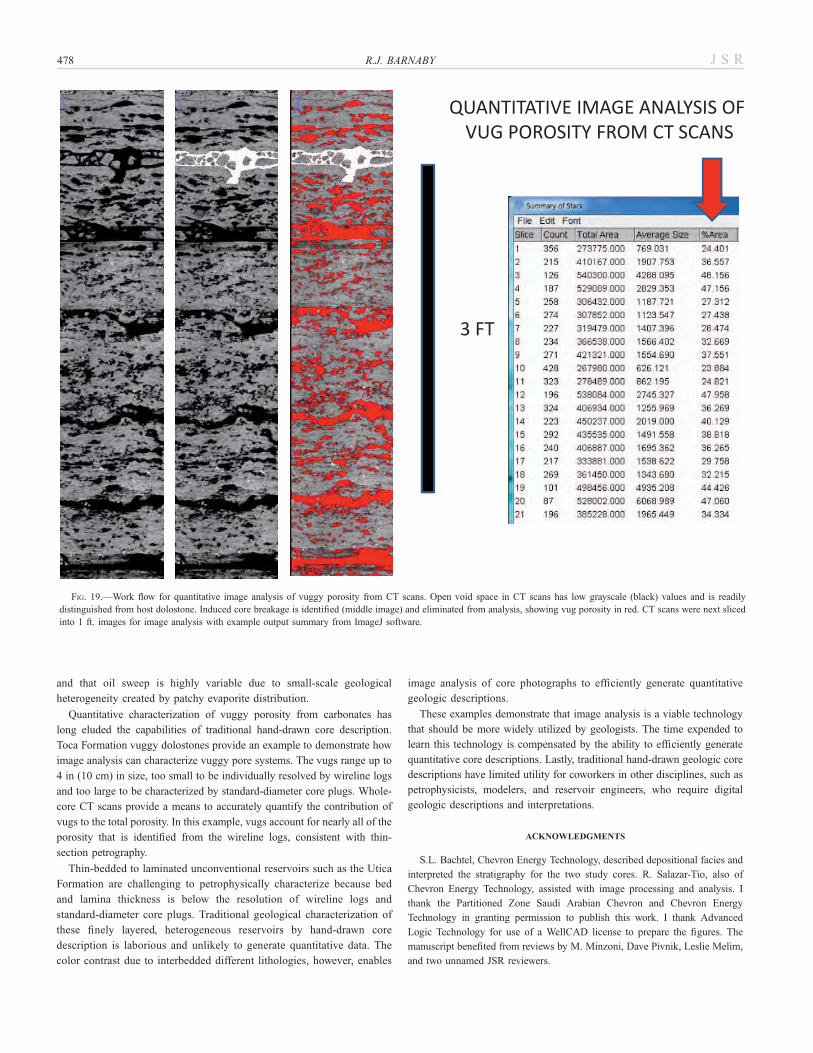
This study used CT scans to quantify the vuggy porosity (Fig. 19). Core
photographs and thin-section scans could also be used to quantify vugs.
These methods, however, investigate a smaller volume of rock than the
FIG. 5.—Correlative cored intervals from pre-
and post-steamflood wells. Post-steamflood core
exhibits less oil stain than pre-steamflood core due
to steam-induced oil sweep. Note that the
evaporite nodules in the pre-steamflood core have
a different appearance compared with the post-
steamflood core. In the pre-steamflood core, white
anhydrite evaporite nodules have an outer rind of
medium gray gypsum, whereas gypsum is absent
in post-steamflood evaporite nodules, which
exhibit a tan oil stain.
QUANTITATIVE IMAGE ANALYSIS FOR GEOLOGIC CORE DESCRIPTIONJ S R 465

full-diameter core CT scans. The CT scans were examined to eliminate
coring-induced breakage and fractures from the analysis. Using ImageJ
software, the area of the vugs was calculated (Fig. 19). The computed vug,
presented as a log curve (Fig. 20), is consistent with the log-derived total
porosity (PHIT), indicating that the porosity in this interval is dominated
by vugs rather than by matrix porosity. Core-plug porosity measurements
generally underestimate vuggy porosity (Fig. 20) due to sampling bias,
because it is impossible to acquire intact core plugs from intervals with
large vugs. Quantitative image analysis thus provides the best technique to
accurately characterize vuggy pore systems from core.
Example 3: Thin-Bedded Unconventional Reservoir: Utica Formation,
USA
Laminated to thin-bedded mudrocks pose a challenge to petrophysical
log analysis because bed thickness is below the resolution of most wireline
logs. Moreover, it is difficult to obtain representative standard-diameter
core-plug samples from thin beds and laminae. Detailed characterization of
the intercalated lithologic units using traditional hand-drawn core
description techniques is labor-intensive and prone to error. Small errors
in the measured depth will place the beds and bed boundaries at the
incorrect depth. Moreover, it is challenging to consistently describe every
thin bed and lamina, especially in a long core that requires days of effort to
describe.
Because of the color contrast in alternating thin beds and laminae in
most mudrock successions, image analysis is an excellent application to
characterize these reservoirs. An example from the Utica Formation, in
Ohio, USA, exhibits the fine-scale layered heterogeneity typical of these
interbedded light gray skeletal limestones and dark gray, organic-rich
mudrocks (Fig. 21). A general background to the geology of the Utica
Formation is available from King (2017).
For this study, the WellCAD image module was used to extract a log
curve of median grayscale values sampled at 0.01 ft. (3 mm) intervals. The
computed grayscale curve (Fig. 21) is similar to a grain-size profile drawn
by a geologist during traditional, hand-drawn core description. The
grayscale curve represents interbedded units of clean limestone and
mudrock. The computer-generated profile is more precise than a hand-
drawn description and eliminates hours (or days) of meticulous observation
and description. The initial computer-generated curve can be manually
edited as required during the core viewing.
FIG. 6.—CT core scan (3608 full-diameter outer
circumference) on left. High-density evaporite
nodules cores appear as white. Segmented image
on right was created by assigning a label to each
pixel based on grayscale value, pixels with
grayscale values between 180 and 255 identified
as evaporite (anhydrite and gypsum) depicted in
black on right image. Total area of evaporites in
this 1-ft.-long core calculated at 57% using
ImageJ software.
R.J. BARNABY466 J S R

QUANTITATIVE CORE DESCRIPTION: ANALYSIS OF CORE DATA QUALITY
An important advantage of quantitative core description is that it
facilitates a review of the core data quality. Errors in core datasets are quite
common. For example, core depths can be mislabeled, lengths of core may
be flipped or misplaced, cores are sometimes dropped and pieced back
together by inexperienced staff, and sample points can be incorrectly
recorded. Sometimes errors are created before the full-diameter cores are
CT scanned, sampled, analyzed, and photographed. Errors also are
introduced when cores are slabbed, boxed, labelled, and photographed.
Core mishandling by geoscientists, unfortunately, is another source of error
for subsequent core descriptions.
With traditional hand-drawn core descriptions, errors in the core
database may be difficult to recognize. Often, geologists describe core
straight from the core boxes, implicitly assuming that the core was properly
handled and the core boxes were correctly labeled. Because hand-drawn
core descriptions tend to be qualitative and core-log integration is
imprecise, errors in the core database may not be identified during the
core description. I have seen many core descriptions that failed to
recognize that pieces or sections of the core were out of place or that
sample analyses were reported at the wrong depths.
Quantitative core description requires precise depth matching of log and
core datasets. By depth-shifted core images and core data to match the
wireline logs and borehole images, errors and mismatches become evident.
Using this workflow, I have identified errors in approximately half of the
cores that I have examined. Fortunately, such errors can be readily
identified and rectified. Two examples serve to illustrate problems common
in core datasets.
The first example is the post-steamflood core, Well B, from Wafra Field.
When core images from the CT scans and slabbed photographs were
depth-shifted to match the logs, log analysis, and borehole images, it
became evident that the core-log data could not be reconciled at the depth
interval of 1073–1079 ft. (Fig. 22). Examination of the core slabs and butts
indicates that two core pieces, 1073–1075.6 ft. and 1076–1078.6 ft., were
accidentally switched and mislabeled, with the additional complication that
a 0.4 ft. pieces at the bottom of each length were correctly labeled (Fig.
23). This error occurred prior to CT scanning, core gamma-ray analysis,
and plug sampling of the full-diameter core. The error persisted after the
FIG. 7.—Comparison of total evaporite derived
from CT scan image versus multimin-derived
petrophysical analysis. The results from image
analysis are consistent with petrophysical-based
interpretation.
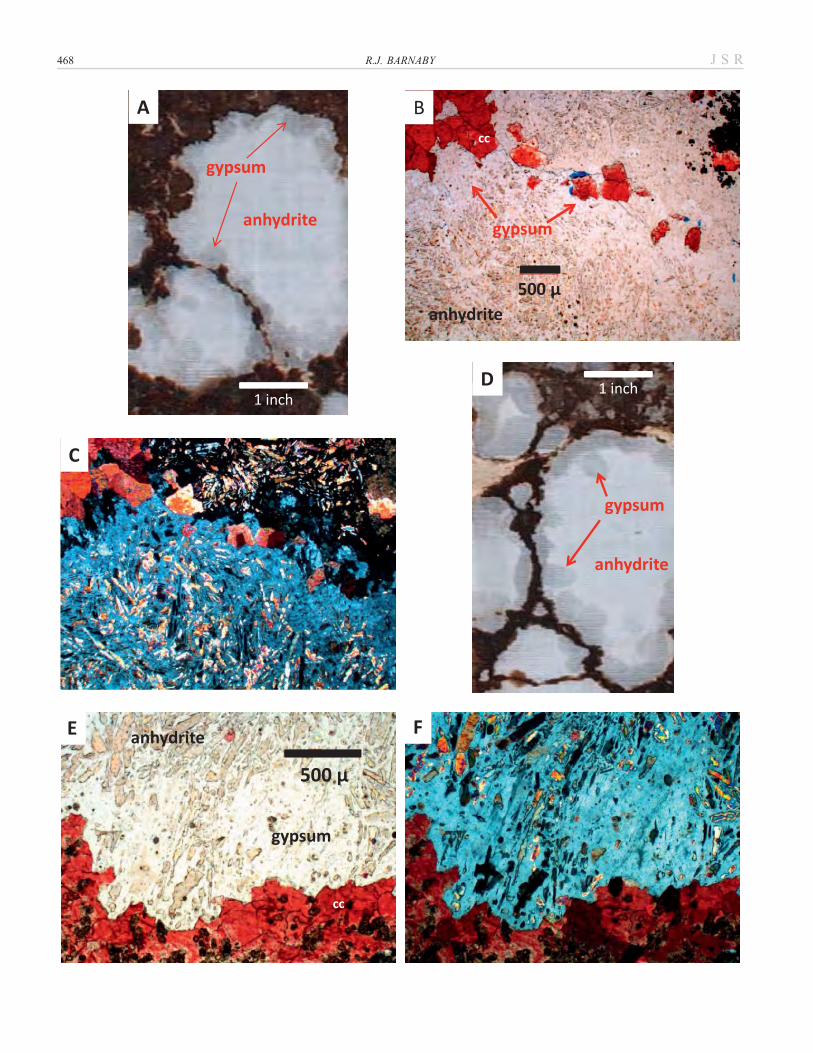
!FIG. 8.—Petrography of evaporite nodule from pre-steamflood Well A. A) Core photograph; evaporite nodule consists of white anhydrite, with outer rim of medium gray
gypsum. B, C) Paired plane-polarized-light and cross-polarized light photomicrographs. Center of evaporite nodule dominated by randomly oriented laths of anhydrite (high
relief and high birefringence), outer margin of nodule dominated by blocky crystals of gypsum (low order gray birefringence) with scattered anhydrite inclusions. There is no
evidence of gypsum or anhydrite dissolution. Note local coarse crystals of calcite (cc) stained pink by alizarin Red S along outer periphery of nodule. This calcite was
interpreted by Saller et al. (2014) to represent biogenic SO4 reduction associated with oil degradation prior to reservoir development. D) Core photograph; evaporite nodule
core consists of white anhydrite, with medium gray outer rim composed of gypsum. E, F) Paired plane-polarized-light and cross-polarized light photomicrographs. Outer
margin of evaporite nodule consists of gypsum with scattered inclusions of anhydrite, grading into anhydrite-dominated center of nodule. There is no evidence of gypsum or
anhydrite dissolution. Calcite (cc) is stained pink by alizarin Red S along outer periphery of nodule.
QUANTITATIVE IMAGE ANALYSIS FOR GEOLOGIC CORE DESCRIPTIONJ S R 467
R.J. BARNABY468 J S R

FIG. 9.—Petrography of evaporite nodule from post-steamflood Well B above steamflooded zone. A) Core photograph; evaporite nodule cores consist of white anhydrite,
with outer rim composed of medium-gray gypsum. B) Cross-polarized light photomicrograph. Center of evaporite nodule is dominated by randomly oriented laths of
anhydrite, outer margin is dominated by blade-like crystals of gypsum with scattered anhydrite inclusions. There is no evidence of gypsum or anhydrite dissolution. C) Core
photograph; evaporite-nodule core consists of white anhydrite, with outer rim of medium-gray gypsum. Light tan material is styrofoam used to stabilize broken core pieces. D)
Cross-polarized light photomicrograph. Center of evaporite nodule is dominated by randomly oriented laths of anhydrite. Outer margin of nodule, adjacent to host rock, is
dominated by blocky crystals of gypsum with scattered anhydrite inclusions. There is no evidence of gypsum or anhydrite dissolution.
!FIG. 10.—Petrography of evaporite nodule from Well B steamflooded interval. A) Core photograph; chalky white outer rind corresponds to leached gypsum with residual
anhydrite. Anhydrite-nodule cores exhibit light tan oil stain. B, C) Plane-polarized-light photomicrographs. Outer periphery consists of residual anhydrite laths; matrix
gypsum was completely dissolved, creating porosity (filled with blue-dyed epoxy), whereas the anhydrite-rich evaporite nodule core remains unaltered. D) Core photograph;
chalky white outer rim corresponds to leached gypsum with residual anhydrite. Thin rim of remnant gypsum indicates that gypsum dissolution began along the outer
periphery of evaporite nodules, moving towards the nodule center through time. E, F) Paired plane-polarized-light and cross-polarized light photomicrographs. Magnified
view of Part D showing thin rim of remnant gypsum (low-order gray birefringence), dividing unaltered anhydrite (high relief and high birefringence) in upper portion of
photograph from leached gypsum filled by blue-dyed epoxy in lower photograph.
QUANTITATIVE IMAGE ANALYSIS FOR GEOLOGIC CORE DESCRIPTIONJ S R 469

R.J. BARNABY470 J S R

core was slabbed and photographed. Consequently, the entire core dataset
over this 6 ft. interval—CT scans, core photographs, core gamma ray, and
core plug analyses—had incorrect reported depths. These errors were not
detected by geologists who previously described this core. By rearranging
the core pieces to the correct positions (Fig. 23) and editing the image and
core analysis data to the proper depths, we can see that there now is an
excellent match between the core and log data (Fig. 24).
The second example of errors in a core dataset is from the Utica
Formation. As described above, the grayscale curve computed from the
core photographs (Fig. 21) represents interbedded units of light gray
limestone and dark gray mudrock. Because clean limestones have low
gamma-ray values and dark mudrocks have high gamma-ray values, the
grayscale curve should be comparable to the core gamma-ray log.
The core gamma data, as reported, are shown as the red log curve (Fig.
25). This curve appears to be out of phase with the core image—dark gray
mudrocks that have high gamma-ray signatures appear to correspond to
lower values in the core gamma-ray log and limestones that have low
gamma-ray signatures appear to correspond to higher values in the core
gamma-ray. This apparent mismatch between the core photos and core
gamma arises from core gamma-ray acquisition procedures. The
scintillometer tool begins measurement of gamma-ray emissions at the
bottom of the core and records data as the tool is slowly moved upward
relative to the core. A 1 ft. (0.3 m) moving average is typically reported—
beginning after the first 1 foot (0.3 m) of data are recorded. For example, if
the bottom of the core is 10,000 ft. (3048 m), the first reported value will
be at 9,999 ft. (3047.7 m) and it will represent the average value of the
interval between 9,999 and 10,000 ft. (3.047.7–3048.0 m).
By shifting the core gamma-ray curve downward by 1 ft. (0.3 m), there
is a better match between the core photos and the gamma data, as shown by
the green log curve (Fig. 25). Although this depth shift improves the
overall depth match, it still will not be perfect because of the core gamma-
ray averaging techniques. In thin-bedded reservoirs, the most accurate
technique to depth match core to log data is to tie the core images (CT
scans, photographs) to borehole images.
This mismatch between core depth and the core gamma-ray log, as
reported, is generally not recognized during the process of traditional hand-
drawn core description and petrophysical analysis. Traditionally, the core
gamma-ray log provides the standard for depth shifting core data to match
wireline logs. However, as this example shows, this practice will result in a
mismatch between the core and log data. Core plug data will be offset from
the wireline logs by 1 ft., a significant error in these laminated to thin-
bedded mudrock reservoirs.
FIG. 11.—Image analysis of core photographs to calculate volume of evaporite minerals. A) Core photograph, each slice is 1 ft. B) Segmented image; black represents
anhydrite, blue is gypsum, brown is background dolomite. C) Calculated anhydrite volume for each 1 ft. slice. D) Calculated gypsum volume for each 1 ft. slice.
QUANTITATIVE IMAGE ANALYSIS FOR GEOLOGIC CORE DESCRIPTIONJ S R 471

FIG. 12.—Comparison of visual mineralogy volumes derived from image analysis with computed mineral volumes from petrophysical multimin analysis. The two different
techniques yield consistent results, although image analysis provides higher-resolution information of geologic heterogeneity.
R.J. BARNABY472 J S R
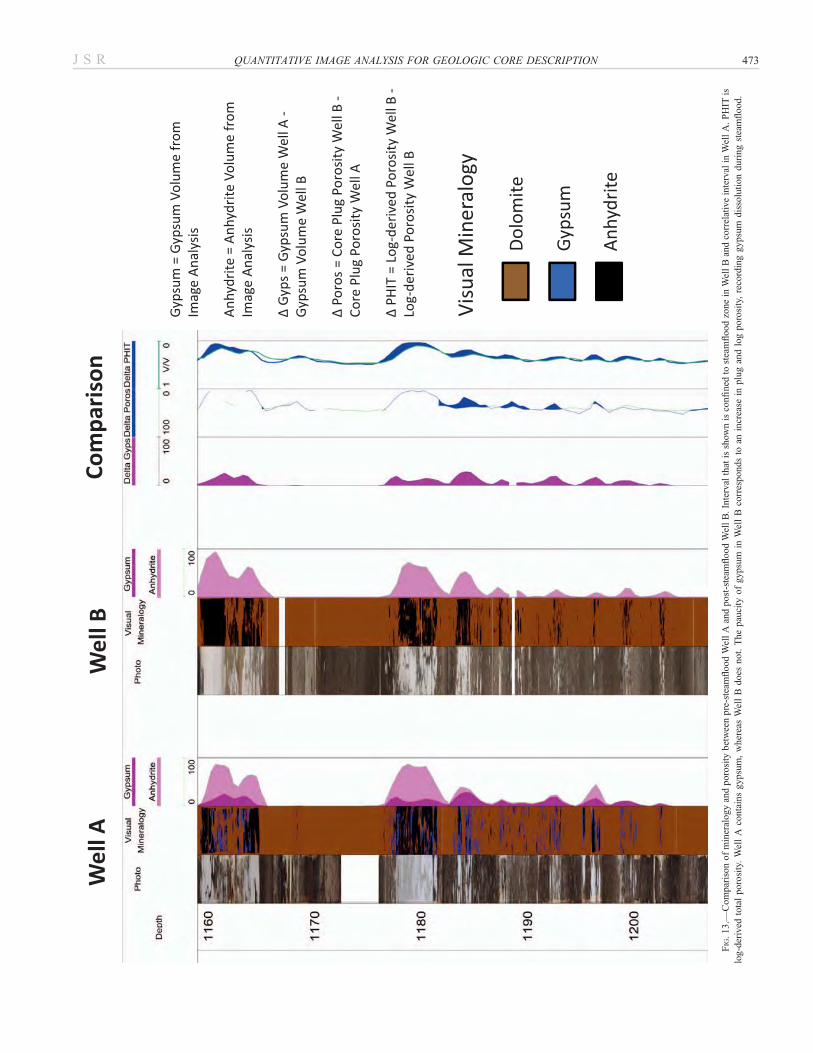
FIG.13.—
Comparisonofmineralogyandporosity
betweenpre-steam
floodWellAandpost-steam
floodWellB.Intervalthatisshownisconfined
tosteamfloodzonein
WellBandcorrelativeintervalin
WellA.PHIT
is
log-derived
totalporosity.WellA
containsgypsum,whereasWellB
does
not.Thepaucity
ofgypsum
inWellBcorrespondsto
anincrease
inplugandlogporosity,recordinggypsum
dissolutionduringsteamflood.
QUANTITATIVE IMAGE ANALYSIS FOR GEOLOGIC CORE DESCRIPTIONJ S R 473

SUMMARY AND CONCLUSIONS
Quantitative geological descriptions can be readily derived from
routine core images using free, open-source software (ImageJ) and
widely used commercial software (WellCAD). This technology enables
geologists to generate digital core descriptions that are fully integrated
with wireline logs, images from borehole and core, and core analyses.
Image analysis efficiently captures fine-scale geologic heterogeneity that
is difficult to resolve using standard log and core-plug data and traditional
hand-drawn core descriptions. Image analysis and petrophysical integra-
tion is performed using a computer to generate a preliminary description
prior to the actual core viewing. This optimizes the time expended
describing core at offsite core-viewing facilities, which may require travel
to remote locations with limited time available. Lastly, quantitative core
description facilitates the critical evaluation of core-based data for
possible errors.
This paper describes three examples of image-analysis-generated core
descriptions from carbonate rocks. Whole-core CT scans and slab core
photographs from dolostones in the First Eocene Formation in Wafra
Field provide quantitative data on the impact of steamflood to the
mineralogy, porosity, and oil saturation of the reservoir. Image analysis
documents that steamflooding caused gypsum dissolution, consistent
with log and core data that indicate a paucity of gypsum in the
steamflooded interval, accompanied by a corresponding increase in
porosity. Image analysis records an average of 66% reduction in oil stain
in the steamflood intervals, consistent with log and core saturation
analyses. Moreover, image analysis allows a high-resolution understand-
ing of steamflood-induced changes to the reservoir—beyond the
resolution of log and core-plug data. Image analysis demonstrates that
gypsum dissolution is confined to the margins of the evaporite nodules
FIG. 14.—Histogram comparison of log-de-
rived porosity between Well A and Well B in
steamflood zone. Post-steamflood porosity does
not exhibit as many low values as the pre-
steamflood values, the porosity values exhibit a
more narrow range, and the average and median
values are greater.
FIG. 15.—Cross plot of log-derived porosity between Well A and Well B confined
to steamflood zone and correlative interval. For intervals with minor gypsum
(, 7.5%), the porosity values are similar. Conversely, for intervals with abundant
gypsum (. 7.5%), the post-steamflood Well B exhibits greater porosity. Steamflood
thus causes an increase in porosity in the initially tighter, gypsum-rich lithologies,
whereas the more porous, dolomitic lithologies are unaltered.
R.J. BARNABY474 J S R

FIG.16.—
Core
photographsandsegmentedim
ages
ofvisualoilstain.Eachpixelisassigned
avalue(oil-stained
ornotoil-stained),based
onhue,saturation,andbrightnessthresholdsusingIm
ageJ
software.Eachcore
piece
is1ft.in
length.Plugoil-saturation(S
o)values
arecompared
withim
ageanalysisofoil-stain
volume.In
ahighly
heterogeneousreservoir,core
plugsdonotadequatelyrepresentthelarger-scalereservoirproperties,
whereasim
ages
providealarger
sample
size
that
bettermatches
wirelinelogdata.
Moreover,im
ageanalysisprovides
higher-resolutiondataofthedistributionofoilstain.
QUANTITATIVE IMAGE ANALYSIS FOR GEOLOGIC CORE DESCRIPTIONJ S R 475

FIG. 17.—Comparison of Well A (pre-steamflood) and Well B (post-steamflood) cores for visual oil-stain, plug saturation, and log-derived saturation. From left to right 1)
Well A core photograph, image segmented according to visual oil-stain; visual oil-stain volume (0–100%, increasing to right), and plug oil saturation (So) and water saturation
(Sw). 2) Well B core photograph, image segmented according to visual oil-stain; visual oil-stain volume, and plug So and Sw. Comparison: D (Well Avalues – Well B values)
between these two wells with respect to visual oil-stain, plug So, and log-derived oil saturation. Steamflooded zone in Well B exhibits less oil stain than correlative interval in
Well A, suggesting an average of 66% oil recovery, consistent with core and log data indicating 76% and 57% recovery, respectively.
R.J. BARNABY476 J S R
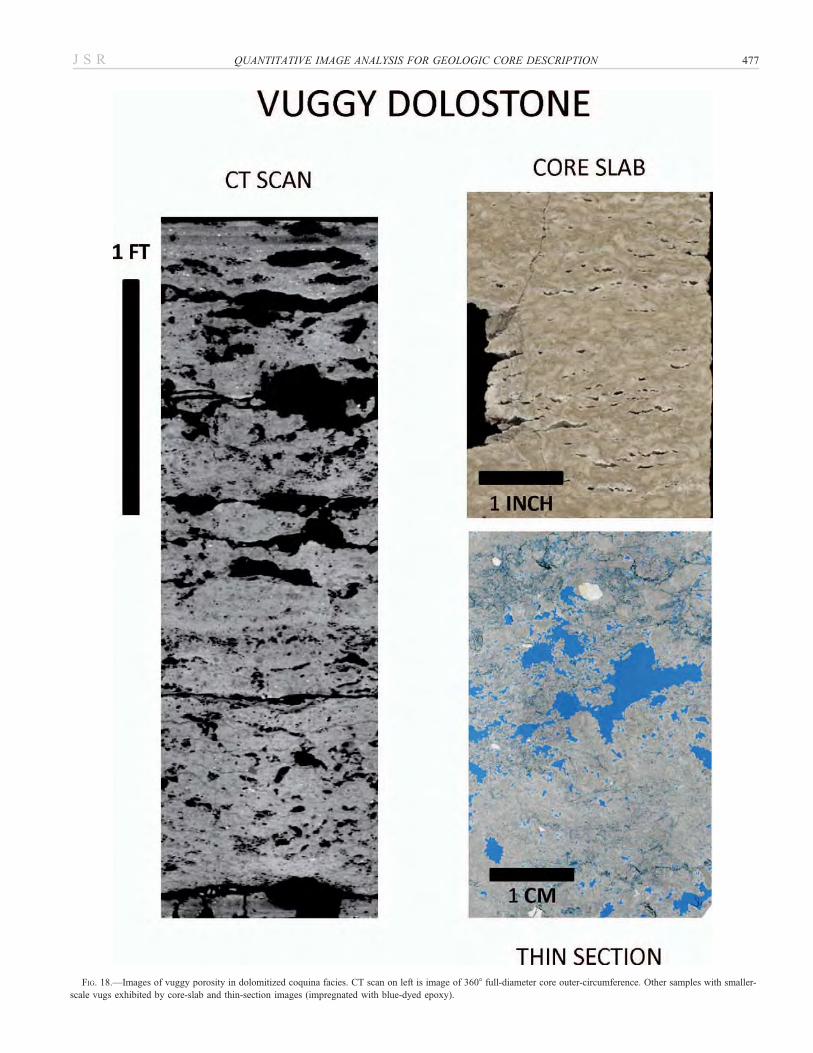
FIG. 18.—Images of vuggy porosity in dolomitized coquina facies. CT scan on left is image of 3608 full-diameter core outer-circumference. Other samples with smaller-
scale vugs exhibited by core-slab and thin-section images (impregnated with blue-dyed epoxy).
QUANTITATIVE IMAGE ANALYSIS FOR GEOLOGIC CORE DESCRIPTIONJ S R 477
and that oil sweep is highly variable due to small-scale geological
heterogeneity created by patchy evaporite distribution.
Quantitative characterization of vuggy porosity from carbonates has
long eluded the capabilities of traditional hand-drawn core description.
Toca Formation vuggy dolostones provide an example to demonstrate how
image analysis can characterize vuggy pore systems. The vugs range up to
4 in (10 cm) in size, too small to be individually resolved by wireline logs
and too large to be characterized by standard-diameter core plugs. Whole-
core CT scans provide a means to accurately quantify the contribution of
vugs to the total porosity. In this example, vugs account for nearly all of the
porosity that is identified from the wireline logs, consistent with thin-
section petrography.
Thin-bedded to laminated unconventional reservoirs such as the Utica
Formation are challenging to petrophysically characterize because bed
and lamina thickness is below the resolution of wireline logs and
standard-diameter core plugs. Traditional geological characterization of
these finely layered, heterogeneous reservoirs by hand-drawn core
description is laborious and unlikely to generate quantitative data. The
color contrast due to interbedded different lithologies, however, enables
image analysis of core photographs to efficiently generate quantitative
geologic descriptions.
These examples demonstrate that image analysis is a viable technology
that should be more widely utilized by geologists. The time expended to
learn this technology is compensated by the ability to efficiently generate
quantitative core descriptions. Lastly, traditional hand-drawn geologic core
descriptions have limited utility for coworkers in other disciplines, such as
petrophysicists, modelers, and reservoir engineers, who require digital
geologic descriptions and interpretations.
ACKNOWLEDGMENTS
S.L. Bachtel, Chevron Energy Technology, described depositional facies and
interpreted the stratigraphy for the two study cores. R. Salazar-Tio, also of
Chevron Energy Technology, assisted with image processing and analysis. I
thank the Partitioned Zone Saudi Arabian Chevron and Chevron Energy
Technology in granting permission to publish this work. I thank Advanced
Logic Technology for use of a WellCAD license to prepare the figures. The
manuscript benefited from reviews by M. Minzoni, Dave Pivnik, Leslie Melim,
and two unnamed JSR reviewers.
FIG. 19.—Work flow for quantitative image analysis of vuggy porosity from CT scans. Open void space in CT scans has low grayscale (black) values and is readily
distinguished from host dolostone. Induced core breakage is identified (middle image) and eliminated from analysis, showing vug porosity in red. CT scans were next sliced
into 1 ft. images for image analysis with example output summary from ImageJ software.
R.J. BARNABY478 J S R

FIG. 20.—PHIT (total log-derived porosity) compared with image analysis of vuggy porosity (red) indicates that vugs account for nearly all of the porosity in this interval of
dolomitized coquina grainstones and packstones, consistent with thin-section petrography.
QUANTITATIVE IMAGE ANALYSIS FOR GEOLOGIC CORE DESCRIPTIONJ S R 479

FIG. 21.—Utica Formation composed of light
gray skeletal limestone interbedded with dark gray
mudrock. Grayscale profile, computed using
WellCAD software based on core photographs,
generates a lithologic profile similar to geological
hand-drawn core descriptions. This profile can be
further edited during the core viewing.
R.J. BARNABY480 J S R

FIG.22.—
Depth-shiftedCTscan
andcore
photographdonotmatch
borehole
imageorpetrophysicalanalysisat
recorded
depths1073–1079ft.(327–329m),indicatingthat
thereareproblemsin
thecore
dataset.
QUANTITATIVE IMAGE ANALYSIS FOR GEOLOGIC CORE DESCRIPTIONJ S R 481

FIG.23.—
Core
boxphotographsshowsthattwopiecesofcoreweretransposedandmislabeled.Thiserrororiginated
soonafterthecorewas
acquired,either
atthewellsiteorwhen
thefull-diameter
corewas
cutinto
3ft.
lengths,boxed,andlabeled.Thiserrorcompromises
theentire
core
dataset—full-diameter
CTscans,core
gam
ma-ray,
core-plugsamples,core
photographs,andpreviousgeologic
core
descriptions.
R.J. BARNABY482 J S R

FIG.24.—
After
correctingandeditingcore
images,therenow
isan
excellentmatch
betweendepth-shiftedCTscan
andcore
photographwithborehole
imageandpetrophysicalanalysis.
QUANTITATIVE IMAGE ANALYSIS FOR GEOLOGIC CORE DESCRIPTIONJ S R 483

FIG. 25.—Utica Formation computed grayscale profile (from Fig. 21). Because light gray limestones have lower core gamma-ray values than dark gray mudrocks, the
grayscale profile should correspond to the core gamma-ray log. The gamma-ray log, as reported (red curve) displays lower values for mudrocks, for example at 6221, 6224,
and 6226 ft. and higher values for limestones, for example at 6219, 6223, and 6225 ft. This depth mismatch is due to core gamma-acquisition statistics (see text). Shifting the
core gamma downward by 1 ft. (green curve) exhibits a better match between image and core gamma data.
R.J. BARNABY484 J S R

REFERENCES
BARGE, D., AL-YAMI, F., UPHOLD, D., ZAHEDI, A., AND DEEMER, A., 2009, Steamflood
piloting the Wafra Field Eocene reservoir in the Partitioned Neutral Zone, between Saudi
Arabia and Kuwait, Society of Professional Engineers, Paper 120205, 21 p.
CHAMPENOY, N., ROWAN, D., GONZALEZ, G., AZIZ, S., BLACKWOOD, S., AND MEDDAUGH, W.S.,
2011, Understanding the historical assessment of reservoir performance (HARP) of the
First Eocene reservoir for future steam flooding, PZ, Saudi Arabia and Kuwait: Society
of Professional Engineers, Paper 150578, 19 p.
HARRIS, N.B., 2000, Toca carbonate, Congo Basin: response to an evolving rift lake, in
Mello, M.R., and Katz, B.J., eds., Petroleum Systems of South Atlantic Margins:
American Association of Petroleum Geologists, Memoir 73, p. 341–360.
HEILBRONNER, R., AND BARRETT, S., 2014, Image Analysis in Earth Sciences: microstruc-
tures and Textures of Earth Materials: Berlin, Springer-Verlag, 520 p.
KING, H., 2017, Utica Shale: the natural gas giant below the Marcellus:
Geology.com, website accessed February 3, 2017, http://geology.com/articles/
utica-shale/.
LUCIA, F.J., 1999, Carbonate Reservoir Characterization, Berlin, Springer-Verlag, 226 p.
MEDDAUGH, W.S., DULL, D., GARBER, R.A., GRIEST, S., AND BARGE, D., 2007, The Wafra
First Eocene Reservoir, Partitioned Neutral Zone (PNZ), Saudi Arabia and Kuwait:
geology, stratigraphy, and static reservoir modeling: Society of Professional Engineers,
Paper 105087, 11 p.
MEDDAUGH, W.S., OSTERLOH, W.T., TOOMEY, N., BACHTEL, S., CHAMPENOY, N., ROWAN, D.,
GONZALEZ, G., AZIZ, S., HOADLEY, S.F., BROWN, J., AL-DHAFEERI, F.M., AND DEEMER, A.R.,
2011a, Impact of reservoir heterogeneity on steamflooding, Wafra First Eocene
Reservoir, Partitioned Zone (PZ), Saudi Arabia and Kuwait: Society of Professional
Engineers, Paper 150606, 19 p.
MEDDAUGH, W.S., OSTERLOH, W.T., GUPTA, I., CHAMPENOY, N., ROWEN, D., TOOMEY, N., AZIZ,
S., HOADLEY, S., BROWN, J., AND AL-YAMI, F., 2011b, The Wafra Field First Eocene
carbonate reservoir steamflood pilots: geology, heterogeneity, steam/rock interaction, and
reservoir response: Society of Professional Engineers, Paper 158324, 29 p.
RUBIN, E., 2011, Full field modeling of Wafra First Eocene reservoir 56-year production
history: Society of Professional Engineers, Paper 150575, 15 p.
SALLER, A.H., POLLITT, D., AND DICKSON, J.A.D., 2014, Diagenesis and porosity
development in the First Eocene reservoir at the giant Wafra Field, Partitioned Zone,
Saudi Arabia and Kuwait: American Association of Petroleum Geologists, Bulletin, v.
98, p. 1185–1212.
Received 10 March 2016; accepted 6 February 2017.
QUANTITATIVE IMAGE ANALYSIS FOR GEOLOGIC CORE DESCRIPTIONJ S R 485