quarterly report - nexus-ag.de quarterl… · new “cross-selling potential” on the market....
TRANSCRIPT

01ST OF JANUARY TO 31ST OF MARCH 2019
Quarterly report

2NEXUS AG / Quarterly Report Q1 2019
Letter to Our Stockholders
Dear Stockholders:
Digitalization in the healthcare sector is currently moving more into the focus of patients, doctors, hospital management and, in partic-ular, politicians in many European countries. This is a development that suggests that Germany and other European core countries want to catch up in this area. Against this background, the outlook in our industry remains very promising.
This is matched by the fact that NEXUS can already present ex-tremely positive results today as was the case in recent years too. In the first quarter of 2019, we were able to significantly increase both sales and earnings, thus continuing our long-term development.
The increase in sales amounted to approx. 11% in the first quar-ter compared with the previous year. Earnings before taxes and in-terest increased by approx. 18% and EBITDA reached around EUR 7.5 million in the first quarter, resulting in an EBITDA margin of 21% (including the amended IFRS effects). Operating cash flow amounted to approx. EUR 26.2 million, and consequent-ly was significantly higher than the level in the previous year. The reason behind this are the special effects of the acquisition of Swisslab DITS GmbH, Berlin. As a result, our cash and cash equiv-alents increased to approx. EUR 51.4 million as of 30 March 2019.
The strong figures are mainly due to our product generation NEXUS/NEXT GENERATION, the ONE/NEXUS initiative and the stable
development in NEXUS Switzerland. We are particularly pleased that the NEXUS/NEXT GENERATION (NG) software is rated very positively on the market, which is clearly reflected in the increasing order intake and sales figures.
We launched a complementary organizational and product initia-tive with “ONE/NEXUS” at the end of 2018. We have continued to orientate our company organization in a market-oriented manner and centralized sales in the respective country organizations. At the same time, we will continue to internationalize our diagnostic prod-ucts and combine some special software modules into new, inte-grated process solutions. As a result, we expect to be able to exploit new “cross-selling potential” on the market. These are important steps that will initiate our next phase of growth.
2008 2009
+28.3 %
2010
+8.6 %
2011
+13.4 %
2012
+18.3 %
2013
+19.8 %
2014
+12.0 %
2015
+22.4 %
2016
+14.7 %
2017
+10.8 %
2018 2019
+10.7 %
+ 10.7 %
Development of Group Sales (3 months) in KEUR2008-2019
32,044 35,465
Highlights Q1 2019 – Company development
+ Strong increases in sales in the 1st quarter
+ Increasing demand for NEXUS/
New Generation solutions
+ Laboratory/Pathology software:
Link results in new orders
+ Important major projects and
internationalization implemented
7,412 9,512 10,328 11,710 13,855 16,604 18,596 22,767 26,113 28,940
+17.5 %

3NEXUS AG / Quarterly Report Q1 2019
Sales in Q1 2019 enabled us to acquire a large number of new and interesting projects both domestically and abroad. This applies in particular to NEXUS/HISng projects in Germany, Switzerland and Poland. The order development in NEXUS/Pathology should also be emphasized. The link with our newly acquired laboratory sys-tem “Swisslab” has already resulted in numerous new orders in the first quarter.
On the project side, we have reached very important milestones in the major orders “Bundeswehr” (German military”, “Deutsche Rentenversicherung” (German pension insurance) and in particular in the Swiss “Hirslanden Kliniken” (Hirslanden Hospitals). We put our first fully integrated medication solution into productive oper-ation in the Netherlands. This is an important step in the further internationalization of our radiological software.
The first quarter only developed slightly in our innovation project “ENDOBASE NEXT”. The reason is that the new Endobase release was planned for April and therefore no new installations were imple-mented with the previous release. With the new release, we already expect new sales in May.
The first quarter was on track in the “Healthcare Service” sec-tor. We already dealt with the organizational challenges in this area last year and see significant progress in terms of customer satisfaction. The profitability of the sector still needs to improve in the coming months, but we have made significant progress compared to last year.
The development of the new subsidiary Swisslab GmbH, Berlin, is very positive. While the restructuring is ongoing as part of the plan-ning, customer responses to NEXUS involvement in this laborato-ry area are unexpectedly positive. The product synergies between Swisslab laboratory products and NEXUS/Pathology and NEXUS/QM products are very attractive for customers. Customers also see great advantages for their Swisslab installations in the area of tech-nical synergies (e. g., for interfaces or development frameworks).
Dear Stockholders, NEXUS is in good shape in a dynamically devel-oping market. Healthy, long-lasting growth, good earnings develop-ment and a consistent product strategy are convincing arguments for our further course. We must not deviate from this if we are to succeed in a changing, competitive environment.
We want to thank you, dear Stockholders, for your trust.
Warm regards,
Dr. Ingo BehrendtChief Executive Officer
2008 2009
+134.3 %
2010
+74.8 %
2011
+34.6 %
2012
+31.6 %
2013
+26.1 %
2014
+11.3 %
2015
+17.3 %
2016
+21.8 %
2017
+13.0 %
2018 2019
+12.5 %
+17.9 %
Development of Group Earnings before Interest and Taxes (3 months) KEUR2008-2019
Letter to Our Stockholders
178 417 729 981 1,291 1,628 1,812 2,126 2,590 2,926 3,293 3,882+25.4 %
Dr. Ingo BehrendtChief Executive Officer
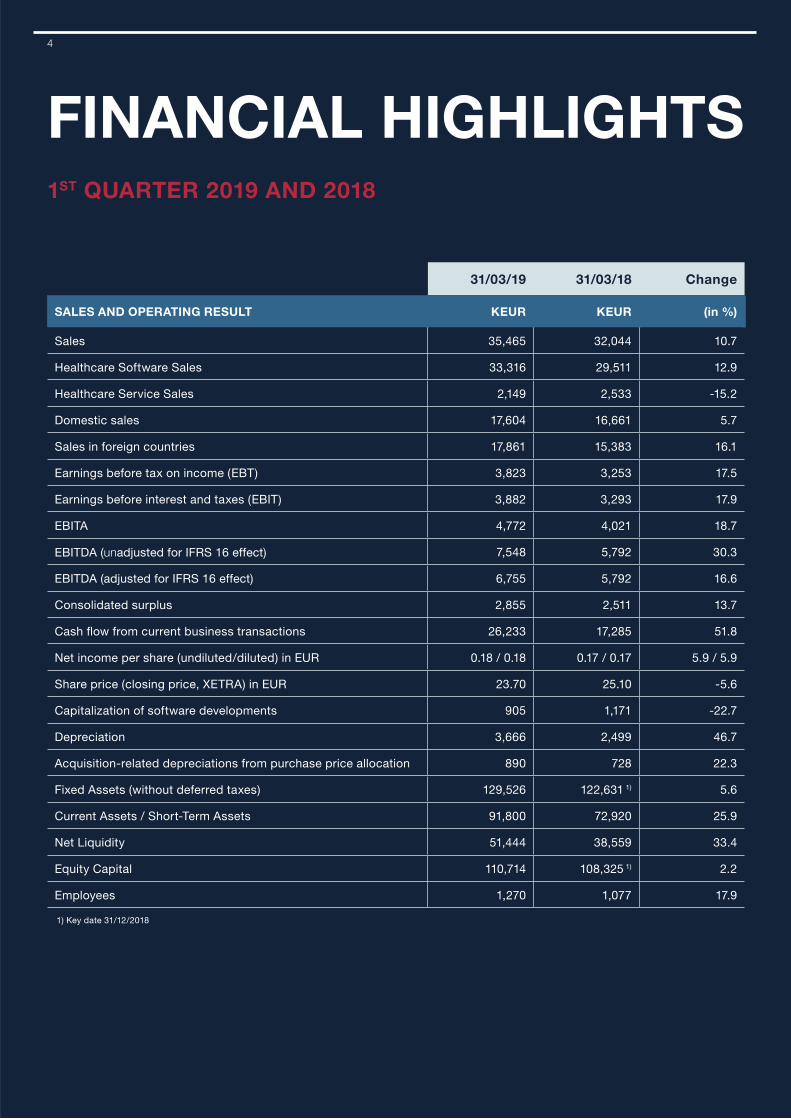
31/03/19 31/03/18 Change
SALES AND OPERATING RESULT KEUR KEUR (in %)
Sales 35,465 32,044 10.7
Healthcare Software Sales 33,316 29,511 12.9
Healthcare Service Sales 2,149 2,533 -15.2
Domestic sales 17,604 16,661 5.7
Sales in foreign countries 17,861 15,383 16.1
Earnings before tax on income (EBT) 3,823 3,253 17.5
Earnings before interest and taxes (EBIT) 3,882 3,293 17.9
EBITA 4,772 4,021 18.7
EBITDA (unadjusted for IFRS 16 effect) 7,548 5,792 30.3
EBITDA (adjusted for IFRS 16 effect) 6,755 5,792 16.6
Consolidated surplus 2,855 2,511 13.7
Cash flow from current business transactions 26,233 17,285 51.8
Net income per share (undiluted/diluted) in EUR 0.18 / 0.18 0.17 / 0.17 5.9 / 5.9
Share price (closing price, XETRA) in EUR 23.70 25.10 -5.6
Capitalization of software developments 905 1,171 -22.7
Depreciation 3,666 2,499 46.7
Acquisition-related depreciations from purchase price allocation 890 728 22.3
Fixed Assets (without deferred taxes) 129,526 122,631 1) 5.6
Current Assets / Short-Term Assets 91,800 72,920 25.9
Net Liquidity 51,444 38,559 33.4
Equity Capital 110,714 108,325 1) 2.2
Employees 1,270 1,077 17.9
FINANCIAL HIGHLIGHTS1ST QUARTER 2019 AND 2018
1) Key date 31/12/2018
4

5NEXUS AG / Quarterly Report Q1 2019
Interim Annual ReportREPORT ABOUT THE PROFIT, FINANCIAL AND ASSET SITUATION
NEXUS Group sales increased from KEUR 32,044 to KEUR 35,465 (+10.7%) in the first three months of the year 2019. The stable, pos-itive sales development of NEXUS Group of recent years could be continued with that. This succeeded despite the refocusing of the Healthcare Service Division. In this segment, sales of KEUR 2,149 were achieved after KEUR 2,533 (3M-2018), i.e., approx. 15.2% less than in the previous year. The reason behind this is that we reorient-ed the division in 2018 and in this context also discontinued projects that are not part of the core business.
On the other hand, sales increased from KEUR 29,511 (3M-2018) to KEUR 33,316 (+12.9%) in the Healthcare Software Division. Approx. 4.5% of this increase in sales is attributable to the consolidation of Swisslab DITS GmbH acquired on 30 November 2018.
We respect to the regional development of sales, we were able to increase sales in Germany by 5.7% to KEUR 17,604 (3M-2018: KEUR 16,661). In international business, we achieved sales of KEUR 17,861 in the first quarter 2019 compared to KEUR 15,383 in the previous year (+16.1%). The main reason for this development is the strong business development in Switzerland.
Consolidated earnings before income taxes and interest (EBIT) de-veloped very positively. They improved by 17.9% to KEUR 3,882 ( 3M-2018: KEUR 3,293). A value of KEUR 4,772 was achieved in EBITA and consequently was 18.7% above the value of previous year (3M-2018: KEUR 4,021). EBITDA reached KEUR 7,548 in the first quarter of 2019 (3M-2018: KEUR 5,792) and consequently was 30.3% higher than in the previous year. EBITDA includes the effects from the initial application of IFRS 16 in the amount of KEUR 793. Without this application, EBITDA would have increased fromKEUR 5,792 to KEUR 6,755 (+16.6%). Non-recurring costs forintegration of the new companies in the first quarter 2019 amountedto approximately TEUR 410.
The cash flow from on-going business transactions also de-velop very well. We achieved a value of KEUR 26,233 (3M-2018: KEUR 17,285) there. The main reason for the strong cash flow in the first quarter is the high deposits from maintenance revenues and the settlement of receivables in connection with the restructuring of Swisslab DITS GmbH.
The consolidated surplus increased by 13.7% and amounted to KEUR 2,855 for the first quarter 2019 following KEUR 2,511 (3M-2018). There is a slight increase in the tax rate there. The un-diluted earnings per share amounted to 18 cents (previous year: 17 cents) (diluted: 18 cents; previous year: 17 cents).
Cash resources including short-term financial assets amounted to KEUR 51,444 on 31 March 2019 (31 March 2018: KEUR 38,559). Investments in tangible and intangible assets were made in the amount of KEUR 948 in the first quarter 2019
(3M-2018: KEUR 2,085). This includes KEUR 905 (3M-2018: KEUR 1,171) for capitalizing software developments.
The balance sheet total increased from KEUR 211,708 to KEUR 224,735 compared to 31 December 2018. Intangible as-sets, goodwill and balanced-out deferred taxes add up to a total of KEUR 106,514 following KEUR 108,712 (31 December 2018). Receivables from customers amount to KEUR 29,896 following KEUR 25,980 on 31 December 2018.
Employees
NEXUS Group employed a total of 1,270 people as of 31 March 2019 (31 March 2018: 1,077 employees).
CASH FLOW FROM CURRENT BUSINESS TRANSACTIONS (3 MONTHS) IN KEUR
+51.8 % compared to previous year
2015
11,870
+17.8 %
2016
13,977
+29.9 %
2017
18,153
-4.8 %
2018 2019
17,285 26,233
EBITDA (3 MONTHS) IN KEUR adjusted for IFRS 16 effect +16.6 % (unadjusted: +30.3 %)
in comparison to the previous year
2015
4,332
+11.7 %
2016
4,839
+11.8 %
2017
5,411
+7.0 %
+16.6 %
2018
5,792 6,755 7,548
+51.8 %
+30,3 %
2019(adjusted)
2019(unadjusted)

6NEXUS AG / Quarterly Report Q1 2019
Interim Annual Report
Effect from the application of IFRS 16
The initial application of IFRS 16 broadens the depiction of leasing relations, which affects the presentation of the Group‘s profit, finan-cial and asset situation.
The effects of IFRS 16 as at 31 March 2019 lead to a corresponding increase in fixed assets of KEUR 8,594 as a result of the right of use to be capitalized and to an increase in lease liabilities of KEUR 8,609 (long-term: KEUR 5,318; short-term: KEUR 3,291). The balance sheet total increases accordingly by these values and consequently by 4.0 percentage points; the equity ratio decreases by 2.0 percentage points as result. The net debt ratio has increased accordingly. The total leasing expenses in the amount of KEUR 793 – instead of other operating expenses – are recognized in the amount of KEUR 763 in depreciation and in the amount of KEUR 30 in interest expense. This results in significant improvement of EBITDA of KEUR 793.
The cash flow statement includes the redemption share of the lease payments in the cash flow from financing activities, while interest payments are included in the cash flow from current activities. This improves the cash flow of current operations by KEUR 447.
01/01-31/03/2019 01/01-31/03/2018 Change
KEUR KEUR %
Germany 17,604 16,661 5.7
Switzerland 10,160 7,821 29.9
Netherlands 3,400 3,310 2.7
France 1,428 1,436 -0.6
Austria 669 745 -10.2
Other countries 2,204 2,071 6.4
TOTAL 35,465 32,044 10.7
01/01-31/03/2019 01/01-31/03/2018 Change
KEUR KEUR %
Healthcare Software 33,316 29,511 12.9
Healthcare Service 2,149 2,533 -15.2
TOTAL 35,465 32,044 10.7
SALES BY REGION
SALES BY DIVISION
Events after the Balance Sheet Date
There were no events requiring reporting after the balance sheet key date.
Annual Stockholders Meeting and Dividends
At the Annual Stockholders Meeting of NEXUS AG in Donaueschingen on 3 May 2019, the Executive Board and Supervisory Board pro-posed to pay a one cent higher dividend of EUR 0.17 to sharehold-ers than the previous year from the net earnings of fiscal year 2018.
Finance Highlights Q1 2019
+ 10.7% sales increase in first quarter 2019 from
KEUR 32,044 (3M-2018) to KEUR 35,465
+ 17.9% increase in the Group result for earnings
before interest and taxes (EBIT) from KEUR 3,293
(3M-2018) to KEUR 3,882
+ Continued very strong operational cash flow in the
first quarter of KEUR 26,233
+ High net liquidity of KEUR 51,444

NEXUS AG TecDAX
04/14 12/14 06/15 06/16 06/17 06/1812/15 12/16 12/17 03/19
150 %
100 %
50 %
125 %
75 %
25 %
0 %
7
CAPITAL MARKET, EVENT AND FINANCE DATA
Active communication with our stockholders, potential investors, analysts and the finance market are the focal point of our investor relation activities. We continually inform all market participants promptly and comprehensively via press releases and ad hoc announcements as well as the mandatory quarterly, semi-annual and annual financial reports.
In addition, we cultivate intensive dialog with institutional investors and finance analysts via one-on-one meetings and on roadshows. Our Investor Relations team is of course at your disposal as contact persons.
Frankfurt Stock Exchange stock prices (5-year period)
03 May 2018Quarterly Report Q1 / 2018
13 August 2019Semi-Annual Report 2019
05 November 2019Quarterly Report Q3 / 2019
25 – 27 November 2019Analyst Event, Frankfurt
INVESTOR RELATIONS
21 May – 23 May 2019Paris Healthcare Week / HIT, Paris
24 May – 25 May 2019HISTOLOGICA, Oberhausen
29 May – 01 June 2019German X-ray Congress, Leipzig
13 June – 15 June 2019Meeting German Society for Pathology, Frankfurt
13 June – 14 June 2019OGSV-Kongress, Hafernsee
15 June 2019Rhein-Ruhr-Symposium, Bochum
Stock Market Highlights
(XETRA closing prices)
+ Initial listing on
02 January 2019: 24.20 b
+ Highest price on
06 January 2019: 26.80 b
+ Stock market capitalization on
29 March 2019: 373.3 million b

8NEXUS AG / Quarterly Report Q1 2019
Company Information and Outlook
Supervisory BoardNumbers of
stock ownedNumbers
of options
Dr. jur. Hans-Joachim König69,900
Previous year (69.900)
0Previous year (0)
Prof. Dr. Alexander Pocsay121,500
Previous year (121,500)
0Previous year (0)
Prof. Dr. Ulrich Krystek 0Previous year (0)
0Previous year (0)
Wolfgang Dörflinger 0Previous year (0)
0Previous year (0)
Gerald Glasauer 0Previous year (0)
0Previous year (0)
Prof. Dr. med Felicia M. Rosenthal
520Previous year
(520)
0Previous year (0)
Executive BoardNumbers of
stock ownedNumbers
of options
Dr. Ingo Behrendt99,900
Previous year (111,900)
0Previous year (0)
Ralf Heilig127,650
Previous year (127,650)
0Previous year (0)
Edgar Kuner240,351
Previous year (240,351)
0Previous year (0)
Chances and Risks Report
Please refer to the explanations in the Annual Report of 31 December 2018 for information about the essential chances and risks in the development of NEXUS Group. There have been no es-sential changes in the meantime.
Directors’ Holdings
The director’s holders of the Supervisory Board and the Executive Board are as follows on 31 March 2019 in comparison to the pre-vious year: cf. Table.
Outlook: Take Advantage of Momentum
We were also able to start in an extremely positive way in 2019. A sales increase of approx. 11% and an increase in earnings before interest and taxes (EBIT) of approx. 18% as well as a high operating cash flow of approx. u 26.2 million represent a great start into the current year. We were able to continue the positive development of the past years unabated. With the ONE/NEXUS project, we are in the process of creating the organizational and sales prerequisites for the coming years.
However, we must not be content with looking inward. Our cus-tomers and competitors are currently developing digitalization and product strategies for the coming years. Previous technology and application decisions are being challenged in this process and mar-ket strategies fundamentally reconsidered. This exciting phase pro-vides us with numerous opportunities, for which we must prepare ourselves very carefully and take advantage of opportunities.
We have a right to be optimistic. Thanks to our highly differentiated and innovative product portfolio and a good European presence, we have a very attractive position on the market. NEXUS can also draw on considerable potential in changing market situations. However, we have to prove this anew every day. We can only continue our previous path of success if we constantly increase growth and performance.
The NEXUS team is looking forward to these challenges.
Accounting and Valuation Methods
This interim report of the NEXUS Group of 31 March 2019 has been prepared in keeping with the International Financial Reporting Standards (IFRS) as they are applied in the EU. The interpretations of the International Financial Reporting Interpretation Committee (IFRIC) have been taken into account.
The regulations of IAS 34 were observed in the interim report of 31 March 2019. This refers to a summarized report, which does not contain all information of an IFRS Group Financial Statement, and consequently this report should be read in connection with the Notes to the Group Financial Statement 2018. The same accounting and valuation methods were used in the Group Financial Statement for the business year 2018. The report has not been audited.


01/01-31/03/2019 01/01-31/03/2018
KEUR KEUR
Revenue 35,465 32,044
Development work capitalized 905 1,171
Other operating income 2,413 661
Cost of materials including purchased services 5,225 5,824
Personnel costs 22,243 18,609
Depreciation 3,666 2,499
Other operating expenses 3,767 3,651
OPERATING RESULT 3,882 3,293
Finance Income 25 35
Finance Expenses 84 75
RESULT BEFORE TAX ON PROFIT 3,823 3,253
Taxes on profit 968 742
CONSOLIDATED SURPLUS 2,855 2,511
Of the consolidated surplus, accounted to:
- Stockholders of NEXUS AG 2,810 2,601
- Shares of non-controlling partners 45 -90
CONSOLIDATED NET EARNINGS PER SHARE IN EUR
Weighted average (undiluted/diluted) of issued shares in circulation (in thousands) 15,715 / 15,715 15,724 / 15,724
Undiluted / diluted 0.18 / 0.18 0.17 / 0.17
GROUP PROFIT AND LOSS ACCOUNTFOR THE PERIOD FROM 01 JANUARY TO 31 MARCH 2019 AND 2018
NEXUS AG / Quarterly Report Q1 201910

NEXUS AG / Quarterly Report Q1 201911
01/01-31/03/2019 01/01-31/03/2018
KEUR KEUR
Consolidated surplus 2,855 2,511
Positions, wich are reclassified in profit or loss
Currency conversion differences -191 -674
Interest effect from IFRS 9 -49 -
OTHER OVERALL RESULT -240 -674
OVERALL RESULT OF THE PERIOD 2,615 1,837
Of the overall result of the period, accounted to:
- Stockholders of NEXUS AG 2,567 1,931
- Shares of non-controlling partners 48 -94
GROUP STATEMENT OF CONSOLIDATED INCOMEFOR THE PERIOD FROM 01 JANUARY TO 31 MARCH 2019 AND 2018

ASSETS 31/03/2019 31/12/2018
LONG-TERM ASSETS KEUR KEUR
Goodwill 72,893 73,462
Other intangible assets 37,313 38,609
Fixed (Intangible) assets 10,337 10,378
Rights of use of leased assets 8,594 -
Shares in companies valuated at equity 26 26
Deferred tax assets 3,409 3,860
Other financial assets 363 156
Total of Long-Term Assets 132,935 126,491
SHORT-TERM ASSETS
Inventories 599 536
Trade receivables and other receivables 29,896 25,980
Leasing liabilities 1,078 1,007
Receivables from tax on profits 2,394 1,511
Other non-financial assets 5,190 1,918
Other financial assets 1,199 27,249
Short-term financial assets 1,610 1,586
Cash and balance in bank 49,834 25,430
Total of Short-Term Assets 91,800 85,217
Balance Sheet Total 224,735 211,708
CONSOLIDATED BALANCE SHEETAS OF 31 MARCH 2019 AND 31 DECEMBER 2018
NEXUS AG / Quarterly Report Q1 201912

EQUITY AND LIABILITIES 31/03/2019 31/12/2018
EQUITY CAPITAL KEUR KEUR
Subscribed capital 15,752 15,752
Capital reserves 34,166 34,166
Retained earnings 62,142 52,182
Consolidated surplus 2,810 10,921
Other cumulated Group result -4,834 -4,640
Own shares -73 -759
EQUITY CAPITAL ATTRIBUTABLE TO STOCKHOLDERS OF THE PARENT COMPANY 109,963 107,622
Shares of non-controlling partners 751 703
Total Equity Capital 110,714 108,325
LONG-TERM DEBTS
Pension obligations 10,888 10,838
Deferred tax liabilities 7,101 7,219
Other financial debts 19,397 19,358
Leasing liabilities 5,318 -
Total of Long-Term Debts 42,704 37,415
SHORT-TERM DEBTS
Accruals 12,263 13,128
Financial liabilities 0 9,000
Trade accounts payable 5,372 7,070
Liabilities from tax on profit 1,604 1,615
Deferred revenue 24,234 4,660
Other non-financial debts 4,607 3,111
Contract liabilities 5,257 5,399
Leasing liabilities 3,291 -
Other financial debts 14,689 21,985
Total of Short-Term Debts 71,317 65,968
Balance Sheet Total 224,735 211,708
Consolidated Balance SheetNEXUS AG / Quarterly Report Q1 2019
13
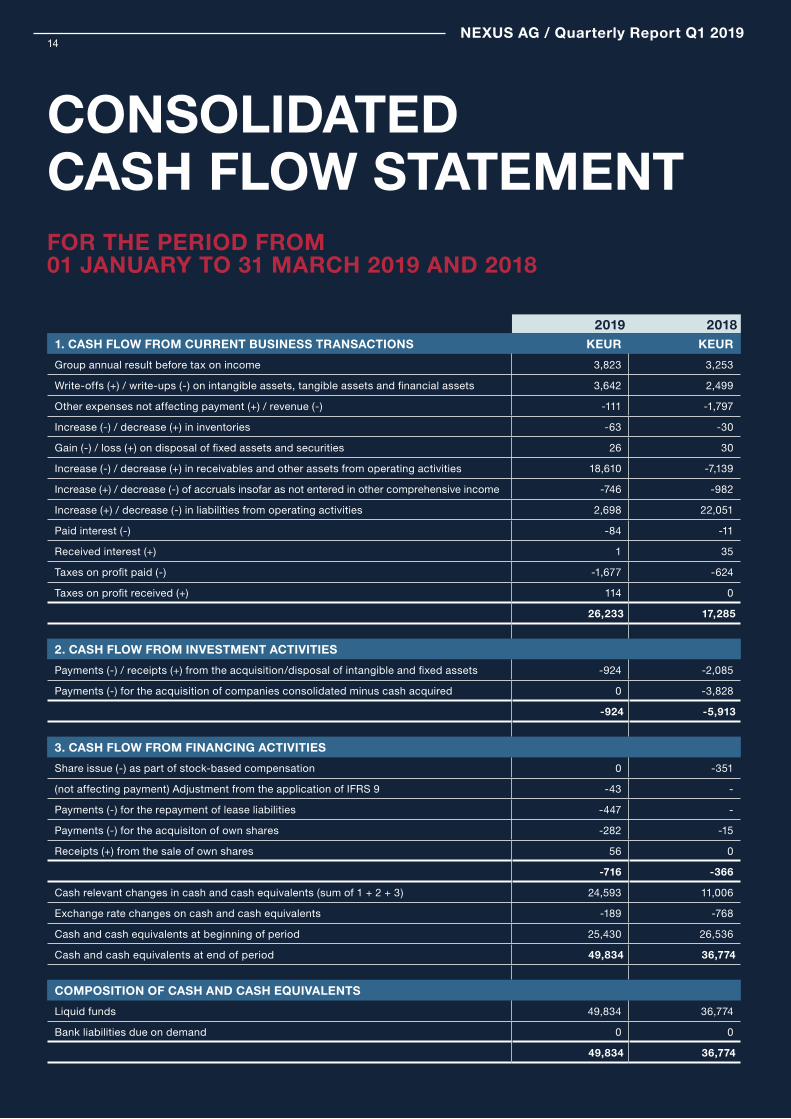
2019 20181. CASH FLOW FROM CURRENT BUSINESS TRANSACTIONS KEUR KEUR
Group annual result before tax on income 3,823 3,253
Write-offs (+) / write-ups (-) on intangible assets, tangible assets and financial assets 3,642 2,499
Other expenses not affecting payment (+) / revenue (-) -111 -1,797
Increase (-) / decrease (+) in inventories -63 -30
Gain (-) / loss (+) on disposal of fixed assets and securities 26 30
Increase (-) / decrease (+) in receivables and other assets from operating activities 18,610 -7,139
Increase (+) / decrease (-) of accruals insofar as not entered in other comprehensive income -746 -982
Increase (+) / decrease (-) in liabilities from operating activities 2,698 22,051
Paid interest (-) -84 -11
Received interest (+) 1 35
Taxes on profit paid (-) -1,677 -624
Taxes on profit received (+) 114 0
26,233 17,285
2. CASH FLOW FROM INVESTMENT ACTIVITIES
Payments (-) / receipts (+) from the acquisition/disposal of intangible and fixed assets -924 -2,085
Payments (-) for the acquisition of companies consolidated minus cash acquired 0 -3,828
-924 -5,913
3. CASH FLOW FROM FINANCING ACTIVITIES
Share issue (-) as part of stock-based compensation 0 -351
(not affecting payment) Adjustment from the application of IFRS 9 -43 -
Payments (-) for the repayment of lease liabilities -447 -
Payments (-) for the acquisiton of own shares -282 -15
Receipts (+) from the sale of own shares 56 0
-716 -366
Cash relevant changes in cash and cash equivalents (sum of 1 + 2 + 3) 24,593 11,006
Exchange rate changes on cash and cash equivalents -189 -768
Cash and cash equivalents at beginning of period 25,430 26,536
Cash and cash equivalents at end of period 49,834 36,774
COMPOSITION OF CASH AND CASH EQUIVALENTS
Liquid funds 49,834 36,774
Bank liabilities due on demand 0 0
49,834 36,774
CONSOLIDATED CASH FLOW STATEMENTFOR THE PERIOD FROM 01 JANUARY TO 31 MARCH 2019 AND 2018
NEXUS AG / Quarterly Report Q1 201914

Su
bsc
rib
ed
ca
pit
al
Ca
pit
al r
ese
rve
s
Re
tain
ed
ea
rnin
gs
An
nu
al N
et
Pro
fit
Eq
uit
y c
ap
ita
l dif
fe-
ren
ce
fro
m c
urr
en
cy
co
nve
rsio
n
Pe
nsi
on
re
serv
es
Ow
n s
ha
res
Eq
uit
y c
ap
ita
l a
ttri
bu
tab
le t
o s
toc
k
of
pa
ren
t c
om
pa
ny
Sh
are
s o
f n
on
-co
ntr
ol-
ling
pa
rtn
ers
Eq
uit
y c
ap
ita
l to
tal
Au
tho
rize
d C
ap
ita
l
KEUR KEUR KEUR KEUR KEUR KEUR KEUR KEUR KEUR KEUR KEUR
CONSOLIDATED EQUITY AS OF 01/01/2018 15,752 34,953 48,202 9,832 889 -7,093 -419 102,116 893 103,009 2,984
Adaptation of the initial application of IFRS 9 -103 -103 0 -103
Adaptation of the initial application of IFRS 15 6 6 0 6
ADJUSTED GROUP EQUITY AS OF 1 JANUARY 2018 15,752 34,953 48,105 9,832 889 -7,093 -419 102,019 893 102,912 2,984
Posting of consolidated surplus 2017 in the Group profit carried forward
9,832 -9,832 0 0
Currency differences -160 -510 -670 -4 -674
OTHER COMPREHENSIVE INCOME AFTER TAXES 31 MARCH 2018
0 0 0 0 -160 -510 0 -670 -4 -674 0
Consolidated surplus 3M-2018 2,601 2,601 -90 2,511
OVERALL RESULT OF THE PERIOD 0 0 0 2,601 -160 -510 0 1,931 -94 1,837 0
Purchase of own shares -396 -396 -396
Sale and issue of own shares in the form of share-based payment -381 411 30 30
CONSOLIDATED EQUITY AS OF 31 MARCH 2018 15,752 34,572 58,034 2,601 729 -7,603 -404 103,681 799 104,480 2,968
CONSOLIDATED EQUITY AS OF 01 JANUARY 2019 15,752 34,166 52,182 10,921 1,131 -5,771 -759 107,622 703 108,325 2,984
Posting of consolidated surplus 2018 in the Group profit carried forward
10,921 -10,921 0 0
Adaptation of the application of IFRS 9 -49 -49 -49
Currency differences 0 0 -147 -47 -194 3 -191
OTHER COMPREHENSIVE INCOME AFTER TAXES 0 0 -49 0 -147 -47 0 -243 3 -240 0
Consolidated surplus 3M-2019 2,810 2,810 45 2,855
OVERALL RESULT OF THE PERIOD 0 0 -49 2,810 -147 -47 0 2,567 48 2,615 0
Purchase of own shares -282 -282 -282
Sale and issue of own shares in the form of share-based payment -912 968 56 0 56
CONSOLIDATED EQUITY AS OF 31 MARCH 2019 15,752 34,166 62,142 2,810 984 -5,818 -73 109,963 751 110,714 2,984
GROUP STATEMENT OF CHANGES IN EQUITYAS OF 31 MARCH 2019 AND 31 MARCH 2018
NEXUS AG / Quarterly Report Q1 201915

NEXUS AG, Irmastraße 1, D-78166 DonaueschingenPhone +49 771 22960-0, Fax +49 771 22960-226www.nexus-ag.de, [email protected]
Declaration according to § 37y No. 1 WpHG
To the best of our knowledge, and in accordance with the applicable reporting principles for interim financial reporting, the interim conso-lidated financial statements give a true and fair view of the assets, liabilities, financial position and profit or loss of the group, and the interim management report of the group includes a fair review of the development and performance of the business and the position of the group, together with a description of the principal opportunities and risks associated with the expected development of the group for the remaining months of the financial year.
Donaueschingen, 03 May 2019
NEXUS AGThe Executive Board