quenching the thirst for knowledge - wrc home hub documents/annual reports/wrc...quenching the...
TRANSCRIPT

Annual Report 2008/09Annual Report 2008/09Water Research Commission
Quenching the thirstfor knowledge
Quenching the thirstfor knowledge

VisionTo be a globally recognised leader in providing innovative solutions for sustainable water management to meet the changing needs of society and of the environment.
MissionThe WRC is a dynamic hub for water-centred knowledge, innovation and intellectual capital.
We provide leadership for research and development through the support of knowledge creation, transfer and application.
We engage stakeholders and partners in solving water-related problems which are critical to South Africa’s sustainable development and economic growth, and are committed to promoting a better quality of life for all.
On the coverDespite its formidable size, the African elephant (Loxodanta africana) is among the most gentle and social of all animals. An elephant is only as good as its herd and communication is vital for survival. Elephants communicate mainly through sound, touch and body language. Over long distances messages are sent by producing and receiving low-frequency sound (infrasound), a sub-sonic rumbling, which can travel through the ground farther than sound travels through the air. This can be felt by the sensitive skin of an elephant’s feet and trunk, which pick up the resonant vibrations much as the flat skin on the head of a drum. Elephants are a keystone species: they create and enlarge watering holes by trampling the mud and carry it away after wallowing. Their paths to waterholes channel the rains. In dry times, elephants dig holes using their trunks and feet to expose underground springs, creating much needed water supplies on which many other animals depend. They have great capacity for compassion and possess a significant sense of memory. In many African cultures the elephant is seen as a general symbol of physical power, leadership, longevity and wisdom. Cover illustration by Vanessa Joubert
Quenching the thirstfor knowledge

ContentsChairperson’s Address 4Highlights 8Executive Report 18Report of the Auditor General 52
Consolidated WRC and wholly-owned CompanyReport of the Audit Committee 55Financial Statements 56
Consolidated WRC and wholly-owned CompanyReport of the Auditor General 90
Erf Sewe-Nul-Ses Rietfontein (Pty) LtdFinancial Statements 92
Erf Sewe-Nul-Ses Rietfontein (Pty) LtdOrganisational Structure 106

Chairperson’s Address
The presence of a unique organisation such as the WRC is ever more pertinent as South Africa becomes increasingly aware of the scarcity of its water resources and the important role water has to play in the growth and development of its people. As the new Chairperson of the WRC Board it is a privilege to take charge of such a structured organisation, especially being a ‘product’ of the Commission myself. My own capacity was developed as a student on WRC projects and then as project leader of large multidisciplinary projects. Together with my fellow Board members and the WRC Executive team, I look forward to steering the Commission to greater heights in its quest to remain South Africa’s hub of water-centred knowledge.W
RC A
nnua
l Rep
ort 2
008/
09
4

Media headlines highlighting persistent challenges in the water sector, such as the prevalence of waterborne
diseases, failing infrastructure, the lurking influence of climate change and the growing demand from all sectors for a scarce resource, prevailed during the past year. The South African government has long recognised these challenges, and being rich in nearly all natural resources but water has compelled the country to invest heavily in water infrastructure and technology. Decades of national investment into research and development in the water sector has led to a vast knowledge base and several internationally recognised social and technological innovations. Through the creation of an organisation dedicated to supporting South African society through the funding of valuable research, solutions to many pressing challenges have been discovered. However, several questions remain to be answered and the WRC continues to address both present and future issues through the various research projects it funds and supports.
The WRC’s commitment to growing the sector’s learning and expertise is clear from the fact that 294 projects were supported during the year. In 2008/09 64 projects were finalised bringing the total number of projects completed during the past five years to almost 400. Project focus was well balanced between water resource management and water utilisation. Progress was achieved against the strategic plan which strongly reflected the key needs and objectives of the Department of Water Affairs & Forestry (now the Department of Water & Environmental Affairs) as well as the water sector as a whole. While more substantial examples of the achievements gained from these projects can be found in the Highlights chapter of this Annual Report, it is my pleasure to share a few.
Tight financial managementThe WRC is funded through the Water Research Fund which derives income from levies on water consumption. Being public funds the responsible care of these monies remains top priority for the Board and Executive. The hard work and commitment of the WRC Executive and staff is acknowledged in ensuring that the Commission continues to achieve a research ratio of 75%, measured as research funding and support as a percentage of the total income.
It is also pleasing to see that there has been an increase in income from other sources besides the water research levy. This has mainly been for the Water Information Network (WIN-SA) and for the Framework for Education and Training in Water (FETWater). In both cases the WRC is the appointed implementing agent. Leveraged income was obtained both from local and international sources and was also due to support by various government departments for specific research projects.
Building new capacityThe WRC has answered the call for an improvement in expertise in the water sector and continues to provide South Africa with future researchers as well as a source of skilled human capital for the water sector. Approximately 3 000 students, of which the majority (65%) are historically disadvantaged, have been supported by research projects over the past five years. While most of these students are still being supported by universities, it is heartening to see that there has been an increase in the number of students involved in projects led by consultancy groups as a result of the WRC strategy of building research networks and consortia. Many former students are now also project leaders in their own right.
Other capacity-building initiatives include the Technical Assistance Centre to assist rural water service providers with technical support for water provision and sewage treatment. As a leading water research organisation in Africa the WRC is also involved in regional capacity-building initiatives such as NEPAD’s Network of Centres of Excellence for Water Research, the Water Research Fund of Southern Africa and the Inter-Academy Programme for Water of the Academy of Science of South Africa.
Improving knowledge disseminationLike the elephants depicted on the front cover of this Annual Report, the WRC, through its solicited and unsolicited research projects, digs deep to find the most adequate
Water-Centred KnowledgeProviding internal, knowledge-based support for the WRC and service to the water sector and society through IT services, knowledge sharing, scientific communication and the furthering of public understanding of science.
Chai
rper
son’
s Add
ress
5

ways to ensure the successful and sustainable management of South Africa’s water resources. But, unlike these gentle giants, the Commission cannot afford to merely leave behind footprints in the sand. It is crucial that the knowledge gained on every project is shared as widely and thoroughly as possible and, therefore, new ways of disseminating knowledge and increasing public understanding of the water sector remains a priority for the WRC.
During the year under review significant improvements were made to knowledge dissemination mechanisms implemented by the WRC. Besides the 108 research reports that were published, 35 technical and policy briefing
notes (short, explanatory descriptions of research results containing recommendations for selected stakeholders) were also produced. Conferences, exhibitions, open days, practical field visits and technical workshops continue to form an important component of the WRC’s knowledge dissemination drive. As the WRC strives for excellence a particular achievement in 2008/09 was the high impact factor assigned to the journal Water SA by the Institute for Scientific Information. Water SA was the second-highest ranked journal in South Africa and well placed in the water journal category worldwide.
Testing the impact of researchIn 2008/09 the WRC investigated the impact of research programmes on social, health and economic issues as well as the sustainability of the environment. These studies have underlined the role that water-centred knowledge has played to address the challenges created by the country’s limited water resources. Of particular interest is the significant influence the Commission’s research on domestic water quality has had on the sector through the drinking water quality guidelines which are still as popular today as they were when first produced in the late 1990s.
Another field in which the WRC has had significant bearing is improving water use in irrigated agriculture. The international award-winning Water Administration System, a water management tool for irrigation schemes and water management offices developed through WRC support, has been applied over 20 years in several irrigation areas leading to significant improvement in efficiency in water use from canal networks, pipelines and rivers.
Organisational transformation and governanceConcerning organisational transformation the WRC has met its employment equity targets, actually exceeding the targets set in previous years. In 2008/09 the percentage of Black staff increased to 56% of total staff, with the majority of staff being female (60%).
Water Resource ManagementGenerating the knowledge, tools and skills to ensure that water resources of South Africa are protected, utilised, developed, conserved and managed to achieve environmental, social and economic sustainability.
WRC
Ann
ual R
epor
t 200
8/09
6

The new Board appointed by the Minister of Water Affairs & Forestry commenced its term during July 2008. The WRC Board members have extensive national and international experience and will undoubtedly provide the necessary strategic direction required to ensure that the core functions of knowledge generation, transfer, dissemination and capacity building are achieved. Already a number of operational policies were reviewed and new policies developed during the course of the year.
AppreciationI would like to thank former Minister of Water Affairs & Forestry, Ms Lindiwe Hendricks, for her support of the WRC during her term of office. The WRC has always been proud of its close working relationship with its main shareholder. As we enter a new era of government with a new Department we welcome Minister Buyelwa Sonjica back to the folds of the water sector and look forward to working with the new Department. Like the wise matriarch leading the elephant herd, may we too follow her tracks to a better environment for those who come after us. I also wish to thank the research community for their commitment and passion and to congratulate them on their sterling achievements during the past year.
Our country faces many challenges and we need to maintain and build new partnerships if these are to be addressed. It is important to remember that in finding solutions to the hurdles lying in our way to success we are only limited by our imagination and creativity. To the new Board, thank you for your support and hard work. I look forward to working together with you in ensuring the WRC prospers and grows.
Prof JB Adams
Chai
rper
son’
s Add
ress
7

Highlights of 2008When an elephant is born the herd rejoices. Each infant is welcomed with trumpets, rumbles and roars and throughout their life is nurtured and cared for, led on ancient paths and taught the secrets of survival. So the WRC delights in the outcomes of its research projects and outreach initiatives. For it is understood that every new technology and innovation, every guide document and research report, and every skill developed brings us closer to ensuring the sustainable use of South Africa’s scarce water resources to enable the growth and development of our communities.
WRC
Ann
ual R
epor
t 200
8/09
8

The WRC and its actions are embedded in the dynamics of the South African water sector. The constant need
to maintain and improve water quality, and preserve the aquatic environment while growing the economy and improving the lives of all the country’s citizens, has underlined the importance of creating a strong local knowledge base to ensure the integrated management of freshwater for the benefit of all.
As part of its national drive to address South Africa’s water challenges, the WRC is aligned with the strategic objectives of the Department of Water Affairs & Forestry (DWAF) and other water-sector stakeholders to fund relevant water research within the country. The Commission also pursues partnerships across Africa and globally to grow sector research capacity, leverage expertise and apply innovation across a wide spectrum of needs.
The Annual Report is one of the most important knowledge-sharing platforms of the WRC. This document is used by sector leaders to benchmark and gain knowledge of the sector. It is therefore a privilege and a pleasure to share some of the highlights from the WRC research portfolio of 2008/09.
Caring for our CommunitiesLifeline for rural water treatment plantsThe WRC is one of the main funders and developers of the new Technical Assistance Centre to aid small and medium-sized water and wastewater treatment plants struggling to comply with national quality regulations. Smaller water and wastewater treatment plants are often situated in far-flung peri-urban or rural areas where technical and management capacity is hard to come by. The Centre provides pro-active and reactive assistance in the form of rapid and effective information, action plans and solutions to treatment plant owners, managers and personnel experiencing problems
with their plants. Information on technical, social and capacity-building issues is also being provided. The concept has been tested in the Eastern and Western Cape, on plants experiencing serious challenges with compliance and performance identified and assisted on a priority basis.
SHAPEing up service deliveryThe Sanitation and Housing Applied Priorities Enquiries (SHAPE) model is a computer modelling tool to help local authorities determine the effective demand for services, with a specific focus on sanitation, among peri-urban residents. The model establishes the demands for housing and all other infrastructural services (water, sanitation, electricity, etc.) simultaneously. This is an enormous advantage to government and other authorities responsible for delivering services to the residents of informal settlements. The basic objective of the program is to allow the user to specify their preferences in the context of a global housing solution, for example, for
Hig
hlig
hts o
f 200
8
9

sanitation. The model recognises that, particularly for the poor, there are trade-offs between stand size and servicing, house size, and standards of finishes and fittings. It also takes the housing subsidy into account. This is the first time that a comparatively accurate estimate of the actual cost of all components allows such a trade-off to be made.
Innovating treatment technologyWRC-funded research has led to the development of the limestone teeter bed reactor for potable water stabilisation and the treatment of waters containing coloured natural organic compounds. Lime is the conventional chemical used to increase the alkalinity and pH of raw waters that are naturally acidic due to naturally-occurring dissolved metals or natural organic matter, or which have been acidified by metal salts used as flocculants/coagulants. Developments in the use of limestone in place of lime for this application have been driven by a number of advantages, including ease of handling, lower cost, ready availability, smaller volume and the capacity to be self-controlling in terms of pH. The limestone teeter bed reactor has been demonstrated at small-scale and full-scale pilot trials to consistently perform its function of dissolving the limestone to a sufficient extent, within a reasonable residence time, to raise the pH of the feed water as required. Soft, highly coloured waters with low alkalinity can be treated effectively in the plant to produce potable water that complies, in all aspects, with drinking water quality regulations.
Encapsulating local knowledgeIndigenous rainwater harvesting and conservation practices are the product of accumulated knowledge, practices and traditions which have evolved over many generations of experimentation and adaptation. These practices have an inherent sustainability and present a sound platform on which to develop new practices aimed at maximising the benefits of ‘runoff farming’. A WRC-funded study documented and captured ten such practices in detail, both in a written format and on a DVD. The techniques that were documented covered scales varying from tens of thousands of hectares to micro-catchments of a few square metres in size. These practices have demonstrated the value of rainwater harvesting and conservation across the socio-economic and cultural spectrum of South Africa, including both emerging and commercial farmers.
Climate for Water ToolkitSeasonal climate forecasts are available in South Africa, yet they are of little value to the water management sector if they are not accessible and understood. Water resources are significantly affected by climate variability, particularly through the impacts on runoff and seemingly even more so on groundwater recharge. Research completed in 2008 with funding by the WRC greatly improved the understanding of how water resource managers use weather and climate information and especially seasonal forecasts, and the potential for better use of information and forecasts both through capacity-strengthening initiatives and the provision of information more appropriate to the needs of managers. One of the most significant spin-offs from the project has been the Climate for Water Toolkit, an online inventory of present sources of climate information systems and their role in water resource management. This Toolkit will assist with increasing the exposure, accessibility and usefulness of forecast information, and can be accessed through the website http://www.c4w.org.za.
Bringing clean drinking water to communitiesThe WRC has conducted numerous research projects on the subject of drinking water quality and in 1998 released the first of five user-friendly Quality of Domestic Water Supply guidelines. Since then tertiary institutions, water research consultants, local authorities and water services providers have been using these guidelines in different water-related applications. An assessment of the impact of these guidelines
WRC
Ann
ual R
epor
t 200
8/09
10

completed during 2008 has underlined the positive effects these documents have had on the sector. These include economic benefits, ranging from their use as training material to the enhancement of skills in the water sector, to social and health impacts from the use of these guidelines to improve water quality. In cases where the guidelines have not been used there have been reported cases of poor water quality that have led to outbreaks of diseases.
Supporting the EconomyCleaning up our industriesThe implementation of the waste discharge charges system (WDCS) is expected to have a significant impact on how industries conduct their business. The main drive of the WDCS is to address problems of excessive water pollution by encouraging efficient resource utilisation and promoting sustainable water use. During the year under review the WRC completed a project which tested the premise that upstream cleaner production technologies could be more cost-effective and efficient than conventional end-of-pipe systems in removing water quality constituents of concern. The theory was tested on a pilot scale at a petroleum refinery in the Western Cape. The project proved that the introduction of cleaner production technology would be able to achieve the same improvement in effluent quality as an end-of-pipe system at 30% lower cost.
Harnessing the windThe increasing use of water recycling technology and increasing efficiency of reverse osmosis technology has resulted in the increased generation of inorganic brines and concentrates. The disposal cost of the brine can easily exceed the cost of the desalination. Innovations that reduce the volume of brine and/or lead to the recovery
of useful products are thus highly sought after. Wind-Aided Intensified Evaporation (WAIV) exploits wind to enhance evaporation above brine ponds through the use of extended vertical shade net surfaces. The technology may also be used to increase the lifespan of existing evaporation ponds. The concept was tested using a small-scale pilot unit, which has shown that evaporation rates may be increased by as much as 20 to 30 times relative to natural evaporation from open ponds. One of the main benefits of the technology is its perceived level of simplicity and reduced maintenance requirements compared to traditional evaporators. In addition, the technology primarily uses a constantly available (renewable) energy source for driving evaporation. This new technology is showing much promise and may reach full-scale application in a reasonably short time.
Studying the economics of indigenous treesLarge areas of commercial forest plantations occur in the wetter regions of South Africa. Covering about 1.4 million hectares, they contribute considerably to the economy and employment, but use tremendous volumes of water. The demand for wood is growing strongly, yet the expansion of the national forestry estate is curtailed by legislation to minimise further declines in catchment water yields. One solution is planting indigenous trees. A WRC-funded project showed that plantations of indigenous trees, such as Outeniqua yellowwood, may be economically more viable in terms of maintenance, wood value and water use than their commercial counterparts. However, when considering water-use efficiency in terms of the volumes of wood produced relative to the amount of water used by the trees, the exotic plantations (eucalyptus and pine) consistently
Hig
hlig
hts o
f 200
8
11

outdid their indigenous counterparts. The exception is the southern Cape where an indigenous forest compared favourably with a yellowwood plantation. In addition, further economic benefits from indigenous plantations may be gained from by-products such as traditional medicine, fruits, recreation, climate-change mitigation through carbon storage and tourism.
Creating powerful irrigation planning tools for commercial farmersSAPWAT3 is essentially an enhanced and improved version of the original program which is extensively applied in South Africa and was developed with WRC support to establish a decision-making procedure for the estimation of crop irrigation requirements by irrigation engineers, planners and agriculturalists. SAPWAT3 has included in its installed database comprehensive long-term weather data that is immediately available to the user. The program makes provision for the introduction of enterprise budgets as part of the irrigation water requirement planning process. In addition, it provides a rainwater harvesting module aimed at small areas, typically small farms or household gardens. SAPWAT has become the accepted methodology for estimating crop irrigation requirements in a number of aspects of water management and it is foreseen that SAPWAT3 will continue in this role of macro-planning; water pricing strategy, registration of water use and verification of legal water use; water demand management strategy; planning and management of small-scale farmer irrigation schemes; planning and management of household and community gardens; support for irrigation scheduling and irrigation system design.
Energy from wastewaterAt present, wastewater is viewed as a burden which requires energy input during treatment before it can safely be released into the environment. A WRC-funded study explored the various waste streams and the appropriate technologies that could be used to generate energy. Three main industries were identified which have the most potential for energy recovery from wastewater: the formal and informal animal husbandry sector (cows, pigs and chickens), the fruit and beverage industries
(distillery, brewery, winery, fruit juicing and canning), and domestic blackwater (sewage). The study also indicated that an estimated 10 000 MW can be recovered from these wastewaters nationally, representing 7% of the current Eskom electrical power supply.
Conserving the EnvironmentTracing Van Riebeeck’s footstepsThe intricate relationship between Cape Town’s rivers and wetlands and the historical development of South Africa’s Mother City is the subject of a new publication, Rivers and Wetlands of Cape Town, Caring for our Rich Aquatic Heritage. The richly illustrated book, with the foreword written by former Cape Town Mayor Helen Zille, provides a fresh perspective on rivers and river management in Cape Town, using the lenses of time and space. The book steps back in time and tracks the changes that have occurred and the reasons for those changes. The WRC supported this project with the aim that lessons from the past, combined with insights from a society that has since learnt much about its dependence on nature, will assist in the improved management of the country’s natural resources.
Protecting underground water sourcesKarst aquifers are highly vulnerable to pollution. In the Cradle of Humankind World Heritage Site near Krugersdorp on the West Rand, karstified dolomites are capable of sustaining high-yielding boreholes which are the only readily available water resource for many towns, rural areas and farms. Decant of acidic mine-water from old gold-mine shafts has been occurring in the area for many years. A unique study mapping the vulnerability to pollution of these karst aquifers showed that the protection of aquifers in dolomitic areas is inferior. This is mainly as a result of shallow holes, which cause direct, localised recharge and bypassing of the unsaturated zone.
Uniting to save an abused riverWRC
Ann
ual R
epor
t 200
8/09
12

The WRC is one of the founding members of the Consortium for the Restoration of the Olifants Catchment (CROC). The Olifants River has been subject to severe pollution over the past few decades leading to significant environmental degradation and more recently the death of hundreds of crocodiles, fish and other animal species in the Kruger National Park and Loskop Dam Nature Reserve. Led by South African National Parks the consortium also includes representatives from national government departments, research organisations, universities, and independent consultants. It is hoped that the outputs from CROC will not only benefit the communities and wildlife dependent on the Olifants River system, but will lead to the improvement of the management of South Africa’s other river systems to prevent ecological disasters occurring in future and to effect an overall improvement in river health.
Exposing the link between surface water and groundwaterAn important multiyear study focusing on the ecological role of the Table Mountain Group (TMG) Aquifer, which has been cited as a probable bulk future water resource for the City of Cape Town and surrounds, was published in 2008. While no species were encountered that were solely dependent on groundwater discharge, investigations did reveal that the TMG Aquifer contributes significantly to the surface environment, notably perennial rivers, wetlands and Proteaceae, whose roots tap into underground water sources. Among others, useful tools and physico-chemical tracers of groundwater contribution have been identified which will enable test abstraction from the deep aquifer to be monitored. The study underlined the importance of basing the siting and design of any future abstraction boreholes on a sound conceptual understanding of structural controls on probable flow paths and their discharge points.
Monitoring the health of our aquatic ecosystemsThis WRC project was initiated in response to the recognition that neither government nor industry was proactively adopting ecotoxicology as a valuable technology in water resource management, particularly with regard to water resource protection. The research work has developed into the area of environmental water quality, an integrated approach that advocates the use of water chemistry, biomonitoring and ecotoxicological data to achieve and understand the interactions between biota and their physico-chemical habitat. The ultimate aim of the project was to ensure that aquatic ecotoxicology is developed, established and implemented to contribute to effective and sustainable water resource use. The results and products of the project feed into the National Toxicity Monitoring Programme and the development of guidelines for toxic organic substances, as well as the WRC initiative to link aquatic ecotoxicology with human health and endocrine disrupting compounds.
Counting our water resourcesThe knowledge and processes involved in accounting for water resource availability continue to benefit from new insights, knowledge and data. The WRC has been instrumental in providing support and a platform for water practitioners to take part in research to develop water resource assessment techniques, and to collate the data and assess the nation’s available water resources at varying intervals since the late 1970s. This latest study funded by the Commission captures available water assessment techniques, and improved hydrological simulations. Importantly, the final report integrates water resource data, including data on groundwater, surface water, wetlands, water quality, soils, improved catchment delineation, population, return flows, and several other variables that have a bearing on the quantification and assessment of the available water resources.
Hig
hlig
hts o
f 200
8
13

Arming our Societies with Knowledge
Training SA fish farmersDuring 2008 the WRC produced a training manual for fish farmers providing guidelines for dealing with water quality and improving the success of trout farming in net cages on irrigation dams. Its aim is to provide a quick reference to procedures and practices for the farmer. It will furthermore contribute to the production of quality fish and to the maintenance of environmental integrity. The manual has been written to address aspects of farming that require hands-on management, namely, site selection, operational procedures (i.e. water and feed management), monitoring and evaluation. It also gives the contact details of people who can advise the farmer on urgent questions regarding procedures or abnormalities in production.
Illustrating best practiceDuring the year under review the WRC developed an illustrative training kit for rural water treatment plant operators. In rural treatment plants there is a need for most operators to upgrade their training in order to achieve the necessary improvements in performance to produce water that is consistently safe to drink. While formal training in a classroom does have its benefits, operators with a low level of formal education may find the presentation of the course material difficult to follow. This illustrative kit is the end-product of a series of on-site mobile training of 26 operators from seven different small water treatment plants in the Eastern Cape. It emphasises why each step in water treatment is important for the sustainable production and delivery of safe drinking water and how to check the
performance at each stage.
Healthy hands for healthy communitiesSimple acts of hygiene, such
as the regular washing of hands after going to the toilet and before handling food can have significant
effects on people’s health. In
South Africa’s growing informal settlements access to basic services is most often limited, and there exists a real need to increase health and hygiene education in a meaningful and sustainable manner. The WRC has developed a Guideline for the Implementation of Hygiene Education Programmes in Informal Settlements to assist water services authorities to implement effective and efficient hygiene education programmes as a continuous service to change behaviours and improve the overall health of their communities.
Guiding small wastewater works designers
In 1973 A Guide to the Design of Sewage Purification Works was published by the then Southern African Branch of the Institute for Water Pollution Control. This guide, which became known as the ‘Black Book’, was last revised in 1987 despite the fact that since then there have been a number of new technologies introduced to the wastewater sector. In addition, this guide does not consider small wastewater treatment works. The WRC’s new Design Manual for Small Sewage Treatment Plants has been written for this market, and is intended to assist in designing, approving and operating smaller plants. The manual includes new
WRC
Ann
ual R
epor
t 200
8/09
14

information on rotating biocontactors and submerged media reactors. Furthermore, the regulatory aspects and new legislative requirements were carefully considered in terms of how they were expected to impact on this manual.
Ensuring the quality of water treatment chemicalsChemical disinfection of water is considered the essential and most direct way to inactivate or destroy pathogenic and other microbes in drinking water. However, it is equally important to ensure the quality of the chemicals used for this task so as not to put the health of communities at risk. While South Africa has laws regulating drinking water quality there are no regulations for the chemicals used to provide that water. The WRC funded a two-year project to rectify this situation. The project team worked closely with the SABS and by December 2008 43 new standards regulating water treatment chemicals had been approved and published. The resultant report also presents some proposals for a regulatory framework that could be used as a basis for implementation in South Africa.
Encouraging Knowledge Sharing
For the WRC to remain relevant to South African society it is not only crucial that its research is aligned with government and sector goals, but that the outcomes and knowledge emanating from that research are shared and transferred sustainably to the relevant stakeholders. The WRC prides itself in its knowledge dissemination initiatives, and has successfully developed a range of communication and information dissemination channels (including a popular magazine, scientific journal and research reports). Print, radio and television media are also used to expand public understanding of WRC research outcomes and water-related issues in general. This year again saw the Commission investigating new ways of dissemination knowledge, including the production of the Knowledge Toolbox, which contains the latest summarised information on completed WRC projects.
The WRC also strongly supports strategic national and international conferences and workshops which provide the platform for sector specialists to gain new knowledge, share insights, and build a sustainable knowledge base in the South African water sector. Executive personnel are often invited to deliver keynote and session presentations. Various workshops were organised and sponsored during the year, while the WRC took a lead role in several important
symposia, including the 2008 WISA Biennial Conference, the International Conference on Implementing Environmental Water Allocations, and the Climate Change Summit 2008.
Reaching Out to AfricaCollaborating with the Kenyan Water InstituteThe WRC signed a Memorandum of Understanding (MoU) with the Kenya Water Institute. Among others, the institute provides hands-on experience and quality training to assist in transforming Kenya’s water institutions and individuals, acts as a training ground for new technologies and research findings, and supports capacity development of water sector institutions. The MoU between the Institute and the WRC sets out to undertake scientific and applied research, and database development, in order to promote planning, management, development, and institutional reforms in the water sector in both countries; develop scientific and technological innovations in the water sector; promote sustainable capacity building in the water sector; and facilitate knowledge exchange and information dissemination.
NEPAD Centres of ExcellenceThe WRC, in collaboration with the French Institute of Research for Development, continues to support the NEPAD Office of Science and Technology initiative focusing on the establishment of the African Network of Centres of Excellence in Water Science & Technology. The centres will address critical water-related issues, conduct research programmes, train new researchers, trainers and professionals and promote technology transfer.
Hig
hlig
hts o
f 200
8
15

Exploring the power of AfricaThe WRC is supporting the Academy of Science of South Africa in the Inter-Academy Programme for Water which aims to build capacity for water research. In 2008/09 the two organisations jointly hosted a successful African Hydrology and Hydropower Training Workshop at the WRC’s offices in Pretoria. The workshop investigated the use of hydropower as an alternative energy source on the African continent. Participants deliberated a number of topical issues on the importance of hydropower amidst a global and regional move towards diversified and renewable energy technology solutions.
Shaping SA’s Future LeadersOne of the WRC’s most important functions remains equipping future researchers with the required knowledge and building much-needed skills in the South African water sector. Post-graduate students conducting research are accommodated through the various projects supported by the WRC. In 2008/09, the WRC supported 633 students through its projects, 61% of whom are from historically disadvantaged backgrounds. It is encouraging to note that, during the past five years, more than 3 000 students have been trained, many of whom are now leading WRC research projects and are serving as members of steering committees as well as reviewers of new proposals.
The Commission is also reaching out to young professionals, with Research Manager Dr Jo Burgess leading the establishment of a joint International Water Association/Water Institute of Southern Africa Young Water Professionals Forum. This forum will address the needs of young professionals in the water sector in terms of professional growth and building their track record.
Stimulating young mindsThe WRC remains an annual sponsor of the South African Youth Water Prize. The aim of the Award is to enhance the interest of high-school learners in science and technology towards a possible career in the water sector. Participants identify problems related to water and sanitation in their communities, conduct research and develop innovative solutions and/or inventions to solve the problem. Winners of this competition for high-school learners go on to compete on the international arena for the Stockholm
Youth Water Prize presented in Sweden every year during World Water Week.
This year’s winner was 15-year-old Raksha Gosai, from Vredendal High School in the Western Cape, for her research on Daphnia. Runners-up to the South African competition were Truth Mkhize and Welcome Khuzwayo of Ukusa Secondary School in KwaZulu-Natal with third place going to Bakang Gaobuse, Kealeboga Mohibidu and Lebogang Josephs of Baitiredi Technical & Commercial High School in the Northern Cape.
Awarding excellent researchThe 2008 Excellence in Water Research Awards, held at CSIR in October, had water pollution as a central theme. The Awards, presented by the Water Institute of Southern Africa (WISA), the WRC and the CSIR, afford three young researchers the opportunity to present their work alongside an established researcher. Michael van der Laan presented his work on modelling agricultural non-point source nitrogen and phosphorus pollution, while Marcelle Marchand’s presentation focused on fish health as an indicator of water pollution. Dr Mapitsi Thantsha told the audience about her research on electrochemically activated water for the treatment of biofilms. Acid mine drainage treatment expert Prof Jannie Maree, formerly of CSIR and now with Tshwane University of Technology, presented the Memorial Lecture on Water and Byproducts from Mine Water.
WRC
Ann
ual R
epor
t 200
8/09
16

During the year under review Marcelle was also awarded the prestigious Society for Environmental Toxicology and Chemistry Europe Young Scientist Award for her poster presentation at the 18th Annual Meeting of the Society of Environmental Toxicology and Chemistry in Warsaw, Poland. The award is made annually and is intended to honour prominent performance in scientific work of a junior scientist under the age of 30. In September 2008 she also received the Junior Captain Scott Medal in Potchefstroom from the South African Academy for Science & Art. This medal is awarded for the best M.Sc. thesis in zoological sciences at a South African university.
Training emerging leadersThe WRC continues to act as the DWAF implementing agent for Phase II of the Framework for Education and Training in Water (FETWater). FETWater is a programme for effective cooperation in research, education, training and capacity-building initiatives to achieve integrated water resource management in South Africa. It provides constitutional support and financing in the form of seed funding to encourage the creation of training networks as a method for cooperation between universities, research institutions
as well as public and private sectors in the country. During 2008/09 84 people were trained through FETWater.
AccoladesWater quality tool wins big in ViennaThe Department of Water & Environmental Affairs, along with the Institute of Municipal Engineering and Emanti Management received international recognition for the development of their Electronic Water Quality Management System (eWQMS) when they were bestowed the International Water Association Global Project Innovation Award in the Operations/Management Category in Vienna, Austria. The Award recognises excellence and innovation in water engineering projects throughout the world. Rollout of the open source, Internet-based system started in 2006, and today, around 95% of water services authorities are providing drinking water data on a monthly basis. The WRC has been an important contributor to the success of the eWQMS initiative by supporting the development of a number of guidelines and Web-based municipal tools which are accessible via the system.
While we are strong on our own, together we can reach much greater heights. The initiatives outlined above represent but a small sample of the ways in which the WRC is effectively partnering with other stakeholders in the water sector to improve the sustainable management of the country’s water resources. Together we will continue to stand shoulder to shoulder to quench the thirst for water knowledge in South Africa.
Hig
hlig
hts o
f 200
8
17
Executive ReportThe Board of the WRC submits this report to the South African Parliament through the Minister of Water Affairs and Forestry. The report was compiled in accordance with the requirements of the Public Finance Management Act (PFMA) and forms part of the audited financial statements of the Water Research Commission (WRC) for the period 01 April 2008 to 31 March 2009.
The report addresses corporate governance practices and structures, the mandate and core business of the WRC, the WRC’s achievements and progress made against the WRC’s key performance areas and targets.
WRC
Ann
ual R
epor
t 200
8/09
18
Water plays many roles in South Africa. An inadequate water supply and poor quality of water could hamper
economic growth and have a detrimental effect on human life, resulting in poverty and poor health. Water is thus a key resource for economic growth and sustainable development. Both water quantity and quality are critical to South Africa’s long-term sustainability. In a water-scarce country such as South Africa water is also a highly valued resource that requires dedicated governance and management systems and processes. These in turn require a good knowledge base with adequate technologies, tools and practices.
During 2008/09, the WRC remained committed to its Mandate and Mission and continued to function as a water-centred knowledge hub, providing South Africa with knowledge in support of decision making, policy development and implementation, and making available a range of methodologies, technologies and assessment tools aiming to improve water resources and water services management. The knowledge developed through the support of the WRC, if appropriately utilised, will allow for the sustainability of South Africa’s water resources and will support the building of a country where water is a key driver for economic growth and development. The WRC continues to provide the country with a knowledge framework that can be used to ensure safe drinking water and sanitation for all; sufficient quantity of water for various allocated uses, promoting a healthy environment and economic growth; sustainable infrastructure for water resource management and water and sanitation services; effective water management policies and systems; and adaptive and mitigating strategies to face the challenges of climate change.
The WRC recognises that it has a major role to play in the country’s current dynamic environment where effective management of the limited water resources requires both knowledge and capacity building. Knowledge provided by the WRC during the year under review will further equip South Africa with better understanding, improved competencies and stronger capacity to address future issues regarding water quantity, quality and accessibility. Special emphasis was placed on research related to water
for growth and sustainable economic development. During the year, progress was achieved against the organisation’s strategic plan which strongly reflected the key needs and objectives of the Government of South Africa and the water sector, as articulated by the Minister of Water Affairs and Forestry, its shareholder, and the Strategic Plan of the Department of Water Affairs and Forestry. The WRC also supported many government core initiatives and strategic policy frameworks. Emphasis was given to both capacity-building through research and to improving knowledge dissemination mechanisms. This resulted in significant improvements especially where knowledge dissemination is concerned.
Functioning as a ‘hub’ for water-centred knowledge, the WRC links various players within the water sector by working through local and global partnerships. The WRC provides novel (whilst practical) ways of packaging knowledge and creating knowledge-based products which can form the basis for new water resource and water service management practices for the water sector and the community at large, both locally and globally. The WRC is continuously expanding its role in the African continent in support of NEPAD, and within a number of global networks and initiatives.
MandateThe WRC is listed as a national public entity in schedule 3A of the Public Finance Management Act (PFMA).
The mandate of the WRC (Water Research Act, Act No 34 of 1971) highlights the following functions to be carried out by the organisation:
Promoting co-ordination, co-operation and •communication in the area of water research and developmentEstablishing water research needs and priorities•Stimulating and funding water research according to •priorityPromoting effective transfer of information and •technologyEnhancing knowledge and capacity building within the •water sector
Exec
utiv
e Re
port
19
GovernanceGovernance framework The WRC, under the competent leadership of its shareholder, the Minister of Water Affairs and Forestry, and strategic direction set by its Board, continued to manage its strategic and operational affairs within a sound corporate governance framework. The WRC complied strictly with both the Water Research Act and the PFMA, Treasury regulations as well as all other relevant legislation. The corporate governance framework provided the organisation and its leadership with integrity, accountability and transparency.
The Board of the WRC provided the organisation with a clear governance framework and oversight regarding sound management, compliance and control practices. The Board and its various committees provided effective structures for strategically guiding the WRC throughout the year under review.
During 2008/09 a new Board was appointed by the Minister of Water Affair and Forestry. The new Board has been introduced to the WRC and was trained by the Institute of Directors on all issues related to Board functions, duties and roles. The new Board has assigned new Board committees and refined the terms of references of these committees. A number of the WRC’s operational policies were further improved and a number of new policies were developed during the course of the year. The Board of the WRC adhered to its Board Charter which includes a Board code of ethics. Risk managementThe WRC has re-assessed its risk environment using a well-established risk management framework. The WRC developed and implemented its strategic and operational plan based on the risk areas identified. The framework informed many risk-mitigating strategies and actions and also set the basis for many of the organisation’s performance objectives. The risks identified and the risk management framework were approved by the Board of the WRC and were also used to set the internal audit plans.
As in previous years, the WRC engaged an external audit firm to undertake an internal audit of the organisation in terms of an audit plan that had been reviewed and recommended for approval by the Audit Committee of the Board, and thereafter approved by the Board of the WRC. The audit addressed financial and other strategic risk areas. The outcomes of the audit indicated significant improvements in many of the WRC’s operational practices. One of the key performance objectives of the WRC included providing feedback on the level to which management had addressed the issues identified by the internal audit in the previous year. The audit results and the WRC management’s response, as well as a description of the successful and planned actions intended to bring about further improvements, were reviewed and approved by the Audit Committee and the Board.
ValuesService orientationCare for people, society and the environmentFairness to allDedication to qualityIntegrity and ethical behaviourRespect for human and individual rightsInnovation and learning
Governance structures During the year under review the WRC operated under the leadership of its Board. During this period the Board was composed of a number of Board members appointed by the Minister of Water Affairs and Forestry for a period of three years, ending on 31 May 2008. New Board members were thereafter appointed by the Minister on 31 July 2008. Board members were as follows:
Members until 31 May 2008Dr SJ Khoza (Chairperson)Prof FAO Otieno (Vice-Chairperson)Prof JB AdamsMs MM MatsabuDr DJ MerreyMs VGN MkazaMr DP NaidooMr M SirenyaProf EM StackMs P Yako (Director-General, Department of Water Affairs and Forestry)
Current Board Members Prof JB Adams (Chairperson)Mr M Sirenya (Vice-Chairperson)Dr TPE Auf der HeydeMr P CrossDr DSS LushabaMs ZB MathenjwaDr DJ MerreyMr DP NaidooMs D NdabaMs P Yako
Ms P Yako, Director-General of the Department of Water Affairs and Forestry, and Dr R Kfir, Chief Executive Officer of the WRC, are ex officio members. Ms A Jansen and Dr H Snyman served as Board and Board Committee Secretaries during the period under review.
Board meetings held during 2008/09 28 May 2008 Board 03/04 September 2008 Board (Training and Induction)23 September 2008 Board 03 December 2008 Board (Strategic)12 March 2009 Board
Board Committee Secretaries28 May 2008 Ms A Jansen 03 September 2008 Dr HG Snyman 04 September 2008 Dr HG Snyman 23 September 2008 Ms A Jansen03 December 2008 Dr HG Snyman12 March 2008 Ms A Jansen
WRC
Ann
ual R
epor
t 200
8/09
20

Executive Committee of the Board (ExCo)MembersDr SJ Khoza (Chairperson) (until 31 May 2008)Prof JB Adams (Chairperson)Prof FAO Otieno (until 31 May 2008)Dr DSS LushabaMr DP NaidooMr M Sirenya Dr R Kfir (CEO)
WRC (in attendance)Committee Secretary: Ms A Jansen
Terms of ReferenceThe main function of the ExCo is to perform specific tasks, at the •request of the Board, which need to be addressed as matters of urgency. Meetings of the ExCo are governed by needs and requests by the Board. Current practice calls for a combined meeting of the ExCo and the Audit and Finance Committee to approve the financial year-end statements and the Directors’ Report.
MeetingsNo meetings were held during the period under review
Audit Committee of the BoardMembers Prof EM Stack (Chairperson) (until 31 May 2008)Mr M Sirenya (Chairperson)Mr JN Campbell (Co-opted) (until 31 May 2008)Mr P CrossDr DSS LushabaMs RNM Maphumulu (co-opted)Ms MM Matsabu (until 31 May 2008)Mr DP NaidooMs D NdabaProf FAO Otieno (until 31 May 2008)Dr R Kfir (CEO)
WRC (in attendance)Mr N Patel (Chief Financial Officer)
Committee Secretary:27 May 2008 – Ms A Jansen24 February 2009 – Ms A Jansen
Auditor-General Republic of South Africa27 May 2008 – Ms C Simpson, Mr R Rautenbach, 24 February 2009 – Ms Corné Myburgh (Business Executive)
PricewaterhouseCoopersMr P Prinsloo, Ms G de Risi
Terms of Reference Ensure compliance with the PFMA and advise on applications for •exemption deemed necessary in the interests of enhancing the WRC’s performanceMonitor and advise on the collection of revenue due to the WRC•Evaluate short-, medium- and long-term plans and budgets•Assess requests by management for adjustments in water research •rates and charges (levies) and make recommendations to the BoardReview the external audit process at key stages of planning and •execution, in terms of addressing (i) critical risk areas (ii) scope and (iii) effectivenessReview external audit results, and make recommendations to the •Board on acceptability of financial statements and on addressing significant differences between management and the external auditorsReview, from time to time, the WRC’s financial policies and •accounting procedures and controls, inter alia in the light of external audit resultsAdvise on labour dispute strategies•Monitor the scope and effectiveness of the internal audit function •from the financial perspectiveMonitor the ethical conduct of the WRC, its management and •senior officials, from a financial perspectiveReport to the Board on an ongoing basis•
Meetings27 May 2008 / 24 February 2009
Exec
utiv
e Re
port
21
Human Resources Committee of the Board (HR Committee) MembersMs VGN Mkaza (Chairperson) (until 31 May 2008)Dr DSS Lushaba (Chairperson)Dr TPE Auf der HeydeMs ZB MathenjwaMs D NdabaProf FAO Otieno (until 31 May 2008)Prof EM Stack (until 31 May 2008)Dr R Kfir (CEO)
WRC (in attendance)Ms R Frank
Committee Secretary:24 February 2009 – Ms A Jansen
Terms of ReferenceThe HR Committee of the Board will strive to inform and recommend to the Board on:
Level of the WRC compliance with all HR-related acts (legislation) •and possible applications for exemption deemed necessary in the interests of enhancing the WRC’s performanceHR policies and practices in the WRC •HR plans (e.g. training and skill development) and budgets•Amendments to the conditions of employment and •remuneration structureThe WRC’s performance management system•Job level assessment system, policy and procedures•The strategic structure and composition of top management•Transformation and employment equity plans •Internal climate/culture studies with emphasis on leadership issues•Imaging and branding of the company•Performance of HR to the strategic execution of the WRC•Meetings
24 February 2009
Remuneration Committee of the Board MembersDr SJ Khoza (Chairperson) (until 31 May 2008)Prof JB Adams (Chairperson)Dr DSS LushabaMs MM Matsabu (until 31 May 2008) Ms VGN Mkaza (until 31 May 2008)Mr DP NaidooMr M SirenyaProf EM Stack (until 31 May 2008)
WRC (in attendance)Ms R Frank
Committee Secretary:27 May 2008 – Ms A Jansen
Terms of ReferenceEstablish a tool for the evaluation of the performance of •the organisation and the CEOAssess the performance of the organisation and the CEO using •the above-mentioned toolDetermine performance bonuses for the CEO and the •organisation based on the outcome of the performance assessment and other criteria
Meetings27 May 2008
WRC
Ann
ual R
epor
t 200
8/09
22
Research Policy and Strategy Committee of the Board (RPS Committee)MembersMs MM Matsabu (Chairperson) (until 31 May 2008)Mr DP Naidoo (Chairperson)Prof JB AdamsMr P CrossMs ZB MathenjwaDr DJ MerreyMr M Sirenya (until 31 May 2008) Dr R Kfir (CEO)
WRC (in attendance)Dr HG Snyman
Committee Secretaries:19 January 2008 – Dr HG Snyman25 February 2009 – Ms A Jansen
Terms of ReferenceThe RPS Committee of the Board will:
Review and advise on the alignment of research goals and plans •with national policy and priorities and the mission of the WRCAdvise the Board on compliance with the Water Research Act and •other relevant legislation governing the use of public funds for research and developmentAdvise on overall research priorities of the WRC•Advise on capacity-building initiatives, including the support of •students through WRC research projectsAdvise, review and monitor the development and effectiveness of •the implementation of the WRC’s research management policies, procedures and practices Advise on procedures guiding the development of annual •business plans for the WRC and each of the KSAsAdvise on procedures governing research funding allocation and •the evaluation of research outcomes Advise on policies and procedures regarding knowledge •dissemination and applicationReview KSA business plans and provide the Board with a •recommendation for approval (with special emphasis on KSA research portfolios)Evaluate the outputs, outcomes and impact of WRC-funded •researchReview and monitor the WRC’s drive to transform the South •African water-centred knowledge base, i.e., research capacity buildingMonitor the scope and effectiveness of the internal audit •function and the ethical conduct of the WRC from the research management perspective
Meetings19 January 200825 February 2009
Business Address Postal AddressMarumati Building491 18th AvenueRietfontein Pretoria0084
Private Bag X03Gezina0031
Exec
utiv
e Re
port
23

Achievements During 2008/09 the WRC has strengthened its role as a water-centred knowledge hub. This was achieved through investment in the creation of new knowledge and the sharing, application and dissemination of water-centred knowledge, and through the provision of leadership and strategic direction regarding water research and development in South Africa.
Striving Towards Research Impact During 2008/09 the WRC continued to serve South Africa’s government, reporting through its Board to the Minister of Water Affairs and Forestry, its shareholder, and the Department of Water Affairs and Forestry (DWAF). Knowledge created through the WRC funds strongly supports DWAF’s overarching objective, i.e., water for economic growth and sustainable development.
The knowledge created via the WRC’s investment in research aimed to create a long-term impact in areas such as water and society, water and the economy, water and the environment, and water and health. These areas are closely linked to the DWAF’s objective of water for economic growth and sustainable development.
In the area of Water and Society the research addressed the understanding of social dynamics in the water sector and people’s needs for and views of water. Specific studies sought to have an impact on:
People’s participation in water management and •decisions about water Ways of using water for transformation and social justice•New approaches which will enable water users at all •scales and in different localities to meet the challenges of utilising water as a shared and scarce resourceSustainable ways for the provision of water services •which are socially acceptable, affordable and available to all Access to water for the poor and disadvantaged •members of society (e.g. sufferers of HIV/AIDS)
Water and the Economy included research conducted with the view of water being an economic instrument and/or an economic good. Research explored how water issues could potentially provide an engine for economic growth, but could also be a potential economic burden. The research aimed to demonstrate the applicability of economic principles in the water field and to provide convincing evidence as well as sound knowledge and support to water management institutions and implementing authorities. Studies attempted to assess the role of water in economic development, to use economic instruments for improved management of water and to study complex water-economy systems. More specifically, research focused on the value of water to different sectors of the economy, the economic advantages and disadvantages of water resource development, the use of economic instruments to effect behavioural change regarding water utilisation and the use of economic instruments to promote equitable and efficient water allocation and distribution.
Linked to economic and social issues is the issue of health. Diseases due to poor water quality or lack of sanitation and
hygiene are known to be costly, often creating both an economic and a social burden. Research carried out by the WRC addressed the issues related to Water and Health. Research aimed at improving water quality and hygiene practices in order to save lives and reduce the cost and effort in treating diseases and their symptoms. Based on new knowledge on the origin, survival and persistence of microbial, biological and chemical agents that may pollute water and may affect human health, improved treatment technologies and quality guidelines were suggested. Research focused on the development and utilisation of methodologies to identify and quantify the occurrence of pathogens and contaminants in water, as well as risk assessment and epidemiological studies. Studies addressed resource protection, sanitation and waste management, drinking water quality and public health and hygiene.
Since water forms a part of the overall environment, it is important that the research will address the links between water, air, soil, biota and other spheres. Issues such as pollution, climate change and biodiversity are all parallel issues relating to water. Research carried out by the WRC addressed the above issues in an integrated manner. This is reflected in the impact area focusing on Water and the Environment, which aimed to improve the understanding of linkages between the natural environmental components (atmospheric, marine, terrestrial, aquatic, subterranean) within the hydrological cycle as well as how these link with the anthropogenic environmental components (developed infrastructure and other land uses). The research in this impact area seeks to establish and apply best practices in mitigation of damage to the water environment. The impact area contributes to achieving a situation where our governance systems and our understanding of environmental processes within the hydrological cycle are aligned to support sustainable water management that meets the needs of society.
Impact studiesDuring the year under review the WRC has engaged a number of researchers to study and qualify the impact of the WRC-supported research projects on the water sector. The studies address research programmes, which often represent a number of projects undertaken by various research organisations for a number of years. Some of these studies include the assessment of projects where strong collaboration with practitioners and decision makers was evident. This is the second year in which the WRC has undertaken such studies and special emphasis was placed on assessing the impact of research on the social, health and economic issues as well as the sustainability of the environment.
Examples of such studies are:
Research on drinking water quality guidelinesThis study considered and evaluated all research projects and products (defined as: reports, guidelines, publications, techniques, methodologies, software, hardware, equipment, plant and registered patents) developed by the WRC since 1971 which relate to domestic water quality. The impacts were classified according to economic, social, environmental and health aspects, depending on how and
WRC
Ann
ual R
epor
t 200
8/09
24

in what context the guidelines were utilised. Preliminary conclusions show that the guidelines have had a broad array of economic impacts. The guidelines are widely used as training material at tertiary institutions, water services providers, and water consulting firms as well as by the general public. The guidelines aim to enhance skills within the South African water sector. They have also contributed to water treatment equipment sales for municipalities that have been experiencing water problems, as well as, to a large extent, the setting up of water treatment plants in certain areas. Individuals trained through the use of WRC material have experienced personal benefits, in the form of improved salaries and job opportunities. The WRC guidelines have impacted South African society from a social perspective, and there are also examples where failure to use the guidelines has resulted in social costs. In some instances where water authorities have failed to use the guidelines poor water quality has impacted negatively on people’s health. Mine-water related researchIn this study the impact and benefits of WRC-funded mine-water related research were assessed. This included research conducted from 1990, when the WRC became extensively involved in this area of research, onward. The study provides a concise assessment of the impact (to date and potential future) of WRC mine-water related research investments and products on socio-cultural, economic, political, technical and environmental aspects of South African society. The history of mine-water research is also sketched, highlighting the change in focus over time. A number of case studies are reported as examples of the benefits or cost savings that are accruing to the aforementioned aspects of South African society. As far as possible these are expressed in monetary terms.
Environmental water requirementsThis impact study addresses how the WRC’s funding support affected policy and practice in the field of environmental flows. It should be noted that this is an important research field which supports not only the concept of integrated water resource management (IWRM) and water resource sustainability but also the right of the environment to water. The study addressed the impact of research in this area on social, economic and health issues. It showed that the WRC played, and is still playing, a critical role in this field. Knowledge created through WRC research was widely used in the writing of the South African National Water Act (No.36) of 1998, especially where the ecological reserve and other environment-related policies in South Africa are concerned. Research results were also utilised in other African countries such as Tanzania. South Africa is globally known as a pioneer in this field and The Building Block Methodology report (WRC Report No. 576/1/98, which was later updated as TT 354/08) was the first report in this field and is one of the most well-known and used WRC reports worldwide.
Water administration system The Water Administration System (WAS) has been developed through WRC support and has been applied over the past 20 years to reduce losses with river and canal distribution of water on irrigation schemes. It consists of crop water
use; water order; water release; water accounts; and water administration modules. The WRC undertook a study addressing the environmental, economic and social impact of the WAS. The study quantified the different dimensions of the impacts on water saving which have been achieved with implementation of WAS on all major commercial irrigation schemes in South Africa.
The WRC’s role in building capacity in the groundwater sector This study aimed to confirm that the WRC is a major vehicle for capacity building in the water sector in South Africa, using the example of the groundwater resources management field, which has an impact on the whole African continent. The WRC places strong emphasis on building research capacity and equity by increasing the number of students and researchers conducting water research. The study assesses the state of groundwater resources management (GWRM) capacity in South Africa at a framework level, and the impact of WRC-funded groundwater research on GWRM. The results will further contribute to the development of a vision and way forward for future GWRM capacity building through the WRC together with other strategic partners. Preliminary results indicate that the ongoing R&D investment by the WRC in specifically groundwater and related fields presents a major driver for groundwater capacity building in South Africa and beyond. The WRC provides South Africa with a good base of future researchers as well as a source of skilled human capital for other institutions within the water sector. The weaknesses identified in the capacity building process appear to be amenable to positive change if there is strategic and greater cooperation within the sector.
Investing in the Creation of Water-Centred Knowledge Investing in the creation and sharing of knowledge During 2008/09, the WRC continued to support the water sector and all its relevant institutions and partners. This was achieved by providing them with knowledge aimed at informing their decision-making processes, improving their monitoring and assessment tools, and making available a range of new and improved technologies related to water resource management and the provision of water and sanitation services. The WRC continued to address the issue of climate change and the linked phenomena of extreme events. Research funded by the WRC will support the development of adaptive and mitigating strategies which will ensure the future sustainability of the country’s water resources and services.
The research portfolio for 2008/09 was set on the basis of the WRC’s strategic plan. The WRC continued to invest in the creation of knowledge via its four main key strategic areas (KSAs). These areas include Water Resource Management, Water-Linked Ecosystems, Water Use and Waste Management, and Water Utilisation in Agriculture. In general, the portfolio as planned for the year under review was well-received by the various stakeholders. These KSAs are supported by the Water-Centred Knowledge KSA. This structure continued to form the core operating framework
Exec
utiv
e Re
port
25

for WRC-funded R&D and was further consolidated during the year.
Water Resource Management – Research carried out by this KSA aimed at ensuring that the water resources of South Africa are protected, utilised, developed, conserved and managed to achieve environmental, social and economic sustainability. The research aimed at developing a scientific understanding of the hydrological cycle (and inter-linkages) in order to promote a systematic assessment of the quantity and quality of water available for development in South Africa; building up appropriate quantitative understanding, tools and adaptive strategies for managing the impacts of extreme climatic events (floods and droughts) due to global warming and human-induced impacts on water resources (including an understanding of the impact on human health); providing control measures for improving the prevention, mitigation and control of pollution of water resources and supporting and improving policy reforms for promoting equitable, efficient and sustainable conservation and allocation of water resources among competing needs. During 2008/09 the WRC invested in research projects in four research thrusts in this KSA including water resource assessment and planning; management of natural and human-induced impacts on water resources; water resource protection and water resource institutional arrangements.
Water-Linked Ecosystems – This KSA invested in the creation of knowledge aimed at enabling good environmental governance and ensuring the utilisation and sustainable management of water-linked ecosystems in our water-scarce country during a time of demographic and climate change. The research developed the understanding of the ecological processes underlying the delivery of goods and services and provided knowledge to sustainably manage, protect and utilise aquatic ecosystems. Three main research areas were addressed during 2008/09, including research on ecosystem processes, i.e., the biophysical processes, form and function of ecosystems; ecosystem management and utilisation, including issues such as the ecological reserve; and ecosystem health and ecosystem rehabilitation (rivers and wetlands).
Water Use and Waste Management – This KSA focused mainly on research for the domestic, industrial and mining water sectors. The aim was to proactively and effectively lead and support the advancement of technology, science, management and policy relevant to water supply, waste and effluent management, for these sectors. During the year under review, this KSA supported studies on appropriate technologies for improving the quality and quantity of our water supplies for domestic use, with a focus on water supply and treatment technology serving the urban, rural, large and small systems. Research was conducted on new ways to manage and enhance hygiene and sanitation practices, and on institutional and management issues, with special emphasis on the efficient functioning of water service institutions and their viability. Infrastructure for both water supply and sanitation was included. Waste and effluent, as well as reuse technologies that can support and improve management in the municipal, mining and industrial sectors, were also addressed and innovative as well as integrated
solutions for water and waste management in the industrial and mining sectors were studied. The research areas included water services (institutional and management issues); water supply and treatment technology; sustainable municipal wastewater and sanitation, industrial and mine-water management; and sanitation and hygiene education.
Water Utilisation in Agriculture – Research carried out in this KSA aimed at increasing household food security and improving the livelihoods of people on farming, community and regional levels through efficient and sustainable utilisation and development of water resources in agriculture. More specifically, the research focused on increased biological, technical and economic efficiency of water use, the reduction of poverty through water-based agricultural activities, the increases in profitability of water-based farming systems and the sustainable use of water resources. All agricultural sub-sectors were addressed including irrigated and dry-land agriculture; woodlands and forestry; grasslands and livestock watering and aquaculture. During 2008/09, research was conducted in five main areas including water utilisation for food and fibre production; fitness-for-use of water; water utilisation for fuel-wood and timber production; water for poverty reduction and wealth creation in agriculture; and reclamation and protection of water resources in agriculture. Research projects specifically addressed the needs and requirements of homestead food gardens and smallholder crop production in rural communities.
Supporting research projects During the year under review, the WRC supported 294 research projects, of which about 78% (230 projects) were active projects (ongoing and new) and about 22% (64 projects) were finalised. The active projects comprised 168 ongoing projects and 62 newly initiated projects that commenced during 2008/09. The various mechanisms of funding included both non-solicited projects, accommodating projects within the broad research strategy of each KSA, and solicited projects, where research projects are developed in accordance with clear terms of reference, aimed at solving specific problems. The WRC supported 39 solicited projects, which translates to about 17% of active projects. During the year 22% of the projects (64 projects) were finalised.
There was a slight increase (3%) in the total number of projects due to an increase in the number of ongoing projects, which increased by about 6%. There was a decrease (7%) in the number of new projects initiated during the year as well as a reduction in the number of active solicited projects by about 48%. This is an indication of an active research cycle where multi-year projects are in progress and where many of the previously solicited studies have been concluded.
Financial year 2008/9 2007/8Total No. of projects 294 286
No. of active projects 230 216
No. of new projects 62 67
No. of finalised projects 64 70
No. of active solicited projects 39 75
WRC
Ann
ual R
epor
t 200
8/09
26
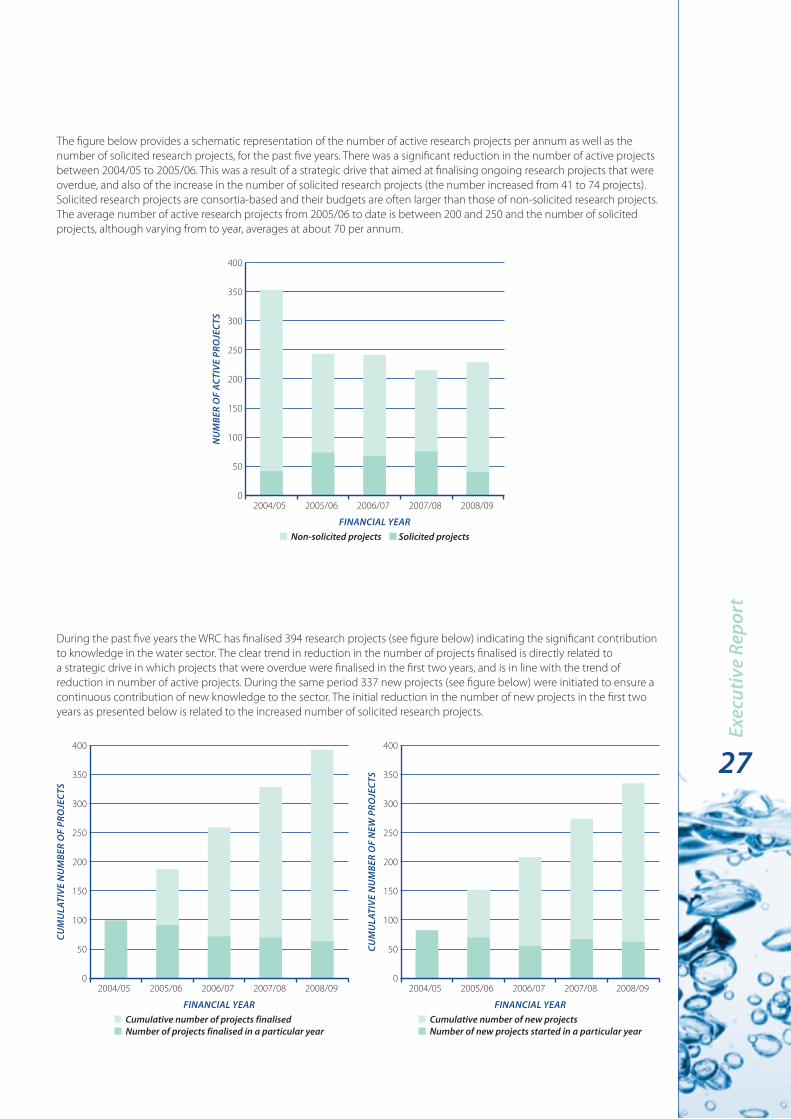
The figure below provides a schematic representation of the number of active research projects per annum as well as the number of solicited research projects, for the past five years. There was a significant reduction in the number of active projects between 2004/05 to 2005/06. This was a result of a strategic drive that aimed at finalising ongoing research projects that were overdue, and also of the increase in the number of solicited research projects (the number increased from 41 to 74 projects). Solicited research projects are consortia-based and their budgets are often larger than those of non-solicited research projects. The average number of active research projects from 2005/06 to date is between 200 and 250 and the number of solicited projects, although varying from to year, averages at about 70 per annum.
400
350
300
250
200
150
100
50
02004/05 2005/06 2006/07 2007/08 2008/09
FInAnCIAL YEAR Cumulative number of new projects number of new projects started in a particular year
CuM
uLA
TIvE
nu
MBE
R O
F n
EW P
ROjE
CTS
400
350
300
250
200
150
100
50
02004/05 2005/06 2006/07 2007/08 2008/09
FInAnCIAL YEAR Cumulative number of projects finalised number of projects finalised in a particular year
CuM
uLA
TIvE
nu
MBE
R O
F PR
OjE
CTS
400
350
300
250
200
150
100
50
02004/05 2005/06 2006/07 2007/08 2008/09
FInAnCIAL YEAR non-solicited projects Solicited projects
nu
MBE
R O
F AC
TIvE
PRO
jECT
S
During the past five years the WRC has finalised 394 research projects (see figure below) indicating the significant contribution to knowledge in the water sector. The clear trend in reduction in the number of projects finalised is directly related to a strategic drive in which projects that were overdue were finalised in the first two years, and is in line with the trend of reduction in number of active projects. During the same period 337 new projects (see figure below) were initiated to ensure a continuous contribution of new knowledge to the sector. The initial reduction in the number of new projects in the first two years as presented below is related to the increased number of solicited research projects.
Exec
utiv
e Re
port
27

Utilisation of funds by the various KSAs The percentage utilisation of research project funds by the KSAs during 2008/09 indicates that about 47% (in comparison to about 44% for 2007/08) was invested in projects that focused on water resources (including water-linked ecosystems) and about 53% (compared to 56% for 2007/08) on projects that focused on water utilisation (including effluent treatment and management, as well as agriculture). This is based on the actual amount paid out as well as accrued for research projects during the financial year under review. The allocation of about 50% of the fund to issues related to resource management and 50% to water utilisation is a strategic allocation based on the medium- to long-term needs for research.
Distribution of research project funds among KSAs – planned vs. utilised funds (2007/08 data in brackets)
KSA Planned % allocation of fundsPercentage of fund utilised for
research projectsWater Resource Management 27 (31) 31 (30)
Water-Linked Ecosystems 15 (14) 16 (14)
Water Use and Waste Management 37 (31) 34 (31)
Water Utilisation in Agriculture 21 (24) 19 (25)
The actual utilisation (as a percentage of total funds) of funds by the KSAs agrees almost fully with the planned allocation, and the deviations observed do not exceed 4%. The overall investment in research projects (knowledge creation) was about R88.7m. This amount reflects a 24% increase from the previous year (R71.3m. during 2007/08).
Total investment in the support of knowledge creation, sharing and dissemination amounted to R115.7m. This represents an increase of 17% from the previous year (R99.2m. total investment was reported in 2007/08). This investment includes about R4.5m. for the Water Information Network (WIN-SA), R3.3m. for the Framework for Education and Training in Water (FETWater), and other income leveraged for research projects during the year under review. Both the investments in research projects and in research support, expressed as a percentage of total expenditure, were close to the set budgeted ratios and almost identical to that of previous years. The ratio addressing funding of the creation of new knowledge (research projects only) is identical to that of the previous year but slightly better than the budgeted percentage of 63%. The ratio for research support is also similar to that of the previous year, with only a 1% decrease but in line with the budgeted percentage of 75%.
Research funding – Business efficiency indicators (budgeted and actual) 08/09 (budgeted*) 08/09 (actual) 07/08 (actual)
Research project funding as % of total expenditure** 63% 65% 65%
Research support (research projects and support and technology transfer) as % of total expenditure 75% 75% 76%
*Not including transfer of unutilised research funds **Expenditure does not include provisions for bad debts and leave, bad debt write-offs, pension valuations and non-cash amounts
Leveraging income for the creation, sharing and dissemination of water‑centred knowledge During the year under review the WRC continued to leverage levy income by striving to obtain funds from other sources to support water research. During 2008/09, this drive was highly successful. The WRC income originating from sources other than the levy for 2008/09 amounted to R16.1m. Leveraged income included funds allocated to a number of KSAs for direct support of research projects and funds provided for capacity building, knowledge sharing and dissemination (e.g. WIN-SA and FETWater). Leveraged income was obtained from both local and international sources, where the main source of income was due to support by various government departments for specific research and other knowledge-sharing projects. Sources of income other than the levy for 2008/09 amount to about 17% of the total income.
Income indicatorsIndicator Budget 08/09 Year-end (actual)Levies as percentage of total income 84% 83%
Other sources of income as percentage of total income 16% 17%
Leveraged income as a percentage of other income* 71% 68%
*Leveraged income includes all other income with the exception of interest received
Water-linked Ecosystems
16%
Water Resource Management
31%
Water use and Waste Management
34%
Water utilisation in Agriculture
19%
WRC
Ann
ual R
epor
t 200
8/09
28

Building Capacity The WRC aims at providing South Africa with future researchers as well as a source of skilled human capital for other institutions within the water sector. This is done by accommodating students conducting water research through the various projects supported by the WRC. During the year under review, the WRC continued to place strong emphasis on building research capacity in South Africa as well as supporting a number of related capacity building initiatives in Africa. In many areas of research supported by the WRC, it is evident that students who participated in earlier WRC projects are currently leading WRC-funded research projects and are serving as members of steering committees as well as reviewers of new proposals.
Capacity building trendsAs indicated below the number of students and the percentage of disadvantaged students for the past five financial years, i.e. from 2004/05 to 2008/09, reflect a clear pattern of increase although numbers have varied from year to year. The number of students varies from about 400 to 600 per annum while the number of historically disadvantaged (HD) students ranged between 300 and 400 per annum. The figure below indicates the cumulative number of students trained with the support of the WRC for the past five years. As indicated in the figure about 3 000 students, of which close to 2 000 or about 65% are historically disadvantaged, were trained in the past five years.
700
600
500
400
300
200
100
02004/05 2005/06 2006/07 2007/08 2008/09
FInAnCIAL YEAR number of other students number of disadvantaged students
nu
MBE
R O
F ST
ud
EnTS
3500
3000
2500
2000
1500
1000
500
02004/05 2005/06 2006/07 2007/08 2008/09
FInAnCIAL YEAR Cumulative number of other students Cumulative number of disadvantaged students
nu
MBE
R O
F ST
ud
EnTS
Exec
utiv
e Re
port
29

Capacity building in 2008/09During the year (2008/09) the WRC continued to excel in its support to students, with special emphasis on historically disadvantaged students. Currently about 633 students are supported by WRC projects, of whom about 61% are from disadvantaged backgrounds. This is a slight decrease (5%) in the number of students and also a slight reduction in the percentage of historically disadvantaged students as compared to the previous year. This indicates that although the WRC’s strategy to improve capacity building through its research projects is successful, the difficult time facing the science and technology and higher education sectors is reflected in the slight decrease in student numbers. Of all the institutions supporting students, universities are clearly leading with 447 students, of whom 260 or 58% originate from historically disadvantaged backgrounds. Although all South African universities support students through WRC projects, the University of KwaZulu-Natal exceeded all with 89 students, followed by the University of Pretoria with 62 students, 55 students at the University of Cape Town, 51 at the University of Stellenbosch, 36 at the University of the Free State and 24 at the University of the Western Cape. Science councils supported 53 students, with the CSIR supporting 35 students, of whom 73% are from historically disadvantaged backgrounds.
There is also a clear pattern of an increased number of students involved in projects led by consultancy groups. Consultancies involved 131 students of which 64% were from historically disadvantaged backgrounds. The increase in the number of students in non-academic institutions is encouraging as these students represent on-the-job continuous development and/or new skilled human capital for the sector. The increase in the number of students is also a result of the WRC strate gy of building research networks and research consortia.
Number of students involved in WRC projects
Institution
no. of disadvantaged
studentsTotal no. of
studentsARC 10 14
Althydro CC 3 3
Anchor consulting 1 3
Aquagreen Consulting 2 5
Asset Research 4 12
AWARD 2 4
Cape Peninsula University of Technology 10 12
Central University of Technology, Free State 1 2
Conningarth Economists 5 5
CPH Water 1 1
CSIR 25 35
DH Environmental Consulting 2 3
Durban University of Technology 8 9
Emanti Management 4 4
Geoscience 4 4
GEOSS 1 2
Golder Associates Africa 7 7
Groundwater Africa 0 1
Hlathi Development Services 5 5
Monash South Africa 2 5
Mvula Trust 1 1
Nelson Mandela Metropolitan University 5 9
Nemai Consulting 1 1
Ninham Shand 1 6
Partners in Development (Pty) Ltd 3 5
Pegram & Associates 0 3
Process Optimization and Resource Management (PRO&RM) 2 2
Pulles, Howard & De Lange 2 2
Rhodes University 12 20
Rural Integrated Eng 9 12
Sarah Slabbert Associates 1 5
Sigma Beta 7 11
Source Strategic Focus 3 3
SRK 1 2
Sustento Development Services 0 2
The Impact Free Water Group 4 5
Tshwane University of Technology 14 14
Umgeni Water 3 3
Umhlaba Consulting Group 2 2
University of Cape Town 28 55
University of Fort Hare 13 13
University of Johannesburg 7 14
University of KwaZulu-Natal 48 89
University of Limpopo 2 2
University of Pretoria 34 62
University of Stellenbosch 18 51
University of the Free State 19 36
University of the North-West 4 8
University of the Western Cape 21 24
University of the Witwatersrand 7 18
University of Venda 9 9
UWC consortium 3 3
Water for Africa 3 5
Total 384 633
WRC
Ann
ual R
epor
t 200
8/09
30

Capacity building initiativesIn addition to its support for the training of students the WRC has initiated and supported a number of national capacity building initiatives. These include support to national and local government as well as the development of new training material for different levels of learners and for academic institutions. Examples of such initiatives are given below.
Technical Assistance Centre The WRC is leading the establishment of a Technical Assistance Centre (TAC) to assist rural water service providers. The centre will provide technical support to water provision as well as sewage treatment. To date all preparatory work for the establishment of the structure, facilities and human resources has been completed and a number of positioning/marketing initiatives have been launched. These comprised presentation of the TAC during workshops and training sessions (e.g. workshops held at the Water Institute of Southern Africa (WISA) Biennial Conference 2008), development of information packages, provincial launches in the Eastern Cape and the Western Cape, as well as the compilation of an implementation plan for the TAC in these two pilot provinces for 2009/10. In Phase Three, which has already commenced, the actual implementation of the abovementioned plan is taking place. A number of water service providers and water services authorities are being identified and selected in each of the two pilot provinces, for applying the TAC activities, support mechanisms and tools, in order to improve the compliance, conditions, service delivery and sustainability of the water and wastewater treatment plants within these municipalities.
The Framework for Education and Training in Water (FETWater)The WRC continues to act as the DWAF implementing agent for FETWater. This is a key national capacity-building initiative aimed at the development of competencies and capacity regarding water resource management. This is a joint UNESCO, Belgian and South African programme which is currently in its second phase. During the year under review, phase II of this programme has progressed well under the custodianship of the WRC. The steering committee assessed the progress that the programme and its networks have made. The annual conference took place in February 2009 at Magalies Lodge in North West, where all seven networks presented their reports and business plans. During the year a total of 84 people were trained by FETWater; 57 of these were historically disadvantaged individuals and 31 were women.
Water Information Network (WIN‑SA)The WRC serves as the implementing agent for DWAF for the Water Information Network (WIN-SA). WIN-SA is aimed at knowledge sharing and capacity building for local government. Building competence at local government level is critical. During the period 2008/09 WIN-SA continued to generate knowledge targeted at local government. Partners such as the South African Local Government Association (SALGA) and the Department of Provincial and Local Government (DPLG) contributed to the generation of knowledge and strengthening of content by collaborating with WIN-SA on lessons such as the DPLG Series and the
Benchmarking Initiative. A Regulation Bulletin was also released as a new product in collaboration with the DWAF regulation unit. The WIN-SA portal and mailing lists played a critical role in widening information exchange and dissemination. WIN-SA has established strong links with the Cities Network to support and strengthen its knowledge management strategies and interventions. During the year under review WIN-SA has undergone expert assessment and review. The assessment, which was positive overall, also came up with specific recommendations on how to strengthen WIN-SA as a network.
During 2008/09 the Network produced and successfully organised:
15 Lessons Series (including DPLG Lessons) covering •issues such as water for sustainable growth and development, National Benchmarking Initiative, the citizen’s voice in water services delivery, water conservation/water demand management, asset management, etc.4 Field Notes (focusing on HIV/AIDS mainstreaming •in Ekurhuleni Metro, gender mainstreaming, drinking water quality, and sector collaboration A workshop on ‘Integrated Resource Management in the •Context of Water for Growth and Development’ among local governments in the Northern Cape A video on ‘water for growth and development’ was •developedNorth West learning journeys on water conservation/•water demand management Amathole District Municipality – peer review of •performance as water service authority
IWA‑SA/WISA Young Water Professional Forum The WRC through the dedicated activities of one of its research managers, Dr Burgess, who is herself a young water professional, is leading the establishment of a joint International Water Association (South Africa) and Water Institute of Southern Africa (IWA-SA/WISA) Young Water Professionals Forum. This forum will address the needs of the young water professional in terms of professional growth and building their track record.
South African Youth Water Prize The WRC continues to support the South African Youth Water Prize. The WRC Public Relations and Communications Officer and the Intellectual Property (IP) Manager assisted DWAF with this initiative. The IP Manager was tasked to identify any possible IP stemming from the applications and also attended the South African award presentation at Vredenburg High School on 15 August 2008. The IP Manager continues to liaise with the scholars.
Courses and trainingDuring the year under review, special emphasis was given to the development of course and training material. Examples include:
A Manual for Rural Freshwater Aquaculture• which was compiled by the Rural Fisheries Programme, Department of Ichthyology and Fisheries Science, Rhodes University, as part of a WRC-initiated research project on revitalisation
Exec
utiv
e Re
port
31

of state hatcheries in provinces and training of technical staff, as well as extension officers, to support profitable aquaculture for improved rural livelihoods.A training course (workshop) on beetle identification, •based on the WRC publication TT320/07 (Guides to the Freshwater Invertebrates of Southern Africa Volume 10: Coleoptera) was held at the Albany Museum in November 2008. Coleoptera (beetles) are a very important but difficult to identify component of the aquatic biota, and this course trained about 20 people in the basics of coleopteran identification.The WRC hosted, sponsored and presented at •a national training seminar on risk assessment, risk management and water safety planning in Southern Africa, held from 26 to 27 November 2008. This is an international interaction to import knowledge from the World Health Organisation and other bodies to the Southern African context.IWRM training• was jointly hosted with the University of the Western Cape. The WRC staff members were resource persons on areas relating to water governance, climate change and groundwater. WRC reference materials were widely distributed during the course (29 September to 4 October 2008).
Research on capacity buildingThe WRC concluded its study on water research capacity. The study reflects on the major capacity problems facing the research community in South Africa and provides observations regarding specific capacity issues in various areas of water research.
Building capacity in AfricaThe WRC’s capacity-building activities continue to address support for Africa. Examples are:
NEPAD – Network of Centres of Excellence for Water •Research in Africa – This is an ongoing dedicated activity, where the WRC coordinated and led the process of establishing the network in cooperation with the French ‘Institute of Research for Development’ (IRD). During the year under review a framework was developed to determine criteria to select those organisations that would act as centres of excellence. The process of selection has since been completed. Water Research Fund of Southern Africa (WARFSA)• – The WRC has been involved in this research capacity programme for a number of years. Currently one staff member serves as a Board Member of WARFSA. WARFSA was established with the purpose of building research capacity among regional institutions and individuals as well as promoting the utilisation of research results in the planning and management of water resources in the sub-region. The WRC coordinated the logistics of the WARFSA Board meetings.IAP Africa• – The WRC is supporting the Academy of Science of South Africa (ASSAf ) in the Inter- Academy Programme for Water which aims to build capacity for water research. The WRC supports all IAP activities in Africa. During the year under review, the WRC organised and facilitated a workshop on Regional Collaboration in Hydrology and Hydropower (Pretoria, June 2008). The workshop was attended by science academy participants
from several African countries and was followed by a field trip. Of the 30 participants, 11 were from other African Countries (Uganda (2), Ghana, Tanzania, Zimbabwe, Kenya, Botswana, Namibia, Lesotho (2) and Mozambique).
Building internal capacity Internal Open Day, Witbank, 14 October 2008 – The WRC staff visited the Emalahleni Water Reclamation Project in Witbank, a joint venture between Anglo Coal and BHP Billiton. The WRC also visited an Anglo Coal open-cast coal mine, as well as a project sponsored by the WRC where the possible use of lime-treated acid mine drainage (AMD) for irrigation of agricultural crops was investigated.
Enhancing Knowledge disseminationEffective dissemination of water-centred knowledge created via research projects is an ongoing challenge. The WRC is continuously searching for and applying various mechanisms and tools that support effective knowledge sharing, dissemination and transfer. In addition to research and technology transfer reports, many workshops and open days were held. During the year under review the WRC focused on improving current mechanisms and introducing creative knowledge dissemination and sharing tools.
During 2008/09 the WRC finalised 64 research projects and published 108 research reports which were distributed widely within the water sector. In addition to publishing research reports, the WRC also published about 35 research briefs.
Open days, practical field visits and technical workshops The WRC held a number of open days aimed at enhancing knowledge transfer. These open days were either subject-specific or of general nature. Examples are:
The WRC held Open Days at Struisbaai, Western Cape, •on 28 and 29 May 2008 to demonstrate a new robust small water-treatment system employing membrane technology. The first day was for the benefit of the local community while the second day coincided with an Institute for Municipal Engineers gathering. The crossflow micro-filter technology was promoted. The WRC together with SALGA, DWAF and eThekwini •Municipal Water Supply and Sanitation (EMWS) demonstrated issues related to the challenges associated with emptying of ventilated improved pit (VIP) toilets. This was done as part of Sanitation Week hosted by the Minister of Water Affairs and Forestry in Durban on 29 May 2008.The WRC arranged a field visit for officials and •researchers to view piloting of greywater management alternatives in the informal settlements of the Western Cape, on 28 and 29 June 2008. This aimed to share knowledge from progress with ongoing research.Celebrating ‘Knowledge for Growth and Development’, •2 December 2008, Montana Park, Pretoria. The WRC invited the water sector leaders and academia to celebrate ‘Knowledge for Growth and Development’. The keynote speaker was Prof B O’Connell, Vice-Chancellor of the University of the Western Cape.
WRC
Ann
ual R
epor
t 200
8/09
32
Technical workshops A number of technical workshops were held by the various key strategic areas of the WRC. Some of the workshops aimed at knowledge sharing and transfer (training), while other workshops were aimed at developing terms of reference (ToRs) for future solicited research projects. The following are examples:
1. Lightweight VIP Structures for DWAF, SALGA, the Minister’s Office and DPLG in April 2008 at the University of Pretoria. The objective was to expose decision makers to the research being undertaken and its relevance to current challenges with basic sanitation.
2. Three workshops were conducted on Light Non-Aqueous Phase Liquids with the Institute for Groundwater Studies, during April 2008 at the WRC, Durban and Cape Town.
3. The Criteria for the Success of Women in the Water Sector. This workshop was held at the WRC in April 2008 in collaboration with Palmer Development Group (PDG).
4. Socio-Economic Impacts of Global Climate Change workshop was held at the WRC during May 2008.
5. The Applicability of Modelling Techniques in the Aquatic Environment with Specific Respect to Algal Blooms, a three-day workshop, was jointly organised by the WRC, North West University and DWAF, at Roodeplaat, July 2008.
6. Hydrological Decision Support Framework (HDSF) workshop was held in May 2008 at the School of Bioresources Engineering and Environmental Hydrology, University of KwaZulu-Natal, Pietermaritzburg.
7. Bioassay Toolbox, a workshop on the EDC bio-assay toolkit which was initially developed in collaboration with the GWRC (Global Water Research Coalition), was held in June 2008 at the School of Public Health, University of Pretoria.
8. Sustainable Urban Drainage workshop was held in June 2008, in Cape Town.
9. Development of comprehensive Fate and Transport Model of Micro-Organisms in Groundwater was held in June 2008 at WRC, Pretoria.
10. A joint workshop with WITS University on Framework to Regulate Competencies of Water Services Managers was held in August 2008 at WITS.
11. The Effects of Stream Flow Regulation / Manipulation on Invertebrate Hosts of Malaria, Bilharzia and Liver Fluke Disease was held at the WRC, August 2008.
12. A workshop was held together with the Inkomati CMA to test the learning organisation strategy, in September 2008, Nelspruit.
13. A workshop was held at Ninham Shand to canvass inputs to the Lowest Appropriate Levels for Decision Making project in October 2008.
14. A workshop on the Lowest Appropriate Level for Governance was held in partnership with the University of the Western Cape in November 2008.
15. Case study of the Olifants River for a Framework and Manual for the Evaluation of Aquatic Ecosystems Services for the Resource Directed Measures was held in November 2008 at the WRC.
16. A Diatom Collection workshop was held at the WRC in December 2008 to negotiate the transfer of ownership of the diatom collection from the CSIR to the South African Institute for Biodiversity (SAIAB).
17. The South African Handbook on Hydraulics workshop was held at Stellenbosch University in February 2009.
18. Methodology for Near-Real Time Spatial Estimation of Evaporation workshop was held at the University of KwaZulu-Natal in February 2009.
19. The following workshops were organised, presented, chaired and discussions recorded as input towards the development of the terms of reference for new solicited research projects. Workshops were attended by a range of stakeholders from universities, science councils, government departments and non-governmental organisations. Workshops held for the development of ToRs for solicited projects included:
• EmpowermentofWomeninRuralAreasThroughTenureSecurity and Skills Training for Gender Equity and Poverty Reduction (May 2008, Pretoria)
• Co-operativeGovernanceinFoodValueChainsinRain-FedAgriculture to Include Emerging Farmers in the Mainstream of the Economy (May 2008, Pretoria)
• AdaptivePracticesandTechniquesinAgriculturetoReduceVulnerability of Households/Farms to Climate Change (May 2008, Pietermaritzburg)
• WaterUseandEconomicValueofBiomassofIndigenousTrees under Plantation Conditions (May 2008, Pretoria)
• ImpactsofMicro-Organisms,ParasitesandChemicalsonFood Safety (May 2009, Pretoria)
• WaterUseofCropsandLandSuitableforBio-FuelProduction (June 2008, Pretoria)
• DrainageofDegradedLandandGISMappingtoMonitorthe Status of Salinisation and Water Tables on Irrigated Land (June 2008, Pretoria)
• ImpactofWastewaterDisposalbyWineriesonSoils,CropGrowth and Product Quality (May 2008, Stellenbosch)
Exec
utiv
e Re
port
33
New knowledge‑dissemination mechanisms The WRC strives to improve its knowledge dissemination through innovative new mechanisms that are appropriate to the water sector’s dynamic environment. This means that in addition to its established dissemination channels such as open days, workshops, research reports, technology transfer reports, publications such as The Water Wheel, Water SA and the Knowledge Review, and the media, the WRC continuously seeks new mechanisms. Examples of such new mechanisms include:
Technical and policy briefsThirty-five briefs (32 technical and three policy) were compiled and printed in 2008. Examples include:
Jatropha curcas• : Measuring the impact of large-scale planting on water resourcesWater quality use allocation•Communities and integrated water resources •managementAn improved soil survey technique for in-field rainwater •harvesting (IRWH)In-field rainwater harvesting (IRWH) adoption on small •farm plotsDeveloping hydraulic modelling tools for ecological •studiesPrevalence of organic pollutants in South African sludge•Biosensors for eco-toxicity testing of water sources•Eutrophication•A cost-benefit analysis manual•Nanotechnology for the treatment of water and •wastewaterGuidelines for the planning, design and operation •of fishwaysFocus on estuary management•
During the year under review the WRC established novel ways to disseminate project briefing notes. The briefs are disseminated in the following way:
A WRC Knowledge Toolbox was launched at the • WISA 2008 Conference in Sun City. The Toolbox is in the format of a file encompassing the WRC briefs. The idea is that future briefs can be added to this file by the owners through downloading and printing from the WRC website. The plan is that all registered participants (who registered during WISA 2008 and at all future events) will be prompted to download the latest information. This will be done once the new WRC website has been launched.
Topic-based brochuresA series of topic-based brochures was initiated of which three have been completed: ‘Drinking Water’, ‘Sanitation’ and ‘Groundwater’.
Knowledge Cafés This initiative is funded by the WRC in collaboration with the University of Pretoria. The WRC organised a series of workshops on water resource management in a Knowledge Café format. The main target groups of these Cafés were students, municipalities, NGOs and the water user sector.
Three workshops were held, in May, October and November 2008, in Cape Town, Durban and Midrand, respectively.
The Knowledge Café concept provides a framework for sharing knowledge and where participants from different parts of society can take an active part in the discussions. This is a creative facilitation technique that allows for synergistic growth of ideas. The Knowledge Café series aims to build equitable stakeholder relationships for the promotion of IWRM. ConferencesThe WRC played an active role in organising and contributing to numerous local, regional, continental and international conferences. The wide scope of participation is illustrated in the following examples:
WISA 2008 – Sun City, 18-22 May 2008The WRC was actively involved and supported the sector-wide 2008 WISA Biennial Conference. Approximately 1 250 delegates attended the WISA 2008 Conference in May 2008. The Conference offered delegates a comprehensive mix of thought-provoking plenary sessions as well as ‘hands-on’ workshops and focused discussions. It is estimated that over 50% of the contributions at the WISA Conference stemmed from WRC-funded work. The WRC was also responsible for co-ordinating and compiling the technical programme for the conference which included about 9 parallel sessions and over 30 workshops. During the conference a number of keynote addresses and other lectures were presented by the WRC and many sessions were chaired by WRC staff members:
The CEO presented the conference keynote address on •Knowledge for Growth and DevelopmentA director presented a keynote address at the • Water for Growth and Development seminarA workshop on the EDC research programme was held •to build awareness on the EDC phenomenon and WRC research programmeA workshop on the • National Laboratory Survey Project aimed to create awareness of the project and discuss current and future work. The needs and recommendations of the sector were discussed and will be included in the project.Development of a Conceptual Framework for Integrated •Water Quality, another WRC project, was presented and discussed. Cognisance was taken of the sector needs and recommendations and will be included in the report.Other workshops were organised, presented and •chaired, and discussions recorded as inputs to develop the terms of reference for new solicited projects such as the Fate and Transport Model of Micro-Organisms in Groundwater
IWA World Water Congress and Exhibition – Vienna, Austria, 7-12 September 2008The WRC actively participated in the IWA World Water Congress and Exhibition. The CEO gave a presentation on the impact of water-centred knowledge and chaired two sessions on water toxicity; five other staff members chaired sessions and presented a number of talks. Mr Bhagwan was invited by the IWA-GDA to give a keynote address on
WRC
Ann
ual R
epor
t 200
8/09
34

sanitation challenges as part of the workshop on sustainable sanitation. Ms Moolman and Dr Snyman delivered poster papers entitled ‘The precautionary principle: Could that be used for EDCs?’ and ‘Management of wastewater sludge in South Africa – Overview of legislative trends’, respectively.
Implementing Environmental Water Allocations – Port Elizabeth, 22-26 February 2009The WRC initiated and organised the international conference on Implementing Environmental Water Allocations (IEWA). This conference was attended by more than 400 delegates from more than 30 countries. Conference proceedings were covered by many major national media entities (television and newspapers). Dr Mitchell chaired the Scientific Programme Committee and Dr Liphadzi served as a session chairperson. In addition, the WRC, DWAF and UNESCO co-hosted the African Regional Workshop on Water Education, as a side event of the IEWA Conference. This workshop was aimed at identifying gaps in water education in order to prepare an appropriate response to the regional needs, and to achieve the objectives foreseen in the strategic plan for the 7th phase of the International Hydrological Programme, in the context of the UN Decade on Education for Sustainable Development. Fifty participants (25 international) attended the workshop.
5th World Water Forum – Istanbul, Turkey, 16-22 March 2009Over 30 000 participants took part in the 5th World Water Forum in March 2009, making it the world’s biggest ever water-related event. Even more impressive than the size of the event, the number of recommendations, proposals, commitments and initiatives made throughout the preparatory process and during the week made this World Water Forum a long-lasting highpoint on the international development calendar. The WRC supported the South African water sector and participated in the event. WRC directors and research managers delivered papers at various sessions. Examples include two presentations by Mr Moseki, one on the development of a toolbox for climate change adaptation action at local/community level and one on adaptation to climate change in the context of indigenous practices. Ms Karar gave a presentation on the institutional aspects of water as a human right. Dr Liphadzi presented a paper on ‘Grasslands as natural water infrastructure in South Africa’ and Dr Snyman presented and participated in the session on ‘Collaborative and problem-solving research in the WASH (Water Sanitation and Hygiene) sector: achieving greater use and impact of research through the learning alliance approach (and other multi-stakeholder approaches)’.
Exhibitions As part of its knowledge sharing and dissemination activities the WRC participated in a number of exhibitions at conferences, symposia and workshops, using these to disseminate information in the form of reports and other publications. Exhibitions in which the WRC participated included:
WISA 2008 Biennial Conference• , 18-22 May 2008, Sun City Public Health Association of South Africa, PHASA 2008 •Conference, 2-4 June 2008, Cape TownInternational Congress of Entomology• (ICE 2008), 6-12 July 2008, Durban
International Water Distribution System Analysis •Conference (WDSA 2008), 17-20 August 2008, Kruger National ParkMunicipal Indaba• , 11-12 September 2008, Birchwood Conference Centre, Gauteng2008 Professor Humphrey Memorial Lecture & Postgraduate •Colloquium, 16 September 2008 at the University of Pretoria, Pretoria Mine Closure 2008• , 13-17 October 2008, at the Indaba Hotel, JohannesburgImplementing Environmental Water Allocations• (IEWA), 23-26 February 2009, at the Feather Market Convention Centre, Port ElizabethAfrican Regional Workshop on Water Education• , 24-25 February 2009, Port ElizabethClimate Change Summit 2009• , 3-6 March 2009, Gallagher Estates, Midrand
Books and special editions of Water SASpecial book publicationThe WRC published a book entitled Rivers and Wetlands of Cape Town: Caring for Our Rich Aquatic Heritage, edited by Cate Brown and Rembu Magoba, in February 2009. The foreword for this book was signed by the Mayor of Cape Town. The CEO of the WRC, Dr Kfir, handed the book over to the Chairperson of the Parliamentary Portfolio Committee on Water Affairs and Forestry, Ms Connie September, on 10 March 2009.
Contributions to booksStaff members of the WRC have contributed to a number of scientific publications. Examples are:
‘Application of economic instruments, tradable •licences and good governance for sustainable water conservation’, co-authored by W L Nieuwoudt, University of KwaZulu-Natal, and GR Backeberg, WRC, was published as a chapter in a book entitled: Sustainable Irrigation: Management, Technologies and Policies II, edited by Y Villacampa Esteve, CA Brebbia and D Prats Rico for WIT Press (ISSN 1743-3541) and accessible through WIT e Library at www.witpress.com.‘South Africa, faecal sludge management and •wastewater sludge management’, authored by HG Snyman, WRC, was published as a chapter in a book entitled: Global Atlas of Excreta, Wastewater Sludge, and Biosolids Management: Moving Forward the Sustainable and Welcome Uses of a Global Resource, edited by R LeBlanc, P Matthews and R Richards, published by the Greater Moncton Sewerage Commission and UN-HABITAT (ISBN 978 92 1 132009-1).
Special editions of Water SAThe peer-reviewed scientific journal Water SA publishes four scheduled editions per year, and special editions are published on request. After 27 years of publishing the journal the first ‘Special Edition’ of Water SA appeared in 2002. A total of seven special editions of the journal have since appeared, averaging about one special edition per year since 2002. The requests for special editions of Water SA have increased. Over the 2008/09 financial year the following three special editions were published:
The HELP Special Edition was published in September •2008 (Water SA 34 (No. 4)) at the request of the
Exec
utiv
e Re
port
35

organisers of the HELP (Hydrology for Environment, Life and Policy) Symposium entitled: HELP in Action: Local Solutions to Global Water Problems – Lessons from the South held at Emperor’s Palace, Johannesburg, South Africa, from 4 to 9 November 2007. The appointed referees selected 14 articles for inclusion in this edition. The guest editor for this edition was Prof. Shahbaz Khan, UNESCO, Paris.The IWRM Special Edition was published in December •2008 (Water SA 34 (No. 6)). This special edition features a selection of papers presented at the International Conference on Integrated Water Resources Management (IWRM) entitled: Lessons from Implementation in Developing Countries. A collection of 10 selected papers was included in this special edition. The guest editor for this edition was Ms Eiman Karar, WRC.The WISA Special Edition was published in March 2009 •(Water SA 35 (No. 2)) which includes a selection of papers presented at the 10th Biennial WISA Conference held from 18 to 22 May 2008 at Sun City, South Africa, with the conference theme: ‘Confluence of the Water Industry’. Of the 200 papers presented at the WISA 2008 Conference 22 were included in the provisional selection, and only 12 papers passed the final review process and were included in the collection presented in this edition. This is the 4th Water SA WISA Special Edition, making WISA the only conference series consecutively publishing a Water SA special edition since its first in 2002. The guest editor for this edition was Dr Heinz Jacobs, University of Stellenbosch, Stellenbosch, South Africa.
Innovations and Knowledge ApplicationThe WRC supports knowledge creation which in turn may lead to innovative methods and technologies. While many of these innovations are public goods and are readily available for use, some technologies, processes and products require commercial involvement in order to make them publicly available.
Currently, the WRC has licence agreements with reputable South African companies. These include one royalty-earning innovation, i.e. The Secondary Metabolites, a cluster of 13 patents, currently licensed to Synexa-Life Sciences; the WRC has been receiving royalties since 2006. Two other licensed innovations are currently undergoing further development: the BioSURE™ Process, a cluster of 36 patents which is licensed to ERWAT, and the Ambient Temperature Ferrite Process (ATFP) for removing iron from acid mine drainage, which is currently licensed to Environmental Technology Agencies (ETA). Further development is often required to allow the technology to function reliably at a large scale. Business related to another innovation that was licensed out last year is rapidly progressing. This is an invention that will allow the provision of clean water at a small scale and could effectively provide drinking water for small rural communities. The Capillary Ultra-Filtration Membrane Technology (CUF), a cluster of five patents, was licensed to Ikusasa Chemicals in January 2008.
The Olive Wastewater Treatment Technology was assigned to the University of Cape Town (UCT) and a benefit-sharing agreement was concluded. Following the aforementioned benefit-sharing agreement, an option agreement was concluded whereby Dr Garcin was granted an exclusive option to enter into a licensing agreement for commercial development and public utilisation should its evaluation so warrant. The option agreement has lapsed and Dr Garcin is currently negotiating with UCT with the view to extend the agreement as the technology is still undergoing further development.
Innovations The WRC has launched patent applications for two new innovations:
Process for treating sulphate-containing effluent – The object of this invention is to provide a process for treating sulphate-containing effluent in a bioreactor. The process involves introducing the sulphate-containing effluent into the bioreactor along with a metabolisable carbon energy source, such that the metabolisable carbon energy source is present in an amount in excess of that required for the biological reduction of the sulphate in the effluent to sulphide. This will be followed by a step in which the sulphate in the effluent is biologically reduced to sulphide, simultaneously biologically producing methane from the carbon energy source, and removing the sulphide from the effluent.
Treatment of wastewaters using dual-stage membrane bioreactors –This invention is a wastewater treatment process. The process includes steps providing a discrete acclimation bioreactor system for developing a desired micro-organism inoculum, with the system being in selectively interruptible fluid flow connection with an effluent hydrolysis system. This allows the flow of desired micro-organisms from the bioreactor system to the effluent hydrolysis system to be regulated independently from the effluent feed flow through the hydrolysis system, leading to greater flow-through and system efficiencies.
Pending licences The WRC has two pending licences. A company has expressed an interest in commercialising the patent entitled: ‘Process for treating sulphate-containing effluent’ whereas another has submitted a business plan for the commercialisation of the patent entitled: ‘Treatment of wastewaters using dual stage membrane bioreactors’. The two technologies are described above. The WRC is assisting its licensees in marketing the licensed technologies.
The WRC continues in its effort to grow its patent portfolio and to license and earn income from its technologies. Examples of other innovations are:
Innovative approaches to handle brine – ‘Dewvaporation’ is a technology that extracts distilled water from brine and generates a more concentrated brine stream. It is based on the natural cycle of humidification and de-humidification and may utilise waste heat or low energy steam to evaporate brine. Compared to traditional thermal evaporators, evaporation of water in ‘dewvaporation’ occurs
WRC
Ann
ual R
epor
t 200
8/09
36

from the surface of the liquid and not from a highly heated metal surface. As such, it is anticipated that scaling will be reduced. Compared to WAIV (wind-aided intensified evaporation), the technology is more complex, but offers the advantage of recovering high-quality water from brine streams. An innovative module design was developed, combining the characteristics of a shell and tube heat exchanger as well as that of a capillary ultrafiltration membrane. Based on this concept, a small-scale test module was manufactured and tested at bench scale. It was possible to produce water of a quality comparable to mechanical evaporators.
The SHAPE (Sanitation and Housing Applied Priorities Enquiry) Model – Housing costs are made up of a number of variables. These include the land, servicing of the land (which will vary depending on the size of the erf and the standard and type of servicing provided), the number of rooms, and the standard of fittings, finishing and services. In addition, there are the costs of the overheads (such as selling and administration costs). Selecting a house that meets the spatial needs of a household and is also affordable is impossible for everyone in the low-income strata. This is especially true when it comes to the selection of sanitation services. While the solution selected needs to be hygienic, convenient and acceptable, it is also important for it to be affordable. Every sanitation choice affects a consumer’s disposable income, and people should be able to make an informed choice. Finding the right solution is therefore fundamental in the quest for sustainability. To improve the situation, the WRC supported the development of a computer modelling tool to help determine the effective demand for services, with a specific focus on sanitation, for peri-urban residents. The result is the SHAPE Model. The Model allows the user to specify their preferences for, e.g., sanitation, within the context of a global cost for the housing solution.
Marketing local water innovationMarketing the WRC’s technologies remains a continuous process. The Commission’s technologies are now listed on one international IP-marketing website, The Place to go for IP, hosted by Technology Transfer Tactics, an American-based company.
During the year under review the WRC completed the development of an WRC IP booklet and developed the WRC IP website, which was launched on 6 March 2009. This will be incorporated into the new WRC Web page which is still under development.
Leading Water-centred Knowledge Local leadership positionsStaff members continue to undertake various leadership positions (many positions are ongoing or set for a term of a number of years). These include positions such as:
Chairperson of the National Water Advisory Council (until June 2008); Chairperson of the South African National Commission for Irrigation and Drainage (SANCID); a member of the Board of the ARC; Chairperson of FETWater; member of the Global Water Partnership, South Africa; member of
the African Network of Basin Organisations (ANBO); member of Council of the Water Institute of Southern Africa (WISA); Chairperson of the National Community Water and Sanitation Institute (NCWSI) (University of the North); Board Member of the Institute for Environmental and Coastal Management (Nelson Mandela Metropolitan University) and the Institute of Water Research (IWR) (Rhodes University); treasurer of SANCID; member of South Africa Committee for the International Association of Hydrological Sciences; member of the National Water Resources Planning Systems User Forum; member of the technical Steering Committee of the Working for Water Hydrology Review Panel; member of the Committee of the South African Environmental Observation Network (SAEON); member of the Executive Committee of Heads of Organisations of Research and Technology (COHORT); member of the National Science and Technology Forum (NSTF) and a representative of the Science Councils; member of the Executive of the International Water Association (South Africa) (IWA-SA); member of WISA’s Mine-Water Group Management Committee; member of the Environmental Committee of Coaltech 2020; member of the South African Power Utility Research Advisory Board (Eskom); Chairperson of the WISA Portfolio Committee on Education, Training and Youth Development; member of Ecolink (an NGO); member of the Advisory Committee of the Groot Marico Catchment Agency; member of the National Disaster Management Committee (DPLG); member of the Advisory Board of the Water Institute of the University of Pretoria; and Chairperson of the South African Regional Irrigation Association (SARIA). A director is external examiner to the IWRM Honours course at UKZN.
Strategic membership in key national networksThe WRC is a patron member of WISA, a member of the Water Sector Leadership Group, member of the National Science and Technology Forum (NSTF), Heads of Organisations of Research and Technology (COHORT) and the International Water Association (South Africa) (IWA-SA).
New leadership positionsA director was inaugurated as the current President of •WISA at the WISA Biennial Conference (May 2008)A research manager serves as the interim Chairperson of •the Groundwater Division of the Geological Society of South AfricaA director is an invited member of the DWAF Strategic •Advisory Committee on Asset ManagementA research manager serves on the Board of Directors of •Sci-Bono Discovery CentreA research manager serves as the Chairperson of •the Agricultural Alumni Association of the University of Venda A director was a member of the Local Organising •Committee of the International WDSA (Water Distribution System Analysis) Conference held in South Africa in August 2008A research manager is part of the Organising Committee •of Mine-Water 2009 in association with the International Mine-water Association A research manager was awarded a Senior Fellow status •by WISA on 21 May 2008
Exec
utiv
e Re
port
37

A research manager is a member of the National Climate •Change CommitteeA research manager was appointed to the Advisory •Committee on the DWAF Project on Water TariffsA research manager is a member of the Steering •Committee of the National Groundwater Strategy (DWAF, by invitation) A director is a member of the DWAF Ministerial project •on Institutional RealignmentA director is a member of the DWAF Regulations •National Strategic ProjectA research manager is a member of the Integrated •Water Resources Planning National Steering CommitteeA research manager serves on the DWAF Project •Steering Committee for the Development of an Integrated Water Quality Management Plan for the Vaal RiverA research manager is currently part of the DWAF •Project Steering Committee for the development of a National Eutrophication Monitoring ProgrammeA research manager is currently part of the DWAF study •team for the development of South African Risk-Based Water Resource Quality GuidelinesA research manager is currently part of the DWAF •Project Steering Committee for the National Radioactivity Monitoring ProgrammeA research manager is a member of the Steering •Committee of DWAF’s National Groundwater StrategyA director is the Chairperson of the Scientific Support •Committee and member of the Coordinating Committee to the Harties Metsi-a-me Project. This multi-faceted DWAF-funded project provides the vehicle to improve the water quality in Hartbeespoort Dam. While mainly aimed at implementation, the work needs to use relevant research results.A director is a member of the CROC Steering committee. •CROC, the Consortium for the Remediation of the Olifants Catchment, is a recently constituted (October 2008) consortium of scientists (led by SANParks) concerned about the remediation of the Olifants River catchment, the state of which has recently been highlighted by the large number of crocodile deaths. A director was appointed as an additional member •on the Executive Committee of the South African Committee on Irrigation and DrainageA research manager is external examiner to the 4th year •Biotechnology Course at UCT
Leading and strategically contributing to the success of national initiatives
The WRC continues to lead WIN-SA (in its position as an •implementing agent). WIN-SA is a water sector initiative for knowledge dissemination and capacity building. For further details on WIN-SA see the section on ‘Capacity building initiatives’.The WRC continues to lead the activities of the •Framework for Education and Training in Water (FETWater), a joint UNESCO, Belgian and South African programme aimed at building more capacity in integrated water resource management. For further details on FETWater see the section on ‘Capacity building initiatives’.
The Technical Assistance Centre for Water Wastewater •Treatment Plants (TAC) was initiated by the WRC as a joint initiative with DWAF, WISA, DBSA and SALGA. The aim is to assist small- to medium-size treatment plants, with special reference to rural areas. Further details are provided in the section on ‘Capacity building initiatives’.The WRC continues to serve as the secretariat for •UNESCO HELPThe WRC actively supports the Department of Science •and Technology (DST) initiative regarding Technology-Based Solutions for Accelerated Delivery of Water ServicesThe WRC provides advice on the 2 implementation •plans that have been submitted and accepted by Amathole District Municipality and OR Tambo District Municipality to provide interventions on-site for rural communitiesThe WRC continues to serve on the Board of DST’s •Nanotechnology Centre. The WRC is the founding member and contributed to the national water nanotechnology strategy. The centre was established through a collaborative effort of MINTEK, WRC and DST. The WRC continues to lead the Network on Irrigation •Research and Extension for Smallholder Agriculture (NIRESA)The WRC continues to provide leadership to the •National Benchmarking InitiativeThe WRC and Sci-Bono continue to work together •developing and supporting various mechanisms of knowledge transfer of water-related material to school learners The WRC continues its support to the River Health •Programme (RHP). The RHP is an ongoing strong partnership between DWAF, CSIR and the WRC. The RHP, which was initiated in 1994, has now become the basis of a national monitoring programme. The aims are to measure the state of aquatic ecosystems, detect spatial and temporal trends and identify and report on these. The RHP is unique in that while the results are used by Government, the results are also useful to industry as they enable industry to monitor itself. The implementation relies on provincial initiatives which do not obtain funding from National Government, but the central coordination remains the task of National Government. Over the decade and a half that the RHP has been running it has achieved considerable success. The RHP has an operational database which is accessible to all users The WRC is a strategic partner assisting DWAF in the bid •to host the 6th World Water Forum in 2012. South Africa is currently one of two countries shortlistedThe WRC, in collaboration with WISA and CSIR, organised •the 2008 Excellence in Water Research Awards. This event, held at CSIR in October 2008, had water pollution as a central theme. The awards, presented by WISA, the WRC and CSIR in honour of the late Dr Gerrie Stander, afford three young researchers the opportunity to present their work with an established water researcher. Michael van der Laan presented his work on modelling agricultural non-point source nitrogen and phosphorus pollution, while Marcelle Marchand’s presentation focused on fish health as an indicator of
WRC
Ann
ual R
epor
t 200
8/09
38
water pollution. Dr Mapitsi Thantsha’s research looked at electrochemically activated water for treatment of biofilms. Acid mine drainage treatment expert Prof Jannie Maree, formerly of CSIR and now with Tshwane University of Technology, presented the Memorial Lecture on ‘Water and by-products from mine-water’ Prof Maree’s career has come full circle, having been one of the young researchers at the first Excellence in Water Research Awards 20 years ago
New national initiativesIn addition to leading research initiatives on water-•related climate change issues from both mitigation and adaptation perspectives, the WRC has supported a number of national strategic activities related to climate change. The WRC’s involvement in these national initiatives included: the WRC’s active participation in the National Climate Change Committee which is a non-statutory stakeholder body that advises the Minister of Environmental Affairs and Tourism on climate change issues at national and regional level; the support provided to DST with the water aspects of the climate change component of the Global Change programme that was initiated in 2008; membership of the DWAF climate change think tank under the chairmanship of the Director-General of DWAF; the preparation of a document to support high level dialogue during the World Water Forum (that was markedly on adaptation to climate change at regional level, e.g. SADC) on behalf of the DWAF Director-General prior to the 5th World Water Forum; participation in the Climate Change Summit held from 3 to 6 March 2009 in Johannesburg, at which the WRC had a stand displaying knowledge relevant to climate change; and inputs which were made by the WRC to the climate change section of the 7th edition of ‘Water for Growth and Development’, presented at this Summit which was held from 26 to 27 March 2009The WRC led and facilitated the move of the South •African Diatom Collection from the CSIR. This large diatom collection has been built up over a period of several decades by a succession of diatomologists within the CSIR. The passing of the last of these diatomologists left no one to curate this collection. With the resurgence of interest in diatoms in South Africa there has been a move afoot to increase the accessibility of the collection, both through digitising the collection and housing it at a centre where diatom research is ongoing. At a recent meeting convened by the WRC, agreement was reached that the ownership of the collection would be transferred from the CSIR to the South African Institute for Aquatic Biodiversity and that the physical collection would be housed at the University of the North-West (Potchefstroom Campus) where there is an active diatom research centre The WRC is supporting DWAF in drafting a water sector •research and development strategy for South Africa. A first draft was produced for wider comments and inputs. The WRC will continue to assist the Department in the implementation of the National Water R&D StrategyThe WRC supported a Symposium at the University of •Venda, Thohoyandou in August 2008 in which issues
relating to water, climate change, and food security were discussed. The WRC research reports and posters were exhibited and academic staff, students, municipal staff and farmers showed considerable interest in the activities of the WRCThe WRC initiated the development of a National •Conference on Drinking Water Quality in 2009 together with Amatola Water and WISA. This has now grown to a national initiative led by the DWAF to ensure a turn-around strategy for Drinking Water Quality in South AfricaThe WRC supported the establishment and launch •of the Adopt-a-River programme. This initiative is strongly linked to, and built on, the foundation of the RHP. The main aim of the Adopt-a-River initiative is to create an understanding among all water users, and in particular the previously marginalised communities, of the concepts of IWRM, encouraging them to become actively involved in the protection and management of these water resources. Adopt-a-River will involve voluntary groups in protection, management and, in particular, monitoring of water resources. The methods to be used will build on the RHP by using monitoring methods such as SASS (South African Scoring System) for the assessment of the state of the adopted rivers. This will entail capacity building as well as data handling on a large scale The WRC participated in and contributed to the National •Sanitation Task Team which is focused on issues related to sanitation provision, HIV and AIDS mainstreaming, implementation of the Health and Hygiene Strategy and the International Year of Sanitation ProgrammeThe WRC managed the research support to the DWAF •Wetland Research Programme which aims at sustainable use of South Africa’s natural resources. Chapter 3 of the National Water Act (No. 36 of 1998) provides for the protection of water resources through the determination and implementation of the ReserveThe WRC contributes to the development of the •National Cleaner Production Centre. The findings and outcomes of several WRC projects conducted over the past 8 years contributed to the foundation for this initiativeA national initiative focusing on the broader application •of algal ponds for wastewater treatment by local government is supported by the WRC. The technology was developed through WRC-funded projects. Amatola Water and the Amathole District Municipality are considering the application of this technology. The WRC has agreed to fund a consultancy by Mvula Trust on the various steps and decision-making processes that are currently being followed
Strategic positioningThe WRC led the development of the technical •programme of the flagship event of WISA, the WISA Biennial Conference, held at Sun City in May 2008. This contributed to a successful event and effective knowledge dissemination for 1 249 delegates who could participate in or attend nine parallel sessions with 164 technical papers (at least 50% informed by WRC projects) and 26 workshops
Exec
utiv
e Re
port
39

The WRC continues to strengthen its relationship with •DWAF. The Department has expressed an interest in the Shareholder Agreement, and the new Director-General has met with the CEO. A meeting aimed at information-sharing and future strategic alignment between the Director-General and Deputy Director-General (Policy and Regulations) and executive directors and research managers of the WRC has been planned. The WRC actively supported the development of the Water for Growth and Development Strategy and provided the Department with feedback on various versions on the StrategyThe WRC supported DWAF involvement at international •meetings such as Zaragoza (Spain) and Stockholm Water Week (Sweden) Staff members of the WRC continue to serve on many •of DWAF task teams (see above) and many of DWAF’s officials support the WRC project review process and are represented on various research projects’ reference groupsThe WRC, in addition to acting as the implementing •agent for WIN-SA and FETWater, is supporting the management of research projects for DWAF: supporting research related to the Working for Wetland Programme as indicated above, and supporting the development of the Guidelines for the Inspection of Package Plants The WRC continues to strengthen its relationships with •the National Department of Agriculture (NDA). The NDA has under the current Memorandum of Understanding (MoU) requested the WRC to manage and support a number of research projects, funded to an amount of R2.2m.The WRC is finalising a MoU agreement with SALGA, to •provide research and knowledge dissemination supportThe WRC and Eskom have embarked on strategic •discussions to reaffirm the strategic alliance as the MoU between the two organisations needs to be revised to suit the current needs of the countryThe WRC is in an advanced stage of negotiations with •regard to a MoU with WISA to partner in the effective dissemination of water knowledgeThe WRC presented a funding model to the Limpopo •Province Premier’s Research Forum in October 2008. The premier’s office has expressed an interest in this model, which the Province intends to use to streamline and manage all its research programmes. The Province expressed an intention to approach the WRC (CEO) for assistance in the near future
In Africa, the WRC has played an active part in capacity building, coordination of research and development initiatives and participated in and organised scientific and technical gatherings.
The WRC held a number of leadership positions in Africa:A research manager is serving as the Chairperson •of the TIGER Initiative, led by DEAT (Department of Environmental Affairs and Tourism), a UNESCO-IHP supported programme (further information can be found in the list of activities below)A director serves as a Board Member of WARFSA (see •activities below)
A research manager serves on the African Groundwater •Commission’s (AGWC) Technical Task Team. The AGWC was established under the auspices of AMCOWA research manager serves as Chairperson of the •Southern African Regional Irrigation Association (SARIA)A research manager attended a workshop in Ethiopia on •Integrated Management of Agricultural Water in Eastern and Southern Africa during September 2008A director occupies the position of National Secretariat •for the International Hydrological Programme of UNESCO, for the South African National CommitteeA research manager was the Chairperson of the Local •Organising Committee of the International Conference on Implementing Environmental Water Allocations that took place in Port Elizabeth, Eastern Cape in February 2009, while a director was the Deputy Chairperson
The following initiatives include both ongoing and new activities aimed at building water-centred knowledge in Africa. During 2008/09:
The WRC continued to be actively involved with •WARFSA as it has done for a number of years. Currently one staff member serves as a Board Member of WARFSA The WRC assisted the South African DST by •representing the South African water sector in further implementation of the agreement between the governments of South Africa and Kenya embodied in the Plan of Action in Science and Technology Cooperation. The South African water sector, represented by the WRC, took part in the Kenya South Africa Joint Technical Committee meeting in Nairobi in August 2008The WRC, in collaboration with the French Institute of •Research for Development (IRD), continues to support the NEPAD Office of Science and Technology initiative focusing on the establishment of the African Network of Centres of Excellence in Water Science and Technology. This initiative falls under water science and technology flagship programmes of the African Ministerial Council of Science and Technology (AMCOST) in association with the African Ministerial Council of Water (AMCOW). The centres will address critical water-related issues, conduct research programmes, train new researchers, trainers and professionals, and promote technology transfer. The network of centres of excellence is expected to overcome the fragmentation regarding water-related policies and science and technology. A call for proposals was sent out to all possible water-related institutes for which the WRC had contact details. This was followed by advertisements on the NEPAD and WRC websites as well as presentations at various forums, e.g. the 1st African Water Week held in Tunis in March 2008. Fourteen applications were received. It was resolved that two centres of excellence will be established while keeping the call for proposals open to all other regions. The WRC and IRD submitted the recommendations to the NEPAD-OST and will now assist in the establishment of the Southern African Centre of ExcellenceThe WRC signed a MoU for bilateral collaboration in •water research with the Kenya Water Institute (KEWI) in Nairobi on 12 August 2008. KEWI is a Kenyan statutory body and has a recognised mandate in sustainable
WRC
Ann
ual R
epor
t 200
8/09
40

capacity building in the water sector in the Republic of Kenya. The Institute is mandated to offer training services in the water sector, consultancy and research and development on a commercial basis. Its functions include providing hands-on experience and quality training for transforming the Kenyan water sector institutions and individuals, acting as a training ground for technologies and research findings, and supporting capacity development of water sector institutions. The KEWI research mandate includes areas of water resource management and environment, water and sanitation services, and appropriate technology in the water sector. The goal of the MoU is for the WRC and KEWI to collaborate where appropriate, and to:– Undertake scientific and applied research, and
undertake database development in order to promote planning, management, development and institutional reforms in the water sector in the respective countries
– Develop scientific and technological innovations in the water sector in the respective countries
– Promote sustainable capacity building in the water sector in the respective countries
– Facilitate knowledge exchange and information dissemination
The WRC organised the annual meeting of SARIA (South •African Regional Irrigation Association) members in Pretoria and presented a workshop in Bloemfontein, funded by the NDA, on Rainwater Harvesting and Conservation with participation by representatives from South Africa, other SADC countries, and Kenya. The workshop was combined with field visits to on-station and on-farm research work funded by the NDAThe WRC supports the South African Academy of •Science (ASSAf ) in the African chapter Inter Academy Programme for Water. The Programme aims at building capacity for water research and water managementThe WRC supports the TIGER Initiative (a DEAT-led •initiative), a UNESCO-IHP supported programme that is aimed at assisting African countries to overcome problems faced in the collection, analysis and dissemination of water-related geo-information, by exploiting the advantages of earth observation technology. Responsibilities include that of facilitating a decision-making process that steers the initiative towards realisation of the set objectives, namely:– Developing, implementing and assessing a cost-
effective sustainable model to improve decision making and governance (at local, national and regional scales) by using space-based information to provide accurate and timely geo-information for the IWRM process
– Supporting the consolidation of a critical mass of technical centres in Africa with skills and capabilities to derive and disseminate space-based water-relevant information to stakeholders for IWRM at all levels
– Fostering sustainability through implementation of a strategy to sustain access to earth observation-supported IWRM information and decision support systems
– Supporting African countries in order to improve on access to geo-information to address their
developmental constraints through active participation and influencing decisions by space agencies (NASA, ESA, CSA and others) to make their data and information available through the TIGER Initiative
The WRC continues its global collaborative activities. While most of these activities are ongoing a few new initiatives were introduced during 2008/09.
Globally the WRC held a number of leadership positions: A director has served as a member of the steering •committee of the Water Supply and Sanitation Collaborative CouncilThe CEO serves as a Board Member of the Global Water •Research Coalition (GWRC)The CEO serves as the Chairperson of • Streams of Knowledge, a global coalition of resource centresThe CEO serves on the Governing Council of IWA•A director serves as a member of RAMSAR scientific and •review panelA research manager serves on the management •committee of the IWA Specialist Group on NanoparticlesA director served on the IWA Specialist Group on Sludge •Management Governing BoardThe CEO serves as a Board Member and Chair of the •Programme Committee of the International Water Management Institute (IWMI) (until December 2009) A director serves as a member of the International •Commission for Irrigation and Drainage (ICID) Working Group for the Use of Poor Quality Water for IrrigationA director led the scientific and organising committee •when hosting the IWRM International Conference. The director was the Guest Editor for a Water SA IWRM Special Edition published in DecemberA director was a member of the organising committee •of the SIL (International Society of Limnology) for its conference which is to be held in South Africa in 2010 A research manager served as a member of the •organising and advisory Committees of the 4th International Conference on Mine Closure held in Johannesburg in October 2008A director was appointed to the Advisory Committee of •the IWA Global Development AgencyA director acted by invitation as a special external •reviewer in the field of IWRM for the UNESCO IHE special research fund known as the UNESCO-IHE Partnership Research Fund (UPaRF) A director is the country’s representative and a •member of the International Association of Agricultural Economists (IAAE)A research manager was the Deputy Chair of the Local •Organising Committee of the International Conference on Implementing Environmental Water Allocations which took place in Port Elizabeth in February 2009.A director serves on the Advisory Board of the Water •Research Node at Monash University South Africa. Monash University is one of Australia’s leading public universities A director serves on the Scientific Programme •Committee for the 1st IWA Development Congress on Emerging Solutions to Water and Sanitation Challenges, scheduled for September 2009, Mexico
Exec
utiv
e Re
port
41

The CEO serves on the IWA Programme Committee •(from 2009 onward)Member of RAMSAR (Science and Technical Review •Panel (STRP)) for the period 2009-2012
During 2008/09 a number of key partnerships were formed and the WRC participated in global networks and initiatives, inter alia:
Collaboration with the North-South Centre, ETH, Zürich, Switzerland – This collaboration was established during 2007 and included a number of visits and meetings with the Director of the Centre as well as other academic and Swiss research organisations, e.g. the Swiss Federal Institute of Aquatic Science and Technology (EAWAG). In June 2008 the CEO was invited to present a keynote address at the Annual Conference of the North-South Centre entitled Prospects for Integrated Water Resource Management. The keynote address focused on sanitation and hygiene, and approaches to sustainable development. The meeting attracted key leaders from across the world, including the Director-General of IWMI, the assistant Director-General of the Swiss Agency for Development Cooperation and the Chairperson of the Global Water Partnership.
Inter-Academy Programme for Water (IAP) – The WRC continues to represent the South African Academy of Science in discussions addressing the development of capacity for managing water resources by the Inter-Academy Programme (IAP) for Water. A director represented the WRC/ASSAf in a meeting of the IAP in Poland in May 2008 and a research manager attended and presented a poster on ‘Determining water for the environment in perennial and non-perennial river systems in South Africa’ at the Ecohydrology Conference that was part of the IAP on water and took place in Lodz, Poland in May 2008. The research manager used this visit to promote WRC work and to draw attention to the International Conference on Implementing Environmental Water Allocations that WRC organised and was held in February 2009 in Port Elizabeth, South Africa. Several people from the Poland meeting submitted abstracts to the conference organiser after meeting with the Research Manager in Poland. The CEO was invited to give the keynote address in IAP Regional Programme for the Americas which took place in Sao Carlos, Brazil in August 2008. The workshop addressed capacity building and included a training course for the Americas on Water, Environment and Society: an Integrated Approach. The CEO’s keynote address focused on integrated water resource management and related research studies from South Africa. During the meeting the CEO discussed the potential for undertaking collaborative projects with Brazil.
The Global Water Research Coalition (GWRC) – The WRC continues to be an active member of the GWRC. In June 2008, the CEO presented the WRC Research Portfolio on Climate Change at a GWRC Workshop held in Singapore. The meeting addressed collaborative projects in the area of water and energy and nanotechnology. The WRC is currently collaborating with members of the GWRC in research programmes addressing algal toxins and asset management, as well as a study on ‘Energy efficiency in the water industry: a compendium of tools, best practices and case studies’.
CapNet – The WRC is hosting CapNet, a global network addressing training for IWRM, under the UNDP. Staff of the WRC participated in CapNet activities locally and globally. The initiative commenced with a 2-day workshop held in Pretoria in January 2009.
French-South African cooperation for research on water – The WRC continues to support SAFewater (the French-South African cooperation for research on water). The SAFewater Annual Report was submitted to DST as per management contract with the WRC. The programme is making good progress and DST has made funds available for the second phase of the project.
South Africa-Germany cooperation on water in the environment with specific emphasis on mining impacts on groundwater – Key partners on the South African side are the WRC, Council for Geoscience, CSIR and Tshwane University of Technology. Both sides have participated in exchange visits and exploratory projects are now being developed by both sides.
South Africa-European Union Summit, Bordeaux, France, July 2008 – The WRC supported DST in the development and facilitation of a Side Event on ‘Water research for sustainable development’, during the South Africa-European Union Summit, Bordeaux, France in July 2008. On invitation the CEO, an executive director and a research manager attended. The programme was based on the four impact areas of the WRC. The WRC staff members each facilitated a session and presented a thematic overview presentation. These included presentations on ‘Water research and food security’, ‘Water research and health’, and ‘Water research and the economy’. In addition, the CEO presented the seminar conclusions. The EU Side Event workshop, which was carried out as part of ESTAP (European-South African Science and Technology Programme), DST and IRD, emphasised participants’ commitment to cooperate in research and innovation partnerships to address global sustainable development challenges, specifically those affecting the African continent. Within this context they agreed on the importance of the European Union and South Africa intensifying their scientific and technological cooperation. In addition the Side Event workshop encouraged research organisations in South Africa and the European Union to enhance their focus on water – a precious common good and essential resource for life and development, which is threatened by diminishing resources, difficulties impeding access, poor quality and health risks, as well as inappropriate management and global change.
Participation in Zaragoza 2008 International Expo ‘Water and Sustainable Development’, Spain and related activities – A WRC director was invited by the Minister of Water Affairs and Forestry to accompany her to the Expo held in Zaragoza, Spain. The self-proclaimed ‘biggest water festival on earth’, Expo Zaragoza 2008 ran between June and September 2008 in the city of Zaragoza, Spain. The Expo attracted thousands of people daily from governments, academia, civil society and the private sector. A key component of the Expo was the Water Tribune, created to stimulate reflection,
WRC
Ann
ual R
epor
t 200
8/09
42

debate and a search for solutions in relation to water and sustainability. It brought together the most relevant international water professionals to discuss sustainable initiatives and solutions on water management. The Water Tribune was organised in nine thematic weeks, and attracted about 700 specialists per day throughout the duration of the Expo. The director was one of three South African women scientists who accompanied the Minister to Zaragoza and attended the South African National Day on 5 August, the Ministers’ Keynote address at the Water Tribune on 6 August and participated in discussions with key international organisations such as the World Bank. The WRC also assisted DWAF with the technical content for the South African stand in the Africa Pavilion.
Awards and Accolades Accolades
Water SA In June 2008 the Institute for Scientific Information (ISI) released their ISI/SCI Journal Citation Reports (JCR), reporting journal impact factors (IF, 2007) for the world’s most important scholarly journals. The JCR provides quantitative tools for ranking, evaluating, categorising, and comparing journals. The IF is one of these and is a measure of the frequency with which an average article in a journal has been cited in any particular year or period. The latest available Science Citation Index – Journal Citation Reports published by the ISI ranks over 5 900 journals by impact factor.
The South African multidisciplinary scholarly water journal Water SA, under the Science Citation Index (SCI), improved its ISI/SCI IF from 0.494 in 2006 to 1.120 in 2007, and came out as the 2nd ranked journal in South Africa and well-ranked in the water journal category world-wide. This journal has been funded and published by the WRC since 1975 and the 2007 IF is the highest ever achieved. An IF score of 1 indicates that, on average, a paper published in that journal will be cited once in another paper published in a peer-reviewed journal. South African journals rarely have an impact score of over 1; good international journals have an impact score of 2 to 3. Not only is this most recent IF rating a remarkable achievement for the journal, but also for open-source publishing. From April 2005 onwards Water SA has been published free of charge as an open-source e-journal (URL: http://www.wrc.org.za/publications_watersa.htm) with a limited print-run and paper copies available on request at nominal cost.
For 2007 Water SA is rated 2nd in terms of South African ISI accredited journals, and is rated 2nd also in terms of African journals listed.
Awards
Chairman of the Best Run Conference Award – A WRC research manager was given the award for being the Chairman of the Best Run Conference. The research manager was the Chairman of the Organising Committee of the International Conference on Implementing Environmental Water Allocation held in February 2009, Port Elizabeth.
Water quality management tool – A South African submission, by DWAF, IMESA and Emanti Management, on the provision of a water services sector-wide, web-based water quality management tool (eWQMS), has won both the European and Global Project Innovation Award from IWA under the category Operations/Management. The 2008 IWA Global Project Innovation Awards Ceremony took place at the IWA World Water Congress in Vienna on 10 September 2008. The WRC has been an important contributor to the success of the eWQMS initiative, by supporting the development of a number of guidelines and web-based municipal tools which are accessible via the eWQMS.
WRC Exhibition Stand Prize – The WRC exhibition stand at WISA 2008 was awarded 2nd prize in the designer exhibition stand category.
Anglo Coal Award – A WRC director was awarded The Anglo Coal Award for her contribution to the eMalahleni Water Reclamation Plant in 2008.
Exec
utiv
e Re
port
43

Organisational Goals and Objectives (Key Performance Areas)The WRC has identified five key performance areas:
Stakeholder relationships •Financial perspectives•Learning and innovation •Internal processes •Organisational transformation•
The WRC continued to use these key performance areas (KPAs), which were developed with the aim of continuously directing the organisation toward excellent performance. The areas include input and output indicators which are assessed and revised annually.
Customer/stakeholder relationships This KPA addresses the WRC leadership and positioning activities and provides feedback regarding relevance. One of the objectives of this KPA is to enhance the standing of the WRC nationally, in Africa and globally.
GOAL/OBjECTIvES IndICATORS EXCELLEnCE TARGET PERFORMAnCELeadership in local affairs:
National •initiativesPublic •appreciation
National initiatives of key importance to the water, Science & Technology and other related national sectors where the WRC plays a significant role
Strategic positioning initiatives aimed to position the WRC for future sustainability and growth
8 national initiatives (80% ongoing, 20% new)
Meeting targeted relationship enhancing interventions with shareholder and stakeholders (based on stakeholder map)
A performance target of ‘excellence’ was achieved
The planned interventions were attended to, and the implementation of the stakeholder map is on track
Feedback regarding the relevance of the WRC to South Africa
Positive outcomes of 4 impact studies
5 citations
5 impact studies were conducted
Positive feedback was received via citations. This includes a number of awards and accolades. More than 5 citations indicating that the WRC is a relevant organisation were captured
Leadership in external affairs
Regional (Africa)•Global •
African leadership (key strategic activities in Africa where the WRC plays a significant role)
5 African initiatives (90% ongoing,10% new)
Target met
International player (activities such as global partnerships, participation in global projects, etc.)
8 global initiatives (80% ongoing,20% new)
Target met
WRC
Ann
ual R
epor
t 200
8/09
44

Financial perspectivesThe objective of this KPA is to improve the financial practices, management and performance of the WRC. This is translated into a number of quantitative indicators addressing growth and sustainability and effective management of funds.
GOALS/OBjECTIvES IndICATORS EXCELLEnCE TARGET PERFORMAnCE Improved financial performance
Income growth (income growth is measured as meeting the budgetary target of R16.3m.)
Meet budget target in full
Met 98.8% of the target achieving R16.1m.
Research ratio (measured as research funding and support as percentage of total income)
75% (revised budget) Achieved
Cash flow management (measured against availability of cash for effective operation).
R15m. Target fully met at monthly basis and year end
Effective financial management
High-quality budget planning and reporting (measured as the percentage deviation between actual and budget at year-end)
10% Target met
Audit results (measured as a percentage of the previous year’s internal audit queries fully addressed and an unqualified vs. qualified external audit)
70% (internal audit)Unqualified report (external audit)
Overall more than 70% (82%) of the queries were addressed. However, 59% of queries were fully addressed while only 23% of other long-term issues queried were addressed
Efficiency of recoveries (measured as the percentage of projects older than 3 years fully finalised)
100% Not met
Roll-over of research funds (measured as the deviation from the budgetary figure for roll-over of research project funds)
20% Excellence target was exceeded, and only 13% deviation was recorded
Learning and innovation This KPA aimed to further improve the level of innovation and support the commercialisation of IP, enhance the WRC’s contribution towards building the water-centred knowledge base in South Africa (emphasising capacity building), and improve various knowledge-sharing activities. The issue of building the knowledge base (capacity building) and the application, transfer, sharing and dissemination of water-centred knowledge continued to be of great importance to the relevance of the WRC.
GOALS/OBjECTIvES IndICATORS EXCELLEnCE TARGET PERFORMAnCE Improved commercialisation of IP
Number of innovations
The number of new licences
3 new innovations
2 new licences
Target met
2 new licences are pendingImproved contribution towards capacity building (knowledge base)
Number of students supported by the WRC research portfolio as well as the percentage of the total made up of historically disadvantaged students
Effective leading of capacity-building/knowledge-sharing initiatives
400 students, 60% of whom are from historically disadvantaged (HD) backgrounds
2 national initiatives
The WRC supported 663 students of whom 61% were from HD backgrounds
Target met
Knowledge sharing and scientific leadership
The number of Open Days and workshops organised by the WRC
New dissemination and sharing mechanisms for knowledge supporting policy development and implementation
2 Open Days (one internal) and 20 workshops
2 new knowledge dissemination mechanisms
The ‘excellence’ target was met for Open Days and workshops
2 new mechanisms developed
Exec
utiv
e Re
port
45
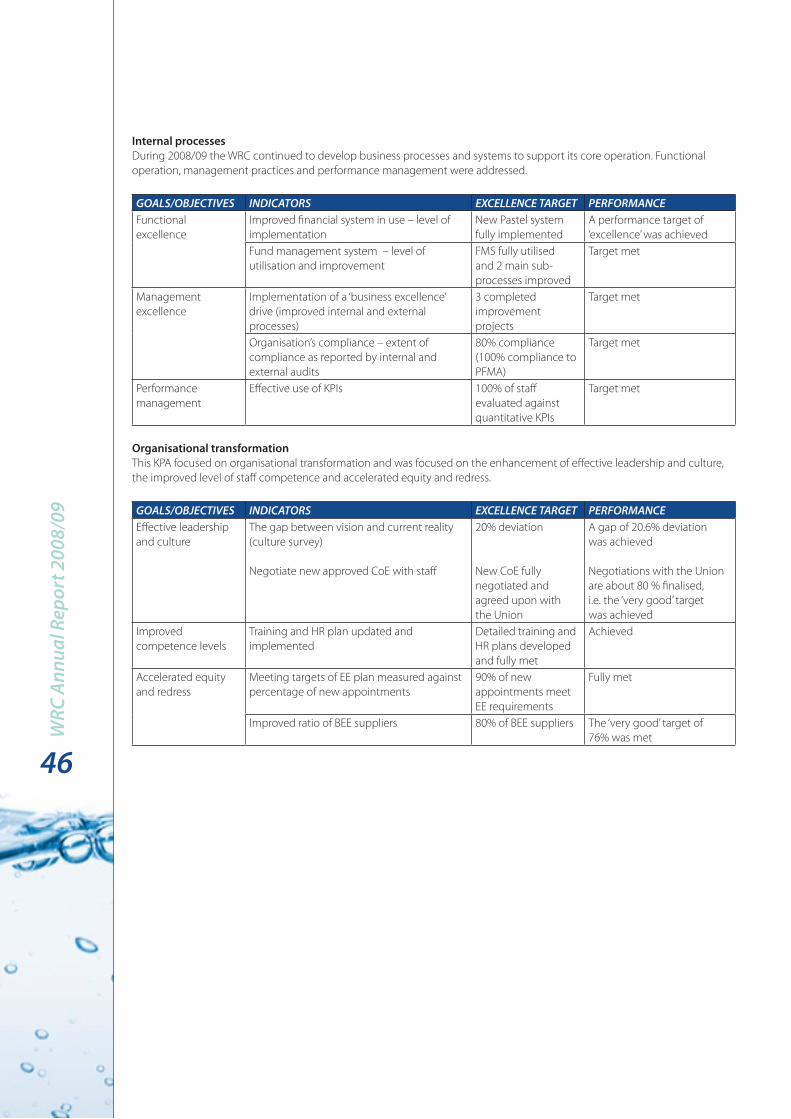
Internal processesDuring 2008/09 the WRC continued to develop business processes and systems to support its core operation. Functional operation, management practices and performance management were addressed.
GOALS/OBjECTIvES IndICATORS EXCELLEnCE TARGET PERFORMAnCEFunctional excellence
Improved financial system in use – level of implementation
New Pastel system fully implemented
A performance target of ‘excellence’ was achieved
Fund management system – level of utilisation and improvement
FMS fully utilised and 2 main sub-processes improved
Target met
Management excellence
Implementation of a ‘business excellence’ drive (improved internal and external processes)
3 completed improvement projects
Target met
Organisation’s compliance – extent of compliance as reported by internal and external audits
80% compliance (100% compliance to PFMA)
Target met
Performancemanagement
Effective use of KPIs 100% of staff evaluated against quantitative KPIs
Target met
Organisational transformationThis KPA focused on organisational transformation and was focused on the enhancement of effective leadership and culture, the improved level of staff competence and accelerated equity and redress.
GOALS/OBjECTIvES IndICATORS EXCELLEnCE TARGET PERFORMAnCEEffective leadership and culture
The gap between vision and current reality (culture survey)
Negotiate new approved CoE with staff
20% deviation
New CoE fully negotiated and agreed upon with the Union
A gap of 20.6% deviation was achieved
Negotiations with the Union are about 80 % finalised, i.e. the ‘very good’ target was achieved
Improved competence levels
Training and HR plan updated and implemented
Detailed training and HR plans developed and fully met
Achieved
Accelerated equity and redress
Meeting targets of EE plan measured against percentage of new appointments
90% of new appointments meet EE requirements
Fully met
Improved ratio of BEE suppliers 80% of BEE suppliers The ‘very good’ target of 76% was metW
RC A
nnua
l Rep
ort 2
008/
09
46

Human Resources In 2008/09, the WRC’s organisational structure (page 106) did not undergo any significant change. The current structure, in making allowance for core and direct support functions, provides for 51 permanent staff. In terms of composition by race, there was a significant increase in the appointment of Black staff during the year under review. In the previous financial year, i.e. the 2007/08 year, the staff members of the WRC comprised 49% Black staff and 51% White staff. In the 2008/09 year the percentage of Black staff increased to 56% (44% White staff ). Female staff members still represent the majority; the WRC has 60% female and 40% male employees.
Staff composition by race
Staff composition by gender
Improved levels of staff competence
The skills development plan for the 2008/09 financial year was well-implemented. Level of training was extended and a number of employees attended courses that were not initially planned at the beginning of the year, in addition to the planned courses. The WRC also had provided staff with a number of in-house courses including courses on Dealing with the Media, Brain Power and Coaching and Mentoring.
Accelerated equity and redressMeeting employment equity plan targetsThe report measuring progress against the employment equity plan indicates that the WRC has not only met but even exceeded the set employment equity targets for the previous years. During 2008/09 the WRC appointed a number of new employees, against relevant vacancies. The vacancies resulted from resignations of staff as well as staff movement within the organisational structure. For 2008/09 the WRC filled the following positions: Financial Manager, PR and Communications Officer, Group Assistant, IT Manager, IT Officer, IT Assistant and three Research Managers.
WRC support for staff education and trainingInvestment in excellence and effective leadership cultureExecutive of the WRC were trained and provided with a framework and tools that will enable them to understand recurring organisational issues at their fundamental, root-cause level. The process is continuing with more training being planned for the Executive team in the next financial year.
The commitment to performance excellence continued into 2008/09 with almost all new employees attending the Investment in Excellence Training courses.
The Pacific Institute conducted another survey in February 2009 to determine the gap between current reality and the vision of the organisation.
WRC supported two staff members for studies in Public Relations and Masters in Business Administration.
Board Approval
The Annual financial statements of the WRC and wholly-owned company for the year ended 31 March 2009, which appear on pages 52 to 87 of this report, were approved by the WRC Board at its meeting held on 26 May 2009. The Board is of the opinion that the WRC is financially sound and operates as a going concern.
These statements are signed on behalf of the WRC by:
Prof JB Adams WRC Board Chairperson
Dr R KfirWRC Chief Executive Officer
56%African
44%White
40%Male 60%
Female
Exec
utiv
e Re
port
47

Members of the Board
1 3 6 85 7 9
2 4 10
WRC
Ann
ual R
epor
t 200
8/09
48

FROM LEFT TO RIGHT:1. dr TPE Auf der Heyde (dST)2. dr dSS Lushaba (Simosezwe Investments)3. Mr M Sirenya (formerly Amatola Water)4. Prof jB Adams, WRC Chairperson (nMMu)5. Mr P Cross (Independent consultant)6. dr R Kfir, ex-officio (WRC) 7. dr dj Merrey (natural resources and institutions specialist)8. Ms ZB Mathenjwa (GBS)9. Mr dP naidoo (uP)10. Ms d ndaba (national Agricultural Marketing Council)
ABSEnT:Ms P Yako, ex-officio (dWEA)
Mem
bers
of t
he B
oard
49

Water Research Commission
Consolidated AnnualFinancial Statementsfor the year ended 31 March 2009

ContentsReport of the Auditor General 52Report of the Audit Committee 55Statement of Financial Position 56Statement of Financial Performance 57Statement of Changes in Net Assets 58Cash Flow Statement 59Accounting Policies 60Notes to the Annual Financial Statements 70Detailed Statement of Financial Performance 87

Report of the Auditor-GeneralReport of the Auditor-General to Parliament on the Group Financial Statements and performance information of Water Research Commission for the year ended 31 March 2009.
Report on the Financial StatementsIntroduction
I have audited the accompanying group financial 1. statements and financial statements of the Water Research Commission which comprise the consolidated and separate statements of financial position as at 31 March 2009, consolidated and separate statements of financial performance, consolidated and separate statements of changes in net assets and consolidated and separate cash flow statements for the year then ended, and a summary of significant accounting policies and other explanatory notes, as set out on pages 60 to 87.
The accounting authority’s responsibility for the financial statements
The accounting authority is responsible for the 2. preparation and fair presentation of these financial statements in accordance with South African Statements of Generally Accepted Accounting Practice and in the manner required by the Public Finance Management Act, 1999 (Act No. 1 of 1999) (PFMA) and the Companies Act, 1973 (Act No. 61 of 1973) and for such internal control as the accounting authority determines it necessary to enable the preparation of financial statements that are free from material misstatement, whether due to fraud or error.
The Auditor‑General’s responsibilityAs required by section 188 of the Constitution of the 3. Republic of South Africa, 1996 read with section 4 of the Public Audit Act, 2004 (Act No. 25 of 2004) (PAA) and the Water Research Act, 1971 (Act No. 34 of 1971), my responsibility is to express an opinion on these financial statements based on my audit.
WRC
Ann
ual R
epor
t 200
8/09
52

I conducted my audit in accordance with the 4. International Standards on Auditing and General Notice 616 of 2008, issued in Government Gazette No. 31057 of 15 May 2008. Those standards require that I comply with ethical requirements and plan and perform the audit to obtain reasonable assurance on whether the financial statements are free from material misstatement.An audit involves performing procedures to obtain 5. audit evidence about the amounts and disclosures in the financial statements. The procedures selected depend on the auditor’s judgement, including the assessment of the risks of material misstatement of the financial statements, whether due to fraud or error. In making those risk assessments, the auditor considers internal control relevant to the entity’s preparation and fair presentation of the financial statements in order to design audit procedures that are appropriate in the circumstances, but not for the purpose of expressing an opinion on the effectiveness of the entity’s internal control. An audit also includes evaluating the appropriateness of accounting policies used and the reasonableness of accounting estimates made by management, as well as evaluating the overall presentation of the financial statements.I believe that the audit evidence I have obtained is 6. sufficient and appropriate to provide a basis for my audit opinion
OpinionIn my opinion the financial statements present fairly, 7. in all material respects, the consolidated and separate financial position of the Water Research Commission
as at 31 March 2009 and its consolidated and separate financial performance and consolidated and separate cash flows for the year then ended, in accordance with Statements of South African Generally Accepted Accounting Practice and in the manner required by the PFMA, and the Companies Act of South Africa.
Basis of AccountingWithout qualifying my opinion, I draw to accounting 8. policy note 1.1, which describes the basis of accounting. The public entity’s policy is to prepare financial statements on the basis of accounting determined by the National Treasury.
Other MattersWithout qualifying my audit opinion, I draw attention to 9. the following matters that relate to my responsibilities in the audit of the financial statements:
Governance frameworkThe governance principles that impact the auditor’s 10. opinion on the financial statements are related to the responsibilities and practices exercised by the accounting authority and executive management and are reflected in the key governance responsibilities addressed below.
Key governance responsibilitiesThe PFMA tasks the accounting authority with a 11. number of responsibilities concerning financial and risk management and internal control. Fundamental to achieving this is the implementation of key governance responsibilities, which I have assessed as follows:
Annu
al F
inan
cial
Sta
tem
ents
53
for t
he y
ear e
nded
31
Mar
ch 2
009

nO. MATTER Y nClear trail of supporting documentation that is easily available and provided in a timely manner1. No significant difficulties were experienced during the audit concerning delays or the availability of requested information.
Quality of financial statements and related management information2. The financial statements were not subject to any material amendments resulting from the audit.
3. The annual report was submitted for consideration prior to the tabling of the auditor’s report.
Timeliness of financial statements and management information4. The annual financial statements were submitted for auditing as per the legislated deadlines (section 40 of the PFMA).
Availability of key officials during audit5. Key officials were available throughout the audit process.
Development and compliance with risk management, effective internal control and governance practices6. Audit committee
The entity had an audit committee in operation throughout the financial year.•
The audit committee operates in accordance with approved, written terms of reference.•
The audit committee substantially fulfilled its responsibilities for the year, as set out in section 77 of the PFMA •and Treasury Regulation 3.1.10.
7. Internal audit
The entity had an internal audit function in operation throughout the financial year.•
The internal audit function operates in terms of an approved internal audit plan.•
The internal audit function substantially fulfilled its responsibilities for the year, as set out in Treasury Regulation 3.2.•
8. There are no significant deficiencies in the design and implementation of internal control in respect of financial and risk management.
9. There are no significant deficiencies in the design and implementation of internal control in respect of compliance with applicable laws and regulations.
10. The information systems were appropriate to facilitate the preparation of the financial statements.
11. A risk assessment was conducted on a regular basis and a risk management strategy, which includes a fraud prevention plan, is documented and used as set out in Treasury Regulation 3.2.
12. Delegations of responsibility are in place, as set out in section 44 of the PFMA.
Follow-up of audit findings13. The prior year audit findings have been substantially addressed.
14. SCOPA resolutions have been substantially implemented.
Issues relating to the reporting of performance information15. The information systems were appropriate to facilitate the preparation of a performance report that is accurate and complete.
16. Adequate control processes and procedures are designed and implemented to ensure the accuracy and completeness of reported performance information.
17. A strategic plan was prepared and approved for the financial year under review for purposes of monitoring the performance in relation to the budget and delivery by the entity against its mandate, predetermined objectives, outputs, indicators and targets (Treasury Regulations 5.1, 5.2, and 6.1).
18. There is a functioning performance management system and performance bonuses are only paid after proper assessment and approval by those charged with governance.
Report on other Legal and Regulatory Requirements
Report on performance informationI have reviewed the performance information as set out 12. on pages 56 to 59.
The accounting authority’s responsibilities for the performance information
The accounting authority has additional responsibilities 13. as required by section 55(2)(a) of the PFMA to ensure that the annual report and audited financial statements fairly present the performance against predetermined objectives of the public entity.
The Auditor‑General’s responsibilityI conducted my engagement in accordance with section 14. 13 of the PAA read with General Notice 616 of 2008, issued in Government Gazette No. 31057 of 15 May 2008.In terms of the foregoing my engagement included 15. performing procedures for an audit nature to obtain sufficient appropriate evidence about the performance information and related systems, processes and procedures. The procedures selected depend on the auditor’s judgement.
Findings (performance information)I believe that the evidence I have obtained is sufficient 16. and appropriate to report that no significant findings have been identified as a result of my review.
AppreciationThe assistance rendered by the staff of the Water 17. Research Commission during the audit is sincerely appreciated.
Pretoria31 July 2009
WRC
Ann
ual R
epor
t 200
8/09
54

Report of the Audit CommitteeReport of the Audit Committee required by Treasury Regulations 27.1.7 and 27.1.10 of the Public Finance Management Act, Act 1 of 1999, as amended by Act 29 of 1999.
The Audit Committee reports that it has adopted formal terms of reference as its Audit Committee Charter and
that it has discharged all of its responsibilities for the year, in compliance with the charter.
The Audit Committee is satisfied that an adequate system of internal control is in place to reduce significant risks faced by the organisation to an acceptable level, and that these controls have been effective during the period under review. The system is designed to manage, rather than eliminate the risk of failure and to maximise opportunities to achieve business objectives. This can provide only reasonable but not absolute assurance.
The Audit Committee has evaluated the Annual Financial Statements of the WRC group for the year ended 31 March 2009 and based on the information provided to the Audit Committee considers that it complies, in all material respects with the requirements of the various Acts governing disclosure and reporting on the Annual Financial Statements. The Audit Committee therefore recommends the adoption of the Annual Financial Statements by the Board of the WRC.
Mr M SirenyaChairperson
Annu
al F
inan
cial
Sta
tem
ents
55
for t
he y
ear e
nded
31
Mar
ch 2
009

Statement of Financial PositionWater Research Commission Consolidated Annual Financial Statements for the year ended 31 March 2009
Group CompanyFigures in Rands note(s) 2009 2008 2009 2008
ASSETSNon-Current AssetsProperty, plant and equipment - cost 2 11,755,924 11,233,961 3,064,402 2,542,439
Intangible assets 3 1,692,829 1,358,287 1,692,829 1,358,287
Investments in subsidiary 4 - - 755,939 755,939
Loans to group company 5 - - 5,835,646 6,236,607
Other financial assets 6 47,923,813 47,584,427 47,923,813 47,584,427
61,372,566 60,176,675 59,272,629 58,477,699Current AssetsTrade and other receivables 9 27,853,687 16,270,146 28,109,505 16,492,796
Cash and cash equivalents 10 63,580,968 88,535,614 62,368,319 87,543,054
91,434,655 104,805,760 90,477,824 104,035,850
Total Assets 152,807,221 164,982,435 149,750,453 162,513,549
nET ASSETS And LIABILITIESCapital and reservesOther reserves 21,237,357 20,667,136 21,237,357 20,667,136
Accumulated surplus 72,481,139 75,851,919 69,520,312 73,439,835
93,718,496 96,519,055 90,757,669 94,106,971
LIABILITIESNon-Current LiabilitiesFinance lease obligation 11 437,416 216,890 437,416 216,890
Retirement benefit obligation 8 28,469,981 24,253,011 28,469,981 24,253,011
28,907,397 24,469,901 28,907,397 24,469,901Current LiabilitiesFinance lease obligation 11 645,439 348,089 645,439 348,089
Trade and other payables 13 27,012,652 41,401,869 26,916,711 41,345,067
Provisions 12 2,523,237 2,243,521 2,523,237 2,243,521
30,181,328 43,993,479 30,085,387 43,936,677
Total Liabilities 59,088,725 68,463,380 58,992,784 68,406,578
Total Net Assets and Liabilities 152,807,221 164,982,435 149,750,453 162,513,549
WRC
Ann
ual R
epor
t 200
8/09
56

Statement of Financial PerformanceWater Research Commission Consolidated Annual Financial Statements for the year ended 31 March 2009
Group CompanyFigures in Rand note(s) 2009 2008 2009 2008Revenue 15 144,132,172 132,586,999 143,289,853 131,761,643
Other income 1,138,679 (878,244) 1,375,133 (654,985)
Operating expenses (154,572,326) (123,135,089) (155,487,002) (123,794,638)
Operating surplus (deficit) 16 (9,301,475) 8,573,666 (10,822,016) 7,312,020
Investment revenue 17 7,422,974 8,896,430 8,394,772 9,793,465
Finance costs 18 (1,492,279) (2,014,657) (1,492,279) (2,014,657)
Surplus (deficit) for the year (3,370,780) 15,455,439 (3,919,523) 15,090,828
Annu
al F
inan
cial
Sta
tem
ents
57
for t
he y
ear e
nded
31
Mar
ch 2
009

Statement of Changes in net AssetsWater Research Commission Consolidated Annual Financial Statements for the year ended 31 March 2009
Figures in Rand Share capital Other reservesAccumulated
surplusTotal capital and reserves
GROuPBalance at 01 April 2007 - 14,631,397 60,396,480 75,027,877Changes in net assets
Fair value of available-for-sale financial assets - 6,035,739 - 6,035,739
Net income (expenses) recognised directly in capital and reserves - 6,035,739 - 6,035,739
Surplus (deficit) for the year - - 15,455,439 15,455,439
Total recognised income and expenses for the year - 6,035,739 15,455,439 21,491,178
Total changes - 6,035,739 15,455,439 21,491,178
Opening balance as previously reported - 20,667,136 75,806,834 96,473,970
Adjustments
Prior year adjustments - - 45,085 45,085
Balance at 01 April 2008 as restated - 20,667,136 75,851,919 96,519,055Changes in net assets
Fair value of available-for-sale financial assets - 570,221 - 570,221
Net income (expenses) recognised directly in capital and reserves - 570,221 - 570,221
Surplus (deficit) for the year - - (3,370,780) (3,370,780)
Total recognised income and expenses for the year - 570,221 (3,370,780) (2,800,559)
Total changes - 570,221 (3,370,780) (2,800,559)
Balance at 31 March 2009 - 21,237,357 72,481,139 93,718,496
COMPAnYBalance at 01 April 2007 - 14,631,397 58,349,007 72,980,404Changes in capital and reserves
Fair value of available-for-sale financial assets - 6,035,739 - 6,035,739
Net income (expenses) recognised directly in capital and reserves - 6,035,739 - 6,035,739
Surplus (deficit) for the year - - 15,090,828 15,090,828
Total recognised income and expenses for the year - 6,035,739 15,090,828 21,126,567
Total changes - 6,035,739 15,090,828 21,126,567
Opening balance as previously reported - 20,667,136 73,394,750 94,061,886
Adjustments
Prior period adjustments - - 45,085 45,085
Balance at 01 April 2008 as restated - 20,667,136 73,439,835 94,106,971Changes in capital and reserves
Fair value of available-for-sale financial assets - 570,221 - 570,221
Net income (expenses) recognised directly in capital and reserves - 570,221 - 570,221
Surplus (deficit) for the year - - (3,919,523) (3,919,523)
Total recognised income and expenses for the year - 570,221 (3,919,523) (3,349,302)
Total changes - 570,221 (3,919,523) (3,349,302)
Balance at 31 March 2009 - 21,237,357 69,520,312 90,757,669
WRC
Ann
ual R
epor
t 200
8/09
58

Cash Flow StatementWater Research Commission Consolidated Annual Financial Statements for the year ended 31 March 2009
Group CompanyFigures in Rand note(s) 2009 2008 2009 2008CASH FLOWS FROM OPERATInG
ACTIvITIESCash receipts from customers 134,299,669 145,199,170 131,875,028 144,470,993
Cash paid to suppliers and employees (164,215,508) (110,022,158) (163,028,116) (110,568,373)
Cash (used in) generated from operations 21 (29,915,839) 35,177,012 (31,153,088) 33,902,620
Interest income 7,422,974 8,896,430 8,394,772 9,793,465
Finance costs (1,328,836) (1,880,810) (1,328,836) (1,880,810)
Net cash from operating activities (23,821,701) 42,192,632 (24,087,152) 41,815,275CASH FLOWS FROM InvESTInG
ACTIvITIESPurchase of property, plant and equipment - cost 2 (1,370,018) (209,609) (1,370,018) (209,609)
Purchase of other intangible assets 3 (348,195) (269,484) (348,195) (269,484)
Loans to group companies movement - - 45,362 120,496
Sale of financial assets 230,835 285,788 230,835 285,788
Net cash from investing activities (1,487,378) (193,305) (1,442,016) (72,809)CASH FLOWS FROM FInAnCInG
ACTIvITIESFinance lease movement 354,433 (659,470) 354,433 (659,470)
Total cash movement for the year (24,954,646) 41,339,857 (25,174,735) 41,082,996Cash at the beginning of the year 88,535,614 47,195,759 87,543,054 46,460,060
Total cash at end of the year 10 63,580,968 88,535,616 62,368,319 87,543,056
Annu
al F
inan
cial
Sta
tem
ents
59
for t
he y
ear e
nded
31
Mar
ch 2
009

Accounting PoliciesWater Research Commission Consolidated Annual Financial Statements for the year ended 31 March 2009
1. Basis of PreparationThe financial statements have been prepared in accordance with the South African Statements of Generally Accepted Accounting Practices (GAAP) including any interpretations of such Statements issued by the Accounting Practices Board, with the effective Standards of Generally Recognised Accounting Practices (GRAP) issued by the Accounting Standards Board replacing the equivalent GAAP Statement as follows:
Standard of GRAP Replaced Statement of GAAPGRAP 1: Presentation of financial statements AC101: Presentation of financial statementsGRAP 2: Cash flow statements AC118: Cash flow statementsGRAP 3: Accounting policies, changes in
accounting estimates and errorsAC103: Accounting policies, changes in accounting estimates and errors
Currently the recognition and measurement principles in the above GRAP and GAAP Statements do not differ or result in material differences in items presented and disclosed in the financial statements. The implementation of GRAP 1, 2 & 3 has resulted in the following changes in the presentation of the financial statements:
a. Terminology differences:
Standard of GRAP Replaced Statement of GAAPStatement of financial performance Income statementStatement of financial position Balance sheetStatement of changes in net assets Statement of changes in equityNet assets EquitySurplus (deficit) Profit/lossAccumulated surplus (deficit) Retained earningsContributions from owners Share capitalDistributions to owners Dividends
b. The cash flow statement can only be prepared in accordance with the direct method.
c. Specific information has been presented separately on the statement of financial position such as: i. Receivables from non-exchange transactions, including taxes and transfers; ii. Taxes and transfers payable; iii. Trade and other payables from non-exchange transactions;
d. Amount and nature of any restrictions on cash balances is required.
Paragraph 11 - 15 of GRAP 1 has not been implemented due to the fact that the local and international budget reporting standard is not effective for this financial year. Although the inclusion of budget information would enhance the usefulness of the financial statements, non-disclosure will not affect the objective of the financial statements.
The annual financial statements have been prepared on the historical cost basis, and incorporate the principal accounting policies set out below.
These accounting policies are consistent with the previous period.
The financial statements are presented in Rand, which is the entities functional currency. All financial information presented in Rand has been rounded to the nearest Rand.
1.1 Significant judgements In preparing the annual financial statements, management is required to make estimates and assumptions that affect the amounts represented in the annual financial statements and related disclosures. Use of available information and the application of judgement is inherent in the formation of estimates. Actual results in the future could differ from these estimates which may be material to the annual financial statements. Significant judgements include:
WRC
Ann
ual R
epor
t 200
8/09
60

Available‑for‑sale financial assets The group follows the guidance of IAS 39 to determine when an available-for-sale financial asset is impaired. This determination requires significant judgment. In making this judgment, the group evaluates, among other factors, the duration and extent to which the fair value of an investment is less than its cost; and the financial health of and near-term business outlook for the investee, including factors such as industry and sector performance, changes in technology and operational and financing cash flow.
Fair value estimation Unquoted financial assets are measured at fair value using valuation techniques. Inherent to these techniques are certain uncertainties like time of cash flows and interest rates used for discounting.
The carrying value less impairment provision of trade receivables and payables are assumed to approximate their fair values. The fair value of financial liabilities for disclosure purposes is estimated by discounting the future contractual cash flows at the current market interest rate that is available to the group for similar financial instruments.
Provisions Provisions were raised and management determined an estimate based on the information available. Additional disclosures of these estimates of provisions are included in note 12 - Provisions.
Provisions are measured at management’s best estimate of the expenditure required to settle the obligation at the reporting date, and are discounted to present value where the effect is material.
Useful lives and residual values of property, plant and equipment The entities management re-assess the useful lives and residual values of property, plant and equipment on a yearly basis. These assessments require judgements and assumptions to be made by management.
Property, plant and equipment Property, plant and equipment are stated at cost less accumulated depreciation and impairment losses. Estimates are used in the determination of the useful lives, residual values and the expected pattern of consumption of the future economic benefits embodied in the asset.
1.2 Property, plant and equipment – costThe cost of an item of property, plant and equipment is recognised as an asset when:
it is probable that future economic benefits associated with the item will flow to the entity; and•the cost of the item can be measured reliably.•
The initial estimate of the costs of dismantling and removing the item and restoring the site on which it is located is also included in the cost of property, plant and equipment.
Property, plant and equipment - cost is carried at cost less accumulated depreciation and any impairment losses.
Depreciation of an asset commences when the asset is available for use. Depreciation of an asset ceases at the earlier of the date that the asset is classified as held for sale and the date that the asset is derecognised.
Depreciation is provided on all property, plant and equipment, to write down the cost, less residual value, on a straight line basis over their useful lives as follows:
Item Minimum and maximum useful life in yearsFurniture and fixturesMinimum years 12Maximum years 37Office equipmentMinimum years 4Maximum years 37IT equipmentMinimum years 5Maximum years 16Finance lease assets years according to the lease term
Motor vehicles are depreciated on a pro rata basis calculated on the basis of kilometres travelled annually as a proportion of the expected useful life of the vehicle.
Acco
untin
g Po
licie
s
61

Buildings are not currently depreciated as the residual value is estimated to be higher than the carrying value. The depreciation charge is zero when the residual value is estimated to be higher than the carrying amount. The residual value and the useful life of each asset is reviewed at each financial period-end.
Each part of an item of property, plant and equipment with a cost that is significant in relation to the total cost of the item shall be depreciated separately. The depreciation charge for each period is recognised in surplus or deficit unless it is included in the carrying amount of another asset. The carrying amount of an item op property, plant and equipment shall be derocognised on disposal or when no future economic benefits are expected from its use or disposal.
The gain or loss arising from the derecognition of an item of property, plant and equipment are included in surplus or deficit when the item is derecognised. The gain or loss arising from the derecognition of an item of property, plant and equipment is determined as the difference between the net disposal proceeds, if any, and the carrying amount of the item.
1.3 Intangible assetsAn intangible asset is recognised when:
it is probable that the expected future economic benefits that are attributable to the asset will flow to the •entity; andthe cost of the asset can be measured reliably.•
Intangible assets are initially recognised at cost.
Expenditure on research (or on the research phase of an internal project) is recognised as an expense when it is incurred.
An intangible asset arising from development (or from the development phase of an internal project) is recognised when:it is technically feasible to complete the asset so that it will be available for use or sale;•there is an intention to complete and use or sell it;•there is an ability to use or sell it;•it will generate probable future economic benefits;• there are available technical, financial and other resources to complete the development and to use or sell •the asset; the expenditure attributable to the asset during its development can be measured reliably. •
Intangible assets are carried at cost less any accumulated amortisation and any impairment losses.
No value is attributed to internally developed patents. Costs incurred on patents, whether purchased or created by the entity, are charged to the statement of financial performance during the period in which they are incurred.
The residual value and the useful life of each asset are reviewed at each reporting date.
Amortisation of an asset commences when the asset is available for use. Amortisation of an asset ceases at the earlier of the date that the asset is classified as held for sale and the date that the asset is derecognised.
The amortisation charge for each period is recognised in surplus or deficit unless it is included in the carrying amount of another asset. The carrying amount of an intangible asset item shall be derecognised on disposal or when no future economic benefits are expected from its use or disposal.
The gain or loss arising from the derecognition of an intangible asset item is included in surplus or deficit when the item is derecognised. The gain or loss arising from the derecognition of an intangible asset item is determined as the difference between the net disposal proceeds, if any, and the carrying amount of the item.
Amortisation is provided to write down the intangible assets, on a straight line basis, to their residual values as follows:
Item Useful lifeComputer software, other 10 years
WRC
Ann
ual R
epor
t 200
8/09
62

1.4 Investments in subsidiaryGroup annual financial statements The group annual financial statements include those of the holding company and its subsidiaries. The results of the subsidiaries are included from the effective date of acquisition.
On acquisition the group recognises the subsidiary’s identifiable assets, liabilities and contingent liabilities at fair value, except for assets classified as held-for-sale, which are recognised at fair value less costs to sell.
Consolidated annual financial statements The consolidated financial statements incorporate the financial statements of the Water Research Commission and its wholly owned subsidiary. The results of the subsidiary are included from the effective date of acquisition.
Entity annual financial statementsIn the entity’s separate annual financial statements, investments in subsidiary are carried at cost less any accumulated impairment. The cost of an investment in a subsidiary is the aggregate of:
the fair value, at the date of exchange, of assets given, liabilities incurred or assumed, and equity instruments •issued by the entity; plusany costs directly attributable to the purchase of the subsidiary.•
An adjustment to the cost of a business combination contingent on future events is included in the cost of the combination if the adjustment is probable and can be measured reliably.
1.5 Financial instruments Initial recognition and measurement Financial instruments are recognised initially when the group becomes a party to the contractual provisions of the instruments.
The group classifies financial instruments, or their component parts, on initial recognition as a financial asset, a financial liability or an equity instrument in accordance with the substance of the contractual arrangement.
Financial instruments are measured initially at fair value. For financial instruments which are not at fair value through profit or loss, transaction costs are included in the initial measurement of the instrument. Regular way purchases of financial assets are accounted for at settlement date.
Subsequent measurement Financial instruments at fair value through surplus or deficit are subsequently measured at fair value, with gains and losses arising from changes in fair value being included in surplus or deficit for the period.
Loans and receivables are subsequently measured at amortised cost, using the effective interest method, less accumulated impairment losses.
Available for sale financial assets are subsequently measured at fair value. This excludes equity investments for which a fair value is not determinable, which are measured at cost less accumulated impairment losses.
Financial liabilities at amortised cost are subsequently measured at amortised cost, using the effective interest method.
Impairment of financial assets At each reporting date the group assesses all financial assets, other than those at fair value through surplus or deficit, to determine whether there is objective evidence that a financial asset or group of financial assets has been impaired.
For amounts due to the group, significant financial difficulties of the debtor, probability that the debtor will enter bankruptcy and default of payments are all considered indicators of impairment.
Impairment losses are recognised in surplus or deficit. Impairment losses are reversed when an increase in the financial asset’s recoverable amount can be related objectively to an event occurring after the impairment was recognised, subject to the restriction that the carrying amount of the financial asset at the date that the impairment is reversed shall not exceed what the carrying amount would have been had the impairment not been recognised.
Reversals of impairment losses are recognised in surplus or deficit except for equity investments classified as available for sale.
Impairment losses are also not subsequently reversed for available-for-sale equity investments which are held at cost because fair value was not determinable.
Acco
untin
g Po
licie
s
63
Where financial assets are impaired through use of an allowance account, the amount of the loss is recognised in surplus or deficit within operating expenses. When such assets are written off, the write off is made against the relevant allowance account. Subsequent recoveries of amounts previously written off are credited against operating expenses.
Loans to (from) group company These include loans to and from holding companies, fellow subsidiaries, subsidiaries, joint ventures and associates and are recognised initially at fair value plus direct transaction costs.
Loans to group companies are classified as loans and receivables. Subsequently these loans are measured at amortised cost using the effective interest rate method, less any impairment loss recognised to reflect irrecoverable amounts.
Trade and other receivables Trade receivables are measured at initial recognition at fair value, and are subsequently measured at amortised cost using the effective interest rate method. Appropriate allowances for estimated irrecoverable amounts are recognised in surplus or deficit when there is objective evidence that the asset is impaired. Significant financial difficulties of the debtor, probability that the debtor will enter bankruptcy or financial reorganisation, and default or delinquency in payments (more than 30 days overdue) are considered indicators that the trade receivable is impaired. The allowance recognised is measured as the difference between the asset’s carrying amount and the present value of estimated future cash flows discounted at the effective interest rate computed at initial recognition.
Trade and other receivables are classified as loans and receivables.
Trade and other payables Trade payables are initially measured at fair value, and are subsequently measured at amortised cost, using the effective interest rate method.
Cash and cash equivalents Cash and cash equivalents comprise cash on hand and demand deposits, and other short-term highly liquid investments that are readily convertible to a known amount of cash and are subject to an insignificant risk of changes in value. These are initially and subsequently recorded at fair value.
Cash includes cash on hand, deposits held on call with Corporation for Public Deposits and bank balances.
1.6 LeasesA lease is classified as a finance lease if it transfers substantially all the risks and rewards incidental to ownership. A lease is classified as an operating lease if it does not transfer substantially all the risks and rewards incidental to ownership.
Finance leases – lessee Finance leases are recognised as assets and liabilities in the statement of financial position at amounts equal to the fair value of the leased property or, if lower, the present value of the minimum lease payments. The corresponding liability to the lessor is included in the statement of financial position as a finance lease obligation.
The discount rate used in calculating the present value of the minimum lease payments is the interest rate implicit in the lease.
The lease payments are apportioned between the finance charge and reduction of the outstanding liability. The finance charge is allocated to each period during the lease term so as to produce a constant periodic rate of on the remaining balance of the liability.
Operating leases – lessee Operating lease payments are recognised as an expense on a straight-line basis over the lease term. The difference between the amounts recognised as an expense and the contractual payments are recognised as an operating lease asset. This liability is not discounted.
Any contingent rents are expensed in the period they are incurred.
1.7 Impairment of assets The group assesses at each reporting date whether there is any indication that an asset may be impaired. If any such indication exists, the group estimates the recoverable amount of the asset.
If there is any indication that an asset may be impaired, the recoverable amount is estimated for the individual asset. If it is not possible to estimate the recoverable amount of the individual asset, the recoverable amount of the cash-generating unit to which the asset belongs is determined.
WRC
Ann
ual R
epor
t 200
8/09
64

The recoverable amount of an asset or a cash-generating unit is the higher of its fair value less costs to sell and its value in use.
If the recoverable amount of an asset is less than its carrying amount, the carrying amount of the asset is reduced to its recoverable amount. That reduction is an impairment loss.
An impairment loss of assets carried at cost less any accumulated depreciation or amortisation is recognised immediately in surplus or deficit. Any impairment loss of a revalued asset is treated as a revaluation decrease.
An entity assesses at each reporting date whether there is any indication that an impairment loss recognised in prior periods for assets other than goodwill may no longer exist or may have decreased. If any such indication exists, the recoverable amounts of those assets are estimated.
A reversal of an impairment loss of assets carried at cost less accumulated depreciation or amortisation other than goodwill is recognised immediately in surplus or deficit. Any reversal of an impairment loss of a revalued asset is treated as a revaluation increase.
1.8 Employee benefits Short‑term employee benefits The cost of short-term employee benefits, (those payable within 12 months after the service is rendered, such as paid vacation leave and sick leave, bonuses, and non-monetary benefits such as medical care), are recognised in the period in which the service is rendered and are not discounted.
The expected cost of compensated absences is recognised as an expense as the employees render services that increase their entitlement or, in the case of non-accumulating absences, when the absence occurs.
The expected cost of profit sharing and bonus payments is recognised as an expense when there is a legal or constructive obligation to make such payments as a result of past performance.
Defined contribution plans Payments to defined contribution retirement benefit plans are charged as an expense as they fall due.
Payments made to industry-managed (or state plans) retirement benefit schemes are dealt with as defined contribution plans where the group’s obligation under the schemes is equivalent to those arising in a defined contribution retirement benefit plan.
Defined benefit plans For defined benefit plans the cost of providing the benefits is determined using the projected credit method.
Actuarial valuations are conducted on an annual basis by independent actuaries separately for each plan. Consideration is given to any event that could impact the funds up to reporting date where the interim valuation is performed at an earlier date.
Past service costs are recognised immediately to the extent that the benefits are already vested, and are otherwise amortised on a straight line basis over the average period until the amended benefits become vested.
To the extent that, at the beginning of the financial period, any cumulative unrecognised actuarial gain or loss exceeds ten percent of the greater of the present value of the projected benefit obligation and the fair value of the plan assets (the corridor), that portion is recognised in the statement of financial performance over the expected average remaining service lives of participating employees. Actuarial gains or losses within the corridor are not recognised.
Gains or losses on the curtailment or settlement of a defined benefit plan is recognised when the entity is demonstrably commited to curtailment or settlement.
When it is virtually certain that another party will reimburse some or all of the expenditure required to settle a defined benefit obligation, the right to reimbursement is recognised as a separate asset. The asset is measured at fair value. In all other respects, the asset is treated in the same way as plan assets. In the statement of financial performance, the expense relating to a defined benefit plan is presented as the net of the amount recognised for a reimbursement.
The amount recognised in the statement of financial position represents the present value of the defined benefit obligation as adjusted for unrecognised actuarial gains and losses and unrecognised past service costs, and reduces by the fair value of plan assets. Any asset is limited to unrecognised actuarial losses, plus the present value of available refunds and reduction in future contributions to the plan.
Acco
untin
g Po
licie
s
65

1.9 Provisions and contingenciesProvisions are recognised when:
the group has a present obligation as a result of a past event;• it is probable that an outflow of resources embodying economic benefits will be required to settle the •obligation; and a reliable estimate can be made of the obligation. •
The amount of a provision is the present value of the expenditure expected to be required to settle the obligation.
Where some or all of the expenditure required to settle a provision is expected to be reimbursed by another party, the reimbursement shall be recognised when, and only when, it is virtually certain that reimbursement will be received if the entity settles the obligation. The reimbursement shall be treated as a separate asset. The amount recognised for the reimbursement shall not exceed the amount of the provision.
Provisions are not recognised for future operating losses. If an entity has a contract that is onerous, the present obligation under the contract shall be recognised and measured as a provision.
A constructive obligation to restructure arises only when an entity: has a detailed formal plan for the restructuring, identifying at least: •- the business or part of a business concerned; - the principal locations affected; - the location, function, and approximate number of employees who will be compensated for terminating their services; - the expenditures that will be undertaken; and - when the plan will be implemented; and has raised a valid expectation in those affected that it will carry out the restructuring by starting to implement •that plan or announcing its main features to those affected by it.
After their initial recognition contingent liabilities recognised in business combinations that are recognised separately aresubsequently measured at the higher of:
the amount that would be recognised as a provision; and•the amount initially recognised less cumulative amortisation.•
Contingent assets and contingent liabilities are not recognised.
1.10 Irregular and fruitless and wasteful expenditureIrregular expenditure Irregular expenditure is expenditure in contravention of or that is not in accordance with a requirement of any applicable legislation, including the PFMA, the State Tender Board Act or any regulations made in terms of this Act and any provincial legislation providing for procurement procedures in that provincial government. Irregular expenditure is accounted for as expenditure in the Statement of Financial Performance and where recovered it is subsequently accounted for as other income in the Statement of Financial Performance.
Fruitless and wasteful expenditure The entity considers fruitless and wasteful expenditure to be expenditure which was made in vain and would have been avoided had reasonable care been exercised. Fruitless and wasteful expenditure is measured at cost and is charged against income in the period in which they are incurred and disclosed in accordance with the PFMA.
1.11 Revenue Revenue is measured at the fair value of the consideration received or receivable and represents the amounts receivable for goods and services provided in the normal course of business, net of trade discounts and volume rebates, and value added tax.
Interest is recognised, in surplus or deficit, using the effective interest rate method.
The Department of Water Affairs and Forestry, Rand Water and Umgeni Water Boards collect levy income. The rate of the levy is approved by the Minister of Water Affairs and Forestry on an annual basis. Revenue recognition of levy income represents amounts received and receivable from the Department of Water Affairs and Forestry, Rand Water and Umgeni Water Boards. Provision is made for estimated uncollectable levies by way of an impairment charge.
WRC
Ann
ual R
epor
t 200
8/09
66

1.12 Leverage income The WRC received leverage income from various sources which is provided for research. This revenue is recognised in the accounting period in which the research expenditure is incurred.
1.13 Related Parties The group follows the guidance of IAS 24 to identify related party relationships, transactions and balances and the disclosures on those identified.
1.14 Borrowing costs Borrowing costs are recognised as an expense in the period in which they are incurred, unless they are incurred on the construction or acquisition of a qualifying asset in which case they are capitalised to the cost of the asset.
1.15 Translation of foreign currencies Foreign currency transactions A foreign currency transaction is recorded, on initial recognition in Rand, by applying to the foreign currency amount the spot exchange rate between the functional currency and the foreign currency at the date of the transaction.
At each reporing date: foreign currency monetary items are translated using the closing rate;• non-monetary items that are measured in terms of historical cost in a foreign currency are translated using the •exchange rate at the date of the transaction; and non-monetary items that are measured at fair value in a foreign currency are translated using the exchange rates at •the date when the fair value was determined.
Exchange differences arising on the settlement of monetary items or on translating monetary items at rates different from those at which they were translated on initial recognition during the period or in previous annual financial statements are recognised in surplus or deficit in the period in which they arise.
When a gain or loss on a non-monetary item is recognised directly in net assets, any exchange component of that gain or loss is recognised directly in net assets. When a gain or loss on a non-monetary item is recognised in surplus or deficit, any exchange component of that gain or loss is recognised in surplus or deficit.
Cash flows arising from transactions in a foreign currency are recorded in Rand by applying to the foreign currency amount the exchange rate between the Rand and the foreign currency at the date of the cash flow.
1.16 Research projects and research support services It is the policy of the Water Research Commission that its management may allow overspending on a project budget in a given year, only if acceptable reasons are given, provided the total contract amount is not exceeded.
1.17 Standards not yet effective As explained in note 1 of the Accounting Policies, the basis of accounting is South African Statements of Generally Accepted Accounting Practice (GAAP) with the effective standards of Generally Recognised Accounting Practices (GRAP) issued by the Accounting Standards Board replacing the equivalent GAAP Statement. The following GAAP Statements, with their estimated effect on the financial statements, have been issued but are not yet effective as at 31 March 2009:
Amendment to IFRS 2(AC 139) IFRS 2 - Share-based Payment: Vesting Conditions and Cancellations IASB Issue date: January 2008 APB Issue date: February 2008Effective date: 1 January 2009 This standard is expected to be implemented by the entity in the next financial year in accordance with its effective date. The impact of implementing this standard is expected to be immaterial in the context of this entity’s operations.
Acco
untin
g Po
licie
s
67

Revised IFRS 3(AC 140)* Business CombinationsIASB Issue date: January 2008 APB Issue date: February 2008Effective date: 1 July 2009 This standard is expected to be implemented by the entity in the next financial year in accordance with its effective date. The impact of implementing this standard is expected to be immaterial in the context of this entity’s operations.
IAS 23(AC 114) Borrowing CostsIASB Issue date: March 2007APB Issue date: August 2007Effective date: 1 January 2009 This standard is expected to be implemented by the entity in the next financial year in accordance with its effective date. The impact of implementing this standard is expected to be immaterial in the context of this entity’s operations.
Revised IAS 27(AC 132)* Consolidated and Separate Financial Statements IASB Issue date: January 2008 APB Issue date: February 2008Effective date: 1 July 2009 This standard is expected to be implemented by the entity in the next financial year in accordance with its effective date. The impact of implementing this standard is expected to be immaterial in the context of this entity’s operations.
Amendments to IAS 32(AC 125) IAS 1(AC 101) Financial Instruments: Presentation and Presentation of Financial Statements: Puttable Financial
Instruments and Obligations Arising on Liquidation IASB Issue date: February 2008 Not yet approved by APB Effective date: 1 January 2009 This standard is expected to be implemented by the entity in the next financial year in accordance with its effective date. The impact of implementing this standard is expected to be immaterial in the context of this entity’s operations.
IFRIC 13(AC 446) Customer Loyalty Programmes IFRIC Issue date: June 2007 APB Issue date: August 2007Effective date: 1 July 2008 This standard is expected to be implemented by the entity in the next financial year in accordance with its effective date. The impact of implementing this standard is expected to be immaterial in the context of this entity’s operations.
IFRIC 14(AC 447) The Limit on a Defined Benefit Asset, Minimum Funding Requirements and their Interaction IFRIC Issue date: July 2007
APB Issue date: August 2007 Effective date: 1 January 2008 This standard is expected to be implemented by the entity in the next financial year in accordance with its effective date. The impact of implementing this standard is expected to be immaterial in the context of this entity’s operations.
*These revisions have made consequential amendments to IAS 28(AC 110) - Investments in Associates and IAS 31(AC 119) - Interests in Joint Ventures.
WRC
Ann
ual R
epor
t 200
8/09
68

In addition to the above, the following GRAP standards have been approved but are not yet effective: GRAP 4 - The Effects of changes in Foreign Exchange Rates GRAP 5 - Borrowing Costs GRAP 6 - Consolidated and Separate Financial Statements GRAP 7 - Investments in Associate GRAP 8 - Interest in Joint Ventures GRAP 9 - Revenue from Exchange Transactions GRAP 10 - Financial Reporting in Hyperinflationary Economies GRAP 11 - Construction Contracts GRAP 12 - Inventories GRAP 13 - Leases GRAP 14 - Events after the reporting date GRAP 16 - Investment Property GRAP 17 - Property Plant and Equipment GRAP 18 - Segment Reporting GRAP 19 - Provisions, Contingent Liabilities and Contingent Assets GRAP 23 - Revenue from Non-exchange Transactions (Taxes and Transfers) GRAP 24 - Presentation of Budget Information in Financial StatementsGRAP 100 - Non-current Assets held for Sale and Discontinued Operations GRAP 101 - Agriculture GRAP 102 - Intangible Assets
The effective dates of the above standards are not yet known. The effect of adopting these GRAP Standards when they become effective is not expected to have a significant impact on the financial statements as the principles are similar to those already applied under the equivalent Statements of SA GAAP.
Acco
untin
g Po
licie
s
69
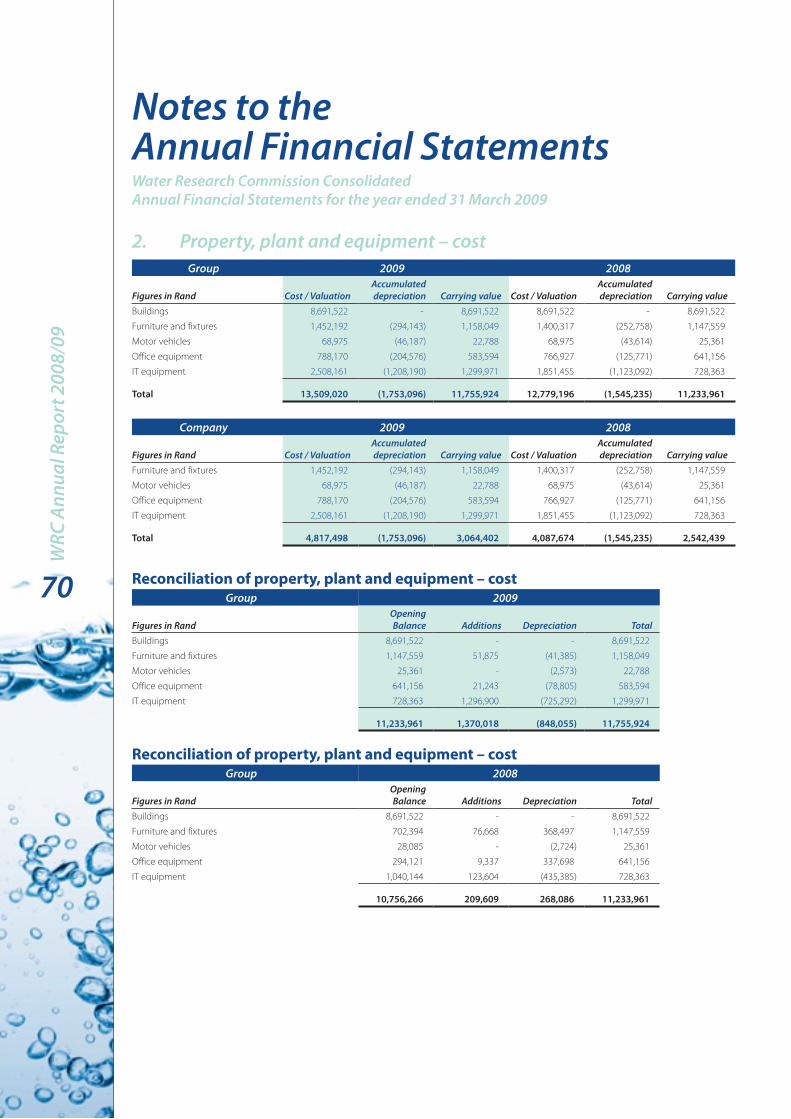
notes to the Annual Financial StatementsWater Research Commission ConsolidatedAnnual Financial Statements for the year ended 31 March 2009
2. Property, plant and equipment – costGroup 2009 2008
Figures in Rand Cost / valuationAccumulated depreciation Carrying value Cost / valuation
Accumulated depreciation Carrying value
Buildings 8,691,522 - 8,691,522 8,691,522 - 8,691,522
Furniture and fixtures 1,452,192 (294,143) 1,158,049 1,400,317 (252,758) 1,147,559
Motor vehicles 68,975 (46,187) 22,788 68,975 (43,614) 25,361
Office equipment 788,170 (204,576) 583,594 766,927 (125,771) 641,156
IT equipment 2,508,161 (1,208,190) 1,299,971 1,851,455 (1,123,092) 728,363
Total 13,509,020 (1,753,096) 11,755,924 12,779,196 (1,545,235) 11,233,961
Company 2009 2008
Figures in Rand Cost / valuationAccumulated depreciation Carrying value Cost / valuation
Accumulated depreciation Carrying value
Furniture and fixtures 1,452,192 (294,143) 1,158,049 1,400,317 (252,758) 1,147,559
Motor vehicles 68,975 (46,187) 22,788 68,975 (43,614) 25,361
Office equipment 788,170 (204,576) 583,594 766,927 (125,771) 641,156
IT equipment 2,508,161 (1,208,190) 1,299,971 1,851,455 (1,123,092) 728,363
Total 4,817,498 (1,753,096) 3,064,402 4,087,674 (1,545,235) 2,542,439
Reconciliation of property, plant and equipment – costGroup 2009
Figures in RandOpening Balance Additions depreciation Total
Buildings 8,691,522 - - 8,691,522
Furniture and fixtures 1,147,559 51,875 (41,385) 1,158,049
Motor vehicles 25,361 - (2,573) 22,788
Office equipment 641,156 21,243 (78,805) 583,594
IT equipment 728,363 1,296,900 (725,292) 1,299,971
11,233,961 1,370,018 (848,055) 11,755,924
Reconciliation of property, plant and equipment – costGroup 2008
Figures in RandOpening Balance Additions depreciation Total
Buildings 8,691,522 - - 8,691,522
Furniture and fixtures 702,394 76,668 368,497 1,147,559
Motor vehicles 28,085 - (2,724) 25,361
Office equipment 294,121 9,337 337,698 641,156
IT equipment 1,040,144 123,604 (435,385) 728,363
10,756,266 209,609 268,086 11,233,961
WRC
Ann
ual R
epor
t 200
8/09
70

Reconciliation of property, plant and equipment – costCompany 2009
Figures in RandOpening Balance Additions depreciation Total
Furniture and fixtures 1,147,559 51,875 (41,385) 1,158,049
Motor vehicles 25,361 - (2,573) 22,788
Office equipment 641,156 21,243 (78,805) 583,594
IT equipment 728,363 1,296,900 (725,292) 1,299,971
2,542,439 1,370,018 (848,055) 3,064,402
Reconciliation of property, plant and equipment – costCompany 2008
Figures in RandOpening Balance Additions depreciation Total
Furniture and fixtures 702,394 76,668 368,497 1,147,559
Motor vehicles 28,085 - (2,724) 25,361
Office equipment 294,121 9,337 337,698 641,156
IT equipment 1,040,144 123,604 (435,385) 728,363
2,064,744 209,609 268,086 2,542,439
Revaluations The property has been valued at R28,000,000 by Reinertsen International Valuation Services, as an independant valuer, on 27 March 2009.
Other information Group Company
Figures in Rand 2009 2008 2009 2008Fair value of property, plant and equipment carried at cost 28,000,000 26,800,000 - -
Details of propertiesGroup Company
Figures in Rand 2009 2008 2009 2008Erf 706 Rietfontein, Pretoria, Gauteng
- Purchase price 615,855 615,855 - -
- Additions since purchase or valuation 8,075,667 8,075,667 - -
8,691,522 8,691,522 - -
The carrying amount of IT equipment includes an amount of R970,057 (2008: R 464,109) in respect of assets held underfinance leases by the Water Research Commission.
3. Intangible assetsGroup 2009 2008
Figures in Rand Cost / valuationAccumulated amortisation Carrying value Cost / valuation
Accumulated amortisation Carrying value
Computer software 1,706,482 (13,653) 1,692,829 1,358,287 - 1,358,287
Company 2009 2008
Figures in Rand Cost / valuationAccumulated amortisation Carrying value Cost / valuation
Accumulated amortisation Carrying value
Computer software 1,706,482 (13,653) 1,692,829 1,358,287 - 1,358,287
not
es to
the
Annu
al F
inan
cial
Sta
tem
ents
71

Reconciliation of intangible assets Group 2009 2008
Figures in RandOpening Balance Additions Amortisation Total
Opening Balance Additions Total
Computer software 1,358,287 348,195 (13,653) 1,692,829 1,088,803 269,484 1,358,287
Reconciliation of intangible assets Company 2009 2008
Figures in RandOpening Balance Additions Amortisation Total
Opening Balance Additions Total
Computer software 1,358,287 348,195 (13,653) 1,692,829 1,088,803 269,484 1,358,287
4. Investments in subsidiary
name of company Held by% holding
2009% holding
2008Carrying
amount 2009Carrying
amount 2008
Erf 706 Rietfontein (Proprietary) Limited
Water Research
Commission 100% 100% 755,939 755,939
The Commission holds 100% of the shares in Erf sewe nul ses Rietfontein (Pty) Ltd, a property company. Erf sewe nul ses Rietfontein (Pty) Ltd owns one property which is mainly occupied by the Water Research Commission. As per the valuation performed by Reinertsen Valuation Services, a professional valuer, the open market value of the property is valued at R 28,000,000. Management thereofore deems the fair value of Erf sewe nul ses Rietfontein (Pty) Ltd to be equal to the market value of the property held by Erf sewe nul ses Rietfontein (Pty) Ltd.
5. Loans to group companySubsidiaries
Group CompanyFigures in Rand 2009 2008 2009 2008Erf 706 Rietfontein (Proprietary) Limited - - 7,732,302 7,900,577
The unsecured loan bears interest at a nominal rate of 15% and is repayable in equal monthly instalments of R60,000 over 13 years.
Erf 706 Rietfontein (Proprietary) Limited - - 2,607,164 2,484,251
The unsecured loan bears interest at prime plus 2% with no fixed terms of repayment.
Subtotal - - 10,339,466 10,384,828
Impairment of loans to subsidiaries - - (4,503,820) (4,148,221)
- - 5,835,646 6,236,607
Credit quality of loans to group companies The credit quality of loans to group companies are of a good quality. The maximum exposure to credit risk at the reporting date is the fair value of loans mentioned above.
None of the loans to group companies defaulted in the year under review.
The terms and conditions of the loans were not renegotiated during the period under review.
Loans to group companies past due but not impaired Loans to group companies were not past due at reporting date.
Loans to group companies pledged as collateralNone of the loans to group companies were pledged as security for any financial liability.
WRC
Ann
ual R
epor
t 200
8/09
72

6. Other financial assetsGroup Company
Figures in Rand 2009 2008 2009 2008
AvAILABLE FOR SALEOld Mutual 44,350,913 42,602,243 44,350,913 42,602,243
Momentum Wealth 3,572,900 4,982,184 3,572,900 4,982,184
47,923,813 47,584,427 47,923,813 47,584,427
National Treasury has granted exemption from the requirement to invest surplus cash with the Corporation for Public Deposits in terms of Treasury Regulation 31.3.3. National Treasury has also confirmed that the above investments are in compliance with Treasury Regulation 31.3.5.
Group CompanyFigures in Rand 2009 2008 2009 2008
nOn-CuRREnT ASSETSAvailable for sale 47,923,813 47,584,427 47,923,813 47,584,427
Fair values are determined annually at reporting date and no assumptions are made. For debt securities classified as at fair value through surplus or deficit, the maximum exposure to credit risk at the reporting date is the carrying amount. The group has not reclassified any financial assets from cost or amortised cost to fair value, or from fair value to cost or amortised cost during the current or prior year.
There were no gains or losses realised on the disposal of held to maturity financial assets in 2009 and 2008, as all the financial assets were disposed of at their redemption date. The maximum exposure to credit risk at the reporting date is the fair value of each class of loan mentioned above. The group does not hold any collateral as security.
7. Financial assets by categoryThe accounting policies for financial instruments have been applied to the line items below:
Group 2009
Figures in RandLoans and
receivables
Fair value through surplus
or deficit - held for trading
Fair value through surplus
or deficit - designated
Available for sale Total
Other financial assets - - - 47,923,813 47,923,813
Trade and other receivables 27,853,687 - - - 27,853,687
Cash and cash equivalents - 63,580,968 - - 63,580,968
27,853,687 63,580,968 - 47,923,813 139,358,468
Group 2008
Figures in RandLoans and
receivables
Fair value through surplus
or deficit - held for trading
Fair value through surplus
or deficit - designated
Available for sale Total
Other financial assets - - - 47,584,427 47,584,427
Trade and other receivables 16,270,146 - - - 16,270,146
Cash and cash equivalents - 88,535,614 - - 88,535,614
16,270,146 88,535,614 - 47,584,427 152,390,187
not
es to
the
Annu
al F
inan
cial
Sta
tem
ents
73

Company 2009
Figures in RandLoans and
receivables
Fair value through surplus
or deficit - held for trading
Fair value through surplus
or deficit - designated
Available for sale Total
Loans to group companies 5,835,646 - - - 5,835,646
Other financial assets - - - 47,923,813 47,923,813
Trade and other receivables 28,109,505 - - - 28,109,505
Cash and cash equivalents - 62,368,319 - - 62,368,319
Investment in subsidiary - - - 755,939 755,939
33,945,151 62,368,319 - 48,679,752 144,993,222
Company 2008
Figures in RandLoans and
receivables
Fair value through surplus
or deficit - held for trading
Fair value through surplus
or deficit - designated
Available for sale Total
Loans to group companies 6,236,607 - - - 6,236,607
Other financial assets - - - 47,584,427 47,584,427
Trade and other receivables 16,492,796 - - - 16,492,796
Cash and cash equivalents - 87,543,054 - - 87,543,054
Investment in subsidiary - - - 755,939 755,939
22,729,403 87,543,054 - 48,340,366 158,612,823
8. Retirement benefitsDefined contribution plan – pension and provident schemes The Water Research Commission has pension and provident schemes covering all employees. Until 31 March 2005 all eligible employees were members of the defined benefit funds administered by ABSA Consultants & Actuaries. As at 1 April 2005 both the pension fund and provident fund converted to a defined contribution fund, for current employees. The effect of this is that the WRC has no liability other than the defined contributions payable to the fund on a monthly basis. No liability can arise due to adverse market conditions. However, all pensioners remain entitled to their benefits in terms of the old dispensation. (Refer to note 1.8).
The assets of these funds are held in adminstered trust funds separately from the entity’s assets. Fund assets primarily consist of investments in Momentum Group Life Limited. The funds are governed by the Pension Funds Act of 1956.
These funds are actuarially valued for financial reporting purposes at annual intervals to determine the liability for the entity. The funds were last actuarially valued on 31 March 2009. At that time all funds were certified by the reporting actuary as being in a sound financial position, subject to the continuation of their current contribution rates. In arriving at his conclusion, the actuary took into account certain assumptions at reporting date (expressed as weighted averages).
Medical Aid scheme The Water Research Commission has made provision for a medical aid benefit scheme covering retired members and active employees before 1 April 2008. All eligible employees are members of the defined contribution scheme. The funds are governed by the Medical Schemes Act, 1998 (Act No. 131 of 1998).
These funds are actuarially valued at an interval of not more than three years using the projected unit credit method. No plan assets are held by the entity to fund the obligation. The scheme was last actuarially valued on 31 March 2009. At that time the reporting actuary certified that the vested liability for continuation members will fluctuate depending on the mortality rate of current continuation members and the rate of new retirements over the next few years. The active member liability will be affected by whether the actual withdrawals match those expected and the rate of medical aid inflation. In arriving at his conclusion, the actuary took into account certain assumptions at reporting date (expressed as weighted averages).
WRC
Ann
ual R
epor
t 200
8/09
74

Carrying value Group Company
Figures in Rand 2009 2008 2009 2008Present value of the defined contribution/benefit obligation-partially or wholly funded (33,936,981) (30,277,011) (33,936,981) (30,277,011)
Fair value of plan assets 5,467,000 6,024,000 5,467,000 6,024,000
(28,469,981) (24,253,011) (28,469,981) (24,253,011)
Movements for the year – pension fundGroup Company
Figures in Rand 2009 2008 2009 2008Opening balance 546,000 511,000 546,000 511,000
Net expense recognised in the statement of financial performance 348,000 35,000 348,000 35,000
894,000 546,000 894,000 546,000
Net expense recognised in the statement of financial performance – pension fundGroup Company
Figures in Rand 2009 2008 2009 2008Interest cost 405,000 332,000 405,000 332,000
Actuarial (gains) losses 285,000 45,000 285,000 45,000
Expected return on plan assets (342,000) (342,000) (342,000) (342,000)
348,000 35,000 348,000 35,000
Key assumptions used – pension fundAssumptions used on last valuation on 31 March 2009.
Group Company2009 2008 2009 2008
Discount rates used 8.00% 9.30% 8.00% 9.30%
Expected rate of return on assets 9.90% 10.80% 9.90% 10.80%
General inflation rate 5.90% 6.80% 5.90% 6.80%
Expected increase in salaries 8.00% 7.80% 8.00% 7.80%
The expected rate of return on assets is based on the assumption that the investment returns will exceed general inflationby 4% after allowing for investment related expenses.
Movements for the year – provident fundGroup Company
Figures in Rand 2009 2008 2009 2008Opening balance 308,000 264,000 308,000 264,000
Net expense recognised in the statement of financial performance 172,000 44,000 172,000 44,000
480,000 308,000 480,000 308,000
Net expense recognised in the statement of financial performance – provident fundGroup Company
Figures in Rand 2009 2008 2009 2008Interest cost 202,000 166,000 202,000 166,000
Actuarial (gains) losses 137,000 48,000 137,000 48,000
Expected return on plan assets (167,000) (170,000) (167,000) (170,000)
172,000 44,000 172,000 44,000
not
es to
the
Annu
al F
inan
cial
Sta
tem
ents
75
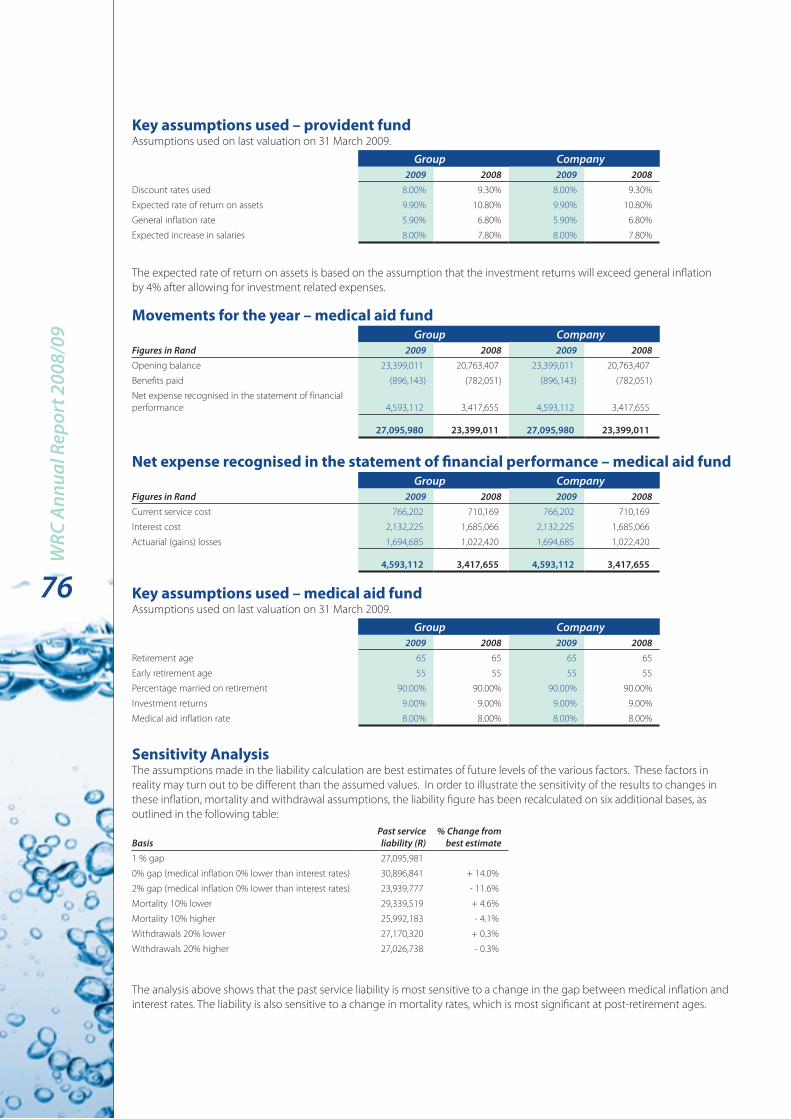
Key assumptions used – provident fundAssumptions used on last valuation on 31 March 2009.
Group Company2009 2008 2009 2008
Discount rates used 8.00% 9.30% 8.00% 9.30%
Expected rate of return on assets 9.90% 10.80% 9.90% 10.80%
General inflation rate 5.90% 6.80% 5.90% 6.80%
Expected increase in salaries 8.00% 7.80% 8.00% 7.80%
The expected rate of return on assets is based on the assumption that the investment returns will exceed general inflationby 4% after allowing for investment related expenses.
Movements for the year – medical aid fundGroup Company
Figures in Rand 2009 2008 2009 2008Opening balance 23,399,011 20,763,407 23,399,011 20,763,407
Benefits paid (896,143) (782,051) (896,143) (782,051)
Net expense recognised in the statement of financial performance 4,593,112 3,417,655 4,593,112 3,417,655
27,095,980 23,399,011 27,095,980 23,399,011
Net expense recognised in the statement of financial performance – medical aid fundGroup Company
Figures in Rand 2009 2008 2009 2008Current service cost 766,202 710,169 766,202 710,169
Interest cost 2,132,225 1,685,066 2,132,225 1,685,066
Actuarial (gains) losses 1,694,685 1,022,420 1,694,685 1,022,420
4,593,112 3,417,655 4,593,112 3,417,655
Key assumptions used – medical aid fundAssumptions used on last valuation on 31 March 2009.
Group Company2009 2008 2009 2008
Retirement age 65 65 65 65
Early retirement age 55 55 55 55
Percentage married on retirement 90.00% 90.00% 90.00% 90.00%
Investment returns 9.00% 9.00% 9.00% 9.00%
Medical aid inflation rate 8.00% 8.00% 8.00% 8.00%
Sensitivity Analysis The assumptions made in the liability calculation are best estimates of future levels of the various factors. These factors in reality may turn out to be different than the assumed values. In order to illustrate the sensitivity of the results to changes in these inflation, mortality and withdrawal assumptions, the liability figure has been recalculated on six additional bases, as outlined in the following table:
BasisPast service liability (R)
% Change from best estimate
1 % gap 27,095,981
0% gap (medical inflation 0% lower than interest rates) 30,896,841 + 14.0%
2% gap (medical inflation 0% lower than interest rates) 23,939,777 - 11.6%
Mortality 10% lower 29,339,519 + 4.6%
Mortality 10% higher 25,992,183 - 4.1%
Withdrawals 20% lower 27,170,320 + 0.3%
Withdrawals 20% higher 27,026,738 - 0.3%
The analysis above shows that the past service liability is most sensitive to a change in the gap between medical inflation and interest rates. The liability is also sensitive to a change in mortality rates, which is most significant at post-retirement ages.
WRC
Ann
ual R
epor
t 200
8/09
76

A change in withdrawal rates has an insignificant effect on the liability, as the average age for in service members is within the 45-50 age band and withdrawal rates fall to zero after age 50. The following table shows the sensitivity of the interest cost and service cost to a change in the medical inflation rate:
Basis Interest Cost (R)% Change from
best estimate Service Cost (R)% Change from
best estimate1% gap (best estimate) 2,445,926 698,781
0% gap (medical inflation 0% lower than interest rates) 2,803,199 + 14.6% 868,122 + 24.2%
2% gap (medical inflation 2% lower than interest rates 2,150,069 - 12.1% 567,186 - 18.8%
9. Trade and other receivablesGroup Company
Figures in Rand 2009 2008 2009 2008Water research levies 27,261,633 10,629,922 27,538,388 10,871,004
VAT 11,183 8,678 - -
Computer loans 955 4,842 955 4,842
Other receivables 579,916 5,626,704 570,162 5,616,950
27,853,687 16,270,146 28,109,505 16,492,796
Trade and other receivables pledged as security
No trade and other receivables were pledged as security for any financial liability.
Management considers that all the above financial assets are of good credit quality. The maximum exposure to credit risk at the reporting date is the fair value of each class of receivable mentioned above. None of the trade and other receivables defaulted in the year under review. None of the financial assets that are fully performing have been renegotiated in the last year.
Trade and other receivables past due but not impaired
Trade and other receivables are all considered for impairment. At 31 March 2009, R 257,754 (2008: R 931,034) were past due but not impaired. The ageing of amounts past due but not impaired is as follows:
Group CompanyFigures in Rand 2009 2008 2009 20081 month past due 19,168 701,120 19,168 701,120
2 months past due 1,292 - 1,292 -
3 months or more past due 237,294 229,914 237,294 229,914
not
es to
the
Annu
al F
inan
cial
Sta
tem
ents
77

Trade and other receivables impaired As of 31 March 2009, trade and other receivables of R 153,043- (2008: R -) were impaired and provided for. The amount of the provision was R(18,812,300) as of 31 March 2009 (2008: R18,659,257 ). The ageing of these loans is as follows:
Group CompanyFigures in Rand 2009 2008 2009 2008Current - Gross 27,769,352 15,329,359 28,034,924 15,561,763
1 Month past due - Gross 19,463 701,120 19,463 701,120
2 Months past due - Gross 96,172 - 96,172 -
3 Months or more past due - Gross 18,781,000 18,898,924 18,771,246 18,889,170
Current - Impaired amount (53,003) - (53,003) -
1 Month past due - Impaired amount (295) - (295) -
2 Months past due - Impaired amount (94,879) - (94,879) -
3 Months or more past due - Impaired amount (18,664,123) (18,659,257) (18,664,123) (18,659,257)
Balance 27,853,687 16,270,146 28,109,505 16,492,796
Reconciliation of provision for impairment of trade and other receivables.
Group CompanyFigures in Rand 2009 2008 2009 2008Opening balance 18,659,257 18,659,257 18,659,257 18,659,257
Provision for impairment 153,043 - 153,043 -
18,812,300 18,659,257 18,812,300 18,659,257
The creation and release of provision for impaired receivables have been included in operating expenses in the statement of financial performance (note 16). Amounts charged to the allowance account are generally written off when there is no expectation of recovering additional cash. The maximum exposure to credit risk at the reporting date is the fair value of each class of receivable mentioned above. The group does not hold any collateral as security.
10. Cash and cash equivalents Cash and cash equivalents consist of:
Group CompanyFigures in Rand 2009 2008 2009 2008Cash on hand 964 1,029 964 1,029
Bank balances 49,924,007 51,959,798 48,711,358 50,967,238
Short-term deposits 13,655,997 36,574,787 13,655,997 36,574,787
63,580,968 88,535,614 62,368,319 87,543,054
All cash and cash equivalents held by the entity are available for use.
Management considers that all the above cash and cash equivalent categories are of good quality. The maximum exposure to credit risk at the reporting date is the fair value of each class of cash and cash equivalent mentioned above. The cash and cash equivalents was not pledged as security for any financial liabilities.
WRC
Ann
ual R
epor
t 200
8/09
78
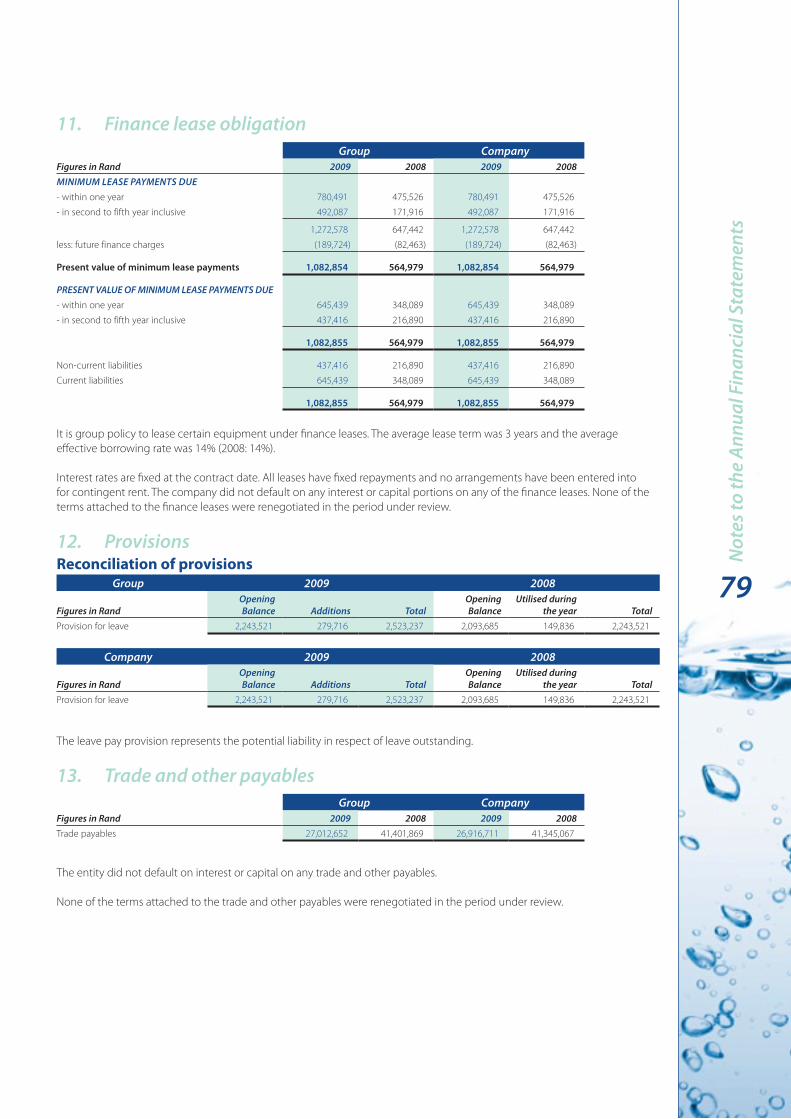
11. Finance lease obligationGroup Company
Figures in Rand 2009 2008 2009 2008MInIMuM LEASE PAYMEnTS duE- within one year 780,491 475,526 780,491 475,526
- in second to fifth year inclusive 492,087 171,916 492,087 171,916
1,272,578 647,442 1,272,578 647,442
less: future finance charges (189,724) (82,463) (189,724) (82,463)
Present value of minimum lease payments 1,082,854 564,979 1,082,854 564,979
PRESEnT vALuE OF MInIMuM LEASE PAYMEnTS duE- within one year 645,439 348,089 645,439 348,089
- in second to fifth year inclusive 437,416 216,890 437,416 216,890
1,082,855 564,979 1,082,855 564,979
Non-current liabilities 437,416 216,890 437,416 216,890
Current liabilities 645,439 348,089 645,439 348,089
1,082,855 564,979 1,082,855 564,979
It is group policy to lease certain equipment under finance leases. The average lease term was 3 years and the average effective borrowing rate was 14% (2008: 14%).
Interest rates are fixed at the contract date. All leases have fixed repayments and no arrangements have been entered into for contingent rent. The company did not default on any interest or capital portions on any of the finance leases. None of the terms attached to the finance leases were renegotiated in the period under review.
12. Provisions Reconciliation of provisions
Group 2009 2008
Figures in RandOpening Balance Additions Total
Opening Balance
utilised during the year Total
Provision for leave 2,243,521 279,716 2,523,237 2,093,685 149,836 2,243,521
Company 2009 2008
Figures in RandOpening Balance Additions Total
Opening Balance
utilised during the year Total
Provision for leave 2,243,521 279,716 2,523,237 2,093,685 149,836 2,243,521
The leave pay provision represents the potential liability in respect of leave outstanding.
13. Trade and other payables Group Company
Figures in Rand 2009 2008 2009 2008Trade payables 27,012,652 41,401,869 26,916,711 41,345,067
The entity did not default on interest or capital on any trade and other payables.
None of the terms attached to the trade and other payables were renegotiated in the period under review.
not
es to
the
Annu
al F
inan
cial
Sta
tem
ents
79
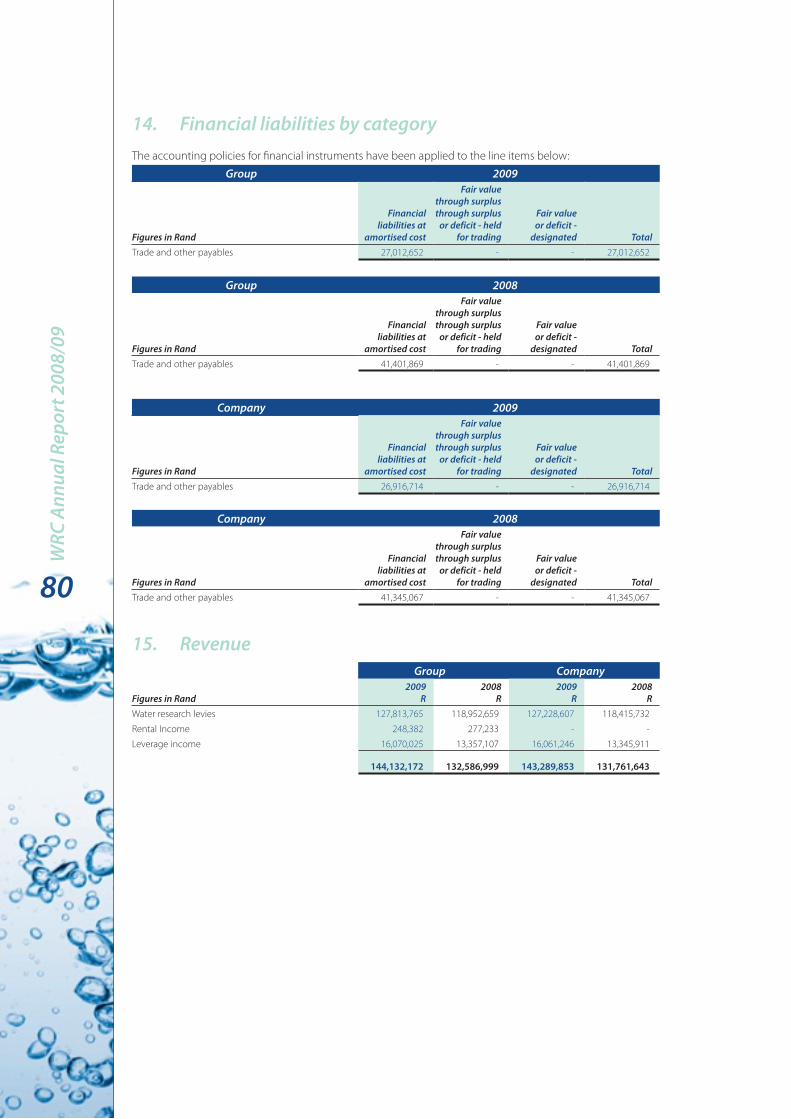
14. Financial liabilities by category The accounting policies for financial instruments have been applied to the line items below:
Group 2009
Figures in Rand
Financial liabilities at
amortised cost
Fair value through surplus through surplus
or deficit - held for trading
Fair value or deficit -
designated TotalTrade and other payables 27,012,652 - - 27,012,652
Group 2008
Figures in Rand
Financial liabilities at
amortised cost
Fair value through surplus through surplus
or deficit - held for trading
Fair value or deficit -
designated TotalTrade and other payables 41,401,869 - - 41,401,869
Company 2009
Figures in Rand
Financial liabilities at
amortised cost
Fair value through surplus through surplus
or deficit - held for trading
Fair value or deficit -
designated TotalTrade and other payables 26,916,714 - - 26,916,714
Company 2008
Figures in Rand
Financial liabilities at
amortised cost
Fair value through surplus through surplus
or deficit - held for trading
Fair value or deficit -
designated TotalTrade and other payables 41,345,067 - - 41,345,067
15. RevenueGroup Company
Figures in Rand2009
R2008
R2009
R2008
RWater research levies 127,813,765 118,952,659 127,228,607 118,415,732
Rental Income 248,382 277,233 - -
Leverage income 16,070,025 13,357,107 16,061,246 13,345,911
144,132,172 132,586,999 143,289,853 131,761,643
WRC
Ann
ual R
epor
t 200
8/09
80

16. Operating surplus (deficit) Operating surplus for the year is stated after accounting for the following:
Operating lease charges Group Company
Figures in Rand 2009 2008 2009 2008
PREMISES Contractual amounts - - 1,800,950 1,754,723
EquIPMEnTContractual amounts 244,395 133,591 244,395 133,591
244,395 133,591 2,045,345 1,888,314
Impairment of loans to group companies - - 355,899 -
Depreciation on property, plant and equipment 861,708 (268,084) 861,708 (268,084)
Employee costs 30,188,256 24,303,247 30,188,256 24,303,337
Research and development 107,954,100 85,274,339 107,954,100 85,274,339
17. Investment revenueGroup Company
Figures in Rand 2009 2008 2009 2008
InTEREST REvEnuEListed financial assets - available for sale 443,930 397,260 443,930 397,260
Loan to subsidiary (financial asset - loan and receivable) - - 974,637 899,504
Bank (financial asset - held for trading) 6,170,897 4,470,279 6,168,058 4,467,810
Interest charged on trade and other receivables (financial asset - loan and receivable) 326,624 3,798,536 326,624 3,798,536
Other interest 481,327 229,440 481,327 229,440
Computer loans (financial asset - loan and receivable) 196 915 196 915
7,422,974 8,896,430 8,394,772 9,793,465
18. Finance costsGroup Company
Figures in Rand 2009 2008 2009 2008Trade and other payables (financial liability - held at amortised cost) 1,328,836 1,880,810 1,328,836 1,880,810
Finance leases 163,443 133,847 163,443 133,847
1,492,279 2,014,657 1,492,279 2,014,657
19. Taxation No provision has been made for 2009 tax as the group is exempted from income tax in terms of Section 10(1)(cA)(i) of the Income Tax Act.
20. Auditors’ remuneration Group Company
Figures in Rand 2009 2008 2009 2008Fees 1,026,291 762,479 1,026,291 762,479
not
es to
the
Annu
al F
inan
cial
Sta
tem
ents
81

21. Cash (used in) generated from operationsGroup Company
Figures in Rand 2009 2008 2009 2008Surplus before taxation (3,370,780) 15,455,439 (3,919,523) 15,090,828
AdjuSTMEnTS FOR:Depreciation and amortisation 861,708 (268,084) 861,708 (268,084)
Interest received (7,422,974) (8,896,430) (8,394,772) (9,793,465)
Finance costs 1,492,279 2,014,657 1,492,279 2,014,657
Impairment loss - - 355,599 -
Movements in retirement benefit assets and liabilities 4,216,970 2,714,604 4,216,970 2,714,604
Movements in provisions 279,716 149,836 279,716 149,836
CHAnGES In WORKInG CAPITAL:Trade and other receivables (11,583,541) 13,490,424 (11,616,709) 13,478,474
Trade and other payables (14,389,217) 10,516,566 (14,428,356) 10,515,770
(29,915,839) 35,177,012 (31,153,088) 33,902,620
22. Commitments Research expenditure
Already contracted for but not provided for:
Group CompanyFigures in Rand 2009 2008 2009 2008Research 40,221,159 39,811,092 40,221,159 39,811,092
This committed expenditure relates to research cost and will be financed from internal sources.
23. Contingencies No contingencies exist at reporting date.
24. Related parties Relationships Subsidiaries Refer to note 4
Related party balances Company
Figures in Rand 2009 2008
LOAn ACCOunTS - OWInG BY RELATEd PARTIES Erf 706 Rietfontein (Proprietary) Limited 5,835,646 6,236,607
Related party transactionsWATER RESEARCH LEvIES RECEIvEd FROM RELATEd PARTIES Department of Water Affairs & Forestry 60,205,940 63,088,004
InTEREST RECEIvEd FROM RELATEd PARTIES Erf 706 Rietfontein (Proprietary) Limited (974,637) (899,505)
REnT PAId TO RELATEd PARTIES Erf 706 Rietfontein (Proprietary) Limited 1,800,950 1,754,732
AdMInISTRATIOn FEES RECEIvEd FROM RELATEd PARTIES Erf 706 Rietfontein (Proprietary) Limited (236,454) (223,258)
MunICIPAL EXPEnSES PAId TO RELATEd PARTIESErf 706 Rietfontein (Proprietary) Limited 275,762 255,626
WRC
Ann
ual R
epor
t 200
8/09
82

25. director’s emolumentsGroup Company
Figures in Rand 2009 2008 2009 2008
TOTAL dIRECTORS EMOLuMEnTSFees for services as directors 336,438 351,546 336,438 351,546
Basic salary 6,134,906 5,229,861 6,134,906 5,229,861
Bonuses and performance payments 387,138 304,761 387,138 304,761
Travel allowance 615,204 593,704 615,204 593,704
7,473,686 6,479,872 7,473,686 6,479,872
Executive2009
Figures in Rand Salary
Bonus and performance
paymentsTravel
allowances TotalDr R Kfir - Chief Executive Officer 1,007,337 101,715 80,004 1,189,056
Mr NB Patel - Chief Financial Officer 752,749 42,738 90,000 885,487
Dr GR Backeberg 658,086 34,909 64,800 757,795
Mr JN Bhagwan 758,706 43,040 90,000 891,746
Ms E Karar 764,706 43,040 84,000 891,746
Dr SA Mitchell 767,178 42,374 68,400 877,952
Ms R Frank 734,987 41,837 90,000 866,824
Dr HG Snyman 691,157 37,485 48,000 776,642
6,134,906 387,138 615,204 7,137,248
2008
Figures in Rand Salary
Bonus and performance
paymentsTravel
allowances TotalDr R Kfir - Chief Executive Officer 924,084 94,618 80,004 1,098,706
Mr NB Patel - Chief Financial Officer 624,973 - 90,000 714,973
Dr GR Backeberg 569,332 42,399 64,800 676,531
Mr JN Bhagwan 680,845 42,399 90,000 813,244
Ms E Karar 685,607 40,547 83,000 809,154
Dr SA Mitchell 668,307 42,399 68,400 779,106
Ms R Frank 615,489 - 67,500 682,989
Dr HG Snyman 112,041 - 8,000 120,041
Dr KA Eales 349,183 - 42,000 391,183
Dr KC Pietersen - 42,399 - 42,399
5,229,861 304,761 593,704 6,128,326n
otes
to th
e An
nual
Fin
anci
al S
tate
men
ts
83

Non‑executive2009
Figures in RandFees for services
as directors TotalDr SJ Khoza - Chairperson 57,385 57,385
Prof JA Adams - Chairperson 159,053 159,053
Prof F Otieno - Vice-chairperson 4,000 4,000
Mr D Naidoo 10,000 10,000
Dr TPE Auf Der Heyde 4,000 4,000
Mr EPW Cross 12,000 12,000
Dr DSS Lushaba 10,000 10,000
Ms ZB Mathenjwa 12,000 12,000
Ms MM Matsabu 6,000 6,000
Ms VGM Mkaza 4,000 4,000
Mrs DN Ndaba 14,000 14,000
Prof EM Stack 6,000 6,000
Mr M Sirenya 22,000 22,000
Mr JN Campbell 4,000 4,000
Prof JA Adams 2,000 2,000
Dr DJ Merrey 10,000 10,000
336,438 336,438
2008
Figures in RandFees for services
as directors TotalDr SJ Khoza - Chairperson 217,546 217,546
Prof F Otieno - Vice-chairperson 26,000 26,000
Mr D Naidoo 6,000 6,000
Ms MM Matsabu 28,000 28,000
Ms VGM Mkaza 18,000 18,000
Prof EM Stack 20,000 20,000
Mr M Sirenya 12,000 12,000
Mr JN Campbell 2,000 2,000
Prof JA Adams 14,000 14,000
Dr DJ Merrey 8,000 8,000
351,546 351,546
26. Change in estimate Property, plant and equipment ‑ cost The remaining useful life expectations of some asset items differed from previous estimates. This resulted in a revision of some of the previous estimates which was accounted for as a change in accounting estimate. The effect of this revision has decreased the depreciation charges for the current period by R70,906.
27. Prior period errors An item of Property, Plant and Equipment was incorrectly allocated to investment revenue. The correction of the error results in adjustments as follows:
Group CompanyFigures in Rand 2009 2008 2009 2008
STATEMEnT OF FInAnCIAL POSITIOn Property, plant and equipment - cost - 50,096 - 50,096
Accumulated depreciation - (5,011) - (5,011)
STATEMEnT OF FInAnCIAL PERFORMAnCEInterest on investment - (50,096) - (50,096)
Depreciation - 5,011 - 5,011
WRC
Ann
ual R
epor
t 200
8/09
84

28. Comparative figures Certain comparative figures have been reclassified in the detailed statement of financial performance. The effects of the reclassification are as follows:
Group CompanyFigures in Rand 2009 2008 2009 2008
STATEMEnT OF FInAnCIAL PERFORMAnCE Patent registrations - (574,588) - -
Utilities - 574,588 - -
29. Risk managementLiquidity risk The group’s risk to liquidity is a result of the funds available to cover future commitments. The group manages liquidity risk through an ongoing review of future commitments and credit facilities.
The table below analyses the group’s financial liabilities and net-settled derivative financial liabilities into relevant maturity groupings based on the remaining period at the reporting date to the contractual maturity date. The amounts disclosed in the table are the contractual undiscounted cash flows. Balances due within 12 months equal their carrying balances as the impact of discounting is not significant.
Group
Figures in Rand Less than 1 yearBetween
1 and 2 yearsBetween
2 and 5 years Over 5 yearsAt 31 March 2009Trade and other payables 27,012,652 - - -
Finance leases 780,491 293,061 199,027 -
At 31 March 2008Trade and other payables 41,401,869 - - -
Finance leases 475,526 167,356 4,560 -
Company
Figures in Rand Less than 1 yearBetween
1 and 2 yearsBetween
2 and 5 years Over 5 yearsAt 31 March 2009Trade and other payables 26,916,714 - - -
Finance leases 780,491 293,061 199,027 -
At 31 March 2008Trade and other payables 41,345,067 - - -
Finance leases 475,526 167,356 4,560 -
Interest rate risk Due to the nature and extent of the Commission’s investments, the Commission is not unduly exposed to interest rate risks as at least 80% of the investments are held in trusts.
Group At 31 March 2009, if interest rates on Rand-denominated borrowings had been 2.0% higher/lower with all other variables held constant, surplus for the year would have been R242,907 (2008: R262,565) lower/higher, mainly as a result of higher/lower interest expense on floating rate borrowings.
Company At 31 March 2009, if interest rates on Rand-denominated borrowings had been 2.0% higher/lower with all other variables held constant, surplus (deficit) for the year would have been R108,278 (2008: R131,166) lower/higher, mainly as a result of higher/lower interest expense on floating rate borrowings.
Deposits attract interest at rates that vary with prime. The entity’s policy is to manage interest rate risk so that fluctuations in variable rates do not have a material impact on a surplus (deficit).
At year end, financial instruments exposed to interest rate risk were as follows: Balances with banks and deposits with the Corporation for Public Deposits.
not
es to
the
Annu
al F
inan
cial
Sta
tem
ents
85

Credit risk Credit risk consists mainly of cash deposits, cash equivalents, staff loans and trade debtors. The Water Research Commission only deposits cash with major banks with high quality credit standing and limits exposure to any one counter-party. Financial assets exposed to credit risk at year end were as follows:
Group CompanyFigure in Rand 2009 2008 2009 2008
FInAnCIAL InSTRuMEnTDeposits with banks 1,800 1,800 1,800 1,800
Corporation for Public Deposits 13,654,197 36,572,987 13,654,197 36,572,987
Computer loans 955 4,842 955 4,842
Bank Balance 49,924,007 51,959,798 48,711,358 50,967,238
Foreign exchange risk The group does not hedge foreign exchange fluctuations. The Water Research Commission does not have any foreign account receivables, foreign accounts payables or derivative market instruments.
Price risk Due to the nature and extent of the Commission’s investments, the Commission is not unduly exposed to price risks as investments are held in trusts, cash and deposits.
30. Going concern The annual financial statements have been prepared on the basis of accounting policies applicable to a going concern. This basis presumes that funds will be available to finance future operations and that the realisation of assets and settlement of liabilities, contingent obligations and commitments will occur in the ordinary course of business.
31. Post balance sheet events There were no events after the balance sheet date that require adjustment to or disclosure in the financial statements.
WRC
Ann
ual R
epor
t 200
8/09
86

detailed Statement of Financial Performance Water Research Commission Consolidated Annual Financial Statements for the year ended 31 March 2009
Group CompanyFigure in Rand note(s) 2009 2008 2009 2008
REvEnuEWater research levies 127,813,765 118,952,659 127,228,607 118,415,732
Rental Income 248,382 277,233 - -
Leverage income 16,070,025 13,357,107 16,061,246 13,345,911
15 144,132,172 132,586,999 143,289,853 131,761,643
OTHER InCOMEAdministration and management fees received - - 236,454 223,259
Discount received 100,996 137,321 100,996 137,321
Provision for project creditors - (1,872,266) - (1,872,266)
Other income 1,037,683 742,563 1,037,683 742,563
Interest received 17 7,422,974 8,896,430 8,394,772 9,793,465
Profit on exchange differences - 114,138 - 114,138
8,561,653 8,018,186 9,769,905 9,138,480
Expenses (Refer below) (154,572,326) (123,135,089) (155,487,002) (123,794,638)Operating surplus 16 (1,878,501) 17,470,096 (2,427,244) 17,105,485Finance costs 18 (1,492,279) (2,014,657) (1,492,279) (2,014,657)
Surplus for the year (3,370,780) 15,455,439 (3,919,523) 15,090,828
OPERATInG EXPEnSESAdministration and management fees 346,218 311,913 342,668 310,483
Auditors remuneration 20 1,026,291 762,479 1,026,291 762,479
Allowance for impairment 153,043 - 153,043 -
Bank charges 74,003 67,267 69,081 63,304
Consumables 38,545 43,985 38,545 43,985
Depreciation, amortisation and impairments 861,708 (268,084) 1,217,307 (268,084)
Discretionary fund 18,454 32,143 18,454 32,143
Employee costs 30,188,256 24,303,247 30,188,256 24,303,337
Entertainment 209,690 146,624 209,690 146,624
IT expenses 1,043,692 667,764 1,043,692 667,764
Insurance 122,600 121,461 100,122 97,941
Lease rentals on operating lease 244,395 133,591 2,045,345 1,888,314
Motor vehicle expenses 7,748 10,661 7,748 10,661
Patent registrations 570,772 473,498 570,772 473,498
Postage 235,277 223,132 235,277 223,132
Printing and stationery 4,629,090 4,682,321 4,627,982 4,672,601
Promotions 194,319 327,314 194,319 324,592
Recruitment costs 298,953 120,736 298,953 120,736
Repairs and maintenance 443,533 399,399 181,301 168,637
Research and development costs 107,954,100 85,274,339 107,954,100 85,274,339
Security 286,286 244,203 - -
Staff welfare 17,778 14,232 17,778 14,232
Subscriptions 337,722 354,082 337,722 354,082
Telephone and fax 744,301 717,703 740,140 713,347
Training 250,889 224,410 250,889 224,410
Travel - local 2,538,869 2,369,167 2,538,869 2,369,167
Travel - overseas 802,896 547,288 802,896 547,288
Utilities 932,898 830,214 275,762 255,626
154,572,326 123,135,089 155,487,002 123,794,638
not
es to
the
Annu
al F
inan
cial
Sta
tem
ents
87

Erf Sewe-nul-Ses Rietfontein (Pty) Ltd
Annual Financial Statementsfor the year ended 31 March 2009

ContentsReport of the Auditor General 90Statement of Financial Position 94Statement of Financial Performance 94Statement of Changes in Net Assets 95Cash Flow Statement 95Accounting Policies 96Notes to the Annual Financial Statements 99Detailed Income statement 105
Report of the Auditor-GeneralReport of the Auditor-General to Parliament on the Group Financial Statements and performance information of Erf 706 Rietfontein (Pty) Ltd for the year ended 31 March 2009.
Report on the Financial StatementsIntroduction
I have audited the accompanying group financial 1. statements of Erf 706 Rietfontein (Pty) Ltd which comprise statements of financial position as at 31 March 2009, statements of financial performance, statements of changes in net assets and cash flow statements for the year then ended, and a summary of significant accounting policies and other explanatory notes, as set out on pages 96 to 105.
The accounting authority’s responsibility for the financial statements
The accounting authority is responsible for the 2. preparation and fair presentation of these financial statements in accordance with South African Statements of Generally Accepted Accounting Practice and in the manner required by the Public Finance Management Act, 1999 (Act No. 1 of 1999) (PFMA) and the Companies Act, 1973 (Act No. 61 of 1973) and for such internal control as the accounting authority determines it necessary to enable the preparation of financial statements that are free from material misstatement, whether due to fraud or error.
The Auditor‑General’s responsibilityAs required by section 188 of the Constitution of the 3. Republic of South Africa, 1996 read with section 4 of the Public Audit Act, 2004 (Act No. 25 of 2004) (PAA) and the Water Research Act, 1971 (Act No. 34 of 1971), my responsibility is to express an opinion on these financial statements based on my audit.
90
Erf S
ewe-
nul
-Ses
Rie
tfon
tein
(Pty
) Ltd

I conducted my audit in accordance with the 4. International Standards on Auditing and General Notice 616 of 2008, issued in Government Gazette No. 31057 of 15 May 2008. Those standards require that I comply with ethical requirements and plan and perform the audit to obtain reasonable assurance on whether the financial statements are free from material misstatement.An audit involves performing procedures to obtain 5. audit evidence about the amounts and disclosures in the financial statements. The procedures selected depend on the auditor’s judgement, including the assessment of the risks of material misstatement of the financial statements, whether due to fraud or error. In making those risk assessments, the auditor considers internal control relevant to the entity’s preparation and fair presentation of the financial statements in order to design audit procedures that are appropriate in the circumstances, but not for the purpose of expressing an opinion on the effectiveness of the entity’s internal control. An audit also includes evaluating the appropriateness of accounting policies used and the reasonableness of accounting estimates made by management, as well as evaluating the overall presentation of the financial statements.I believe that the audit evidence I have obtained 6. is sufficient and appropriate to provide a basis for my audit opinion
OpinionIn my opinion the financial statements present fairly, 7. in all material respects, the financial position of the Erf 706 Rietfontein (Pty) Ltd as at 31 March 2009 and its financial performance and cash flows for the year then ended, in accordance with Statements of South African Generally Accepted Accounting Practice and in the manner required by the PFMA, and the Companies Act of South Africa.
Other MattersWithout qualifying my audit opinion, I draw attention to 8. the following matters that relate to my responsibilities in the audit of the financial statements:
Governance frameworkThe governance principles that impact the auditor’s 9. opinion on the financial statements are related to the responsibilities and practices exercised by the accounting authority and executive management and are reflected in the key governance responsibilities addressed below.
Key governance responsibilitiesThe PFMA tasks the accounting authority with a 10. number of responsibilities concerning financial and risk management and internal control. Fundamental to achieving this is the implementation of key governance responsibilities, which I have assessed as follows:
91
Annu
al F
inan
cial
Sta
tem
ents
for t
he y
ear e
nded
31
Mar
ch 2
009
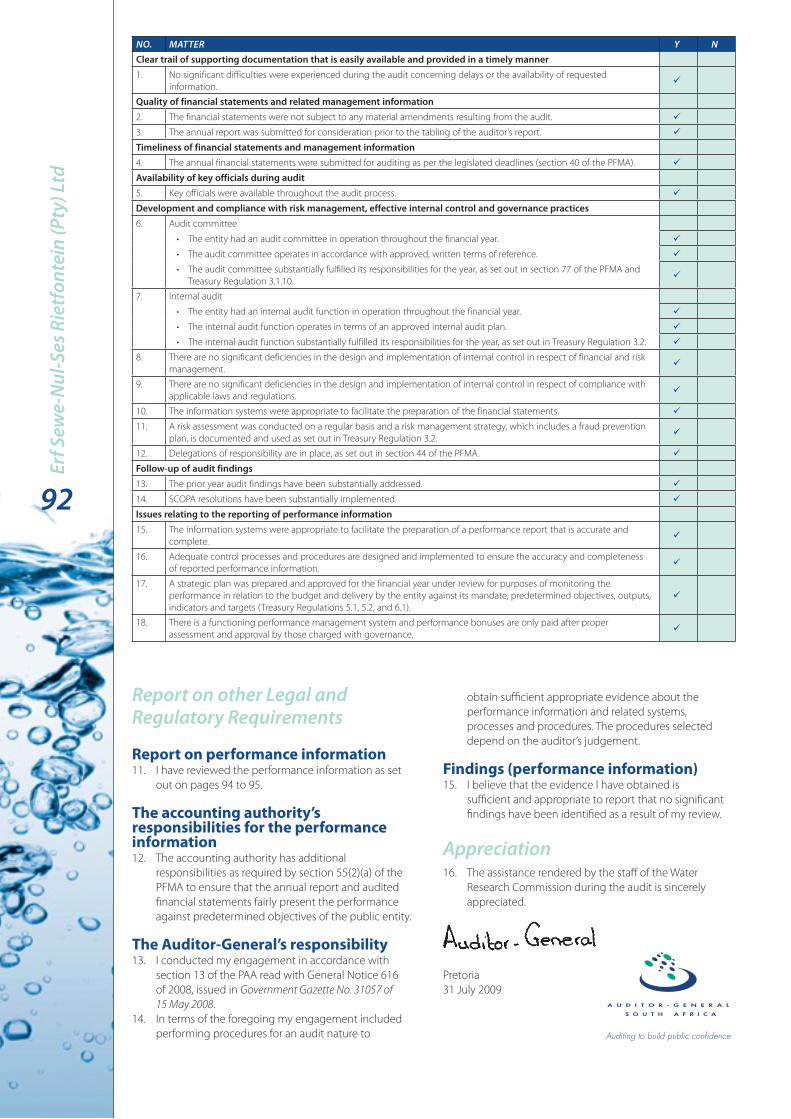
nO. MATTER Y nClear trail of supporting documentation that is easily available and provided in a timely manner1. No significant difficulties were experienced during the audit concerning delays or the availability of requested
information.
Quality of financial statements and related management information2. The financial statements were not subject to any material amendments resulting from the audit.
3. The annual report was submitted for consideration prior to the tabling of the auditor’s report.
Timeliness of financial statements and management information4. The annual financial statements were submitted for auditing as per the legislated deadlines (section 40 of the PFMA).
Availability of key officials during audit5. Key officials were available throughout the audit process.
Development and compliance with risk management, effective internal control and governance practices6. Audit committee
The entity had an audit committee in operation throughout the financial year.•
The audit committee operates in accordance with approved, written terms of reference.•
The audit committee substantially fulfilled its responsibilities for the year, as set out in section 77 of the PFMA and •Treasury Regulation 3.1.10.
7. Internal audit
The entity had an internal audit function in operation throughout the financial year.•
The internal audit function operates in terms of an approved internal audit plan.•
The internal audit function substantially fulfilled its responsibilities for the year, as set out in Treasury Regulation 3.2.•
8. There are no significant deficiencies in the design and implementation of internal control in respect of financial and risk management.
9. There are no significant deficiencies in the design and implementation of internal control in respect of compliance with applicable laws and regulations.
10. The information systems were appropriate to facilitate the preparation of the financial statements.
11. A risk assessment was conducted on a regular basis and a risk management strategy, which includes a fraud prevention plan, is documented and used as set out in Treasury Regulation 3.2.
12. Delegations of responsibility are in place, as set out in section 44 of the PFMA.
Follow-up of audit findings13. The prior year audit findings have been substantially addressed.
14. SCOPA resolutions have been substantially implemented.
Issues relating to the reporting of performance information15. The information systems were appropriate to facilitate the preparation of a performance report that is accurate and
complete.
16. Adequate control processes and procedures are designed and implemented to ensure the accuracy and completeness of reported performance information.
17. A strategic plan was prepared and approved for the financial year under review for purposes of monitoring the performance in relation to the budget and delivery by the entity against its mandate, predetermined objectives, outputs, indicators and targets (Treasury Regulations 5.1, 5.2, and 6.1).
18. There is a functioning performance management system and performance bonuses are only paid after proper assessment and approval by those charged with governance.
Report on other Legal and Regulatory Requirements
Report on performance informationI have reviewed the performance information as set 11. out on pages 94 to 95.
The accounting authority’s responsibilities for the performance information
The accounting authority has additional 12. responsibilities as required by section 55(2)(a) of the PFMA to ensure that the annual report and audited financial statements fairly present the performance against predetermined objectives of the public entity.
The Auditor‑General’s responsibilityI conducted my engagement in accordance with 13. section 13 of the PAA read with General Notice 616 of 2008, issued in Government Gazette No. 31057 of 15 May 2008.In terms of the foregoing my engagement included 14. performing procedures for an audit nature to
obtain sufficient appropriate evidence about the performance information and related systems, processes and procedures. The procedures selected depend on the auditor’s judgement.
Findings (performance information)I believe that the evidence I have obtained is 15. sufficient and appropriate to report that no significant findings have been identified as a result of my review.
AppreciationThe assistance rendered by the staff of the Water 16. Research Commission during the audit is sincerely appreciated.
Pretoria31 July 2009
92
Erf S
ewe-
nul
-Ses
Rie
tfon
tein
(Pty
) Ltd

Financial StatementsErf Sewe-nul-Ses Rietfontein (Pty) Ltd
Approval of Financial StatementsThe Directors’ Report and Financial Statements set out on pages 93 to 105 were approved by the Board of Directors and were signed on its behalf by:
Prof JA AdamsChairperson
Dr R. KfirWRC Chief Executive Officer
General InformationDirectors:Dr R KfirProf JA Adams
Registered office:301 Watko Building491, 18th AvenueRietfonteinPretoria
Registration number1984/003566/07
Main business and purposeThe main business of the company is to own the immovable property known as Erf Rietfontein and in addition and supplementary to the aim of the Water Research Commission (WRC), to place the property at the disposal of the WRC as their main place of business.
Director’s ReportGeneral review(a) To review the business and operations of the company
for the above accounting period in general, the directors draw attention to the balance sheet, income statement, equity and cash flow statement attached, where the business of the company, the results and state of affairs are clearly reflected.
(b) The Fourth Schedule to the Companies Act, 1973, requires the Directors to report on any material facts or circumstances which occurred between the accounting date and the date of their report. No such material or circumstances occurred.
Specific matters(a) The main aim of the company is that of owning
immovable property known as Erf 706 Rietfontein, including all permanent improvements, and to use the property for the purpose of promoting the operations of Water Research Commission.
(b) No shares were allotted or issued by the company for the year ending 31 March 2009.
(c) No dividends were paid or declared during the accounting period and we have no recommendation to make in respect of dividends (2007-RNil)
(d) The Directors and certain members of staff of Water Research Commission, for whom an administration fee is paid to the Water Research Commission, managed the business of the company. No third person was involved in managing the company.
(e) The names of Directors are shown below. No changes have taken place in the appointments during the accounting period. The company’s secretary is Mr D de Lange.
• DrRKfir• ProfJAAdams
The company is wholly owned by the Water Research Commission.
93
Annu
al F
inan
cial
Sta
tem
ents
for t
he y
ear e
nded
31
Mar
ch 2
009
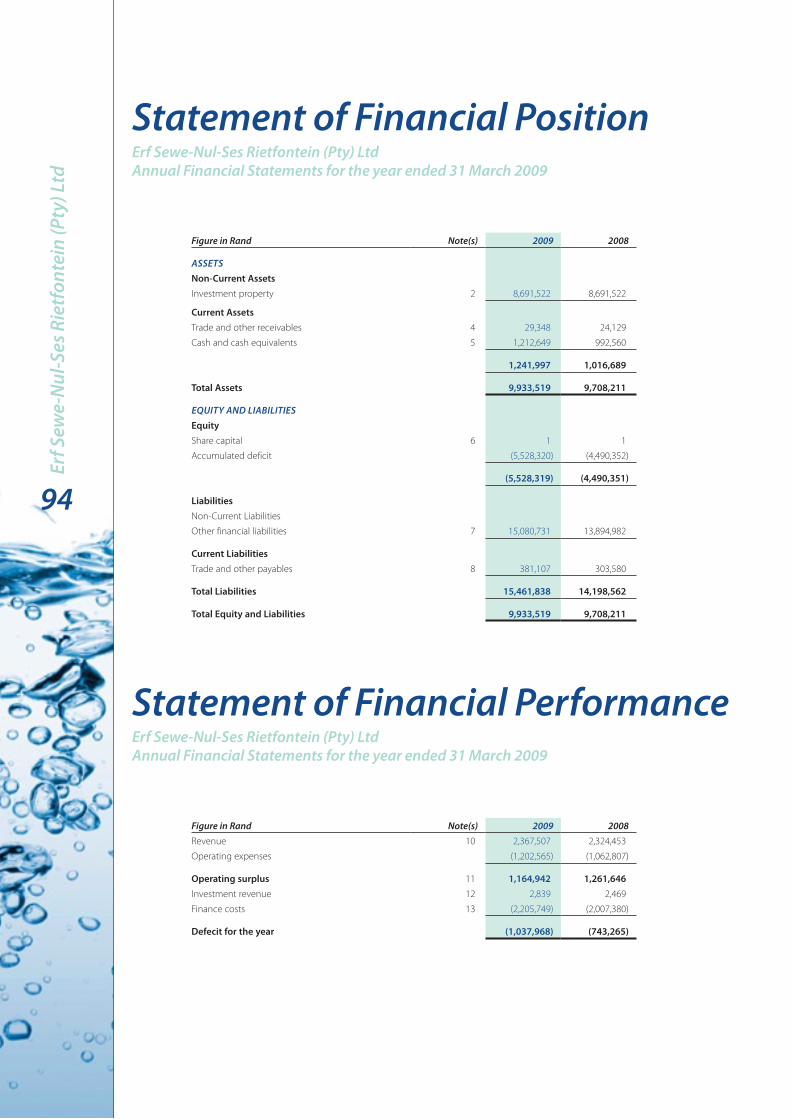
Statement of Financial PositionErf Sewe-nul-Ses Rietfontein (Pty) Ltd Annual Financial Statements for the year ended 31 March 2009
Figure in Rand note(s) 2009 2008
ASSETSNon-Current AssetsInvestment property 2 8,691,522 8,691,522
Current AssetsTrade and other receivables 4 29,348 24,129
Cash and cash equivalents 5 1,212,649 992,560
1,241,997 1,016,689
Total Assets 9,933,519 9,708,211
EquITY And LIABILITIESEquityShare capital 6 1 1
Accumulated deficit (5,528,320) (4,490,352)
(5,528,319) (4,490,351)
LiabilitiesNon-Current Liabilities
Other financial liabilities 7 15,080,731 13,894,982
Current LiabilitiesTrade and other payables 8 381,107 303,580
Total Liabilities 15,461,838 14,198,562
Total Equity and Liabilities 9,933,519 9,708,211
Statement of Financial PerformanceErf Sewe-nul-Ses Rietfontein (Pty) Ltd Annual Financial Statements for the year ended 31 March 2009
Figure in Rand note(s) 2009 2008Revenue 10 2,367,507 2,324,453
Operating expenses (1,202,565) (1,062,807)
Operating surplus 11 1,164,942 1,261,646Investment revenue 12 2,839 2,469
Finance costs 13 (2,205,749) (2,007,380)
Defecit for the year (1,037,968) (743,265)
94
Erf S
ewe-
nul
-Ses
Rie
tfon
tein
(Pty
) Ltd

Statement of Changes in net Assets
Cash Flow Statement
Erf Sewe-nul-Ses Rietfontein (Pty) Ltd Annual Financial Statements for the year ended 31 March 2009
Erf Sewe-nul-Ses Rietfontein (Pty) Ltd Annual Financial Statements for the year ended 31 March 2009
Figure in Rand Share capitalAccumulated
deficit Total equity
Balance at 01 April 2007 1 (3,747,087) (3,747,086)Changes in equity
Defecit for the year - (743,265) (743,265)
Total changes - (743,265) (743,265)
Balance at 01 April 2008 1 (4,490,352) (4,490,351)Changes in equity
Defecit for the year - (1,037,968) (1,037,968)
Total changes - (1,037,968) (1,037,968)
Balance at 31 March 2009 1 (5,528,320) (5,528,319)
Figure in Rand note(s) 2009 2008
CASH FLOWS FROM OPERATInG ACTIvITIESCash receipts from customers 2,364,793 2,319,011
Cash paid to suppliers and employees (1,127,543) (1,044,619)
Cash generated from operations 15 1,237,250 1,274,392
Interest income 2,839 2,469
Finance costs (2,205,749) (2,007,380)
Net cash from operating activities (965,660) (730,519)
CASH FLOWS FROM FInAnCInG ACTIvITIESProceeds from other financial liabilities 1,185,749 987,380
Net cash from financing activities 1,185,749 987,380
Total cash movement for the year 220,089 256,861Cash at the beginning of the year 992,560 735,699
Total cash at end of the year 5 1,212,649 992,560
95
Annu
al F
inan
cial
Sta
tem
ents
for t
he y
ear e
nded
31
Mar
ch 2
009

1. Presentation of Annual Financial StatementsThe annual financial statements have been prepared in accordance with South African Statements of Generally Accepted Accounting Practice.
Standards of GRAP Replacement Statement of GAAPGRAP 1: Presentation of Financial Statements AC 101: Presentation of Financial StatementsGRAP 2: Cash Flow Statements AC 118: Cash Flow StatementsGRAP 3: Accounting Policies, Changes in
Accounting Estimates and ErrorsAC 103: Accounting Policies, Changes in Accounting Estimates and Errors
Currently the recognition and measurement principals in the above GRAP and GAAP Statements do not differ or result in material differences in items presented and disclosed in the financial statements. The implementation of GRAP 1, 2 & 3 has resulted in the following significant changes in the presentation of the financial statements:
a. Terminology differences:
Standards of GRAP Replacement Statement of GAAPStatement of Financial Performance Income StatementStatement of Financial Position Balance SheetStatement of Changes in Net Assets Statement of Changes in EquityNet Assets EquitySurplus (deficit) for the Period Profit/Loss for the PeriodAccumulated Surplus (deficit) Retained EarningsContributions from Owners Share CapitalDistributions to Owners DividendsReporting Date Balance Sheet Date
b. The cash flow statement can only be prepared in accordance with the direct method.
c. Specific information has been presented separately on the Statement of Financial Position such as: i. Receivables from non-exchange transactions, including taxes and transfers; ii. Taxes and transfers payable; iii. Trade and other payables from non-exchange transactions.
d. Amount and nature of any restrictions on cash balances is required.
Paragraph 11 - 15 of GRAP 1 has not been implemented due to the fact that the budget reporting standard has not been developed by the local standard setter and the international standard is not effective for this financial year. Although the inclusion of budget information would enhance the usefulness of the financial statements, non-disclosure will not affect the objective of the financial statements.
The annual financial statements have been prepared on the historical cost basis, and incorporate the principal accounting policies set out below.
The financial statements are presented in Rand, which is the entities functional currency. All financial information presented in Rand has been rounded to the nearest Rand.
These accounting policies are consistent with the previous period.
1.1 Significant judgements In preparing the annual financial statements, management is required to make estimates and assumptions that affect the amounts represented in the annual financial statements and related disclosures. Use of available information and the application of judgement is inherent in the formation of estimates. Actual results in the future could differ from these estimates which may be material to the annual financial statements. Significant judgements include:
Accounting PoliciesErf Sewe-nul-Ses Rietfontein (Pty) Ltd Annual Financial Statements for the year ended 31 March 2009
Erf S
ewe-
nul
-Ses
Rie
tfon
tein
(Pty
) Ltd
96
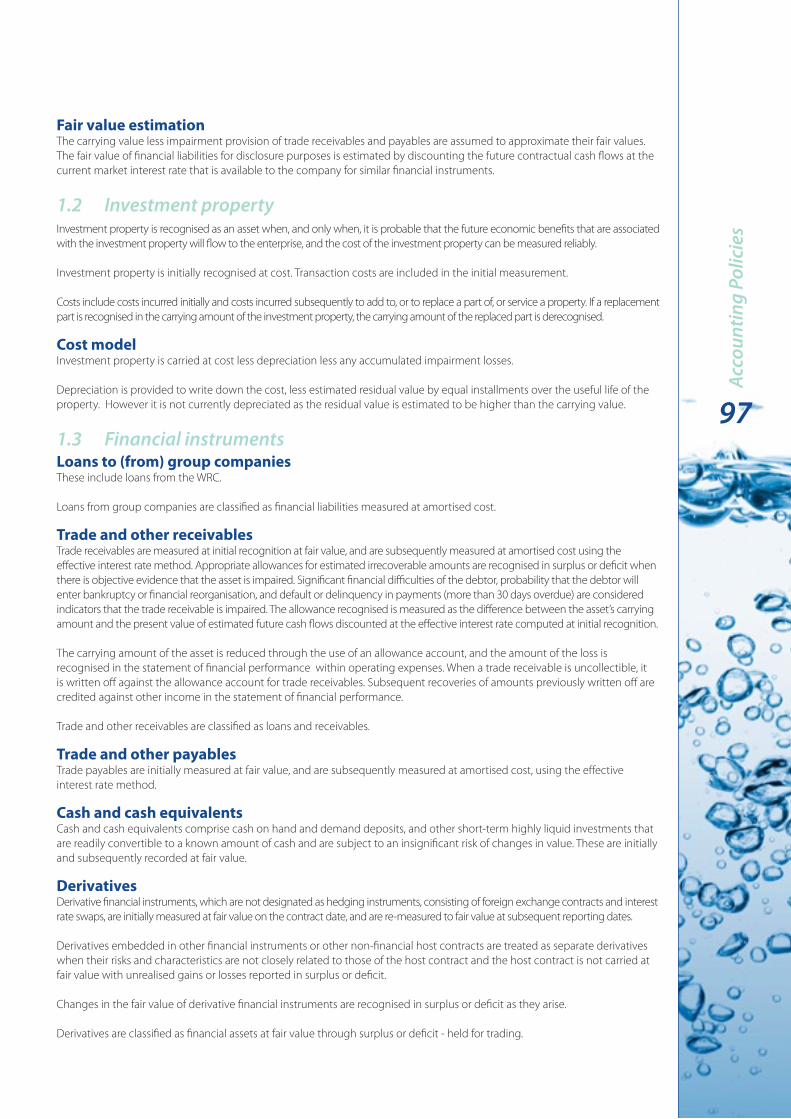
Fair value estimation The carrying value less impairment provision of trade receivables and payables are assumed to approximate their fair values. The fair value of financial liabilities for disclosure purposes is estimated by discounting the future contractual cash flows at the current market interest rate that is available to the company for similar financial instruments.
1.2 Investment property Investment property is recognised as an asset when, and only when, it is probable that the future economic benefits that are associated with the investment property will flow to the enterprise, and the cost of the investment property can be measured reliably.
Investment property is initially recognised at cost. Transaction costs are included in the initial measurement.
Costs include costs incurred initially and costs incurred subsequently to add to, or to replace a part of, or service a property. If a replacement part is recognised in the carrying amount of the investment property, the carrying amount of the replaced part is derecognised.
Cost model Investment property is carried at cost less depreciation less any accumulated impairment losses.
Depreciation is provided to write down the cost, less estimated residual value by equal installments over the useful life of the property. However it is not currently depreciated as the residual value is estimated to be higher than the carrying value.
1.3 Financial instruments Loans to (from) group companies These include loans from the WRC.
Loans from group companies are classified as financial liabilities measured at amortised cost.
Trade and other receivables Trade receivables are measured at initial recognition at fair value, and are subsequently measured at amortised cost using the effective interest rate method. Appropriate allowances for estimated irrecoverable amounts are recognised in surplus or deficit when there is objective evidence that the asset is impaired. Significant financial difficulties of the debtor, probability that the debtor will enter bankruptcy or financial reorganisation, and default or delinquency in payments (more than 30 days overdue) are considered indicators that the trade receivable is impaired. The allowance recognised is measured as the difference between the asset’s carrying amount and the present value of estimated future cash flows discounted at the effective interest rate computed at initial recognition.
The carrying amount of the asset is reduced through the use of an allowance account, and the amount of the loss is recognised in the statement of financial performance within operating expenses. When a trade receivable is uncollectible, it is written off against the allowance account for trade receivables. Subsequent recoveries of amounts previously written off are credited against other income in the statement of financial performance.
Trade and other receivables are classified as loans and receivables.
Trade and other payables Trade payables are initially measured at fair value, and are subsequently measured at amortised cost, using the effective interest rate method.
Cash and cash equivalents Cash and cash equivalents comprise cash on hand and demand deposits, and other short-term highly liquid investments that are readily convertible to a known amount of cash and are subject to an insignificant risk of changes in value. These are initially and subsequently recorded at fair value.
Derivatives Derivative financial instruments, which are not designated as hedging instruments, consisting of foreign exchange contracts and interest rate swaps, are initially measured at fair value on the contract date, and are re-measured to fair value at subsequent reporting dates.
Derivatives embedded in other financial instruments or other non-financial host contracts are treated as separate derivatives when their risks and characteristics are not closely related to those of the host contract and the host contract is not carried at fair value with unrealised gains or losses reported in surplus or deficit.
Changes in the fair value of derivative financial instruments are recognised in surplus or deficit as they arise.
Derivatives are classified as financial assets at fair value through surplus or deficit - held for trading.
97
Acco
untin
g Po
licie
s

1.4 Impairment of assets The company assesses at each reporting date whether there is any indication that an asset may be impaired. If any such indication exists, the company estimates the recoverable amount of the asset.
Irrespective of whether there is any indication of impairment, the company also: tests intangible assets with an indefinite useful life or intangible assets not yet available for use for impairment •annually by comparing its carrying amount with its recoverable amount. This impairment test is performed during the annual period and at the same time every period. tests goodwill acquired in a business combination for impairment annually. •
If there is any indication that an asset may be impaired, the recoverable amount is estimated for the individual asset. If it is not possible to estimate the recoverable amount of the individual asset, the recoverable amount of the cash-generating unit to which the asset belongs is determined.
The recoverable amount of an asset or a cash-generating unit is the higher of its fair value less costs to sell and its value in use.
If the recoverable amount of an asset is less than its carrying amount, the carrying amount of the asset is reduced to its recoverable amount. That reduction is an impairment loss.
An impairment loss of assets carried at cost less any accumulated depreciation or amortisation is recognised immediately in surplus or deficit. Any impairment loss of a revalued asset is treated as a revaluation decrease.
Goodwill acquired in a business combination is, from the acquisition date, allocated to each of the cash-generating units, or groups of cash-generating units, that are expected to benefit from the synergies of the combination.
An impairment loss is recognised for cash-generating units if the recoverable amount of the unit is less than the carrying amount of the units. The impairment loss is allocated to reduce the carrying amount of the assets of the unit in the following order:
first, to reduce the carrying amount of any goodwill allocated to the cash-generating unit and•then, to the other assets of the unit, pro rata on the basis of the carrying amount of each asset in the unit.•
An entity assesses at each reporting date whether there is any indication that an impairment loss recognised in prior periods for assets other than goodwill may no longer exist or may have decreased. If any such indication exists, the recoverable amounts of those assets are estimated.
The increased carrying amount of an asset other than goodwill attributable to a reversal of an impairment loss does not exceed the carrying amount that would have been determined had no impairment loss been recognised for the asset in prior periods.
A reversal of an impairment loss of assets carried at cost less accumulated depreciation or amortisation other than goodwill is recognised immediately in surplus or deficit. Any reversal of an impairment loss of a revalued asset is treated as a revaluation increase.
1.5 Share capital and equity An equity instrument is any contract that evidences a residual interest in the assets of an entity after deducting all of its liabilities.
1.6 RevenueRevenue is measured at the fair value of the consideration received or receivable and represents the amounts receivable for goods and services provided in the normal course of business, net of trade discounts and volume rebates, and value added tax.
Interest is recognised, in surplus or deficit, using the effective interest rate method.
1.7 Borrowing costsBorrowing costs are recognised as an expense in the period in which they are incurred.
1.8 Related PartiesThe entity follows the guidance of IAS 24 to identify related party relationships, transactions and balances and the disclosures on those identified.
1.9 Pre-PaymentsPre-payments are recognised at the fair value of the payments as soon as payments are made.
Erf S
ewe-
nul
-Ses
Rie
tfon
tein
(Pty
) Ltd
98

2. Investment property2009 2008
Figures in Rand Cost / valuationAccumulated depreciation Carrying value Cost / valuation
Accumulated depreciation Carrying value
Investment property 8,691,522 - 8,691,522 8,691,522 - 8,691,522
Figures in Rand 2009 2008Fair value of investment properties 28,000,000 26,800,000
Details of propertyFigures in Rand 2009 2008
ERF 706 RIETFOnTEIn, PRETORIA GAuTEnG- Purchase price 615,855 615,855
- Additions since purchase or valuation 8,075,667 8,075,667
8,691,522 8,691,522
Details of valuation The property has been valued at R28,000,000 by Reinertsen International Valuation Services, as an indepandant valuer, on 27 March 2009.
Amounts recognised in surplus and deficit for the year. Figures in Rand 2009 2008Rental income from investment property 2,049,708 2,031,957
Direct operating expenses from rental generating property 378,407 318,962
3. Financial assets by categoryThe accounting policies for financial instruments have been applied to the line items below:Refer to note 17.
2009
Figures in RandLoans and
receivables
Fair value through surplus
or deficit - held for trading
Fair value through surplus
or deficit - designated
Held to maturity investments Total
Trade and other receivables 29,348 - - - 29,348
Cash and cash equivalents - 1,212,649 - - 1,212,649
29,348 1,212,649 - - 1,241,997
2008
Figures in RandLoans and
receivables
Fair value through surplus
or deficit - held for trading
Fair value through surplus
or deficit - designated
Held to maturity investments Total
Trade and other receivables 24,129 - - - 24,129
Cash and cash equivalents - 992,560 - - 992,560
24,129 992,560 - - 1,016,689
notes to the Annual Financial StatementsErf Sewe-nul-Ses Rietfontein (Pty) Ltd Annual Financial Statements for the year ended 31 March 2009
99
not
es to
the
Annu
al F
inan
cial
Sta
tem
ents

4. Trade and other receivablesFigures in Rand 2009 2008Trade receivables 8,411 5,697
Deposits 9,754 9,754
VAT 11,183 8,678
29,348 24,129
Trade and other receivables pledged as security No trade and other receivables were pledged as security for any financial liability.
Credit quality of trade and other receivables Management considers that all the above financial assets are of good credit quality. The maximum exposure to credit risk at the reporting date is the fair value of each class of receivable mentioned above. None of the trade and other receivables defaulted in the year under review.
None of the financial assets that are fully performing have been renegotiated in the last year.
Trade and other receivables past due but not impaired No trade and other receivables for the entity are past due.
Trade and other receivables impaired As of 31 March 2009, no trade and other receivables were impaired.
5. Cash and cash equivalentsCash and cash equivalents consist of:
Figures in Rand 2009 2008Bank balances 1,212,649 992,560
Credit quality of cash at bank and short term deposits, excluding cash on hand Management considers that the above cash and cash equivalent category are of good quality.The maximum exposure to credit risk at the reporting date is the fair value of cash and cash equivalents mentioned above.
Cash and cash equivalents pledged as collateral The cash and cash equivalents was not pledged as security for any financial liabilities.
6. Share capital
Figures in Rand 2009 2008
AuTHORISEd4 000 Ordinary shares of R1 each 4,000 4,000
ISSuEd1 Ordinary share of R1 each 1 1
Erf S
ewe-
nul
-Ses
Rie
tfon
tein
(Pty
) Ltd
100

7. Other financial liabilitiesWater Research Commission – Held at amortised cost Figures in Rand 2009 2008
Loan No.1 12,473,567 11,410,731
The unsecured loan bears interest at 15% (2008 - 15%) and is repayable in equal monthly instalments of not less than R60,000 a month over 15 years.
Loan No.2 2,607,164 2,484,251
The unsecured loan bears interest at prime plus 2% with no fixed terms of repayment.
15,080,731 13,894,982
nOn-CuRREnT LIABILITIESAt amortised cost 15,080,731 13,894,982
8. Trade and other payablesFigures in Rand 2009 2008Trade payables 361,383 282,117
Deposits received 19,724 21,463
381,107 303,580
The entity did not default on interest or capital on any trade and other payables.
None of the terms attached to the trade and other payables were renegotiated in the period under review.
9. Financial liabilities by categoryThe accounting policies for financial instruments have been applied to the line items below:Refer to note 17.
2009
Figures in Rand
Financial liablities at
amortised cost
Fair value through surplus
or deficit - held for trading
Fair value through surplus
or deficit - designated Total
Loans from group companies 15,080,731 - - 15,080,731
Trade and other payables 381,107 - - 381,107
15,461,838 - - 15,461,838
2008
Figures in Rand
Financial liablities at
amortised cost
Fair value through surplus
or deficit - held for trading
Fair value through surplus
or deficit - designated Total
Loans from group companies 13,894,982 - - 13,894,982
Trade and other payables 303,580 - - 303,580
14,198,562 - - 14,198,562
10. RevenueFigures in Rand 2009 2008Municipal expense recoveries 309,396 281,301
Rent received 2,049,708 2,031,956
Sundry income 8,403 11,196
2,367,507 2,324,453
101
not
es to
the
Annu
al F
inan
cial
Sta
tem
ents

11. Operating surplus Operating surplus for the year is stated after accounting for the following: Figures in Rand 2009 2008Employee costs - (90)
12. Investment revenue Figures in Rand 2009 2008
InTEREST REvEnuE Bank 2,839 2,469
Total interest income, calculated using the effective interest rate, on financial instruments not at fair value through surplus or deficit amounted to R - (2008: R -).
Interest income on impaired financial assets amounted to R - (2008: R -).
13. Finance costs Figures in Rand 2009 2008Non-current borrowings 2,205,749 2,007,380
Total interest expense, calculated using the effective interest rate, on financial instruments not at fair value through profit or loss amounted to R - (2008: R -).
14. Taxation No provision has been made for 2009 tax as the company has no taxable income.
15. Cash generated from operations Figures in Rand 2009 2008Deficit before taxation (1,037,968) (743,265)
AdjuSTMEnTS FOR:Interest received (2,839) (2,469)
Finance costs 2,205,749 2,007,380
CHAnGES In WORKInG CAPITAL:Trade and other receivables (5,219) 5,442
Trade and other payables 77,527 7,304
1,237,250 1,274,392
Erf S
ewe-
nul
-Ses
Rie
tfon
tein
(Pty
) Ltd
102

16. Related parties Relationships Holding company Water Research Commission
Related party transactions Figures in Rand 2009 2008
InTEREST PAId TO RELATEd PARTIES Water Research Commission 2,205,749 2,007,380
MunICIPAL EXPEnSES RECEIvEd FROM RELATEd PARTIES Water Research Commission (275,762) (255,626)
REnT RECEIvEd FROM RELATEd PARTIES Water Research Commission (1,800,950) (1,754,732)
AdMInISTRATIOn FEES PAId TO RELATEd PARTIES Water Research Commission 236,454 223,259
LOAn ACCOunTS - OWInG TO RELATEd PARTIES Water Research Commission 15,080,731 13,894,982
17. Comparative figures Certain comparative figures in the notes for financial assets and financial liabilities have been restated due to incorrect amounts disclosed in the prior year. The amounts are not material and have no affect on the face of the financial statements.
The effects of the restatements are as follows:
Trade and other receivables changed from R 5,697 to R 24,129. Trade and other payables changed from R 282,117 to R 303,580.
18. Risk management Liquidity risk Prudent liquidity risk management implies maintaining sufficient cash. The entity receives cash by way of rental income. The entity maintains liquidity by limiting operating expenses to rental income received.
The company’s risk to liquidity is a result of the funds available to cover future commitments. The company manages liquidity risk through an ongoing review of future commitments and credit facilities.
The table below analyses the company’s financial liabilities and net-settled derivative financial liabilities into relevant maturity groupings based on the remaining period at the balance sheet to the contractual maturity date. The amounts disclosed in the table are the contractual undiscounted cash flows. Balances due within 12 months equal their carrying balances as the impact of discounting is not significant.
Figures in Rand Less than 1 yearBetween 1 and
2 yearsBetween 2 and
5 years Over 5 years
At 31 March 2009Trade and other payables 381,107 - - -
Loan no 1 - Water Research Commission 1,200,000 1,351,200 5,163,617 7,371,726
Loan no 2 - Water Research Commission 300,000 337,800 1,229,930 1,637,037
At 31 March 2008Trade and other payables 303,580 - - -
Loan no 1 - Water Research Commission 720,000 1,200,000 4,585,805 9,300,737
Loan no 2 - Water Research Commission 300,000 300,000 1,118,118 2,086,648
103
not
es to
the
Annu
al F
inan
cial
Sta
tem
ents

Interest rate risk As the company has no significant interest-bearing assets, the company’s income and operating cash flows are substantially independent of changes in market interest rates.
At 31 March 2009, if interest rates on Rand-denominated borrowings had been 2.0% higher/lower with all other variables held constant, surplus (deficit) for the year would have been R 269,069 (2008: R 273,487) lower/higher, mainly as a result of higher/lower interest expense on floating rate borrowings.
Credit risk Credit risk consists mainly of cash equivalents. The company only deposits cash with major banks with high quality credit standing and limits exposure to any one counter-party.
Financial assets exposed to credit risk at year end were as follows: Figures in Rand 2009 2008
FInAnCIAL InSTRuMEnTABSA Bank 1,212,649 992,560
19. Going concern The annual financial statements have been prepared on the basis of accounting policies applicable to a going concern. This basis presumes that funds will be available to finance future operations and that the realisation of assets and settlement of liabilities, contingent obligations and commitments will occur in the ordinary course of business.
20. Post balance sheet events There were no events after the balance sheet date that require adjustment to or disclosure in the financial statements.
Erf S
ewe-
nul
-Ses
Rie
tfon
tein
(Pty
) Ltd
104
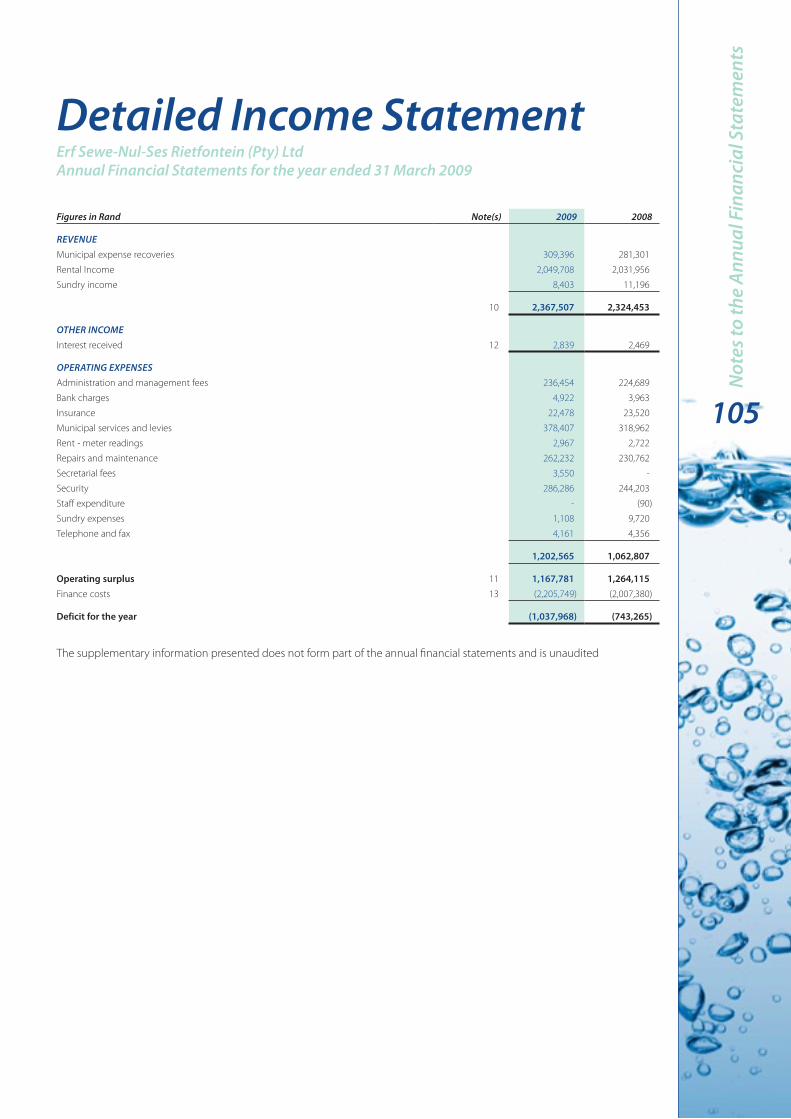
Figures in Rand note(s) 2009 2008
REvEnuEMunicipal expense recoveries 309,396 281,301
Rental Income 2,049,708 2,031,956
Sundry income 8,403 11,196
10 2,367,507 2,324,453
OTHER InCOMEInterest received 12 2,839 2,469
OPERATInG EXPEnSESAdministration and management fees 236,454 224,689
Bank charges 4,922 3,963
Insurance 22,478 23,520
Municipal services and levies 378,407 318,962
Rent - meter readings 2,967 2,722
Repairs and maintenance 262,232 230,762
Secretarial fees 3,550 -
Security 286,286 244,203
Staff expenditure - (90)
Sundry expenses 1,108 9,720
Telephone and fax 4,161 4,356
1,202,565 1,062,807
Operating surplus 11 1,167,781 1,264,115Finance costs 13 (2,205,749) (2,007,380)
Deficit for the year (1,037,968) (743,265)
The supplementary information presented does not form part of the annual financial statements and is unaudited
detailed Income StatementErf Sewe-nul-Ses Rietfontein (Pty) Ltd Annual Financial Statements for the year ended 31 March 2009
105
not
es to
the
Annu
al F
inan
cial
Sta
tem
ents
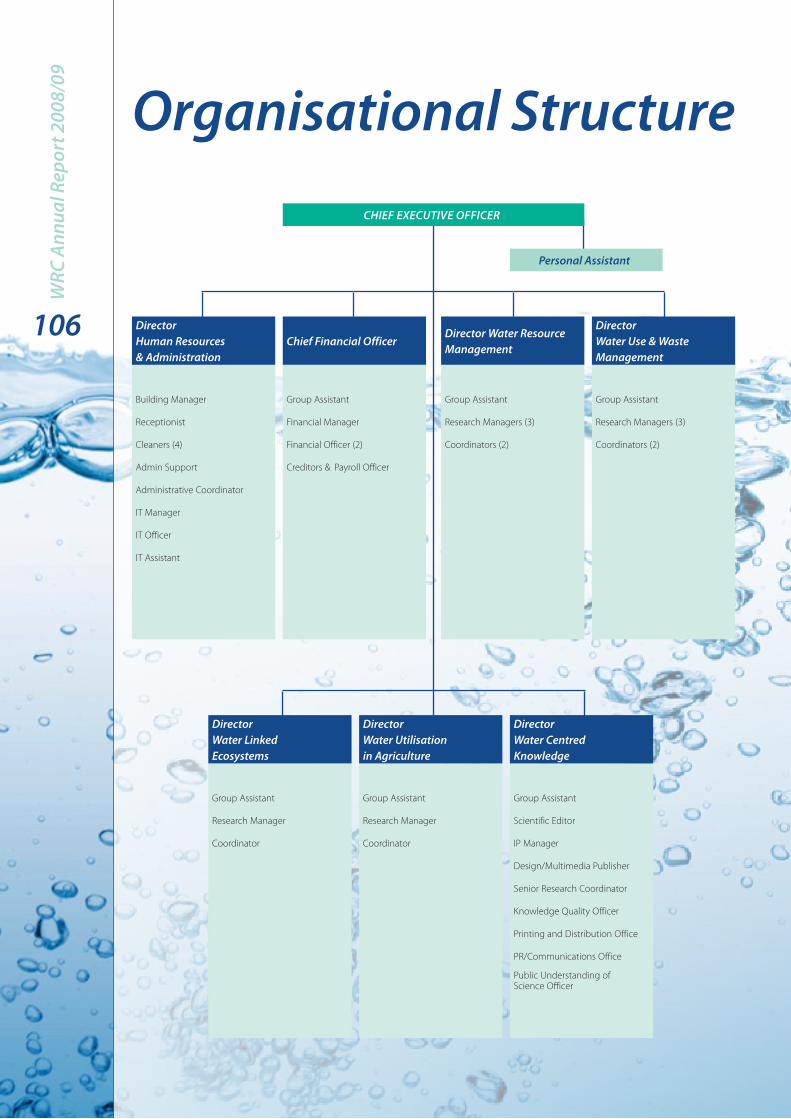
Organisational Structure
director Water Linked Ecosystems
director Water utilisation in Agriculture
director Water Centred Knowledge
Group Assistant Group Assistant Group Assistant
Research Manager Research Manager Scientific Editor
Coordinator Coordinator IP Manager
Design/Multimedia Publisher
Senior Research Coordinator
Knowledge Quality Officer
Printing and Distribution Office
PR/Communications Office
Public Understanding of Science Officer
CHIEF EXECuTIvE OFFICER
Personal Assistant
directorHuman Resources & Administration
Chief Financial Officerdirector Water Resource Management
director Water use & Waste Management
Building Manager Group Assistant Group Assistant Group Assistant
Receptionist Financial Manager Research Managers (3) Research Managers (3)
Cleaners (4) Financial Officer (2) Coordinators (2) Coordinators (2)
Admin Support Creditors & Payroll Officer
Administrative Coordinator
IT Manager
IT Officer
IT Assistant
WRC
Ann
ual R
epor
t 200
8/09
106


Annual Report 2009Published by the Water Research Commission (WRC) Private Bag X03, Gezina, Pretoria, 0031, Republic of South AfricaTel: +27 12 330 0340Fax: +27 12 331 2565E-mail: [email protected]: www.wrc.org.za
Copyright © 2009, Water Research Commission (WRC) All rights reserved
ISBN: 978-0-621-38676-9RP number: RP130/2009