r c sce pump testing program pump repair attitudes and
TRANSCRIPT

IRRIGATION
TRAINING &
RESEARCH
CENTER
SCE Pump Testing Program
Pump Repair Attitudes and Behavior
CALMAC Study ID SCE0373.01
January 2013 Final Report

Prepared by Dr. Stuart W. Styles
Kyle Feist
Sierra Orvis
Kerilyn Ambrosini
Technical Editor – Monica Holman
Irrigation Training & Research Center (ITRC)
California Polytechnic State University
San Luis Obispo, CA 93407-0730
805.756.2434
www.itrc.org
Disclaimer:
Reference to any specific process, product or service by manufacturer, trade name, trademark or otherwise
does not necessarily imply endorsement or recommendation of use by either California Polytechnic State
University, the Irrigation Training & Research Center, or any other party mentioned in this document. No
party makes any warranty, express or implied and assumes no legal liability or responsibility for the accuracy
or completeness of any apparatus, product, process or data described previously.
Irrigation Training & Research Center
January 2013
IRRIGATION
TRAINING &
RESEARCH
CENTER

SCE PTP Draft Final Report
Irrigation Training & Research Center P a g e | i
EXECUTIVE SUMMARY
The Cal Poly Irrigation Training & Research Center (ITRC) conducted an assessment of Overall
Plant Efficiency (OPE) values generated by the Pump Testing Services Program offered by
Southern California Edison (SCE). This report evaluates specific aspects of the Pump Testing
Program results and provides informative market research regarding program participant practices
and behaviors relating to OPE values. The market research presented in this report attempts to
determine the frequency and level of relationships between pump system management
characteristics and energy consumption.
It is well-known and was verified again in discussions with pump
customers and pump repair companies that the pump tests
completed by the SCE program offer vital efficiency and
performance information to managerial staff of entities that have
participated in the program. Furthermore, the pump test findings
often trigger actions by participating entities, resulting in decreases
in energy and water consumption. Therefore, pump tests that result
in increases in client efficiency via system upgrades produce a
return on SCE’s investment in the program. Pump tests were also
identified that do not result in direct increases in pump customer
efficiency, but still provide valuable opportunities for client
education, performance benchmarking and long-term trending.
Although many Pump Test Program participants indicated that they
use the results of their pump tests to help them decide when to
replace or repair pumps, it was clear that the majority of the
customers interviewed do not recognize a specified minimum OPE
as an “industry-standard” value that triggers a decision on major
replacement or repairs. Survey participants also cited the flow rate
evaluation performed by pump testers as another determinant for
action. Although this value does not directly link to the OPE value,
there is a definite awareness of the linkage between flow rate,
volume of water pumped, and the annual energy requirements.
Large public entities (e.g., public water agencies with hundreds of pumps) are very pleased with
the Pump Testing Program, and indicate that their staff often rely heavily on the OPE data from
the pump tests for decision making. As a result, some of these agencies have extremely high
threshold OPE values. For example, one SCE city has a target OPE of 72% while another
replaces any pumps that test with efficiencies below 65%.
Some private entities also indicated that high target
values are used to trigger a repair project. For example,
staff at a private entity aim for optimal values in the 70-
75% range, and do not let OPE values drop below 60%.
This claim is backed up by the SCE OPE database, which
lists their average OPE test results at 68%. In this case,
high OPE values are desired in order to reduce power
bills.
Survey results indicate that larger entities focus more on
pump efficiencies than smaller ones, and are more likely to factor in OPE values when deciding
The results of the investigation found the following key points:
An overwhelming number of program participants described the pump test results as a valuable tool.
They provide benchmarking of vital pump performance information, water depths in wells, and pump flow rates
There was no indication of an industry standard of threshold/trigger OPE levels from either pump dealers or program participants. Furthermore,
historical pump test records did not reflect that an industry standard for minimum OPE is being used or could be readily identified/established.

SCE PTP Draft Final Report
Irrigation Training & Research Center P a g e | ii
whether to remove a pumping unit for repair. Several users even reported using SCE pump
testing in combination with a private pump tester in order to obtain 6-month OPE data.
On the other hand, smaller entities are more inclined to use the pump test results as an
informational asset, rather than a key trigger for action. For example, before determining pump
replacement, a small dairy consults with its pump dealer to discuss the pump test’s overall
efficiency results as well as how much the pump is used, how long payback would take, and how
old a pump is. It has been found that smaller entities are more likely to wait until a pump has
failed to replace it, instead of looking at efficiencies. Several of the smaller customers even
reported that they really don’t look too hard at the OPE, and that they could easily wait two years
between tests.
Project Purpose
The purpose of this project was to investigate whether SCE customers have a minimum trigger
Overall Plant Efficiency (OPE) value used for decision-making purposes on pump replacement or
repairs. Specifically, this report was designed to evaluate whether there is a clear difference
between routine maintenance as opposed to complete retrofit/replacement/renovation activities.
The first mode of operation is to simply address pump repair as routine maintenance. This mode
of operation is repair work that might be done on pumping units as a manner of preventive
maintenance procedures. It was found that the larger organizations are migrating towards this
approach. Complete retrofit/replacement/renovation activities are typically done when the pump
performance is deficit and action must be taken. The majority of the customers surveyed operate
in the second mode. A typical response by customers is that they tend to be more reactive to
pump problems than proactive.
Through discussions between SCE and ITRC staff, priorities for this report were identified. The
project was created to evaluate the assumptions made in the Pump Testing Program specifically
related to how customers make a decision for action on their pumping units. The following is
from the Statement of Work:
Survey Design
SCE provided their pump test database for the last six years (from January 2006 through
December 2011). There are over 34,000 pump tests in the database with an average of over 5,600
pump tests performed per year. ITRC created a survey to evaluate SCE customer responses and
reaction to the OPE results. The survey was vetted by SCE staff and a focus group of eight
selected customers (identified in this report as Group 1). Initial observations were based on
For SCE’s pump test program, savings are currently calculated based on pump test results. After each test, a report is generated which provides various operational parameters (such as flow rate, head, annual water requirement etc.) and pumping plant’s OPE and potential energy savings strictly due to changing the impeller/bowl efficiency. When pump tests reveal inefficient operations, customers are encouraged to renovate/replace their pumping systems. An impact evaluation study conducted by Equipoise consulting in 2006 analyzed reported OPEs for various pumping technologies. While this earlier work is useful for establishing average OPEs by pump class it is does not determine how far below these OPEs customers will reach before taking action. The primary hypothesis is that many customers would, in the absence of SCE pump test data, make a predictable decision when to improve their pumping plant performance.

SCE PTP Draft Final Report
Irrigation Training & Research Center P a g e | iii
numerous phone interviews and the first questionnaires to be completed. Modifications to the
questionnaires were made based on feedback from SCE.
ITRC selected 50 of SCE’s private customers and 50 of SCE’s public customers to be
interviewed for the “Overall Plant Efficiency Survey”. Customers were selected to represent the
matrix of service accounts in Table 1. Based on a review of the database, ITRC determined that
about 11,000 unique service accounts have participated in the pump testing program over the
last six years.
Table 1. Distribution of private/public customer service accounts by Megawatt-Hour and pump type
The selected survey customers are also spatially distributed across SCE territory (see Figure 1).
The pins on the map represent the customer locations. Surveys were completed by a total of 38
program participants, 2 program non-participants (outside of SCE’s territory) and 17 pump
dealers. The SCE pump test customers are composed of two market actors: public entities
(approximately 550 customers) and private customers (approximately 2,500).
Table 2. List of SCE OPE customer types
Public Private
Cities Counties Community Service Districts Waste Water Sanitation Mutual Water Companies Irrigation Districts Schools, Cemeteries, Parks
Golf Courses Property and Housing Groups Fisheries Irrigation and Ag Management Energy Corporations Farm and Ranch Management Horticulture Food and Beverage Healthcare Service Groups
SCE Pump OPE Database - Private Distribution Sorted by Service Account - All Data
mWh Centrifugal Booster Submersible Booster Submersible Well Turbine Booster Turbine Well
<50 268 16 1335 173 2522
50-100 64 11 140 113 787
100-200 46 8 70 105 715
200-300 9 10 24 63 334
300-400 5 2 25 31 192
400-800 17 9 20 43 232
>800 74 3 25 44 98
Total 483 59 1639 572 4880
Private
SCE Pump OPE Database - Public Distribution Sorted by Service Account - All Data
mWh Centrifugal Booster Submersible Booster Submersible Well Turbine Booster Turbine Well
<50 147 36 209 256 279
50-100 40 15 61 121 86
100-200 55 15 66 136 149
200-300 29 4 26 89 126
300-400 16 10 20 45 119
400-800 47 10 37 138 308
>800 41 3 37 158 320
Total 375 93 456 943 1387
Public

SCE PTP Draft Final Report
Irrigation Training & Research Center P a g e | iv
Figure 1. Spatial distribution of SCE customers selected for survey. Note: The yellow pins represent
the private agencies and the pink represent the public agencies.
SCE Pump Testing Program Participant Key Findings
Numerous participants have identified other benefits of the Pump Test Program beyond the
OPE value. For example, one water agency near Oxnard requires customers to test flow
meters for accuracy; SCE customers get the benefit of the OPE plus a verification that their
meter is accurate. Other regions, such as the east side of the San Joaquin Valley, have large
fluctuations in the pumping water level. Several customers have reported that the pumping
water level information they received from the OPE testing on their wells is invaluable.
Among customers that reported that they do not use the OPE directly to determine a trigger
value for pump repair, most indicated that they use other information from the pump test to
help with the economic decision to repair, replace, or renovate pumps.
Although ITRC has identified patterns in OPE levels that result in action (with customer
behavior patterns emerging with an OPE below 50%), there exists no industry standard for
minimum OPE levels.
Very few of the SCE customers that were surveyed made note of the fact that different
efficiencies should be expected out of varying pumps. One water agency customer said in an
interview that they have different set points depending on the HP of the pumps, but most
entities have only one threshold that they do not let their values drop below regardless of the
pump type or size of the motor.
There is very little OPE trending being done by SCE customers on specific pumps. It is
recognized that all of the pump testers have easy access to the SCE OPE database. This
allows the pump testers to easily pull up old tests and show the trend in a meeting with their
client. However, it was apparent this feature was not being used often.
Customers who repaired/replaced pumps typically did so based on overall pump
performance, meaning that they were interested in the data provided by the OPE test. Figure
2 shows the number of respondents that cited their reasons for repairing/replacing a pump.

SCE PTP Draft Final Report
Irrigation Training & Research Center P a g e | v
Figure 2. Survey Question 6 responses: Major reasons for rebuilding/replacing pumps
Average OPE values were higher than the research team had expected to find. In addition,
the number of pumps that tested over 70% was larger than expected. Figure 3 shows a
summary of the OPE results that was reported for Group 1.
Figure 3. Evaluation of the OPE results for Group 1
De
clin
e in
pu
mp
p
erf
orm
ance
De
clin
e in
the
yie
ld f
rom
th
e
we
ll (G
PM
/fo
ot
of
dra
wd
ow
n)
De
clin
e in
flo
w r
ate
fro
m a
w
ell
Mo
de
rniz
atio
n p
rogr
am
wh
ich
re
qu
ire
s n
ew
pu
mp
s
Ince
nti
ve p
rogr
ams
by
SCE
The
pu
mp
sto
pp
ed
o
pe
rati
ng
be
cau
se o
f a
sud
de
n p
rob
lem
Oth
er
0
5
10
15
20
25
30
35#
Su
rve
yed
th
at S
ele
cte
d O
pti
on
6. What are the major reasons for rebuilding or replacing your pumps?
0
10
20
30
40
50
60
70
80
PU-26 PU-32 PU-7 PR-43 PU-48 PR-32 PU-39 PU-25 PU-31 PR-20-1
Average Overall Plant Efficiencies for SCE Survey Group 1Low 10% Average OPE Avg OPE for All Pump Tests High 10% Average OPE

SCE PTP Draft Final Report
Irrigation Training & Research Center P a g e | vi
An initial assumption made by ITRC was that the low values in this SCE OPE database were
a direct result of a poor performing pump that needed to be repaired. The assumption was
that these values would provide a clear indicator of the minimum OPE values that were
actually obtained by the pumps prior to repairs. Unfortunately, it was pointed out by one of
the pump testers during a presentation of the preliminary data that low OPE tests can be
generated by a system that operates at several Total Dynamic Head (TDH) values. In one
year, the TDH may be very high (400 ft) and the OPE reported value at 70%. The next year
the TDH may drop to a very low value (100 ft) and the OPE could drop to 30%. Or the OPE
values could be flipped, meaning that there are pumps being used to cover a wide range of
operating points. It should be noted that using the same pump for such a large TDH range is
not recommended.
Figure 4. Evaluation of the OPE results for Los Angeles Customer
Program Participant Statistical Results
Twenty-seven unique hypotheses were developed and tested to categorize program participants
by behavioral characteristics and pumping efficiency level. It was theorized that highly efficient
pumping systems require substantial support on many fundamental levels. More specifically,
intensive management practices such as subscribing to a trigger OPE could elicit higher average
OPE levels. One or more appropriate statistical tests were applied to each of the twenty-seven
hypotheses. Table 3 summarizes the results of the testing with the respective levels of statistical
support.
0
10
20
30
40
50
60
70
80
Ove
rall
Pla
nt
Effi
cie
ncy
Reference Number - Pump Type
LA County Waterworks Overall Plant Efficiency By Pump Graph 3
2729 - SB 10559 - TB 10561 - TB 10555 - TB 10556 - TB 17978 - TB
2007
2008
2009
2010
2006 20072007
2007
Mar
2007
Mar 2007
Nov 2007
Nov
2007
2008
2009
2009
2009
2009
2009
201020102010
SB - Submersible Booster SW - Submersible Well TW - Turbine Well TB - Turbine Booster CB - Centrifugal Booster

SCE PTP Draft Final Report
Irrigation Training & Research Center P a g e | vii
Table 3. Summary of hypothesis testing results
No Hypothesis Stro
ng
Mo
der
ate
Wea
k
No
ne
1 Entities that reported prescribing to a set maintenance program operate more efficient pumps (mean OPE = 61.8%) X
2 Entities that rely solely on SCE test information operate more efficient pumps X
3 Entities that monitor using a SCADA or EMS system operate more efficient pumps (mean OPE = 63.9%) X
4 Entities that remove/repair one or more pump(s) per year, as a maintenance program, operate more efficient pumps X
5 Entities that perform other pump testing for a maintenance program operate more efficient pumps X
6 Entities that replace pumps upon failure operate more efficient pumps X
7 Entities that have utilize other strategies for a maintenance program operate more efficient pumps X
8 Entities that apply more person-hours towards a maintenance program operate more efficient pumps (mean OPE = 57%) X
9 Entities that invest more money in a maintenance program operate more efficient pumps (mean OPE = 65%) X
10 Entities that have a higher percentage of remotely monitored pumps operate more efficient pumps (mean OPE = 62.2%) X
11 Entities that operate SCADA-type monitoring operate higher efficiency pumps (mean OPE = 61.9%) X
12 Entities that employ a higher percentage of automatically controlled pumps operate more efficient pumps X
13 Entities that employ a higher percentage of remotely controlled pumps operate more efficient pumps X
14 Entities that have more pumps operate more efficient pumps (mean OPE = 62.1%) X
15 Entities that provide municipal water operate more efficient pumps (mean OPE = 63.6%) X
16 Entities that participate in trade/industry organizations and conferences operate more efficient pumps (mean OPE = 63.1%) X
17 Entities that reference magazine/news articles to make decisions operate more efficient pumps X
18 Entities that reference emails and internet information, not used to make decisions, operate more efficient pumps X
19 Entities reporting that participation in trade organizations had no impact operate more efficient pumps X
20 Entities with no response to participation in trade organizations operate more efficient pumps X
21 Entities reporting that an old pump as a major cause for pump repair operate more efficient pumps (mean OPE = 62.5%) X
22 Entities reporting that an incorrect pump installation as a major cause for pump repair operate more efficient pumps X
23 Entities that reported sand wear is the major cause for pump repair operate more efficient pumps X
24 Entities that reported bearing failure as a major cause for pump repair operate more efficient pumps X
25 Entities that reported poor maintenance as a major cause for pump repair operate less efficient pumps X
26 Entities with other major causes for pump repair operate more efficient pumps X
27 Entities that operate higher numbers of pumps utilize a trigger OPE for pump repair/replacement X
The resulting significance of each relationship can be summarized in the following major findings:
1. Larger, well-supported entities had significantly higher average OPE levels
This conclusion was derived from a combination of entity size indicators. These indicators
are listed below along with a respective grouped mean OPE percentage.
a. The use of a SCADA or EMS monitoring system (mean OPE = 63.9%)
b. Spending more than $4,500 annually per pump on maintenance (mean
OPE = 61.8%)
c. Operating more than 11 pumps (mean OPE = 62.1%)
2. Implementing automatic and remote control systems does not relate to
higher OPEs
Entities that reported the capability to remotely or automatically control
their pumps did not have significantly higher OPE levels. Although
implementing complex pump controls may ease operational headaches, it
did not ensure energy efficiency.
There were numerous examples provided where SCE customers are using
some form of Supervisory Control and Data Acquisition System (SCADA). These included
both the agricultural and municipal water agencies. Typically, these systems are being used to
alarm a central location if there is a problem. There were only a few cases where SCADA or
some type of remote monitoring is being used to determine the OPE automatically.

SCE PTP Draft Final Report
Irrigation Training & Research Center P a g e | viii
Of the twenty-seven hypotheses tested, there was strong support for #9 (95%+ confidence),
moderate support for #3 (90%+ confidence), and weak support for #1 (85% confidence).
Although many hypotheses were not supported to any substantial degree, many of the
principle hypotheses were strongly supported. These primary hypotheses provide the support
to identify multiple characteristics of efficient pumping systems.
Pump Dealer Key Findings
A total of 17 pump dealers were interviewed, representing an average of 7,651 pump repairs
annually. These pump dealers serviced both program participants and non-participants. A
number of critical conclusions were drawn from their responses using standard analytical
methods, and are listed below.
Typical OPE Thresholds at Repair
Regardless of the cause of the action, pump dealers had a true sense of efficiency levels at the
time of contracted service. The program participant frequencies are displayed in Table 4.
Table 4. Frequencies of OPE levels at the time of pump service
OPE (%) Number of clients Percent
25 450 9%
40 3,545 70%
45 104 2%
50 420 8%
55 215 4%
60 208 4%
70 140 3%
Total 5,082 100%
Some SCE customers may take action based on the performance of the pump rather than at a
prescribed OPE value. However, in many cases cited by the participants, the SCE customers rely
on the performance data that comes from the SCE OPE test in order to make that assessment.
This pattern is reflected in Figure 5.
Figure 5. Comparison of OPE levels at the time of service
0
500
1000
1500
2000
2500
3000
3500
4000
25 40 45 50 55 60 70
Nu
mb
er
of
Re
pai
rs
OPE (%)

SCE PTP Draft Final Report
Irrigation Training & Research Center P a g e | ix
Pump Test Frequency
It is estimated that 5% of the 7,650 annual pump projects reported by pump dealers are completed
on pumps that have consistent testing intervals. This equates to approximately 10% of the
reported pump projects funded by Pump Testing Program participants. The remainder (65%) of
these services is completed on pumps that receive sporadic testing at inconsistent intervals.
Key Recommendations and Findings by ITRC
Large Potential for Energy Savings
There is a large potential for energy and water savings in California. ITRC has published several
reports documenting overall energy use and the potential for savings such as California
Agricultural Electrical Energy Requirements (Burt et. al., 2003), which included a synopsis of
average pumping plant efficiencies throughout central California’s irrigation districts and
growers. The average pumping plant efficiency for public water district pump tests was 64%
(over large 900 pumps included). This high OPE value is similar to the public entities in this
SCE study (average OPE ~57%).
However, the 2003 ITRC report noted a substantially lower value for on-farm pumps throughout
California’s San Joaquin Valley. An average pumping plant efficiency of 48% was calculated
from over 2,800 on-farm pump test data points. This discrepancy indicates a large potential for
energy conservation at the on-farm level.
Burt (2012) evaluated energy savings potential from a total of 15,000 pumps located throughout
California. With similar average OPE findings presented in Burt (2012), potential savings was
computed as 102,100 MWh/year. Burt (2012) targeted the recommendations with an analysis
which concluded that by targeting only 2.5% of the larger pumping units, about 12% of the
total potential savings could be achieved. Relating this back to SCE’s service area, this would
tend to focus on the large pumps used by public agencies. It is highly recommended that these
entities be supported to perform pump testing even if they have adopted a maintenance mode of
operation. Figure 6 is a graphic summary of the results of the Burt (2012) evaluation. Note that
this type of energy analysis could only be done with OPE tests.
Figure 6. Contour plot of Input kW vs. OPE (%) arranged by money savings (thousand $/year)
(Burt 2012)
OPPE (%)
Inp
ut
kW
70605040302010
300
250
200
150
100
50
>
–
–
–
–
–
–
–
–
–
<
10 15
15
2
2 3
3 4
4 5
5 6
6 7
7 8
8 9
9 10
per year
$ saved
Thousand
Well pumps
OPPE (%)
Inp
ut
kW
70605040302010
250
200
150
100
50
>
–
–
–
–
–
–
–
–
–
–
<
15 20
20 30
30
2
2 3
3 4
4 5
5 6
6 7
7 8
8 10
10 15
per year
$ saved
Thousand
Non-well pumps
Figure 8. Contour plot of Input kW vs. OPPE (%) arranged by money savings (Thousand $/year)

SCE PTP Draft Final Report
Irrigation Training & Research Center P a g e | x
Prioritized Approach to Pump Testing Services
In general, the majority of the SCE Pump Testing Program participants could be characterized
into two groups:
Type 1 Customer. There were a number of respondents that stated that they would consider
taking action on the repair/replacement/retrofit of a pumping unit at a relative OPE value
below 50%, or at catastrophic failure. Typically, the OPE level was cited as only one of
many determinants, including hours of operation, economic analysis and flow/pressure
performance. All of the Type 1 customers contacted felt that the SCE Pump Testing Program
was a valuable service.
Type 2 Customer. There were a smaller number of respondents that stated that they used a value
as high as 65% as a point where they take action on the repair replacement/ retrofit of a
pumping unit. Typically, the OPE was the key determinant in the decision making process.
Figure 7 illustrates the theoretical difference between a Type 1 and Type 2 SCE customer who
participates in the pump test program, in terms of water/energy use on a single pumping unit.
The time frame was expanded to 20 years to illustrate the temporal savings. It also illustrates that
the OPE values are changing constantly and that a single year evaluation of benefits can be
deceiving.
Figure 7. Theoretical energy use for two types of customers
The results of this example show that the Pump Testing Program is beneficial to both types of
customers. Obviously, the Type 2 Customer is influenced heavily by the SCE Pump Testing and
Rebate Incentives program. The result is a significant actual energy savings (27% energy over 20
years in this example). Although Type 1 Customers still benefit from pump test information, this
example illustrates that influencing Type 1 Customers to act more like Type 2 Customers
0
300,000
600,000
900,000
1,200,000
1,500,000
1,800,000
2,100,000
2,400,000
2,700,000
3,000,000
0%
10%
20%
30%
40%
50%
60%
70%
80%
90%
100%
Year
1
Year
2
Year
3
Year
4
Year
5
Year
6
Year
7
Year
8
Year
9
Year
10
Year
11
Year
12
Year
13
Year
14
Year
15
Year
16
Year
17
Year
18
Year
19
Year
20
Cu
mu
lati
ve E
ne
rgy
Use
(kW
h)
OP
E %
Time
Energy Use Comparison
Customer Type 1 - OPE Retrofit at Failure
Customer Type 2 - OPE Repair at Trigger
Energy Use - Type 1
Energy Use - Type 2
Note: 27% Reduction in Energy ConsumptionType 1 - 1.85 MkWh, Type 2 - 2.34 MkWh

SCE PTP Draft Final Report
Irrigation Training & Research Center P a g e | xi
would be beneficial to SCE. The potential for future energy savings from Type 1 Customers
is significant.
Recognizing that there are limited resources available and that every SCE customer cannot
receive a pump test every year, there are other opportunities to aid SCE customers in the
monitoring of the decline in pump performance. Coupled with adequate education, increased
instantaneous performance monitoring has the potential to decrease the demand for short interval
pump testing.
Option 1
Installation of state-of-the-art flow meters. Innumerable pump stations have poor hydraulic
conditions for flow rate measurement. New advances in magnetic flow meter technology have
provided a simple solution that has only recently become available. Research has demonstrated
that these new electronic devices can work adequately in the poor hydraulic conditions existing in
many pumping plants. In fact, some manufacturers have incorporated hydraulic conditioning into
the measurement device for this reason. The key disadvantage to these meters is cost. Further
analysis would be required to determine the feasibility and potential changes in behavior with the
addition of instantaneous flow rate information for operational management.
Figure 8. Photo showing the use of a magnetic flow meter in a poor hydraulic condition
Option 2
Installation of individual pump power meters. Most installations utilize only one device that
meters the power consumption of multiple pumps. This makes pump performance monitoring
problematic. New products have become available that provide inexpensive and non-intrusive
metering of all circuit characteristics including power factor, kW, amperage and voltage. While a
pump test report can separate the data to indicate the individual performance of pump units, the
direct reading approach would aid SCE customers in the decision making process by helping with
documenting the trend of the performance.
Concentric Reducer

SCE PTP Draft Final Report
Irrigation Training & Research Center P a g e | xii
Figure 9. Direct display kilowatt meter
More specifically, combining both options would allow a customer to provide in-house trending
of key performance characteristics and when supplemented with a longer interval testing
schedule, has the potential to decrease pressure on SCE by providing instantaneous information.
Increase the OPE Education for Pump Testers
Pump testers should be provided with additional information on pump improvements that are
beyond an OPE test. For example, the use of Variable Frequency Drives (VFDs) seems to be
underutilized in the SCE service area.
Increase the OPE Education for SCE Customers
There needs to be an expanded effort on the education of the SCE customers on the Pump Testing
Program. For example, there was a lack of awareness on how the OPE values vary based on the
size of a pump. ITRC would be available to generate a list of topics that could be developed for
future training.
Decrease the Use of Independent Surveys
More than one SCE customer complained about the number of questionnaires/surveys. ITRC
has been involved with numerous surveys over the last 2 decades. It was unexpectedly difficult
to get cooperation from the SCE customer base to get the surveys completed. The next phase of
OPE evaluation should be done with site interviews/discussions and coordinated with the pump
testers.
Minimum OPE
Although this study did not clearly identify a minimum OPE value, it was clear that the majority
of pump retrofits/repairs occur after a pump has dropped below an OPE level of 50%.

SCE PTP Draft Final Report
Irrigation Training & Research Center P a g e | xiii
TABLE OF CONTENTS
EXECUTIVE SUMMARY ................................................................................................................... I
Project Purpose ........................................................................................................................... ii Survey Design ............................................................................................................................ ii SCE Pump Testing Program Participant Key Findings .............................................................. iv Program Participant Statistical Results ...................................................................................... vi Pump Dealer Key Findings ..................................................................................................... viii Key Recommendations and Findings by ITRC .......................................................................... ix
INTRODUCTION................................................................................................................................ 1
SCE Program Background .......................................................................................................... 1
PUMP TESTING PROGRAM EVALUATION ...................................................................................... 3
Evaluation Overview ................................................................................................................... 3 Research Methods ....................................................................................................................... 4 Pump Dealer Research .............................................................................................................. 10
RESULTS......................................................................................................................................... 11
Customer Research Results ....................................................................................................... 11 Graphical Results from Survey ................................................................................................. 13 Graphical Results from Database .............................................................................................. 24 Control Group Results ............................................................................................................... 26 Pump Dealer Results ................................................................................................................. 26
RECOMMENDATIONS .................................................................................................................... 32
Pump Testing Program .............................................................................................................. 32 Pump Incentive Program ........................................................................................................... 33 Key Report Recommendations .................................................................................................. 35
REFERENCES ................................................................................................................................. 40

SCE PTP Draft Final Report
Irrigation Training & Research Center P a g e | xiv
LIST OF FIGURES Figure 1. Spatial distribution of SCE customers selected for survey. Note: The yellow pins represent
the private agencies and the pink represent the public agencies. ................................................... iv Figure 2. Survey Question 6 responses: Major reasons for rebuilding/replacing pumps .............................. v Figure 3. Evaluation of the OPE results for Group 1 ...................................................................................... v Figure 4. Evaluation of the OPE results for A Customer .............................................................................. vi Figure 5. Comparison of OPE levels at the time of service ........................................................................ viii Figure 6. Contour plot of Input kW vs. OPE (%) arranged by money savings (thousand $/year) (Burt
2012) ............................................................................................................................................. ix Figure 7. Theoretical energy use for two types of customers ......................................................................... x Figure 8. Photo showing the use of a magnetic flow meter in a poor hydraulic condition ............................ xi Figure 9. Direct display kilowatt meter ....................................................................................................... xii Figure 10. SCE service area throughout Southern California ......................................................................... 2 Figure 11. Private entity spatial distribution (l.) and public entity special distribution (r.) ............................ 8 Figure 12. Combined customer spatial distribution (l.) and relative density of sample location s(r.) ............ 8 Figure 13. Average-weighted OPE values for each entity ............................................................................ 10 Figure 14. Question 3 responses: Typical pump maintenance programs..................................................... 13 Figure 15. Question 6 responses: Major reasons for rebuilding/replacing pumps ....................................... 13 Figure 16. Question 6a responses: Pump problems ..................................................................................... 14 Figure 17. Question 10 responses: Added benefits ...................................................................................... 14 Figure 18. Question 11 responses: Average OPE ........................................................................................ 15 Figure 19. Question 20 responses: Reasons for testing ............................................................................... 15 Figure 20. Question 24 responses: Overall source pumping capacity ......................................................... 16 Figure 21. Question 26 responses: Water/wastewater employees ............................................................... 16 Figure 22. Question 27 responses: Energy cost importance ........................................................................ 17 Figure 23. Question 28 responses: Energy costs as percentage of budget ................................................... 17 Figure 24. Question 32 responses: Sources of information about SCE ....................................................... 18 Figure 25. Question 33 responses: Organization characterization ............................................................... 18 Figure 26. Question 34 responses: Current regulations ............................................................................... 19 Figure 27. Question 35 responses: External pressures ................................................................................ 19 Figure 28. Question 36 responses: Importance of energy use ..................................................................... 20 Figure 29. Question 37 responses: Influence of trade/industry associations ............................................... 20 Figure 30. Question 38 responses: Energy and resource management ........................................................ 21 Figure 31. Question 39 responses: Energy consumption sources ................................................................ 21 Figure 32. Question 42 responses: Future energy consumption predictions ............................................... 22 Figure 33. Question 45 responses: Organization type ................................................................................. 22 Figure 34. Question 46 responses: Primary pump applications ................................................................... 22 Figure 35. Question 47 responses: Primary pump type ............................................................................... 23 Figure 36. Question 48 responses: Actual average weighted OPE .............................................................. 23 Figure 37. Evaluation of the OPE results for A Customer ........................................................................... 24 Figure 38. Evaluation of the OPE results for Group 1 (l.) and Group 2a (r.) ............................................... 25 Figure 39. Evaluation of the OPE results for Group 2b (l.) and Group 2c (r.) ............................................. 25 Figure 40. Client action levels with estimated population sizes ................................................................... 27 Figure 41. Comparison of OPE levels at the time of service ........................................................................ 28 Figure 42. Use of 45% OPE as a point of need for pump repair (Equipoise 2006) ...................................... 29 Figure 43. Question 30 responses: EE/DR incentive participation (summary) ........................................... 33 Figure 44. Question 31 responses: EE/DR incentive participation .............................................................. 34 Figure 45. Contour plot of Input kW vs. OPE (%) arranged by money savings (thousand $/year) (Burt
2012) ............................................................................................................................................ 35 Figure 46. Theoretical energy use for two types of customers ..................................................................... 36 Figure 47. Photo showing the use of a magnetic flow meter in a poor hydraulic condition ......................... 37 Figure 48. Direct display kilowatt meter ...................................................................................................... 37 Figure 49. Use of packers to limit zones of poor water quality in a well. The packers are installed to
limit portions of the aquifer. Packers cause problems for pump testers by blocking the access
to the pumping water level. .......................................................................................................... 38

SCE PTP Draft Final Report
Irrigation Training & Research Center P a g e | xv
LIST OF TABLES Table 1. Distribution of private/public customer service accounts by Megawatt-Hour and pump type ....... iii Table 2. List of SCE OPE customer types .................................................................................................... iii Table 3. Summary of hypothesis testing results .......................................................................................... vii Table 4. Frequencies of OPE levels at the time of pump service ............................................................... viii Table 5. OPE Threshold Values based on pump type .................................................................................... 1 Table 6. Research hypotheses ......................................................................................................................... 5 Table 7. Statistical methods utilized for each hypothesis test ........................................................................ 6 Table 8. Preliminary sample selection spreadsheet ........................................................................................ 7 Table 9. Private entity survey sample frequency ............................................................................................ 9 Table 10. Summary of entity participation levels ........................................................................................... 9 Table 11. Sample response ............................................................................................................................. 9 Table 12. Average annual pump repairs represented by pump dealer sample .............................................. 10 Table 13. Inland Empire's matrix for trigger OPE values ............................................................................. 12 Table 14. Overall pump testing participation ............................................................................................... 26 Table 15. Various action level OPE triggers ................................................................................................ 28 Table 16. Non-Participant levels by sector ................................................................................................... 30 Table 17. Key recommendations to improve energy use by the pump repair companies ............................. 31

SCE PTP Draft Final Report
Irrigation Training & Research Center P a g e | 1
INTRODUCTION
Southern California Edison (SCE) provides utility services to the greater southern California area. A
large portion of SCE’s consumed energy is related to the transportation and pressurization of the state’s
water supply due to the intensive agriculture and municipal development present in a largely arid
landscape. This relationship presents an increased potential for over-extending the electrical system’s
capabilities and occasionally results in black-outs and brown-outs. SCE has created a wide variety of
programs and incentives to minimize these electrical shortages with the goal of reducing both peak
electrical demand and overall electrical energy consumption within its service area.
With the large potential for energy conservation stemming from the agricultural industry, SCE has offered
efficiency testing of water pumping systems for over 100 years. This program provides pumping
efficiency reports including vital information to enable educated decision-making regarding the
management and upgrades of electrically-driven pump systems.
In an attempt to minimize the financial burden of upgrading pump systems, SCE also offers incentive
programs. The pump incentive programs provide cost-sharing for energy conservation projects such as
pump replacements, automatic controls and off-peak pump operation.
SCE Program Background
SCE has offered pumping system evaluation as a free service since 1911. The technicians schedule and
perform OPE evaluations throughout the SCE service area. A total of between 4,000 and 5,000 tests are
performed each year. If a pump falls below an economic trigger value, a cost analysis is provided to
customers that provides recommended upgrades, potential savings, and paybacks.
The pump test result below is from an SCE City customer and is an example of a pump test report as well
as the use of the SCE incentive program to initiate a repair. The OPE test showed a pump test result of
38.7% for a vertical turbine pumping unit in a well application. It was recommended based on SCE
threshold values that the efficiency could be improved to 70% with a potential energy savings of 331
MWh/year. Table 5 lists current SCE OPE threshold values.
Table 5. OPE Threshold Values based on pump type
SCE OPE Standards
Vertical Turbine Pump - Well Vertical Turbine Pump - Booster
Motor HP Trigger Recommended
Minimum OPE
Values Motor HP Trigger Recommended
Minimum OPE
Values
3 to 5 < 50% 55 17 3 to 5 < 51% 55 17
7.5 - 10 < 53% 58 17 7.5 - 10 < 56% 60 17
15 - 30 < 56% 61 18 15 - 30 < 59% 63 18
40 - 60 < 60% 65 20 40 - 60 < 62% 67 20
75 - up < 64% 69 21 75 - up < 65% 70-72 21
Centrifugal Booster Submersible Pump
Motor HP Trigger Recommended
Minimum OPE
Values Motor HP Trigger Recommended
Minimum OPE
Values
3 to 5 < 51% 55 17 3 to 5 < 46% 51 15
7.5 - 10 < 54% 58 17 7.5 - 10 < 49% 54 16
15 - 30 < 57% 61 18 15 - 30 < 52% 57 17
40 - 60 < 61% 65 20 40 - 60 < 56% 61 18
75 - up < 65% 69 21 75 - up < 60% 65 20

SCE PTP Draft Final Report
Irrigation Training & Research Center P a g e | 2
Fundamentally, the SCE Pump Testing Program is a service that produces informational packages for
program participants. The package provides the participant with vital pumping system performance
characteristics as well as various system upgrade options. These management recommendations are
further combined with engineering economics in the form of potential payback periods for hardware and
operational changes.
By comparison, third party pump efficiency tests commonly cost a consumer $500 per test, and lack the
extensive analysis offered by SCE. Interviews with private pump testers were done as part of the study
to get a better understanding of why some organizations use private testers. One of the key comments
was that agencies that have heavily endorsed the use of OPE testing in their decision-making have now
gone to testing every 6 months in order to maximize the energy efficiency of their large pumps. Since the
formal guidelines on the SCE OPE testing are limited to every 2 years, this has created the opportunity for
private pump testers to fill the void.
Service Area
The program assessment focused on pump dealers and service companies that operate inside of SCE’s
service area. Figure 10 shows the extent of the SCE service area as well as the locales on which the
survey focused.
The service area includes a wide array of
climates and levels of urbanization. SCE
provides electrical power to a variety of
pressurized water systems with a range of
requirements, sizes and uses. The following
lists some of the major categories of
electrically-driven water pump users:
Potable water systems
Wastewater systems
Agricultural irrigation
Residential wells for irrigation and
potable water
It is critical to acknowledge the large
differences in expectations, operation, and
levels of investment inherent in each of these
system types. These characteristics will
undoubtedly affect the level of program
interest and participation throughout the
service area.
Figure 10. SCE service area throughout Southern California

SCE PTP Draft Final Report
Irrigation Training & Research Center P a g e | 3
PUMP TESTING PROGRAM EVALUATION
The Irrigation Training & Research Center (ITRC) located at the California Polytechnic State University,
San Luis Obispo, completed an evaluation of agricultural pumping energy conservation programs offered
by Southern California Edison (SCE). The major tasks of the evaluation are listed below:
1. Develop a method to gather data and commentary from program participants.
2. Complete a statistical analysis of program users (pump owners/operators) and program
implementers (pump dealer/service companies).
3. Analyze the collected data for trends, patterns and practices.
4. Investigate the potential for improved targeting of focus groups.
5. Identify enhancements for future program design.
Evaluation Overview
Pressurized water system personnel will occasionally repair/replace pumps due to a number of well-
known triggers. These triggers may include:
Pump test records that show either a steady or sudden decline in pump performance (lower flow,
pressure, or efficiency).
Pump test records that show a serious decline in the yield from the well (GPM/foot of drawdown).
The pump must be removed to physically renovate the well, and it is a logical time to refurbish or
replace the pump.
The significant decline over time of flow rate of a well to the point that irrigation operations are
hindered or there is an obvious inefficiency. This lower flow rate may be due to a number of causes
(lowered aquifer level, or pump problems), but in any case the pump will be removed and refurbished
or replaced.
The planning of a district modernization program which requires automation of the pumps and known
pump performance characteristics. The automation will be put onto the pump with the highest
efficiency. Therefore, a poor efficiency pump will be replaced with a newer, more efficient one that
will be used as the automated pump.
A pump that has stopped operating because of a sudden problem, such as:
o It seized up due to mineral deposits after being off during the winter.
o It seized up due to lineshaft bearings having improper lubrication or sand wear.
o The motor burned up, or the motor bearings were damaged.
o There is excessive vibration or overheating of the motor.
Although these cues are generally understood, the specific probabilities of each are unknown. Moreover,
this information has not been historically available especially across the diverse industrial and
geographical markets present in the SCE service area. The frequency of pump tests eliciting a renovation
or repair response is of critical importance for the quantification of the SCE Pump Testing Program’s
success. This evaluation focuses on the examination and analysis of pump replacement trigger
demographics as it applies to pump test data and other management characteristics.

SCE PTP Draft Final Report
Irrigation Training & Research Center P a g e | 4
Research Methods
A total of two questionnaires were developed by ITRC for use in this initiative: one for the customers and
one for pump dealers. The surveys included both quantitative and qualitative inquiries, including current
practices and open-ended market research. The surveys were aimed at culling responses to five questions:
1. What is used as a signal to replace or repair pumps?
2. Is there a “threshold” OPE that signals pump repair/replacement work?
3. What factors characterize entities with higher average OPEs?
4. Conversely, what factors characterize entities with low average OPEs?
5. With the goal of improving energy efficiency, how can the SCE Pump Testing Program be
improved?
Client Research
The SCE Pump Testing Program provides a valuable service at a highly discounted rate with the goal of
minimizing peak energy consumption inside the service area through energy conservation on a per-client
basis. Conservation programs without direct revenue typically require not only diligent justification for
their existence but also maximization of program efficiency. This report focuses on the latter. In terms of
the SCE Pump Testing Program, maximizing program efficiency equates to minimizing the dollars
invested per kW-hr conserved.
It can be assumed that individual pump tests result in different levels of energy conservation. It then
follows that a practical method of increasing efficiency would be to prioritize the type and frequency of
the pump tests using proven methods. The following outlines a logical market targeting approach:
1. Target entities that:
o Refuse to pay for third party testing if the SCE service is unavailable
o Require the recommendations and insight put forth by SCE representatives for conservation
goals, planning and implementation
o Present energy conservation potential
2. Minimize services to entities that:
o Are motivated, willing and able to pay a third party for routine, frequent pump testing
o Are unwilling to act upon system repair or upgrades regardless of the pump test results
o Do not present energy conservation potential
Prior to this report, little information was available regarding the details of relationships between these
two groups as well as a means to categorize pump test participants. The primary research presented in
this section investigated the potential correlations between the types of Pump Test Program participants
listed above and various entity characteristics. It was posited that behavioral and managerial
characteristics may have an influence on entity OPE levels.
The specifics of this general hypothesis could then be used to identify market targeting strategies as a
means to increase the program efficiency and energy conservation levels. Potential behavioral and
managerial factors which may have a correlation with an entity’s OPE level were listed by ITRC, such as:
Maintenance intensity
SCE program participation
Entity operational budget
Industry type
Entity size
As these theories are yet unproven, the evaluation presented in this report targeted these factors when
developing the 20 hypotheses outlined in Table 6.

SCE PTP Draft Final Report
Irrigation Training & Research Center P a g e | 5
Table 6. Research hypotheses
No. Hypothesis
1 The level of maintenance relates to an entity’s OPE
a Have a maintenance program
b Rely solely on SCE pump test information
c Monitoring using SCADA or EMS system
d Removing/repairing at least one pump a year
e Other pump testing
f When a pump fails
g Other maintenance program
2 The level of annual investment in a maintenance program relates to an entity’s OPE
a The amount of person-hours per year
b The amount of money invested annually
3 The level and type monitoring and control relates to an entity’s OPE
a The percent of remotely monitored pumps
b The type of monitoring
c The percent of automatically controlled pumps
d The percent of pumps remotely controlled
4 The entity's size and type relates to an entity’s OPE
a The number of pumps
b Industry type
5 Participation in trade organizations relates to an entity’s OPE
a Follow and participate in trade/industry organizations including conferences
b Reference issues in magazine/news articles, used to make decisions
c Reference emails and internet information, not used to make decisions
d No impact
e No response
6 Major causes for repair/replacement relates to an entity’s OPE
a Old pump
b Incorrect installation
c Sand wear
d Bearing failure
e Poor maintenance
f No response
7 The use of a threshold OPE relates to the size of the entity
The number of pumps
OPE Calculation
Many of the statistical computations provided in this section compare survey responses to an “OPE”
value. This overall plant efficiency (OPE) value is derived from computations with values from the
program database, made available through SCE. The SCE program database provided a five-year history
of individual pump tests for each of the selected entities, as well as other system information such as
pump type and annual account energy use. In preparation for the statistical analysis, it was necessary to
compute a representative OPE value for each entity.
A weighted-average computation was applied to the individual OPE data points across the entire database
time scale. This approach properly weights each pump’s contribution to overall entity efficiency based on
factors such as relative size, energy consumption rate and average efficiency. Additionally, multi-year
averaging accounts for OPE variance caused by temporal and systematic changes. The efficiency results
from individual pump tests may temporarily vary due to total dynamic head changes caused by shifts in
multiple pumping characteristics and could further vary permanently due to component upgrades.
Although the weighted-average approach more adequately represents an entity’s level of efficiency, it
does minimize the presence of extremely low and high pumping efficiencies.

SCE PTP Draft Final Report
Irrigation Training & Research Center P a g e | 6
Hypothesis Testing
The analysis used to test the 20 hypotheses involved one or more appropriate statistical methods
depending upon the response type, frequency and distribution. Table 7 lists the method(s) used for each
hypothesis test.
Table 7. Statistical methods utilized for each hypothesis test
No. T-test Chi-Squared ANOVA Tukey
1a X X
1b X X
1c X X
1d * *
1e * *
1f * *
1g X *
2a X X
2b X X
3a X X
3b * *
3c X X
3d X X
4a * X X
4b X X
5a X X
5b X X
5c * *
5d * *
5e X X
6a X X
6b X *
6c X X
6d X X
6e X X
7 X X
(*) denotes a test with insufficient responses for analysis; however, the responses are still reported
Sample Design
Through conversations between SCE and ITRC staff, it was determined the analysis would include data
from “a well-rounded” customer base. This approach provides key information on the market as a whole
and can provide insight for future program design. Conversely, ITRC typically employs a more targeted
strategy when focusing on conservation. This concept is described in detail in a later section.
ITRC developed a specific sample design approach to ensure that the analysis results were representative
of the markets serviced by SCE. The required sampling data was extracted solely from the SCE Pump
Testing Program database. The database made available to ITRC included 34,300 pump tests completed
between January 2006 and December 2011, covering 10,887 individual pumps. The data was organized
into a two-tiered sample selection spreadsheet to categorize the entries into the following subgroups:
private and public entities.
Distribution percentages and target sample sizes for both private and public entities were calculated
across all pump types and 12-month power consumption values. Table 8 shows the first-tier selection
spreadsheet for private entities. A similar spreadsheet was compiled for the public entries as well.

SCE PTP Draft Final Report
Irrigation Training & Research Center P a g e | 7
Table 8. Preliminary sample selection spreadsheet
Private Entities
MW-hr / year Centrifugal
Booster Submersible
Booster Submersible
Well Turbine Booster Turbine Well Total
< 50 268 16 1335 173 2522 4314
50-100 64 11 140 113 787 1115
100-200 46 8 70 105 715 944
200-300 9 10 24 63 334 440
300-400 5 2 25 31 192 255
400-800 17 9 20 43 232 321
> 800 74 3 25 44 98 244
Total 483 59 1639 572 4880 7633
Distribution 6% 1% 21% 7% 64% 100%
Target Sample Size
3 1 10 4 32 50
Using the calculated target values from Table 8, ITRC developed a selection weighting protocol to select
50 private and 50 public sample entities using the following sample pool characteristics:
1. Pump type
A well-rounded sample must include the range of pump types listed in Table 8, as each category has
specific management requirements and system indicators. For example:
Pump maintenance – Most turbine and booster pumps and their motors require diligent and
regular maintenance. Conversely, submersible pumps must be physically pulled in order to
perform any maintenance.
Initial investment – Deep set vertical turbines require substantial investment relative to other
pump types and also require an adequate three phase power supply and support structure.
Once the pump type requirement was satisfied, secondary and tertiary conditions were applied to the
screened sample pool before being selected.
2. Power consumption
The magnitude of annual power consumption is a general indicator of entity size. The size of a given
entity can directly influence pump management/operations by factors such as budget sizes,
operations/management hierarchy and the number of pumps. As such, the matrix specifically targeted
samples from multiple power consumption categories between 50 MW-hr/year to greater than 500
MW-hr/year.
3. Spatial distribution
The matrix’s final and tertiary condition was spatial distribution. It was prudent to verify the potential
samples were well-distributed throughout the service area in order to negate regional and market
specific practices. For example, metropolitan water districts in the greater Los Angeles area were
selected alongside large and small agricultural growers in the southern San Joaquin Valley, Antelope
Valley and Oxnard plain. Figure 11 and Figure 12 depict the variety of entity locations selected in
each sector and combined.

SCE PTP Draft Final Report
Irrigation Training & Research Center P a g e | 8
Figure 11. Private entity spatial distribution (l.) and public entity special distribution (r.)
Figure 12. Combined customer spatial distribution (l.) and relative density of sample location s(r.)
The second tier of the selection protocol involved selecting entries based upon a best-fit analysis of the
conditions listed until the computed target frequencies were met. Table 9 summarizes the sample
categorization by pump type and power consumption.

SCE PTP Draft Final Report
Irrigation Training & Research Center P a g e | 9
Table 9. Private entity survey sample frequency
Categorical Frequencies for Private Entities
MW-hr/yr
Centrifugal Booster (CB)
Submersible Booster (SB)
Submersible Well (SW)
Turbine Booster (TB)
Turbine Well (TW)
< 50 1 5 1 9
50-100 1 1 2 5
100-200 1 1 5
200-300 1 1 5
300-400 1 3
400-800 1 3
> 800 1 2
Total 3 1 10 4 32
Data Collection
ITRC contacted all one hundred (100) entities to solicit a request for participation in this research. The
majority of phone calls and emails produced a positive response and a willingness to participate. The
participating entities were then either sent a copy of the questions or polled over the phone, depending
upon entity preference. Table 10 presents the sample population through the research process.
Table 10. Summary of entity participation levels
Entity Type Sample Target Entities Contacted Entities Willing to Participate Samples Achieved
Private 50 50 40 20
Public 50 50 34 18
ITRC staff experienced great difficulty in persuading most participating entities to commit to a 10-minute
block of time to complete the survey, as shown in Table 11.
Table 11. Sample response
Response Description Counts
Completed 38
Busy 17
No Response 39
Refused 3
Disconnected number 3
Total 100
Once the responses were received, the data was entered into an extensive spreadsheet format to conduct
the testing and analysis. Using historical data from the SCE database, the average-weighted OPE value
was calculated for each entity. Figure 13 displays the resulting range of OPE values for each of the 38
sample entities.

SCE PTP Draft Final Report
Irrigation Training & Research Center P a g e | 10
Figure 13. Average-weighted OPE values for each entity
The samples represented an OPE value range of 21%, with a maximum of 69% and a minimum of 48%.
The mean OPE value for all entities was computed as 60%.
Pump Dealer Research
The pump dealer research conducted by ITRC focused on three concepts uniquely available from this
sector:
1) Verification of common customer responses
2) Regional market information
3) The frequency of SCE program non-participants.
The questionnaires were conducted solely through over-the-phone conversation-based interviews. A total
of 17 pump retail, repair and service companies completed surveys during this assessment. Cumulatively,
these companies provide services to approximately 7,650 pumps annually.
Pump Dealer Sample Design
Particular types of pump dealers were targeted in specific areas based upon the most energy-intensive
local pump market. This approach inherently emphasizes predominant regional practices over atypical
ones. For example, agricultural pump companies were selected in the lower San Joaquin Valley region to
represent the increased concentration of agricultural producers, whereas municipal pump suppliers were
targeted in the greater Los Angeles region.
The pump dealers interviewed represented all three major client sectors, including:
Municipal
Agricultural
Wastewater
Table 12 lists the number and types of clients represented.
Table 12. Average annual pump repairs represented by pump dealer sample
Municipal Agricultural Wastewater Total
1696 5854 100 7650
0
10
20
30
40
50
60
70
80
0 10 20 30 40Ave
rage
-Wei
ghte
d O
PE
(%)
Sample Number

SCE PTP Draft Final Report
Irrigation Training & Research Center P a g e | 11
RESULTS
Customer Research Results
This section draws conclusions from the statistical analysis of the research responses as well as the
hypothesis testing results provided earlier in Attachment 2.
1. Energy Conservation Prioritization
Although 72% of all respondents identified energy costs associated with water system operation as being
extremely important, the frequency of relatively low OPE values persists. How can energy costs be
extremely important, yet pumps remain in operation at known low efficiencies? A combination of various
factors could be responsible for this situation:
Changing system variables causing TDH fluctuations may be responsible for drops in OPE values.
The operation schedule of the pump may prohibit economic justification for upgrades, repairs, or
replacement.
Energy costs may be deemed extremely important, but other projects take even higher priority.
The entity may lack the budget to implement the required upgrades.
System improvements may not be practical due to low power quality and reliability.
These factors create an environment that provides energy conservation opportunities if coupled with
sufficient outreach, education and incentive support. Further analysis would be required to adequately
quantify the energy conservation potential, which at this time is unavailable.
2. Large Entity Characteristics
Forty-eight percent of respondents reported the incorporation of a threshold OPE value in their
management plan. Those entities that report its use had both a range of OPE thresholds as well as a range
of actions triggered by the low reported OPE. Some entities had the same OPE value applied to all types
and sizes of pumps, while others raised the threshold OPE relative to motor horsepower.
The results from the hypothesis testing indicated a relationship (p-value = 0.028) between the use of this
management strategy and larger populations of pumps (45 on average). Furthermore, these larger entities
were found to have significantly higher OPE values.
Entities operating 11-320 pumps had an average-weighted OPE of 62.1%, while entities operating 10 or
fewer pumps had a lower OPE of 54.9 %. This statistically significant relationship (p-value = 0.001)
confirms that larger entities operate and maintain higher overall pumping efficiencies.
3. Small Entity Characteristics
Smaller entities operating fewer than 10 pumps will on average maintain lower pumping efficiencies and
will be less likely to include a trigger OPE into the management strategy. In lieu of a trigger OPE the
management of pumps tends to be based on one of two options:
1) Pump repair/replacement is triggered by sudden failure.
2) Pump repair/replacement is triggered by an economic feasibility analysis based on current
operating hours, current OPE level, initial investment and potential payback periods.
Because smaller entities typically have limited funding, pre-emptive repairs or upgrades are often waived
until catastrophic failure occurs. Lower operational budgets also limit the time and resources available
for an individual pump’s economic analysis.

SCE PTP Draft Final Report
Irrigation Training & Research Center P a g e | 12
4. Variety of OPE Level Expectations
A small percentage of customers surveyed indicated that different efficiencies should be expected out of
pumps of various sizes. Only 11 entities (29%) interviewed actually filled out a matrix relating various
OPE targets to different levels of pump horsepower. Table 13 shows an example of this OPE matrix.
Ten entities (26%) reported having a single OPE level that is applied to all pumps regardless of
horsepower and operating hours. The remaining 27 entities did not report any level of expected OPE.
It has been observed that very few of the customers surveyed have knowledge that various pumps should
be expected to run at various efficiencies. Most entities have one threshold that they do not let their
values drop below.
Table 13. Customer matrix for trigger OPE values
5. Efficiency Prioritization
The analysis results indicated numerous correlations between various forms of efficiency investment and
higher OPE levels. As expected, the OPE levels were substantially higher for entities that focused on the
prioritization of pump efficiencies, including:
Remote monitoring
Developed maintenance program
Participation in industry organizations
These examples show the importance of increased levels of monitoring, continuing education and staying
abreast of appropriate technologies.
Sizes (HP) Turbine Well Centrifugal Booster Turbine Booster Submersible Booster Submersible Booster
3-5 35% 35% 35% 35% 35%
7.5-10 40% 40% 40% 40% 40%
15-30 45% 45% 45% 45% 45%
40-60 50% 50% 50% 50% 50%
75 - up 55% 55% 55% 55% 55%
Inland Empire Utilities Agency

SCE PTP Draft Final Report
Irrigation Training & Research Center P a g e | 13
Graphical Results from Survey
The following graphs represent the graphical data collected from the survey. The results of these graphs
and the tabular format of the data are discussed in Attachment 2.
Figure 14. Question 3 responses: Typical pump maintenance programs
Figure 15. Question 6 responses: Major reasons for rebuilding/replacing pumps
Do
no
t h
ave
a
mai
nte
nan
ce p
rogr
am
Re
ly s
ole
ly o
n S
CE
pu
mp
te
st in
form
atio
n
Mo
nit
or u
sin
g a
SCA
DA
or
EMS
syst
em
Re
mo
ve a
nd
rep
air a
t le
ast o
ne
(or m
ore
) p
um
p(s
) pe
r ye
ar
Oth
er p
um
p te
stin
g
Wh
en
pu
mp
fails
Oth
er
0
5
10
15
20
25
30
# S
urv
eye
d t
hat
Se
lect
ed
Op
tio
n
3. What is the typical pump maintenance program?D
ecl
ine
in p
um
p
pe
rfo
rman
ce
De
clin
e in
the
yie
ld f
rom
th
e
we
ll (G
PM
/fo
ot
of
dra
wd
ow
n)
De
clin
e in
flo
w r
ate
fro
m a
w
ell
Mo
de
rniz
atio
n p
rogr
am
wh
ich
re
qu
ire
s n
ew
pu
mp
s
Ince
nti
ve p
rogr
ams
by
SCE
The
pu
mp
sto
pp
ed
o
pe
rati
ng
be
cau
se o
f a
sud
de
n p
rob
lem
Oth
er
0
5
10
15
20
25
30
35
# S
urv
eye
d t
hat
Se
lect
ed
Op
tio
n
6. What are the major reasons for rebuilding or replacing your pumps?

SCE PTP Draft Final Report
Irrigation Training & Research Center P a g e | 14
Figure 16. Question 6a responses: Pump problems
Figure 17. Question 10 responses: Added benefits
It s
eiz
ed
up
du
e to
min
era
l d
ep
osi
ts a
fte
r b
ein
g o
ff d
uri
ng
the
win
ter
It s
eiz
ed
up
du
e to
lin
e s
haf
t b
ear
ings
hav
ing
imp
rop
er
lub
rica
tio
n o
r sa
nd
we
ar
The
mo
tor
bu
rne
d u
p,
or
the
m
oto
r b
ear
ings
we
re d
amag
ed
The
re is
exc
ess
ive
vib
rati
on
or
ove
rhe
atin
g o
f th
e m
oto
r
Ligh
ten
ing/
Ele
ctic
al S
torm
Oth
er
0
5
10
15
20
25
# S
urv
eye
d t
hat
Se
lect
ed
Op
tio
n
6a. The pump stopped operating because of a sudden problem due to:
Ob
tain
ing
the
co
mb
ine
d O
PE
pe
rfo
rman
ce o
f a p
um
p
stat
ion
wit
h m
ult
iple
pu
mp
ing
un
its
Co
nta
ct w
ith
SC
E fi
eld
e
mp
loye
es
Co
mm
un
icat
ion
on
ne
w
en
erg
y p
rogr
ams
at S
CE
Op
era
tio
n r
eco
mm
en
dat
ion
s
De
term
inin
g th
e p
rio
rity
of
pu
mp
ing
Pu
mp
usa
ge -
wh
en
to
pu
mp
fo
r lo
we
r co
sts
Ide
nti
fyin
g o
the
r e
qu
ipm
en
t th
at im
pac
t e
ne
rgy
use
-su
ch
as v
alvi
ng
Ide
nti
fyin
g V
FD a
pp
licat
ion
s
Oth
er
0
5
10
15
20
25
# S
urv
eye
d t
hat
Se
lect
ed
Op
tio
n
10. Are there any added benefits other than knowing the pump test OPE result?

SCE PTP Draft Final Report
Irrigation Training & Research Center P a g e | 15
Figure 18. Question 11 responses: Average OPE
Figure 19. Question 20 responses: Reasons for testing
0-30%0%
31-45%5%
46-55%26%
56-70%53%
71% +8%
No Response8%
11. What is the average overall plant efficiency OPE (%)?
Pu
mp
te
st c
on
du
cte
d e
very
ye
ar
Pu
mp
te
sts
con
du
cte
d e
very
2
year
s
Pu
mp
te
sts
con
du
cte
d e
very
4
year
s
Wh
en
pu
mp
pe
rfo
rman
ce
dro
ps
Wh
en
co
nta
cte
d b
y re
pre
sen
tati
ve
Aft
er
rep
air
or
rep
lace
me
nt
Oth
er
0
2
4
6
8
10
12
14
16
18
# S
urv
eye
d t
hat
Se
lect
ed
Op
tio
n
20. What prompts you to call SCE to have a pump test conducted?

SCE PTP Draft Final Report
Irrigation Training & Research Center P a g e | 16
Figure 20. Question 24 responses: Overall source pumping capacity
Figure 21. Question 26 responses: Water/wastewater employees
Agricultural61%
Municipal34%
Wastewater5%
24. What is the overall source pumping capacity in each category?
1-318%
4-1024%
11-3010%
31-5024%
51-100
5%
101-2503%
251+3%
No Repsonse13%
26. How many employees are involved in the water/wastewater aspect of the
business?

SCE PTP Draft Final Report
Irrigation Training & Research Center P a g e | 17
Figure 22. Question 27 responses: Energy cost importance
Figure 23. Question 28 responses: Energy costs as percentage of budget
Extremely important
79%
Somewhat important
10% Not very important
0%
Not important0%
No Response11%
27. How important are the energy costs associated with water/wastewater
0-5%13%
6-10%24%
11-30%26%
31%+16%
No Response21%
28. What percentage of the budget is for the energy costs for water/wastewater?
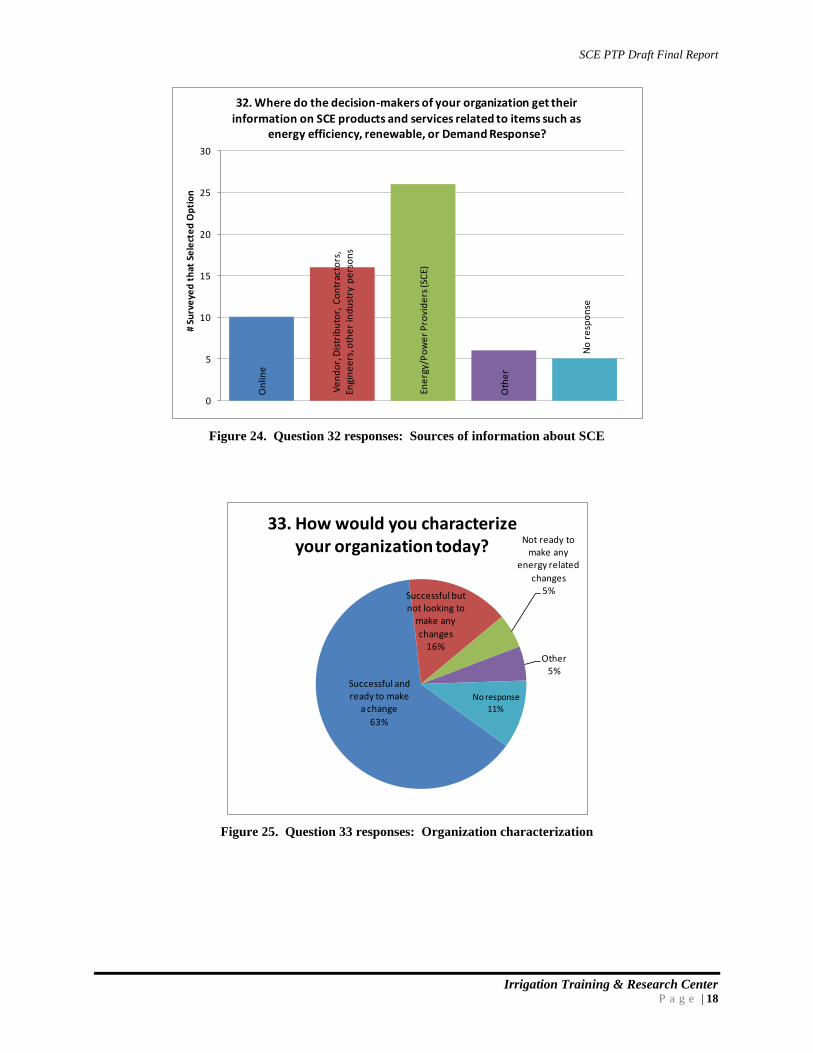
SCE PTP Draft Final Report
Irrigation Training & Research Center P a g e | 18
Figure 24. Question 32 responses: Sources of information about SCE
Figure 25. Question 33 responses: Organization characterization
On
line
Ve
nd
or,
Dis
trib
uto
r, C
on
trac
tors
, En
gin
ee
rs, o
the
r in
du
stry
pe
rso
ns
Ene
rgy/
Po
we
r P
rovi
de
rs (S
CE)
Oth
er
No
re
spo
nse
0
5
10
15
20
25
30
# S
urv
eye
d t
hat
Se
lect
ed
Op
tio
n
32. Where do the decision-makers of your organization get their information on SCE products and services related to items such as
energy efficiency, renewable, or Demand Response?
Successful and ready to make
a change
63%
Successful but not looking to
make any
changes16%
Not ready to make any
energy related
changes5%
Other5%
No response11%
33. How would you characterize your organization today?

SCE PTP Draft Final Report
Irrigation Training & Research Center P a g e | 19
Figure 26. Question 34 responses: Current regulations
Figure 27. Question 35 responses: External pressures
Loca
l
Stat
e
Fed
eral
Oth
er
0
5
10
15
20
25
30
# S
urv
eye
d t
hat
Se
lect
ed
Op
tio
n
34. What regulations are currently (or in the near future) placed on your organization that affects every day business?
Eco
no
my
Reg
ula
tio
ns Ind
ust
ry s
tan
dar
ds
Oth
er Un
kno
wn
/No
ne/
No
re
spo
nse
0
5
10
15
20
25
30
# S
urv
eye
d t
hat
Se
lect
ed
Op
tio
n
35. What are the external pressures facing your organization?

SCE PTP Draft Final Report
Irrigation Training & Research Center P a g e | 20
Figure 28. Question 36 responses: Importance of energy use
Figure 29. Question 37 responses: Influence of trade/industry associations
Extremely important
82%
Moderately important
10%
Not very important0%
Not important0%
No response8%
36. How important do you feel energy use is to your organization?
Follo
w a
nd
par
tici
pat
e w
ith
th
e
trad
e/i
nd
ust
ry o
rgan
izat
ion
s in
clu
din
g co
nfe
ren
ces
and
me
eti
ngs
Re
fere
nce
issu
e in
mag
dn
ine
/ne
ws
arti
cle
s, u
sed
to
mak
e s
om
e d
eci
sio
ns
Re
fere
nce
em
ails
an
d i
nte
rne
t in
form
atio
n,
no
t re
ally
use
d f
or
de
cisi
on
mak
ing
No
imp
act
No
re
spo
nse
0
2
4
6
8
10
12
14
16
18
# S
urv
eye
d t
hat
Se
lect
ed
Op
tio
n
37. How do the trade/industry associations you belong to affect your
opinion of action on energy use issues, tie-ins to environmental issues, etc?

SCE PTP Draft Final Report
Irrigation Training & Research Center P a g e | 21
Figure 30. Question 38 responses: Energy and resource management
Figure 31. Question 39 responses: Energy consumption sources
Stra
tegi
c p
lan
nin
g d
on
e a
t th
e t
op
le
vel o
f m
anag
em
en
t
De
lega
ted
to m
id-l
eve
l man
age
me
nt
Han
dle
d b
y te
chn
ical
sta
ff
No
t e
no
ugh
tim
e t
o d
ed
icat
e o
ne
p
ers
on
No
re
spo
nse
0
2
4
6
8
10
12
14
# S
urv
eye
d t
hat
Se
lect
ed
Op
tio
n
38. What procedures do you have in place for energy and resource management?
Motors for pumps
75%Cooling systems at the pumping
plants0%Treatment plant
operations9%
Other0%
No response16%
39. What is the largest amount of energy that deals with water/wastewater used?

SCE PTP Draft Final Report
Irrigation Training & Research Center P a g e | 22
Figure 32. Question 42 responses: Future energy consumption predictions
Figure 33. Question 45 responses: Organization type
Figure 34. Question 46 responses: Primary pump applications
Dramatically increasing
10%
Slightly
increasing
45%Staying the same29%
Decreasing
3% No response13%
42. In the future, do you see your energy consumption?
Public53%
Private47%
45. Organization Type
Well55%
Booster34%
Both11%
46. Primary Pump Application

SCE PTP Draft Final Report
Irrigation Training & Research Center P a g e | 23
Figure 35. Question 47 responses: Primary pump type
Figure 36. Question 48 responses: Actual average weighted OPE
Turbine84%
Submersible6%
Centrifugal5%
Turbine/Centrifugal5%
47. Primary Pump Type
0-30%0%
31-45%0%
46-55%
21%
56-70%79%
71% +0%
48. Actual Average Weighted OPE

SCE PTP Draft Final Report
Irrigation Training & Research Center P a g e | 24
Graphical Results from Database
The following graphs represent the graphical data collected from the database. An initial assumption
made by ITRC was that the low values in this SCE OPE database were a direct result of a poor
performing pump that needed to be repaired. The assumption was that these values would provide a clear
indicator of the minimum OPE values that were actually obtained by the pumps prior to repairs.
Unfortunately, it was pointed out by one of the pump testers during a presentation of the preliminary
data that low OPE tests can be generated by a system that operates at several Total Dynamic Head (TDH)
values. In one year, the TDH may be very high (400 ft) and the OPE reported value at 70%. The next
year the TDH may drop to a very low value (100 ft) and the OPE could drop to 30%. Or the OPE values
could be flipped, meaning that there are pumps being used to cover a wide range of operating points.
ITRC created these graphs before it was found that they did not contain information on the minimum
OPE. They are included in this report for informational purposes only. They do help provide a limited
trending graph for the individual pumps.
Figure 37. Evaluation of the OPE results for Los Angeles Water Customer
The following graphs provide a summary of the OPE values for the 38 participants in the OPE survey.
Average OPE values were higher than expected by the research team. In addition, the amount of pumps
that tested over 70% was not expected. Figure 38 shows a summary of the OPE results that was reported
for Group 1.
0
10
20
30
40
50
60
70
80
Ove
rall
Pla
nt
Effi
cie
ncy
Reference Number - Pump Type
LA County Waterworks Overall Plant Efficiency By Pump Graph 3
2729 - SB 10559 - TB 10561 - TB 10555 - TB 10556 - TB 17978 - TB
2007
2008
2009
2010
2006 20072007
2007
Mar
2007
Mar 2007
Nov 2007
Nov
2007
2008
2009
2009
2009
2009
2009
201020102010
SB - Submersible Booster SW - Submersible Well TW - Turbine Well TB - Turbine Booster CB - Centrifugal Booster

SCE PTP Draft Final Report
Irrigation Training & Research Center P a g e | 25
Figure 38. Evaluation of the OPE results for Group 1 (l.) and Group 2a (r.)
Figure 39. Evaluation of the OPE results for Group 2b (l.) and Group 2c (r.)
0
10
20
30
40
50
60
70
80
PU-26 PU-32 PU-7 PR-43 PU-48 PR-32 PU-39 PU-25 PU-31 PR-20-1
Average Overall Plant Efficiencies for SCE Survey Group 1Low 10% Average OPE Avg OPE for All Pump Tests High 10% Average OPE
0
10
20
30
40
50
60
70
80
PR-8 PR-17 PR-26 PU-35 PR-26 PU-40 PR-34 PR-42 PR-51 PU-50
Average Overall Plant Efficiencies for SCE Survey Group 2aLow 10% Average OPE Avg OPE for All Pump Tests High 10% Average OPE
0
10
20
30
40
50
60
70
80
PR-4 PU-1 PU-6 PR-20-2 PU-27 PU-28 PU-44 PR-44 PR-45
Average Overall Plant Efficiencies for SCE Survey Group 2bLow 10% Average OPE Avg OPE for All Pump Tests High 10% Average OPE
0
10
20
30
40
50
60
70
80
PU-16 PR-13 PR-14 PR-16 PU-23 PR-31 PU-41 PR-32-2
Average Overall Plant Efficiencies for SCE Survey Group 2cLow 10% Average OPE Avg OPE for All Pump Tests High 10% Average OPE
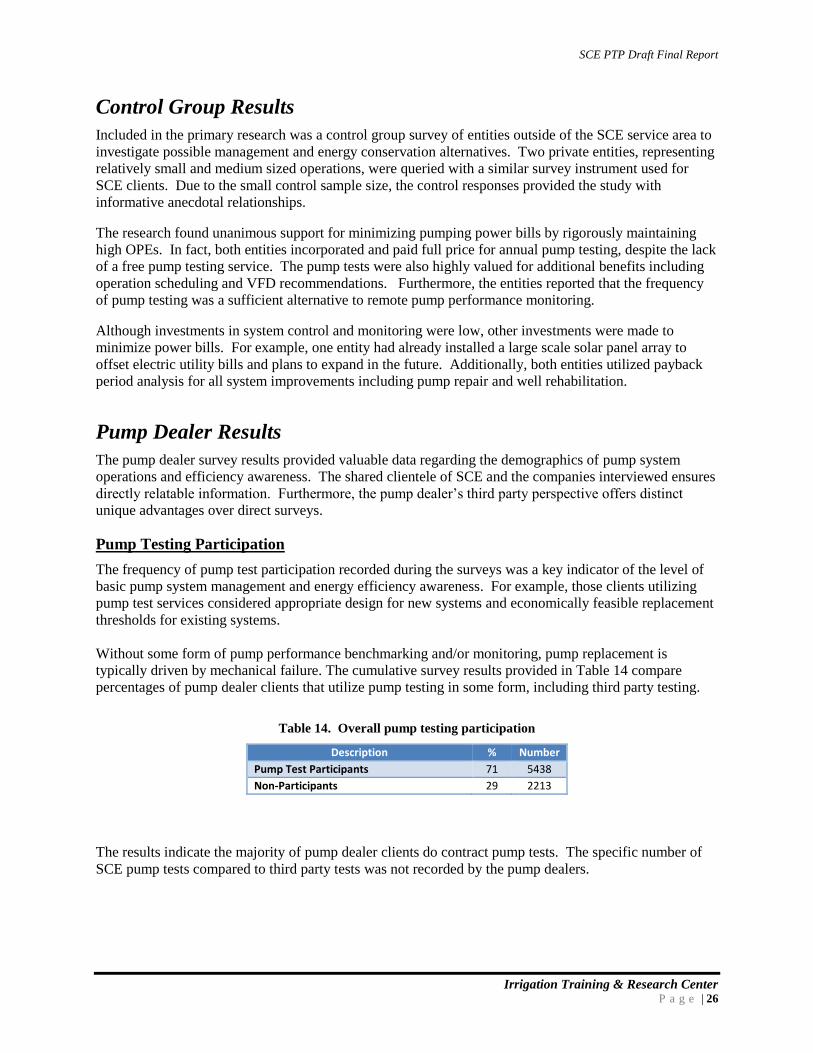
SCE PTP Draft Final Report
Irrigation Training & Research Center P a g e | 26
Control Group Results
Included in the primary research was a control group survey of entities outside of the SCE service area to
investigate possible management and energy conservation alternatives. Two private entities, representing
relatively small and medium sized operations, were queried with a similar survey instrument used for
SCE clients. Due to the small control sample size, the control responses provided the study with
informative anecdotal relationships.
The research found unanimous support for minimizing pumping power bills by rigorously maintaining
high OPEs. In fact, both entities incorporated and paid full price for annual pump testing, despite the lack
of a free pump testing service. The pump tests were also highly valued for additional benefits including
operation scheduling and VFD recommendations. Furthermore, the entities reported that the frequency
of pump testing was a sufficient alternative to remote pump performance monitoring.
Although investments in system control and monitoring were low, other investments were made to
minimize power bills. For example, one entity had already installed a large scale solar panel array to
offset electric utility bills and plans to expand in the future. Additionally, both entities utilized payback
period analysis for all system improvements including pump repair and well rehabilitation.
Pump Dealer Results
The pump dealer survey results provided valuable data regarding the demographics of pump system
operations and efficiency awareness. The shared clientele of SCE and the companies interviewed ensures
directly relatable information. Furthermore, the pump dealer’s third party perspective offers distinct
unique advantages over direct surveys.
Pump Testing Participation
The frequency of pump test participation recorded during the surveys was a key indicator of the level of
basic pump system management and energy efficiency awareness. For example, those clients utilizing
pump test services considered appropriate design for new systems and economically feasible replacement
thresholds for existing systems.
Without some form of pump performance benchmarking and/or monitoring, pump replacement is
typically driven by mechanical failure. The cumulative survey results provided in Table 14 compare
percentages of pump dealer clients that utilize pump testing in some form, including third party testing.
Table 14. Overall pump testing participation
Description % Number
Pump Test Participants 71 5438
Non-Participants 29 2213
The results indicate the majority of pump dealer clients do contract pump tests. The specific number of
SCE pump tests compared to third party tests was not recorded by the pump dealers.

SCE PTP Draft Final Report
Irrigation Training & Research Center P a g e | 27
Pump Test Participants
Clients contracting pump tests generally utilize energy efficiency information in management decisions
more often than those who opt out; however, the focus of this report is the client’s actions based upon this
performance data. The interviewed pump dealers identified various levels of efficiency commitment and
management for pump system owners and operators. This hierarchy of action is shown in the diagram in
Figure 40 with an estimate of category size based upon a fraction of the 7650 serviced pumps represented
in this report.
Figure 40. Client action levels with estimated population sizes
The categories depicted in Figure 40 are described in depth below.
Pumps replaced at preset performance thresholds
This category represents an estimated 3% of pump dealer clients with the following characteristics:
These entities represent the model SCE client with a firm understanding of reducing energy over-
consumption while simultaneously minimizing long-term operating costs.
Typically comprised of well-managed large corporations and public works.
Pumps are tested at short intervals to monitor performance.
Pumps are replaced at pre-determined thresholds.
Estimates of pump replacement intervals are integrated into the business’s economic model and
therefore adequate liquid funding is available to ensure long-term energy/cost savings.
Although these entities may operate large numbers of pumps, they represent a small percentage of
the pump dealer’s clients.
Pumps are replaced on a case-by-case basis
This category represents an estimated 30% of pump dealer clients with the following characteristics:
These entities represent a well-informed SCE client with a firm understanding of reducing energy
over-consumption; however, short-term capital investments are limited .
Typically comprised of moderately-sized public and private entities.
Pump tests are contracted by the following considerations:
o Lost or unknown records
o Stretched or random intervals
Pumps repair or replacements are signaled by one of the following:
o System modifications create different pumping requirements
o Noticeable loss in pressure or flow
This notable portion of SCE clientele represents large potential energy savings and increased
pump testing and incentive program availability.
Pump Repairs
Sporadic Tests (65%)
Pumps are replaced on a case-by-case basis
(30%)
Tests are used for purposes other than pump
replacement (35%)
Regularly Scheduled Tests (5%)
Pumps are replaced at preset
performance thresholds

SCE PTP Draft Final Report
Irrigation Training & Research Center P a g e | 28
Tests are used for purposes other than pump replacement
This category represents an estimated 35% of pump dealer clients with the following characteristics:
Typically comprised of small residential or agricultural wells under 10 HP which are impractical
for performance monitoring.
Pump tests are contracted by the following considerations:
o Well pump certifications during a transfer of real estate ownership
o Changes in water table and water quality
Pumps repair or replacements are signaled by one of the following:
o Catastrophic pump failure
o Noticeable loss in pressure or flow
o Noticeable mechanical wear in bearings and seals
This portion of SCE clientele represents potential energy savings through means other than the
SCE pump testing or incentive program.
Participant Replacement/Repair Trigger
Pump test participants who were reported to take action based on the testing results did so at various OPE
levels. This lower operating limit ranged from 25% to 70% with a weighted mean of 40%. Table 15
summarizes the OPE trigger level compared to its frequency among pump test participators.
Table 15. Various action level OPE triggers
OPE (%) Number of clients
25 450
40 3,545
45 104
50 420
55 215
60 208
70 140
Total 5,082
**NOTE: Some pump dealers were unable to comment on the OPE triggers; therefore the total shown is less than the 5,438 pump test participants.
Figure 41. Comparison of OPE levels at the time of service
0
500
1000
1500
2000
2500
3000
3500
4000
25 40 45 50 55 60 70
Nu
mb
er
of
Re
pai
rs
OPE (%)

SCE PTP Draft Final Report
Irrigation Training & Research Center P a g e | 29
It must be noted that the concept of a threshold OPE was broadly regarded as an installation-specific
value determined largely by the investment payback period. A common economic analysis, the payback
period is dependent upon the following major factors:
Annual operating hours determine the kW consumed per year
Motor horsepower determines the consumed kW/hr
An example mentioned frequently in the interviews follows this guideline:
In this example, minimum guidelines referring to motor horsepower and annual operating hours were
applied to an experienced-based analysis of payback period.
Figure 42. Use of 45% OPE as a point of need for pump repair (Equipoise 2006)
Other programs have noted a target value for pump repair. In Equipoise (2006), a recommended value of
45% was used as the cutoff for recommending a minimum value for pump repair.
Non-Participants
Non-participants were prevalent in all pump application sectors, but were more common in the private
municipal (residential) sector. The survey results indicate the major causes responsible for the lack of
pump test participation are awareness and access. In most cases, the pump owners as well as the local
pump dealers were either unaware of the practicality of pump tests, or too remote to access the program.
This is most likely due to the percentage of non-participant installations between ½ - 5 HP where the cost-
benefit ratio makes testing impractical. Furthermore, small pump manufacturers currently offer minimal
options for smaller systems, as they are considered “disposable” for manufacturers, retailers, and buyers
alike.
This mindset forces the responsibility of energy stewardship on the system designers. For small
installations the pump dealers double as system designers as well as installation services. As this group
lacks performance monitoring, operating efficiencies in such installations are then dependent on the
appropriate design and initial recommendations offered by pump dealers.
A 100 HP or larger motor operated everyday for over 12 hours is typically serviced or replaced when the OPE drops below 50%.

SCE PTP Draft Final Report
Irrigation Training & Research Center P a g e | 30
In terms of basin-wide savings, this situation offers a great opportunity for educational outreach because
of the centralization of the design, installation and repair of small pump systems. A program focusing on
appropriate system design and product specification, based upon best engineering practices, could have a
profound effect on basin-wide energy consumption. In order to more fully develop this potential, Table
16 provides the sector-based makeup of the non-participant group.
Table 16. Non-Participant levels by sector
Group Description Municipal Agricultural Wastewater
Participants 763 4605 70
Non-Participants 933 1249 30
Non-Participant Replacement/Repair Trigger
Without the requisite information from any form of pump performance testing, replacements or repairs
are typically triggered by mechanical failures or noticeable drops in performance. The frequently
addressed triggers for the non-participant group include:
Burnt motor
Worn bowl/impeller
Seized shaft
Short-circuited wiring
Lowered water table
Decrease in well flow rate
It follows that there is a higher probability of low efficiency pumps operating in this group, due to the
broad lack of awareness regarding critical pumping characteristics.
Terminology of the Pump Test
It was noted throughout the pump dealer interviews that the term “pump test” had a variety of meanings
depending upon the pump dealer’s typical pump application, geographic location and specific market.
The focus of SCE’s pump testing program and the topic of this report is the quantification of Overall
Pump Efficiency (OPE).
OPE pump testing requires the accurate measurement of various performance indicators including flow
rate, discharge pressure and electrical energy consumption. The value of a pump test result is directly
related to the measurement accuracy of these parameters. As with any quantitative testing, multiple
“testers” can induce systematic measurement error based upon a number of factors.
These factors include:
Non-standard protocol
Non-standard equipment with different accuracy specifications/certifications
Various levels of pump experience
The majority of these are created from the lack of a general adoption of standardized test procedures.
Further increasing the potential for systematic error is the multitude of non-OPE tests, which may also
measure, but not focus on, pump performance. In some cases the test results from non-OPE tests can be
wrongly compared to those performed by SCE and other certified contractors.
OPE pump tests provide a fundamental tool for long-term pump/well performance monitoring. As such,
increased education outreach and the adoption of a standard test protocol may be a practical approach for
further energy program outreach.

SCE PTP Draft Final Report
Irrigation Training & Research Center P a g e | 31
Table 17. Key recommendations to improve energy use by the pump repair companies
Recommendations by Pump Repair Companies
Location
# of
Annual
Repairs
Percent of
customers
that use any
Test Program
Minimum
OPE
Trigger %
Good
system
design
Rate
structure
Time of
use
Test every
year
Test
Every 3
years
Impeller
material used
Well
cleaning
Flow
measurementMaintenance
Recommends
VFDs if
appropriate
Premium Eff
Motor
High Eff
motor
Standard
eff motor
Replacement
only, not repair
1 Temecula 260 10% Brnz, SS
2 Visalia 600 70% 50% X Brnz, SS X X
3 Camarillo 300 10% X SS X X X
4 Barstow 200 30% 40% X Brnz X X X
5 Shafter 225 70% 60% X X Brnz X X X X
6 Ojai 50 50% 55% X Brnz, SS X X X X X
7 Delano 100 50% 60% X X X X X X
8 Visalia 750 0.6 25% X X Brnz, SS, Iron X X X
9 Corcoran 250 80% 40% X Brnz X X X
10 Bakersfield 3650 90% 40% X X X X
11 Yucca Valley 75 0% X X X
12 Temecula 300 100% X SS X X X
13 Redlands 200 95% 55% SS X X X X X X
14 Bakersfield 200 Brnz X X
15 Coachella 30 X X
16 San Bernadino 260 40% 45% X Brnz, SS X X
17 Paramount 200 70% 70% X X Brnz, SS X X X
Counts 7650 7 1 2 7 1 9 2 2 15 4 8 7 2
Percentages 41% 6% 12% 41% 6% 53% 12% 12% 88% 24% 47% 41% 12%

SCE PTP Draft Final Report
Irrigation Training & Research Center P a g e | 32
RECOMMENDATIONS
Pump Testing Program
The survey results indicate that the Pump Testing Program offered by SCE has been generally accepted
and widely used. Furthermore, minimal improvement recommendations were offered to ITRC staff
during the interview process.
The positive aspects of the current state of the SCE Pump Testing Program include:
There has been widespread acceptance and confidence in the program’s findings. Little to no support
was reported to the contrary. This is a good indicator that SCE clients trust the results as
scientifically accurate.
Many SCE clients include regularly scheduled SCE pump tests as part of their water management
program. This fact indicates good management practices and energy stewardship, as well as adequate
support from SCE staff.
The lead time for SCE pump tests was reported to be between 3-7 days. This relatively short
turnaround time means that there are currently an adequate number of trained SCE representatives.
Additionally, the lack of same-day testing indicates the current staff is busy completing pump tests,
and little down time is available. This is interesting to note since previous studies (Cullen et al 2009)
reported that one of the key problems was the 4-6 week wait for a pump test to be performed.
SCE pump tests are common precursors to incentive program applications. Not only are clients
curious about pump performance, but also interested in improving their water infrastructure.
The free service creates few reasons not to participate in the program. Although third parties charge a
relatively low sum (up to $500 per pump test) for the same service, this cost can be insurmountable
for some operations on tight budgets.
Areas of possible improvement include:
Some rural areas receive less than adequate support and contact from SCE representatives, resulting
in a lack of awareness or interest in energy savings. Therefore, these areas tend to have a lower
savings potential than more developed areas. Some pump dealers indicated this concept has been a
progression over the past 5 years.
This program provides a free testing service, but lacks the educational outreach to bring in new clients,
especially agricultural clients.
The following list offers recommended improvements to the SCE Pump Test Program to increase the
participant base and its effectiveness as an energy conservation program.
Increased educational outreach
o The addition of an educational program has the potential to not only increase the client base,
but also better improve the efficiency of new installations
o Education and scientific progression can only help an industry that has typically relied on
experience, gut feelings, and “rules of thumb”
o Technological advances are exponentially more affordable and available to the general
consumer. An educational program could provide information regarding new products,
applications and services that increase energy efficiency.
Increasing the availability of pump tests to rural areas
o It may be practical to expand the pump test service area, or at minimum the educational
aspect of the program, to currently inactive regions in southern California.

SCE PTP Draft Final Report
Irrigation Training & Research Center P a g e | 33
Pump Incentive Program
SCE also offers cost-sharing services through incentive programs for clients who decide to upgrade or
repair degraded infrastructure. Although not the primary subject of this report, incentive programs
provide key financial support in the energy conservation process. Timely, appropriate, and focused
allocations of incentive funds are critical to true energy conservation success rates in California.
Because the Pump Testing Program is exclusively informative, there exists no pretense of participant
action post-testing. No database relating pump test participation to frequency of recommendation follow-
through was supplied to ITRC during this project. However, ITRC collected preliminary findings in this
matter through numerous interviews. Figure 43 and Figure 44 show the participation of the respondents
in other energy efficiency programs.
Participation in the SCE incentive program requires approval on any cost-sharing project before work can
commence, and rightly so. Some level of oversight over project adequacy and suitability is crucial for the
sustainability of the program. It is important for SCE to verify certain requirements are met, including a
minimum $/kW-hr conserved. However, numerous customers reported a level of frustration regarding the
participation in the incentive program due to the extended approval lead times.
Many pump dealers and some SCE clients referred to a pre-approval lead time range of 30-90 days
between filing the necessary paperwork and receiving SCE approval. This relatively long time schedule
eliminates many projects due to logistical infeasibility. For example, a pump that experiences an
unexpected catastrophic failure during the peak growing season would need to be replaced within a week,
if not sooner. Smaller entities as well may not have the budget for widespread pump redundancy and
would require approval ASAP.
Although these examples represent cases where a new pump is installed regardless of participation in the
program, the incentive would support the purchasing of higher-end and more efficient hardware. To
increase the use of cost-sharing, the approval process period would need to be reduced considerably.
Figure 43. Question 30 responses: EE/DR incentive participation (summary)
0
5
10
15
20
25
30
# S
urv
eye
d t
hat
Par
tici
pat
e

SCE PTP Draft Final Report
Irrigation Training & Research Center P a g e | 34
Figure 44. Question 31 responses: EE/DR incentive participation

SCE PTP Draft Final Report
Irrigation Training & Research Center P a g e | 35
Key Report Recommendations
Large Potential for Energy Savings
There is a large potential for energy and water savings in California. ITRC has published several reports
documenting overall energy use and the potential for savings such as California Agricultural Electrical
Energy Requirements (Burt et. al., 2003), which included a synopsis of average pumping plant
efficiencies throughout central California’s irrigation districts and growers. The average pumping plant
efficiency for public water district pump tests was 64% (over large 900 pumps included). This high OPE
value is similar to the public entities in this SCE OPE study (average OPE ~57%).
However, the 2003 ITRC report noted a substantially lower value for on-farm pumps throughout
California’s San Joaquin Valley. An average pumping plant efficiency of 48% was calculated from over
2,800 on-farm pump test data points. This discrepancy indicates a large potential for energy conservation
at the on-farm level.
Burt (2012) evaluated energy savings potential from a total of 15,000 pumps located throughout
California. With similar average OPE findings presented in Burt (2012), potential savings was computed
as 102,100 MWh/year. Burt (2012) targeted the recommendations with an analysis which concluded that
by targeting only 2.5% of the larger pumping units, about 12% of the total potential savings could
be achieved. Relating this back to SCE’s service area, this would tend to focus on the large pumps used
by public agencies. It is highly recommended that these entities be supported to perform pump testing
even if they have adopted a maintenance mode of operation. Figure 45 is a graphic summary of the results
of the Burt (2012) evaluation. Note that this type of energy analysis could only be done with OPE tests.
Figure 45. Contour plot of Input kW vs. OPE (%) arranged by money savings (thousand $/year) (Burt 2012)
It is highly recommended that entities that are pumping water in California be supported to perform pump
testing even if they have adopted a maintenance mode of operation.
In general, the majority of the SCE Pump Testing Program participants could be characterized into two
groups:
Type 1 Customer. There were a number of respondents that stated that would consider taking action on
the repair/replacement/retrofit of a pumping unit at a relative OPE value below 50%, or at
catastrophic failure. Typically, the OPE level was cited as only one of many determinants, including
hours of operation, economic analysis and flow/pressure performance. All of the Type 1 customers
contacted felt that the SCE Pump Testing Program was a valuable service.
OPPE (%)
Inp
ut
kW
70605040302010
300
250
200
150
100
50
>
–
–
–
–
–
–
–
–
–
<
10 15
15
2
2 3
3 4
4 5
5 6
6 7
7 8
8 9
9 10
per year
$ saved
Thousand
Well pumps
OPPE (%)
Inp
ut
kW
70605040302010
250
200
150
100
50
>
–
–
–
–
–
–
–
–
–
–
<
15 20
20 30
30
2
2 3
3 4
4 5
5 6
6 7
7 8
8 10
10 15
per year
$ saved
Thousand
Non-well pumps
Figure 8. Contour plot of Input kW vs. OPPE (%) arranged by money savings (Thousand $/year)

SCE PTP Draft Final Report
Irrigation Training & Research Center P a g e | 36
Type 2 Customer. There were a smaller number of respondents that would state that they used a value as
high as 65% as a point where they take action on the repair/replacement/retrofit of a pumping unit.
These customers would cite the benefits of pump testing, the influence of the SCE Pump Testing
Program, and that rapid pump evaluation is a key way to conserve energy and optimize resources.
Typically, the OPE was the key determinant in the decision making process. There was significant
concern that this evaluation of the program was being done to change the focus and direction of the
SCE Pump Testing Program. All of the Type 2 customers contacted felt that the SCE Pump Testing
Program was a valuable service.
Figure 46 illustrates the theoretical difference between a Type 1 and Type 2 SCE customer who
participates in the pump test program, in terms of water/energy use on a single pumping unit. The time
frame was expanded to 20 years to illustrate the temporal savings. It also illustrates that the OPE values
are changing constantly and that a single year evaluation of benefits can be deceiving.
Figure 46. Theoretical energy use for two types of customers
The results of this example show that the Pump Testing Program is beneficial to both types of customers.
Obviously, the Type 2 Customer is influenced heavily by the SCE Pump Testing and Rebate Incentives
program. The result is a significant actual energy savings (27% energy over 20 years in this example).
Although Type 1 Customers still benefit from pump test information, this example illustrates that
influencing Type 1 Customers to act more like Type 2 Customers would be beneficial to SCE. The
potential for future energy savings from Type 1 Customers is significant.
Recognizing that there are limited resources available and that every SCE customer cannot receive a
pump test every year, there are other opportunities to aid SCE customers in the monitoring of the decline
in pump performance. Coupled with adequate education, increased instantaneous performance
monitoring has the potential to decrease the demand for short interval pump testing.
0
300,000
600,000
900,000
1,200,000
1,500,000
1,800,000
2,100,000
2,400,000
2,700,000
3,000,000
0%
10%
20%
30%
40%
50%
60%
70%
80%
90%
100%
Year
1
Year
2
Year
3
Year
4
Year
5
Year
6
Year
7
Year
8
Year
9
Year
10
Year
11
Year
12
Year
13
Year
14
Year
15
Year
16
Year
17
Year
18
Year
19
Year
20
Cu
mu
lati
ve E
ne
rgy
Use
(kW
h)
OP
E %
Time
Energy Use Comparison
Customer Type 1 - OPE Retrofit at Failure
Customer Type 2 - OPE Repair at Trigger
Energy Use - Type 1
Energy Use - Type 2
Note: 27% Reduction in Energy ConsumptionType 1 - 1.85 MkWh, Type 2 - 2.34 MkWh

SCE PTP Draft Final Report
Irrigation Training & Research Center P a g e | 37
Option 1
Installation of state-of-the-art flow meters. Innumerable pump stations have poor hydraulic conditions for
flow rate measurement. New advances in magnetic flow meter technology have provided a simple
solution that has only recently become available. Research has demonstrated that these new electronic
devices can work adequately in the poor hydraulic conditions existing in many pumping plants. In fact,
some manufacturers have incorporated hydraulic conditioning into the measurement device for this
reason. The key disadvantage to these meters is cost. Further analysis would be required to determine the
feasibility and potential changes in behavior with the addition of instantaneous flow rate information for
operational management.
Figure 47. Photo showing the use of a magnetic flow meter in a poor hydraulic condition
Option 2
Installation of individual pump power meters. Most installations utilize only one device that meters the
power consumption of multiple pumps. This makes pump performance monitoring problematic. New
products have become available that provide inexpensive and non-intrusive metering of all circuit
characteristics including power factor, kW, amperage and voltage. While a pump test report can separate
the data to indicate the individual performance of pump units, the direct reading approach would aid SCE
customers in the decision making process by helping with documenting the trend of the performance.
Figure 48. Direct display kilowatt meter
Concentric Reducer

SCE PTP Draft Final Report
Irrigation Training & Research Center P a g e | 38
The installation of these devices has the potential to change each type of customer in the following ways:
Type 1 Customer
Type 1 Customers have a firm grasp on external indicators such as pump discharge pressure and
flow rate. Furthermore, it has been reported that a portion of these customers contract pump tests
for a simple flow rate measurement rather than understanding the benefit of OPE values. The
installation of a flow meter at these sites has the potential to inherently decrease this behavior as
well as provide a primer for further education.
At this time, Type 1 Customers may not benefit from the installation of an individual pump
power meter unless intensive education is also provided.
Type 2 Customer
Because of the interest in maintaining high OPE levels and having the resources follow through,
the capability of monitoring both individual pump flow rates and power usage could greatly
benefit Type 2 Customers. These devices provide the majority of required information to
continuously monitor pump performance without the need to rely solely on SCE.
SCE pump tests could then be used to verify the daily monitoring afforded by these devices potentially
decreasing the demand for short-term (6-month/annual) test scheduling.
Increase the OPE Education for Pump Testers
Pump testers should be provided with additional information on pump improvements that are beyond an
OPE test. For example, the use of Variable Frequency Drives (VFDs) seems to be underutilized in the
SCE service area. There are new techniques and ideas for pump repair that could be shared with
customers. For example, there seems to be a lack of awareness of the different materials available for
impellers for dealing with sand wear. The materials available can help extend the life of pumps. Another
simple recommendation is to limit the use of pump screens that readily deteriorate due to corrosion. New
materials should be specified that are non-corrosive and do not limit the flow area to the pump. New
methods to impact water quality from wells are also being developed. Some pump dealers are using
“packers” to try to improve the water quality. Burt (2008) covers a wide variety of some of the key
components for obtaining and maintaining a good OPE.
Figure 49. Use of packers to limit zones of poor water quality in a well. The packers are installed to limit
portions of the aquifer. Packers cause problems for pump testers by blocking the access to the pumping
water level.

SCE PTP Draft Final Report
Irrigation Training & Research Center P a g e | 39
Increase the OPE Education for SCE Customers
There needs to be an expanded effort toward education SCE customers on the Pump Testing Program.
For example, there was an obvious lack of awareness on how the OPE values vary based on the size of a
pump. One of the survey questions dealt with how these customers get their information on energy-
related topics. The highest response targeted SCE sources.
ITRC would be available to generate a list of topics that could be developed for future training that would
target pump testers and SCE pump customers.
Decrease the Use of Independent Surveys
More than one SCE customer complained about the number of questionnaires/surveys. ITRC has been
involved with numerous surveys over the last 2 decades. It was unexpectedly difficult to get cooperation
from the SCE customer base to get the surveys completed. The next phase of OPE evaluation should be
done with site interviews/discussions and coordinated directly with the pump testers.
Minimum Threshold for OPE
Although this study did not clearly identify a minimum OPE value, it was clear that the majority of pump
retrofits/repairs occur after a pump has dropped below an OPE level of 50%.

SCE PTP Draft Final Report
Irrigation Training & Research Center P a g e | 40
REFERENCES
Burt, C.M., D.J. Howes, and G. Wilson. (2003). “California Agricultural Water Electrical Energy
Requirements”. ITRC Report No. 03-006, December 1, 2003. Irrigation Training & Research Center. Cal
Poly. San Luis Obispo, CA.
Cullen, G., D. Swarts, and U. Mengelberg. (2009). PROCESS EVALUATION REPORT for the SCE
Agricultural Energy Efficiency Program. Summit Blue Consulting Inc. CALMAC Study ID
SEC0287.01 October 13, 2009
Equipoise Consulting, Inc. (2006). Evaluation of the Agricultural Pumping Efficiency Program (CPUC
Project 230-02ABCD). March 2006.
KEMA. (2012). Industrial Sectors Market Characterization: Water and Wastewater Industry.
Prepared for Pacific Gas & Electric and Southern California Edison. January 2012.
Orvis, S.A., C.M. Burt, and L. Perez Urrestarazu. (2011). “Characteristics of Irrigation Pump
Performance in Major Irrigated Areas of California”. ITRC Paper No. P11-010, November 2011.
Irrigation Training & Research Center. Cal Poly. San Luis Obispo, CA.
Pérez Urrestarazu, L. and C.M. Burt. (2011). ”Characterization of Pumps for Irrigation in Central
California: Potential Energy Savings.” J. Irrig. Drain Eng., 138(9), 815–822.
doi: 10.1061/(ASCE)IR.1943-4774.0000463