r33 factors contributing to variable sound localization ... · r33 factors contributing to variable...
TRANSCRIPT
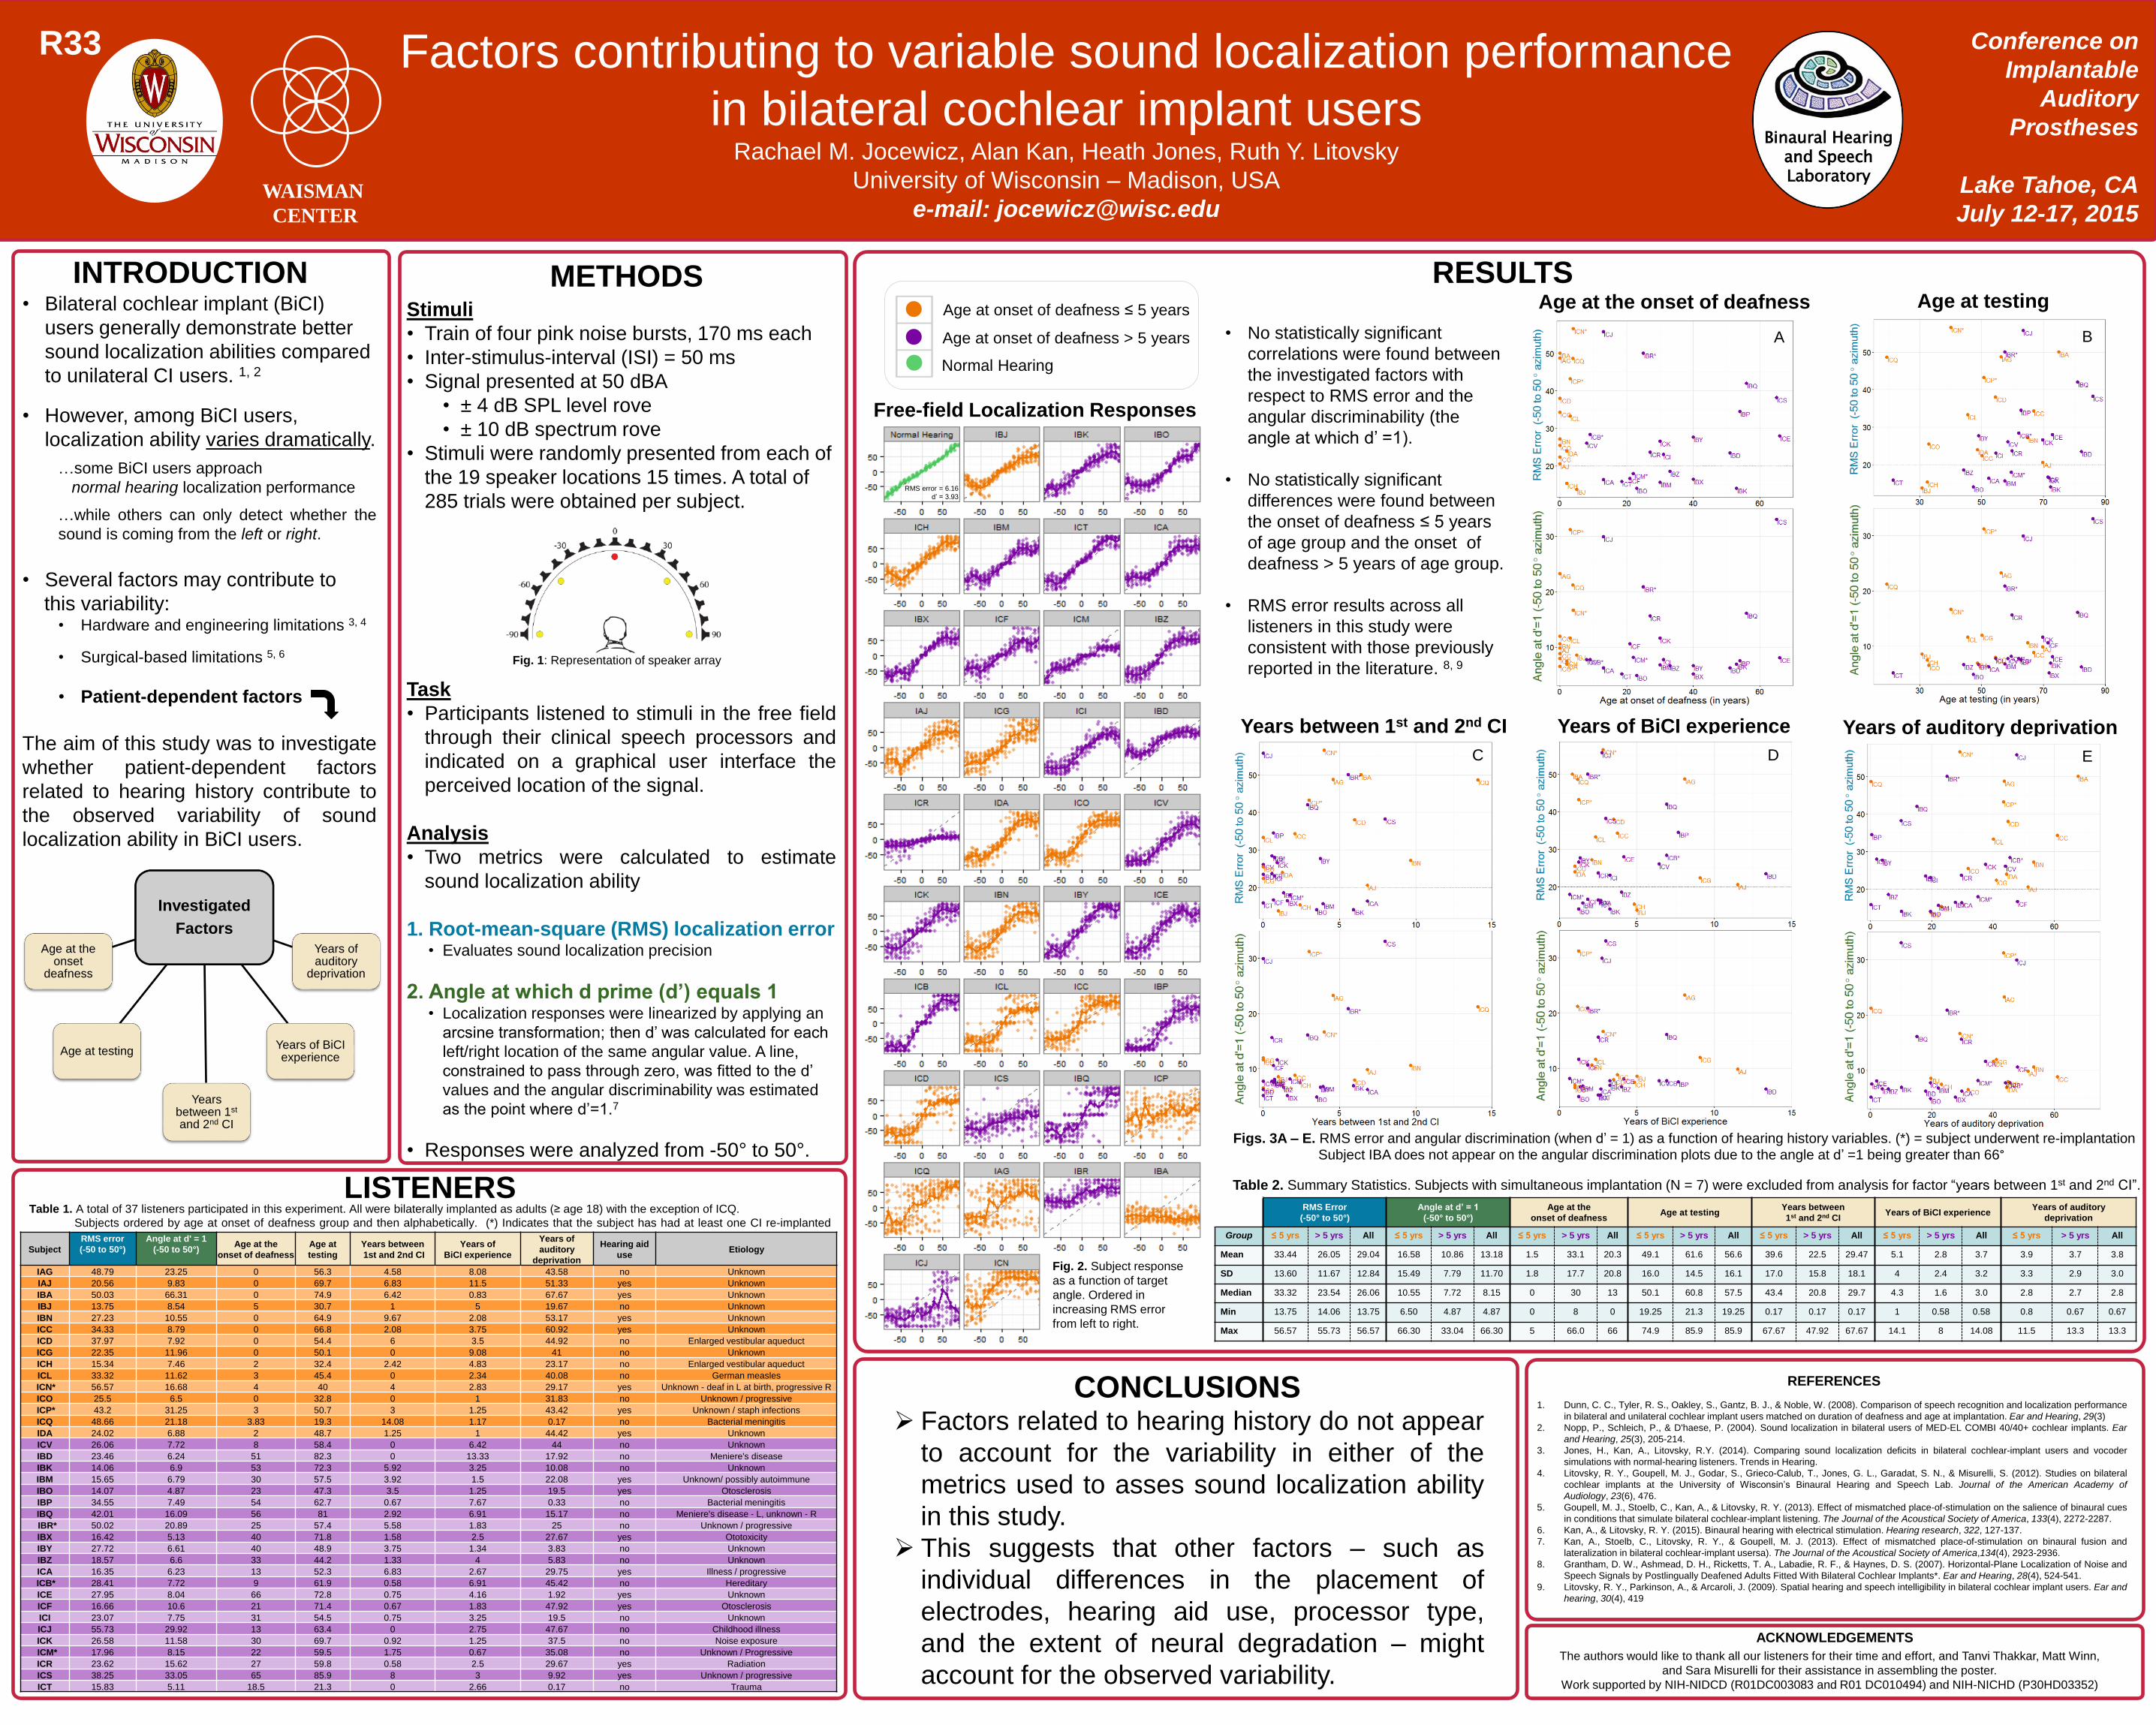
R33 Factors contributing to variable sound localization performance
in bilateral cochlear implant users Rachael M. Jocewicz, Alan Kan, Heath Jones, Ruth Y. Litovsky
University of Wisconsin – Madison, USA
e-mail: [email protected]
Conference on
Implantable
Auditory
Prostheses
Lake Tahoe, CA
July 12-17, 2015 WAISMAN
CENTER
INTRODUCTION METHODS RESULTS
CONCLUSIONS REFERENCES
ACKNOWLEDGEMENTS
Stimuli
• Train of four pink noise bursts, 170 ms each
• Inter-stimulus-interval (ISI) = 50 ms
• Signal presented at 50 dBA
• ± 4 dB SPL level rove
• ± 10 dB spectrum rove
• Stimuli were randomly presented from each of
the 19 speaker locations 15 times. A total of
285 trials were obtained per subject.
Task
• Participants listened to stimuli in the free field
through their clinical speech processors and
indicated on a graphical user interface the
perceived location of the signal.
Analysis
• Two metrics were calculated to estimate
sound localization ability
1. Root-mean-square (RMS) localization error• Evaluates sound localization precision
2. Angle at which d prime (d’) equals 1 • Localization responses were linearized by applying an
arcsine transformation; then d’ was calculated for each
left/right location of the same angular value. A line,
constrained to pass through zero, was fitted to the d’
values and the angular discriminability was estimated
as the point where d’=1.7
• Responses were analyzed from -50° to 50°.
LISTENERS
• Bilateral cochlear implant (BiCI)
users generally demonstrate better
sound localization abilities compared
to unilateral CI users. 1, 2
• However, among BiCI users,
localization ability varies dramatically.
…some BiCI users approach
normal hearing localization performance
…while others can only detect whether the
sound is coming from the left or right.
• Several factors may contribute to
this variability:• Hardware and engineering limitations 3, 4
• Surgical-based limitations 5, 6
• Patient-dependent factors
The aim of this study was to investigate
whether patient-dependent factors
related to hearing history contribute to
the observed variability of sound
localization ability in BiCI users.
Fig. 1: Representation of speaker array
Age at testing
Years of BiCI experience Years of auditory deprivationYears between 1st and 2nd CI
Table 1. A total of 37 listeners participated in this experiment. All were bilaterally implanted as adults (≥ age 18) with the exception of ICQ.
Subjects ordered by age at onset of deafness group and then alphabetically. (*) Indicates that the subject has had at least one CI re-implanted
surgery
Factors related to hearing history do not appear
to account for the variability in either of the
metrics used to asses sound localization ability
in this study.
This suggests that other factors – such as
individual differences in the placement of
electrodes, hearing aid use, processor type,
and the extent of neural degradation – might
account for the observed variability.
Figs. 3A – E. RMS error and angular discrimination (when d’ = 1) as a function of hearing history variables. (*) = subject underwent re-implantationSubject IBA does not appear on the angular discrimination plots due to the angle at d’ =1 being greater than 66°
Investigated
Factors
Age at testing
Age at the onset
deafness
Years of auditory
deprivation
Years of BiCI experience
Years between 1st
and 2nd CI
Free-field Localization Responses
Table 2. Summary Statistics. Subjects with simultaneous implantation (N = 7) were excluded from analysis for factor “years between 1st and 2nd CI”.
RMS Error
(-50° to 50°)
Angle at d’ = 1
(-50° to 50°)
Age at the
onset of deafnessAge at testing
Years between
1st and 2nd CIYears of BiCI experience
Years of auditory
deprivation
Group ≤ 5 yrs > 5 yrs All ≤ 5 yrs > 5 yrs All ≤ 5 yrs > 5 yrs All ≤ 5 yrs > 5 yrs All ≤ 5 yrs > 5 yrs All ≤ 5 yrs > 5 yrs All ≤ 5 yrs > 5 yrs All
Mean 33.44 26.05 29.04 16.58 10.86 13.18 1.5 33.1 20.3 49.1 61.6 56.6 39.6 22.5 29.47 5.1 2.8 3.7 3.9 3.7 3.8
SD 13.60 11.67 12.84 15.49 7.79 11.70 1.8 17.7 20.8 16.0 14.5 16.1 17.0 15.8 18.1 4 2.4 3.2 3.3 2.9 3.0
Median 33.32 23.54 26.06 10.55 7.72 8.15 0 30 13 50.1 60.8 57.5 43.4 20.8 29.7 4.3 1.6 3.0 2.8 2.7 2.8
Min 13.75 14.06 13.75 6.50 4.87 4.87 0 8 0 19.25 21.3 19.25 0.17 0.17 0.17 1 0.58 0.58 0.8 0.67 0.67
Max 56.57 55.73 56.57 66.30 33.04 66.30 5 66.0 66 74.9 85.9 85.9 67.67 47.92 67.67 14.1 8 14.08 11.5 13.3 13.3
Fig. 2. Subject response
as a function of target
angle. Ordered in
increasing RMS error
from left to right.
Age at the onset of deafness
• No statistically significant
correlations were found between
the investigated factors with
respect to RMS error and the
angular discriminability (the
angle at which d’ =1).
• No statistically significant
differences were found between
the onset of deafness ≤ 5 years
of age group and the onset of
deafness > 5 years of age group.
• RMS error results across all
listeners in this study were
consistent with those previously
reported in the literature. 8, 9
Normal Hearing
Age at onset of deafness > 5 years
Age at onset of deafness ≤ 5 years
A B
C D E
1. Dunn, C. C., Tyler, R. S., Oakley, S., Gantz, B. J., & Noble, W. (2008). Comparison of speech recognition and localization performance
in bilateral and unilateral cochlear implant users matched on duration of deafness and age at implantation. Ear and Hearing, 29(3)
2. Nopp, P., Schleich, P., & D'haese, P. (2004). Sound localization in bilateral users of MED-EL COMBI 40/40+ cochlear implants. Ear
and Hearing, 25(3), 205-214.
3. Jones, H., Kan, A., Litovsky, R.Y. (2014). Comparing sound localization deficits in bilateral cochlear-implant users and vocoder
simulations with normal-hearing listeners. Trends in Hearing.
4. Litovsky, R. Y., Goupell, M. J., Godar, S., Grieco-Calub, T., Jones, G. L., Garadat, S. N., & Misurelli, S. (2012). Studies on bilateral
cochlear implants at the University of Wisconsin’s Binaural Hearing and Speech Lab. Journal of the American Academy of
Audiology, 23(6), 476.
5. Goupell, M. J., Stoelb, C., Kan, A., & Litovsky, R. Y. (2013). Effect of mismatched place-of-stimulation on the salience of binaural cues
in conditions that simulate bilateral cochlear-implant listening. The Journal of the Acoustical Society of America, 133(4), 2272-2287.
6. Kan, A., & Litovsky, R. Y. (2015). Binaural hearing with electrical stimulation. Hearing research, 322, 127-137.
7. Kan, A., Stoelb, C., Litovsky, R. Y., & Goupell, M. J. (2013). Effect of mismatched place-of-stimulation on binaural fusion and
lateralization in bilateral cochlear-implant usersa). The Journal of the Acoustical Society of America,134(4), 2923-2936.
8. Grantham, D. W., Ashmead, D. H., Ricketts, T. A., Labadie, R. F., & Haynes, D. S. (2007). Horizontal-Plane Localization of Noise and
Speech Signals by Postlingually Deafened Adults Fitted With Bilateral Cochlear Implants*. Ear and Hearing, 28(4), 524-541.
9. Litovsky, R. Y., Parkinson, A., & Arcaroli, J. (2009). Spatial hearing and speech intelligibility in bilateral cochlear implant users. Ear and
hearing, 30(4), 419
Subject
RMS error
(-50 to 50°)
Angle at d' = 1
(-50 to 50°)Age at the
onset of deafness
Age at
testing
Years between
1st and 2nd CI
Years of
BiCI experience
Years of
auditory
deprivation
Hearing aid
useEtiology
IAG 48.79 23.25 0 56.3 4.58 8.08 43.58 no Unknown
IAJ 20.56 9.83 0 69.7 6.83 11.5 51.33 yes Unknown
IBA 50.03 66.31 0 74.9 6.42 0.83 67.67 yes Unknown
IBJ 13.75 8.54 5 30.7 1 5 19.67 no Unknown
IBN 27.23 10.55 0 64.9 9.67 2.08 53.17 yes Unknown
ICC 34.33 8.79 0 66.8 2.08 3.75 60.92 yes Unknown
ICD 37.97 7.92 0 54.4 6 3.5 44.92 no Enlarged vestibular aqueduct
ICG 22.35 11.96 0 50.1 0 9.08 41 no Unknown
ICH 15.34 7.46 2 32.4 2.42 4.83 23.17 no Enlarged vestibular aqueduct
ICL 33.32 11.62 3 45.4 0 2.34 40.08 no German measles
ICN* 56.57 16.68 4 40 4 2.83 29.17 yes Unknown - deaf in L at birth, progressive R
ICO 25.5 6.5 0 32.8 0 1 31.83 no Unknown / progressive
ICP* 43.2 31.25 3 50.7 3 1.25 43.42 yes Unknown / staph infections
ICQ 48.66 21.18 3.83 19.3 14.08 1.17 0.17 no Bacterial meningitis
IDA 24.02 6.88 2 48.7 1.25 1 44.42 yes Unknown
ICV 26.06 7.72 8 58.4 0 6.42 44 no Unknown
IBD 23.46 6.24 51 82.3 0 13.33 17.92 no Meniere's disease
IBK 14.06 6.9 53 72.3 5.92 3.25 10.08 no Unknown
IBM 15.65 6.79 30 57.5 3.92 1.5 22.08 yes Unknown/ possibly autoimmune
IBO 14.07 4.87 23 47.3 3.5 1.25 19.5 yes Otosclerosis
IBP 34.55 7.49 54 62.7 0.67 7.67 0.33 no Bacterial meningitis
IBQ 42.01 16.09 56 81 2.92 6.91 15.17 no Meniere's disease - L, unknown - R
IBR* 50.02 20.89 25 57.4 5.58 1.83 25 no Unknown / progressive
IBX 16.42 5.13 40 71.8 1.58 2.5 27.67 yes Ototoxicity
IBY 27.72 6.61 40 48.9 3.75 1.34 3.83 no Unknown
IBZ 18.57 6.6 33 44.2 1.33 4 5.83 no Unknown
ICA 16.35 6.23 13 52.3 6.83 2.67 29.75 yes Illness / progressive
ICB* 28.41 7.72 9 61.9 0.58 6.91 45.42 no Hereditary
ICE 27.95 8.04 66 72.8 0.75 4.16 1.92 yes Unknown
ICF 16.66 10.6 21 71.4 0.67 1.83 47.92 yes Otosclerosis
ICI 23.07 7.75 31 54.5 0.75 3.25 19.5 no Unknown
ICJ 55.73 29.92 13 63.4 0 2.75 47.67 no Childhood illness
ICK 26.58 11.58 30 69.7 0.92 1.25 37.5 no Noise exposure
ICM* 17.96 8.15 22 59.5 1.75 0.67 35.08 no Unknown / Progressive
ICR 23.62 15.62 27 59.8 0.58 2.5 29.67 yes Radiation
ICS 38.25 33.05 65 85.9 8 3 9.92 yes Unknown / progressive
ICT 15.83 5.11 18.5 21.3 0 2.66 0.17 no Trauma
The authors would like to thank all our listeners for their time and effort, and Tanvi Thakkar, Matt Winn,
and Sara Misurelli for their assistance in assembling the poster.
Work supported by NIH-NIDCD (R01DC003083 and R01 DC010494) and NIH-NICHD (P30HD03352)
C
RMS error = 6.16
d’ = 3.93