radiologic technologist wage and salary survey 2010
TRANSCRIPT

Radiologic TechnologistWage and Salary Survey 2010
A Nationwide Survey of Registered Radiologic TechnologistsConducted by the American Society of Radiologic Technologists
©2010 ASRT. All rights reserved.Reproduction in any form is forbidden without written permission from publisher.
Reported June 2010

©2010 ASRT. All rights reserved. Radiologic Technologist Wage and Salary Survey 2010
ii
Executive Summary ...................................................................................................................................................................................................1Compensation and Benefits .................................................................................................................................................................................1Demographics and the Workplace ....................................................................................................................................................................1Discipline ......................................................................................................................................................................................................................1Compensation and Demographics at a Glance ...........................................................................................................................................2Full-time Base Annual Compensation Comparison of 2004, 2007 and 2010 ...................................................................................2
Introduction ...................................................................................................................................................................................................................3Methodology ..............................................................................................................................................................................................................3Sample Design ...........................................................................................................................................................................................................3Considerations ...........................................................................................................................................................................................................4Primary Dependent Variable: Annualized Compensation .......................................................................................................................4Data Reliability ...........................................................................................................................................................................................................4Margin of Error ...........................................................................................................................................................................................................5The Report ...................................................................................................................................................................................................................5
Annual Compensation .............................................................................................................................................................................................6Compensation of Full-time vs. Part-time R.T.s ...............................................................................................................................................6Full-time Compensation by Overall, Position and Workplace for Each Discipline .........................................................................7Full-time Compensation by Overall, Education and Years in Profession for Each Discipline ....................................................8Full-time Compensation by Overall and State for Each Discipline ................................................................................................ 9-10Please rate your level of satisfaction with your current salary or wages. ........................................................................................11Did you receive a raise in your salary/wages in the past 12 months? ................................................................................................11Are you paid for being on call? ..........................................................................................................................................................................11Are you represented by a collective bargaining agent or union? ...................................................................................................... 12Benefits....................................................................................................................................................................................................................... 12Professional Development ................................................................................................................................................................................. 12
Demographics ........................................................................................................................................................................................................... 13Age ............................................................................................................................................................................................................................... 13Gender ........................................................................................................................................................................................................................ 13Highest Level of Education Completed ........................................................................................................................................................ 14
Employment Status ................................................................................................................................................................................................ 15Are you presently employed in the radiologic sciences? ...................................................................................................................... 15If not, please select the response that best describes your employment status. ....................................................................... 15
Employment Setting .............................................................................................................................................................................................. 16Approximately how many hours do you work in an average week? ............................................................................................... 16In which employment setting do/did you practice most of the time? ............................................................................................ 17If your primary practice is/was in a hospital, what is/was the size (in no. of beds) of the hospital? .................................... 18Are you responsible for any image postprocessing in your position? ............................................................................................. 18How long have/had you practiced in the radiologic sciences? .......................................................................................................... 19Please indicate in which discipline you practice(d) most of the time. .............................................................................................20How long have/had you practiced in your primary discipline? .......................................................................................................... 21Which of the following titles best describes your current job position? .........................................................................................22How long have/had you practiced in this current position? ................................................................................................................23
ASRT Membership ................................................................................................................................................................................................. 24Are you currently a member of the ASRT? .................................................................................................................................................. 24How long have you been a member of the ASRT? .................................................................................................................................. 24
Appendix A ...................................................................................................................................................................................................................25Cover Letter ....................................................................................................................................................................................................................25Survey Instrument .................................................................................................................................................................................................26-27
Appendix B ...................................................................................................................................................................................................................28State Weight and Response Rate by State .........................................................................................................................................................28Discipline Weight and Response Rate by Discipline ......................................................................................................................................29
Table of Contents

©2010 ASRT. All rights reserved. Radiologic Technologist Wage and Salary Survey 2010
1
Executive Summary
The ASRT Wage and Salary Survey 2010 was made avail-able in early February 2010 to a random sample of ARRT-registered radiologic technologists from each of the 50 states and the District of Columbia. The sample was drawn from the registrant database of the American Registry of Radiologic Technologists (registrants with active status), which numbered approximately 298,000 when the sample was drawn. A total of 29,558 surveys and invitations to take the survey were sent via e-mail or postal mail. From this sample, a total of 8,162 surveys were completed, yield-ing a return rate of approximately 28%. Volunteers also were invited to take the survey via the ASRT Web Site. This resulted in 906 participants voluntarily completing the survey. Thus, a total of 9,068 people completed the survey.
The results are reported with data weighted to account for deliberate oversampling of R.T.s working in less populated states and specialties. The oversampling ensured adequate samples from each state and each discipline. The weighting yields results representative of the distribution of ARRT regis-trants across the country when reported in total.
To keep the report at a minimal length, verbatim responses to open-ended questions were not included, but can be provided upon request.
Compensation and BenefitsOverall mean full-time compensation for radiologic tech-nologists across the nation was $61,733, depending on discipline, position, workplace, education, years in the profession and other demographic factors.• Meanfull-timecompensationwasreportedhighestin
California ($82,753), Massachusetts ($76,840), Washing-ton, Rhode Island ($75,399), Connecticut ($74,763) and the District of Columbia ($72,450).
• Meanfull-timecompensationwasreportedlowestin Alabama ($49,531), North Dakota ($51,930), West Virginia ($52,380), Arkansas ($52,691) and South Dakota ($52,813).
• Thedisciplinesyieldingthehighestcompensationwereregistered radiologist assistant ($100,004), medical do-simetry ($95,279) and radiation therapy ($79,125).
• Thedisciplinesyieldingthelowestcompensationwereradiography ($53,953), bone densitometry ($56,521) and mammography ($60,263).
• About77%ofrespondentsdonotreceiveemployerfunding for professional association dues, and 68% do not receive funds for conference registration fees.
• Morethanone-half(61.5%)ofrespondentsdonotreceive employer-funded continuing education (CE) courses/materials.
• Meanfull-timecompensationforASRTmemberswas$62,271. This was significantly higher than nonmem-bers, who had a mean full-time compensation of $60,975 (t[6763]=39.16, P=.005).
• Oftherespondents,54.5%reportedthattheyaresatis-fied or very satisfied with their current compensation, but 21.3% indicated that they are dissatisfied or very dissatisfied.
Demographics and the WorkplaceThe average registered radiologic technologist responding to the survey:• Holdsanassociatedegree(44.7%).• Hasbeenpracticingintheprofessionfor17.8years,
14.5 years in the current primary discipline and 9.34 years in the current position.
• Currentlypracticesinastaffposition(63.1%).• Works41.27hoursperworkweekinoneofthree
employment settings: not-for-profit hospital (44.2%), clinic/physician’s office (19.9%) and for-profit hospital (16.6%).
• Receivesatleastpartialemployerfundingoflifeinsur-ance (76.8%), health insurance (87.2%), dental insur-ance (76.8%), retirement/pension programs (86%) and tuition assistance (59.5%).
• IsamemberoftheASRT(60.2%)andhasbeenfor10.38years.
DisciplineRegistered radiologic technologists who responded to this survey spend most of their workday practicing:• Radiography(27.9%).• Radiationtherapy(9.8%).• Mammography(11.1%).• Computedtomography(11.2%).
First percentage cited in parentheses is weighted to ARRT state percentages, but not by discipline.Note: All statistics (except for Ns and percents) are weighted to national ARRT population.

©2010 ASRT. All rights reserved. Radiologic Technologist Wage and Salary Survey 2010
2aDecimal Point = Not Available
Compensation and Demographics at a Glance
Compensation
Overall full-time compensation $61,733
Most recent wage increase 2.8%
Paid for being on call 39.8%
Education
Associate degree or lower 72.1%
Bachelor’s degree or higher 27.9%
Years in Profession
10 years or less 35.4%
11 years or more 64.6%
Position
Staff 63.8%
Senior/Lead 14.2%
Supervisor/Manager 7.1%
Administrator 1.6%
Chief/Assistant Chief 3.6%
Full-time Base Annual Compensation Comparison of 2004, 2007 and 20102004 2007 2010
Discipline N Mean[% increase]a
N Mean[% increase]
N Mean[% increase]
Overall 5552 $52,091.
7622 $58,673[12.6%]
6846 $61,733[5.2%]
Radiography 2423 $46,238.
2206 $52,336[13.2%]
1637 $53,953[3.1%]
Radiation Therapy 425 $66,026.
825 $71,461[8.2%]
660 $79,125[10.7%]
Nuclear Medicine 234 $62,269.
576 $69,083[10.9%]
522 $70,822 [2.5%]
Sonography 279 $54,178.
522 $63,406[17.0%]
510 68,821[8.5%]
Mammography 550 $49,281.
763 $56,605[14.9%]
629 $60,263[6.5%]
Cardiovascular Interventional Technology
336 $55,012.
641 $61,294[11.4%]
609 $64,614[5.4%]
Computed Tomography 568 $52,704.
854 $57,927[9.9%]
792 $60,586[4.6%]
Magnetic Resonance Imaging 490 $56,007.
765 $61,928[10.6%]
679 $65,098[5.1%]
Quality Management 38 $57,467.
73 $64,789[12.7%]
98 $71,251[10.0%]
Medical Dosimetry 78 $76,636.
152 $87,188[13.85%]
118 $95,279[9.3%]

©2010 ASRT. All rights reserved. Radiologic Technologist Wage and Salary Survey 2010
3
The American Society of Radiologic Technologists (ASRT) is the largest radiologic science membership organization in the world. Founded in 1920, the Society has grown to more than 135,000 members. The mission of the organization is to advance the medical imaging and radiation therapy profession and to enhance the quality of patient care. Every three years the ASRT conducts a wage and salary survey of radiologic technology professionals.
The objective of this ongoing study was to measure income, benefits, satisfaction and other demographics of radiologic technologists at the national level. The primary purpose of this year’s wage and salary survey was to monitor changes in compensation for the radiologic technologist over time.
MethodologyThe ASRT developed the research methodology and survey questionnaire, conducted the mailing and performed the data analysis. The American Registry of Radiologic Tech-nologists(ARRT)contributedtotheeffort,providingpostaladdresses for random samples of ARRT registrants from all 50 states and the District of Columbia. Registrants were selected from among eleven primary disciplines/specialties in accordance with the sampling design outlined below.
The survey consisted of a six-page hard-copy questionnaire and a corresponding online version that is reproduced in Appendix A of this report. An invitation to participate in the survey by completing the online questionnaire was sent by e-mail or mail in February 2010 to each of the R.T.s in the random samples drawn by the ARRT. In addition, the ASRT announced availability of the online questionnaire on the Society’s Web site; R.T.s not included in the random sample were invited to participate in the online version of the questionnaire. To ensure representative results, “volun-teer” returns were kept separate from the responses of R.T.s in the random samples and were not combined with them untilanysystematicdifferencesbetweenvolunteerandrandom-sample returns were identified and adjusted.
Because of deliberate oversampling of R.T.s from smaller states and specialties, there were substantial, statistically significantdifferencesbetweenthevolunteerrespondentsand the random-sample R.T.s in the percentage from each state and each discipline. However, there were no statistically significantdifferencesbetweenvolunteerandinvitedpartici-pants from a particular discipline or a particular state in their mean compensation. The application of weights based on the ratio of the known population percentage of R.T.s in each dis-cipline and in each state to the percentage of the combined volunteer-invitee sample was therefore deemed adequate to
provide unbiased estimates of wages, salaries, benefits and satisfaction in the population of ARRT registrants.
Five$100Visagiftcardswereofferedasanincentivetoparticipate in the survey for invited respondents who com-pleted the survey online.
Sample DesignTo ensure an adequate sample of technologists from each state and from each of the 11 most common disciplines, plus a residual category consisting of all other specialties, as specified the following sampling scheme:
Sampling Plan for Wage and Salary Survey 2010
Primary sphere of employment
Active (full-time or part-time) ARRT registrants to be selected for 2010 sample
Radiography Random sample of 120 regis-trants from each of the 50 states.
CTMR MammographySonography (including BS,VS) Interventional (CV,CI,VI)Radiation TherapyNuclear Medicine
For each state, whichever is smaller, all registrants in the state listing that discipline (or, in the case of sonography and inter-ventional, set of specialties) as their primary sphere of employ-ment or a random sample of 60 such registrants.
Bone DensitometryQuality ManagementFusion, Other
For each state, whichever is smaller, all registrants in the state listing that discipline (or, in the case of “Fusion, Other”, set of spe-cialties) as their primary sphere of employment or a random sample of 30 such registrants.
Two Additional Sets of Registrants To Be SelectedAll active registrants who list the District of Columbia as their state.All active registrants who list radiologist assistant as their primary sphere of employment.
Appendix B (Weights) shows the number of questionnaires received from each state and the number received from re-spondents working in the various specialties, together with the resulting weights applied to these states and disciplines so as to adjust results to the target population of all active ARRT registrants.
Introduction

©2010 ASRT. All rights reserved. Radiologic Technologist Wage and Salary Survey 2010
4
ConsiderationsAll results for which population values were not already known are reported both as observed in the sample and in terms of estimated population values. Weights (computed as the ratio between the known population percentage of ARRT-registered R.T.s in each state or discipline and the observed percentage of such R.T.s in the sample) were used to correct for a deliberate over-representation of relatively underpopulated states and specialties. Respondents who did not answer the workplace state question (and whose workplace state could not be inferred from reported ZIP code or the postmark on the reply envelope) were given a state weight of 1 in the weighted calculations. Similarly, re-spondents who did not report a primary discipline (or who reported more than one “primary” discipline) were assigned a discipline weight of 1. Thus, the weighted results reported are the best estimates of the summary statistics that would have been obtained had 9,905 observations been taken at random (without regard to state or discipline) from the entire database of active ARRT registrants.
The use of random sampling within each state/discipline combination, together with the fairly high number of re-spondents,makesitunlikelythatsystematicdifferencesinresponse rates as a function of other variables (e.g., type of workplace or full-time status), skewed the results. However, the membership of the ASRT at the time the sample was drawn represented approximately one-half of the ARRT registrant database. About 60% of the survey respondents were members of the ASRT.
This research project follows the 2007, 2004, 2001, 1997 and 1992 Wage and Salary Surveys conducted by the ASRT. Much of the material and structure for the 2010 survey were based on the format of the earlier surveys. Ideally, periodic longitudinal measurement of these variables would provide optimal responsiveness to changes in the profession. Practi-cal considerations make it unlikely that a project of this size can be carried out more often than at three-year intervals, but the data on percentage increase in compensation at the most recent raise can be used to estimate likely wages and salaries between surveys.
Primary Dependent Variable: Annualized CompensationPrevious ASRT Wage and Salary Surveys have reported separately wages paid to R.T.s by the hour and salaries paid to R.T.s on an annual basis. However, nearly one-half of respondents reported both a base annual salary and a base hourly wage. This, along with a desire to maximize the number of respondents for whom a meaningful base annual compensation figure could be computed, led to adoption of a single compensation measure of yearly salary for this year’s report. This was computed as follows:
Base compensation = base annual salary or 2080* (Base hourly wage)To determine hourly wage, Annual compensation/2080 (or number of hours worked per year)
Respondents who reported both a base annual salary and a base hourly wage but for whom the two reports disagreed by $1 per hour or more were assigned a missing value on thisdependentvariable.Wherethetworeportsdifferedbyless than $1 per hour, base compensation was computed as the simple mean of base annual salary and 2080*(base hourly wage).
Data ReliabilityA number of steps were taken to ensure the reliability and validity of the responses as recorded. Hard-copy returns were recorded by applying an optical character recognition (OCR) program to scanned copies of the returns. The scan-ning/OCR procedure included on-screen verification or cor-rection of responses deemed by the OCR routine to be am-biguous. Cases with missing data on crucial independent and dependent variables were checked against the hard-copy questionnaires, and responses that had been missed by the OCR method were entered into the data file by hand. Possible outliers (responses to quantitative questions such as hours worked or annual salary that were extremely small, extremely large or logically impossible) also were compared to the hard-copy questionnaire and corrected.
Following the above steps, both hard-copy and online responses were examined for logically impossible or implausible values of individual variables and for internally inconsistent responses to sets of variables. Such implausible values were assigned a special code and omitted from com-putation of descriptive statistics. In particular, the following implausibility criteria were used:
Number of years in the profession (radiologic sciences), in primary discipline and in current position: Implausible if years in primary discipline greater than years in the radiolog-ic sciences or years in current position more than five years greater than years in the profession (allowing for having held current position while in primary education program) or if response implies respondent entered the profession, the discipline or the current position before age 15.
Base hourly wage: Implausible if < $10/hour or > $100/hour.
Base annual salary: Implausibleif<$24,000;orastafftech-nologist>$200,000;orstaff,senior,lead,assistantchieforchief technologist > $300,000.
State: Indeterminate if reported workplace state and the

©2010 ASRT. All rights reserved. Radiologic Technologist Wage and Salary Survey 2010
5
stateimpliedbyworkplaceZIPcodedifferedandreferredto adjacent states. If they referred to nonadjacent states, state implied by ZIP code took precedence unless the re-ported ZIP code could have resulted from a simple, single-digit typographical error in entering a ZIP code within the reported state.
Years an ASRT member: Implausible if years as member exceed number of years the organization has existed or exceed years in the profession by more than five years.
Approximate age (2009.15 – year of birth): Implausible if < 16 or > 100.
Amount extra per hour paid for being on call: The wide variability in the responses to this question made it difficult to compute meaningful statistics.
Margin of ErrorA total of 9,068 surveys were returned. This sample size yields a margin of error for overall percentages (width of the 95% confidence interval for the population percentage) of a maximum ±1.0%. The overall standard deviation of base annual compensation for the 6,806 full-time respondents is $18,601, so the estimate of the mean base annual com-pensation for these respondents has a 95% chance of being within $225 of the actual population mean for all ARRT-certified R.T.s.
For percentages computed on subsets of respondents, the margin of error increases as the square root of the size of the subset. Thus, the margin of error for percentages based on a subset of 2,100 respondents would be ±2.2% or less. For a subset of 30 respondents it would be ±18.3% or less. Finally, percentages based on a subgroup of only 10 R.T.s could have a margin of error as large as ±32%. Neverthe-less, rather than ignoring results for smaller subgroups, the results are presented as respondents reported, yet figures may not be representative of the larger population.
Margin of error for compensation also increases as the squarerootofsamplesizedecreases,althoughthisisoffsetsomewhat by the tendency for the standard deviation to be smaller for subsets of R.T.s defined by their scores on relevantpredictors.Ignoringthateffect,themarginoferrorfor the mean annual compensation of a subset of 30 R.T.s could be as large as ±$3,396.
The ReportThis report summarizes the results for each question in the survey except the rate at which a person is paid for being on call due to the wide variability in the responses to this question for meaningful statistics to be computed. As in the 2004 and 2007 reports, compensation information is compared by discipline. These groups are further divided by job position, workplace, education, years in the profes-sion and state.

©2010 ASRT. All rights reserved. Radiologic Technologist Wage and Salary Survey 2010
6
Note: All statistics (except for Ns and percents) are weighted to national ARRT population.
Annual Compensation = reported base annual salary or 2080*(reported base hourly wage)To determine hourly wage, annual compensation/2080 (or number of hours worked per year)
Compensation of Full-time vs. Part-time R.T.s
Compensation Part-time (Less than 32 hours/week)
Full-time (32 or more hours/week)
Total
$40,000 or less 11.6% 8.1% 8.6%
$40,001 to $45,000 8.2% 8.5% 8.5%
$45,001 to $50,000 13.8% 12.6% 12.8%
$50,001 to $55,000 13.8% 11.3% 11.7%
$55,001 to $60,000 12.9% 12.0% 12.1%
$60,001 to $65,000 12.8% 12.1% 12.2%
$65,001 to $70,000 8.8% 8.6% 8.6%
$70,001 or more 18.2% 26.8% 25.5%
N 1,202 6,846 8,048
Mean $57,925 $61,733 $61,151
Median $56,151 $58,498 $58,249
Compensation by Full-time vs. Part-time
Annual Compensation
30.0%
25.0%
20.0%
15.0%
10.0%
5.0%
0.0%$40,000or less
$40,001to
$45,000
$45,001to
$50,000
$50,001to
$55,000
$55,001to
$60,000
$60,001to
$65,000
$65,001to
$70,000
$70,001or more
Part-time
Full-time

7
©2010 ASRT. All rights reserved. Radiologic Technologist Wage and Salary Survey 2010
Full-time Compensation by Overall, Position and Workplace for each Disciplinea
R T N M CV CT MR QM S MD RRA/RPA BD Overall
Overall
N 1637 660 522 629 609 792 679 98 510 118 50 59 6,363
Mean $53,953 $79,125 $70,822 $60,263 $64,614 $60,586 $65,099 $71,251 $68,821 $95,279 $100,004 $56,521 $61,190
Median $50,149 $76,376 $68,741 $58,428 $62,691 $58,854 $62,884 $68,330 $66,593 $98,092 $99,843 $55,735 $58,265
Mean by Position
Stafftechnologist/therapist
$49,633 $70,679 $67,698 $57,363 $60,655 $57,239 $61,663 $61,755 $66,247 $85,590 $104,000 $56,194 $56,405
Senior/lead technologist/ therapist
$54,197 $84,011 $73,339 $62,462 $70,944 $66,056 $69,055 $64,727 $72,010 $83,172 $76,906 $49,843 $65,573
Assistant chief technologist/ therapist
$55,954 $88,459 $72,436 $54,237 $65,197 $74,070 $44,720 $97,799 $73,316 $79,040 $92,500 . $64,824
Chief technologist/ therapist
$60,270 $92,980 $73,831 $62,317 $67,858 $69,133 $65,595 $69,224 $76,445 $96,571 $104,268 $54,324 $71,064
Supervisor/manager $64,673 $98,182 $80,330 $71,023 $76,221 $70,922 $75,234 $75,247 $79,640 $96,222 $92,843 $73,114 $73,423
Administrator $85,227 $115,191 $86,206 $71,031 $93,225 $88,204 $83,643 $84,302 . $111,280 . $77,000 $93,355
Instructor/faculty $60,044 $69,440 $77,727 $35,776 $66,441 $57,385 $70,556 $85,000 $64,888 $62,400 . . $60,936
Program director $80,863 $82,407 $100,945 $89,574 $63,861 $104,947 $66,912 $68,138 $72,075 . . . $80,577
Corporate representative $113,820 $120,334 $62,288 $73,900 $77,000 $105,000 $102,268 $61,755 $80,000 $136,586 . $76,000 $105,872
Other Position $66,804 $88,412 $67,698 $66,680 $66,421 $81,953 $46,134 $64,727 $85,020 $102,669 $100,760 $47,985 $82,557
Mean by Workplace
Education $69,267 $76,937 $68,453 $48,170 $62,121 $58,289 $66,797 $72,800 $70,530 $75,807 . $37,000 $68,562
Clinic or physician’s office
$46,498 $75,591 $70,356 $57,438 $59,863 $56,769 $62,452 $58,782 $69,562 $86,885 $96,578 $52,910 $55,299
Hospital (not for profit) $57,115 $82,785 $71,812 $60,406 $65,558 $61,345 $65,689 $71,761 $70,596 $98,437 $98,289 $56,191 $64,409
Hospital (for profit) $52,057 $74,946 $66,483 $62,908 $63,149 $58,933 $62,120 $70,655 $62,226 $92,463 $100,771 $66,323 $59,315
Mobile unit $45,297 $66,560 $67,308 $52,989 $69,347 $58,032 $61,763 . $89,392 . . $51,998 $53,205
Imaging center/outpatient imaging facility
$53,321 $82,840 $74,290 $60,633 $65,827 $60,205 $65,550 $74,519 $67,243 . $105,923 $55,940 $62,354
Government/VA hospital $57,627 $65,623 $68,131 $58,959 $56,942 $64,395 $60,390 $60,825 $56,533 $109,792 . $80,000 $62,154
Locum tenens (temporary staff)
$53,811 $91,329 $66,727 $73,271 $66,560 . $47,840 . $63,169 $116,069 $105,000 . $72,459
Industrial $65,108 $134,000 $99,433 . . . . $83,000 $91,525 $143,000 . . $110,200
Corporate $104,826 $103,149 . $73,900 $71,521 $95,468 $100,313 $85,000 $84,433 $104,000 . $65,872 $95,547
Other Workplace . . . $72,093 $47,840 . . . $53,000 . . $49,608 $57,501aR=radiography; T=radiation therapy; N=nuclear medicine; M=mammography; CV=cardiovascular/interventional; CT=computed tomography; MR=magnetic resonance; QM=quality management; S=sonography; MD=medical dosimetry; RRA=registered radiologist assistant; RPA=radiology practitioner assistant; BD=bone densitometrist. Decimal point=not available.
Note: All statistics (except for Ns and percents) are weighted to national ARRT population.

©2010 ASRT. All rights reserved. Radiologic Technologist Wage and Salary Survey 2010
8
Full-time Compensation by Overall, Education and Years in Profession for Each Disciplinea
R T N M CV CT MR QM S MD RRA/RPA BD Overall
Overall
N 1637 660 522 629 609 792 679 98 510 118 50 59 6,363
Mean $53,953 $79,125 $70,822 $60,263 $64,614 $60,586 $65,099 $71,251 $68,821 $95,279 $100,004 $56,521 $61,190
Median $50,149 $76,376 $68,741 $58,428 $62,691 $58,854 $62,884 $68,330 $66,593 $98,092 $99,843 $55,735 $58,265
Mean by Education
High school + certificate(s) $54,173 $81,789 $72,096 $58,881 $64,798 $59,509 $65,551 $64,062 $70,523 $87,391 $99,000 $54,701 $60,915
Associate degree $50,800 $77,331 $70,850 $60,205 $64,053 $60,679 $65,485 $71,506 $67,732 $94,616 $108,900 $54,280 $58,836
Bachelor’s degree $55,063 $77,419 $69,980 $62,898 $64,117 $61,245 $63,573 $69,818 $69,106 $98,003 $98,168 $61,893 $65,625
Master's degree $76,803 $92,480 $73,708 $58,312 $69,435 $60,659 $72,519 $82,862 $69,069 $90,695 $99,682 $103,376 $77,631
Doctoral degree $79,833 . . . . $69,202 . $75,000 . . . . $78,006
Other education $55,813 $76,081 $64,935 $90,215 $85,048 $66,116 $64,965 . $64,637 $78,000 $100,004 . $65,211
Instructor/faculty $60,044 $69,440 $77,727 $35,776 $66,441 $57,385 $70,556 $85,000 $64,888 $62,400 . . $60,936
Program director $80,863 $82,407 $100,945 $89,574 $63,861 $104,947 $66,912 $68,138 $72,075 . . . $80,577
Corporate representative $113,820 $120,334 $62,288 $73,900 $77,000 $105,000 $102,268 $61,755 $80,000 $136,586 . $76,000 $105,872
Other Position $66,804 $88,412 $67,698 $66,680 $66,421 $81,953 $46,134 $64,727 $85,020 $102,669 $100,760 $47,985 $82,557
Mean by Years in Profession
0 to 2 years $44,439 $57,427 $59,441 $42,458 $52,995 $46,156 $50,350 . $55,921 $54,528 $70,000 $46,000 $46,424
3 to 5 years $44,940 $65,947 $61,425 $54,335 $52,156 $51,438 $52,587 $57,785 $56,566 $64,821 $101,585 $35,673 $49,699
6 to 10 years $51,169 $70,813 $66,961 $55,285 $58,323 $55,920 $58,758 $59,443 $61,847 $90,476 $86,165 $34,877 $57,062
11 to 15 years $54,750 $83,970 $73,070 $59,112 $67,871 $63,997 $66,385 $64,683 $67,289 $87,171 $102,960 $62,815 $63,716
16 to 20 years $59,396 $92,092 $71,938 $59,595 $67,620 $64,848 $64,680 $78,488 $68,517 $98,195 $104,545 $52,597 $66,674
21 to 30 years $60,598 $85,255 $75,245 $63,941 $70,889 $66,809 $72,202 $73,410 $72,447 $101,976 $120,104 $63,452 $68,806
> 30 years $64,201 $88,244 $73,770 $61,741 $69,991 $63,824 $73,589 $72,059 $76,456 $101,559 $96,457 $61,666 $69,238
Locum tenens (temporary staff)
$53,811 $91,329 $66,727 $73,271 $66,560 . $47,840 . $63,169 $116,069 $105,000 . $72,459
Industrial $65,108 $134,000 $99,433 . . . . $83,000 $91,525 $143,000 . . $110,200
Corporate $104,826 $103,149 . $73,900 $71,521 $95,468 $100,313 $85,000 $84,433 $104,000 . $65,872 $95,547
Other Workplace . . . $72,093 $47,840 . . . $53,000 . . $49,608 $57,501
aR=radiography; T=radiation therapy; N=nuclear medicine; M=mammography; CV=cardiovascular/interventional; CT=computed tomography; MR=magnetic resonance; QM=quality management; S=sonography; MD=medical dosimetry; RRA=registered radiologist assistant; RPA=radiology practitioner assistant; BD=bone densitometrist. Decimal point=not available.
Note: All statistics (except for Ns and percents) are weighted to national ARRT population.

9
©2010 ASRT. All rights reserved. Radiologic Technologist Wage and Salary Survey 2010
Full-time Compensation by Overall and State for Each Disciplinea
R T N M CV CT MR QM S MD RRA/RPA BD Overall
Overall
N 1637 660 522 629 609 792 679 98 510 118 50 59 6,363
Mean $53,953 $79,125 $70,822 $60,263 $64,614 $60,586 $65,099 $71,251 $68,821 $95,279 $100,004 $56,521 $61,190
Median $50,149 $76,376 $68,741 $58,428 $62,691 $58,854 $62,884 $68,330 $66,593 $98,092 $99,843 $55,735 $58,265
Mean by State
AK $60,220 $77,480 $76,710 $76,413 $64,802 $69,632 $83,654 $72,800 $78,464 $114,000 . $60,237 $69,558
AL $42,312 $67,255 $60,037 $52,078 $54,561 $51,009 $54,723 $54,101 $49,254 $105,269 . . $49,531
AR $45,443 $77,271 $63,424 $45,445 $52,587 $54,044 $55,344 $42,598 $59,816 $67,933 . . $52,691
AZ $57,404 $89,261 $73,499 $68,382 $67,974 $65,634 $76,154 $75,773 $77,430 . . $63,918 $66,740
CA $75,363 $102,825 $88,766 $77,110 $85,106 $79,452 $98,260 $103,689 $85,516 $121,295 $116,413 $78,541 $82,753
CO $49,190 $87,286 $70,403 $60,363 $63,235 $60,562 $70,933 . $69,148 $107,640 $102,250 $94,016 $60,976
CT $65,070 $90,902 $86,415 $73,335 $80,110 $68,058 $89,328 $77,911 $80,656 . . . $74,763
DC $61,342 $77,847 . $80,326 $81,520 $91,520 $80,954 . $92,414 $106,829 . . $72,450
DE $59,076 $103,785 $69,227 $62,405 $64,563 $68,508 $64,913 $99,486 $79,258 $94,848 $81,952 . $64,069
FL $54,787 $72,698 $66,464 $55,194 $60,481 $56,891 $61,662 $76,411 $75,535 $99,239 $98,600 $36,400 $59,743
GA $52,876 $67,650 $61,314 $61,343 $56,096 $60,060 $60,264 $63,134 $62,451 $92,010 $98,800 $66,102 $58,433
HI $62,453 $84,307 $80,049 $64,941 $77,530 $70,233 $78,419 $51,834 $83,658 . . . $71,646
IA $45,665 $62,579 $68,818 $54,198 $55,798 $52,351 $54,618 $51,000 $62,195 $79,221 $82,300 $58,698 $54,650
ID $49,491 $69,910 $70,064 $57,212 $67,085 $60,080 $60,791 . $64,321 $148,700 . . $59,717
IL $52,316 $84,032 $67,483 $57,708 $60,928 $60,737 $72,999 $60,995 $68,236 $78,000 . $39,000 $60,607
IN $49,350 $78,291 $65,927 $55,385 $57,810 $61,275 $64,021 $78,667 $65,802 $95,000 $96,000 . $56,497
KS $52,015 $64,700 $70,130 $54,689 $59,658 $56,484 $57,626 $71,200 $71,722 $100,308 $117,000 $47,840 $59,453
KY $49,574 $73,871 $55,164 $63,227 $56,900 $46,888 $55,219 $63,807 $50,951 $98,322 $95,000 $31,949 $53,797
LA $51,193 $67,783 $61,318 $52,512 $50,801 $56,181 $60,320 $55,661 $61,688 $86,994 . $45,552 $55,249
MA $71,501 $86,654 $77,472 $76,275 $78,702 $76,413 $81,221 $105,257 $88,177 $40,560 $119,960 $63,075 $76,840
MD $57,291 $77,366 $76,814 $63,645 $67,470 $64,832 $72,850 $66,622 $80,702 . . . $65,231
ME $55,959 $72,230 $75,190 $58,995 $66,035 $54,139 $59,871 . $71,383 $64,480 . $60,840 $62,170
MI $51,829 $66,604 $68,321 $56,842 $60,207 $58,416 $58,607 $68,440 $62,297 $92,924 $97,000 $37,440 $56,906
MN $57,224 $68,978 $75,767 $58,854 $65,746 $61,392 $64,581 $73,212 $70,918 $101,920 . $47,590 $62,794
MO $47,432 $69,841 $75,164 $55,186 $56,546 $53,843 $57,265 . $64,618 $81,120 $96,300 $37,000 $56,502
MS $45,301 $68,851 $66,251 $63,232 $55,983 $58,705 $55,422 $44,200 $59,473 $101,959 $110,000 . $55,500
aR=radiography; T=radiation therapy; N=nuclear medicine; M=mammography; CV=cardiovascular/interventional; CT=computed tomography; MR=magnetic resonance; QM=quality management; S=sonography; MD=medical dosimetry; RRA=registered radiologist assistant; RPA=radiology practitioner assistant; BD=bone densitometrist. Decimal point=not available.
Note: All statistics (except for Ns and percents) are weighted to national ARRT population.

10
©2010 ASRT. All rights reserved. Radiologic Technologist Wage and Salary Survey 2010
Full-time Compensation by Overall and State for Each Disciplinea (Continued)R T N M CV CT MR QM S MD RRA/RPA BD Overall
Overall
N 1637 660 522 629 609 792 679 98 510 118 50 59 6,363
Mean $53,953 $79,125 $70,822 $60,263 $64,614 $60,586 $65,099 $71,251 $68,821 $95,279 $100,004 $56,521 $61,190
Median $50,149 $76,376 $68,741 $58,428 $62,691 $58,854 $62,884 $68,330 $66,593 $98,092 $99,843 $55,735 $58,265
Mean by State (Continued)
MT $47,338 $75,494 $64,804 $54,575 $61,040 $55,135 $58,717 . $65,695 $97,032 $85,000 . $55,146
NC $46,778 $72,299 $65,281 $58,928 $61,725 $61,304 $60,790 $67,877 $62,855 $118,300 $86,667 $45,483 $55,425
ND $43,660 $63,015 $63,204 $49,654 $55,101 $52,566 $56,651 $52,888 $62,398 $80,142 . . $51,930
NE $48,928 $69,324 $63,768 $54,019 $50,938 $53,943 $53,812 $83,000 $61,850 $84,982 . $47,476 $55,667
NH $52,553 $79,924 $79,023 $65,734 $68,099 $64,834 $70,432 $74,082 . $106,205 . . $64,213
NJ $62,918 $92,274 $87,676 $66,438 $73,531 $72,818 $77,020 $66,560 $79,487 $58,240 . $61,360 $71,216
NM $52,871 $83,166 $69,359 $60,556 $72,503 $59,821 $66,967 . $64,461 $134,160 . $54,912 $63,032
NV $59,139 $83,006 $72,119 $69,206 $84,335 $78,074 $75,795 . $75,777 $102,169 $95,000 . $71,044
NY $54,846 $91,221 $73,214 $64,505 $63,584 $62,004 $68,433 $83,848 $65,891 $106,347 $90,000 $77,688 $62,780
OH $49,290 $68,242 $68,281 $53,040 $60,127 $56,710 $56,147 $60,403 $59,168 $92,033 $90,000 $38,688 $55,676
OK $46,531 $70,311 $66,609 $51,685 $60,092 $50,734 $59,847 $63,960 $74,110 $108,667 . $63,960 $55,504
OR $57,265 $89,918 $77,434 $73,469 $73,974 $73,149 $70,510 $103,400 $78,700 $118,310 $60,320 $68,952 $68,575
PA $48,301 $80,350 $66,613 $54,065 $60,338 $57,038 $54,546 $56,962 $72,757 $90,880 $150,000 $50,081 $55,731
RI $68,631 $90,184 $86,881 $73,792 $60,294 $77,609 $82,454 $91,655 $74,448 . . . $75,399
SC $45,720 $73,202 $65,272 $55,438 $63,645 $63,140 $58,862 $75,000 $68,317 $97,822 . $51,168 $56,809
SD $43,340 $66,347 $77,637 $47,166 $61,240 $47,954 $54,806 . $63,896 $91,937 . . $52,813
TN $46,684 $62,352 $65,062 $52,945 $52,072 $52,854 $58,454 $57,231 $56,491 $97,891 $103,168 . $53,182
TX $55,457 $81,706 $64,404 $55,919 $64,696 $56,364 $66,228 $65,241 $62,460 $74,066 $98,500 $72,000 $60,530
UT $49,753 $80,981 $67,223 $60,672 $74,703 $63,335 $64,660 $81,120 $68,325 $79,040 $75,000 $48,901 $61,235
VA $53,870 $75,369 $68,973 $60,457 $62,982 $60,107 $67,907 . $65,094 . . . $60,023
VT $53,055 $70,394 $74,148 $62,162 $65,918 $72,684 $64,253 $63,939 $76,692 $82,026 $70,000 $45,604 $59,183
WA $57,240 $80,673 $84,576 $89,971 $73,399 $72,060 $72,835 $89,380 $74,035 $116,296 $98,000 $52,541 $70,033
WI $49,805 $74,648 $69,623 $56,799 $66,390 $62,066 $66,245 $71,427 $76,710 $93,413 $53,040 $58,566 $58,704
WV $48,252 $56,280 $52,226 $53,724 $44,842 $52,522 $57,709 $55,931 $58,996 . . . $52,380
WY $52,820 $84,124 $66,947 $58,031 $60,178 $56,690 $64,694 . $71,455 $99,008 $112,528 $45,240 $58,643aR=radiography; T=radiation therapy; N=nuclear medicine; M=mammography; CV=cardiovascular/interventional; CT=computed tomography; MR=magnetic resonance; QM=quality management; S=sonography; MD=medical dosimetry; RRA=registered radiologist assistant; RPA=radiology practitioner assistant; BD=bone densitometrist. Decimal point=not available.
Note: All statistics (except for Ns and percents) are weighted to national ARRT population.

©2010 ASRT. All rights reserved. Radiologic Technologist Wage and Salary Survey 2010
11
Note: All statistics (except for Ns and percents) are weighted to national ARRT population.
Please rate your level of satisfaction with your current salary or wages.
Frequency Percent Valid Percent Est. Population Percent
Very satisfied 1256 13.9 14.6 13.5
Satisfied 3651 40.3 42.4 41.0
Neutral 2038 22.5 23.7 24.2
Dissatisfied 1341 14.8 15.6 16.7
Very dissatisfied 322 3.6 3.7 4.6
Missing 460 5.1
Total 9068 100.0 100.0 100.0
Satisfaction with Compensation (-2=Very Dissatisfied…2=Very satisfied) Mean =0.42 Standard Deviation=1.06
Level of satisfaction with current wages.
Did you receive a raise in your salary/wages in the past 12 months?
Frequency Percent Valid Percent Est. Population Percent
Yes 5311 58.6 62.6 60.7
No 3170 35.0 37.4 39.3
Don't recall 91 1.0
Missing 496 5.5
Total 9068 100.0 100.0 100.0
22. Mean =2.80% Raise Standard deviation=1.58%
Are you paid for being on call?
Frequency Percent Valid Percent Est. Population Percent
Yes 3718 41.0 45.0 39.3
No 4547 50.1 55.0 60.1
Missing 803 8.9
Total 9068 100.0 100.0 100.0
45.0%40.0%35.0% 30.0%25.0%20.0%15.0%10.0%
5.0%0.0%
Very satisfied Satisfied Very satisfied Dissatisfied Very dissatisfied
14.6%
23.7%
15.6%
3.7%
42.4%

©2010 ASRT. All rights reserved. Radiologic Technologist Wage and Salary Survey 2010
12
Are you represented by a collective bargaining agent or union?
Frequency Percent Valid Percent Est. Population Percent
Yes 616 6.8 7.2 8.0
No 7889 87.0 92.8 92.0
Missing 563 6.2
Total 9068 100.0 100.0 100.0
Benefits
N
Valid Percent [Est. Population Percent]
Employer Provides No Funding
Employer Provides Fixed % or Dollar
Amount
Employer Provides 100%
Life Insurance 7478 23.2% [25.9%] 54.0% [50.9%] 22.8% [23.2%]
Health Insurance 7931 12.8% [14.8%] 75.9% [72.7%] 11.3% [12.5%]
Dental Insurance 7858 23.2% [26.3%] 67.7% [64.4%] 9.1% [9.3%]
Liability Insurance 5929 40.5% [41.7%] 35.9% [35.1%] 23.6% [23.2%]
Retirement/Pension Program 7892 14.0% [16.7%] 78.9% [76.1%] 7.1% [7.2%]
Disability Protection 6707 34.2% [35.8%] 54.2% [52.7%] 11.5% [11.5%]
Professional Development
N
Valid Percent [Est. Population Percent]
Employer Provides No Funding
Employer Provides Fixed % or Dollar
Amount
Employer Provides 100%
Registration Fees 7862 68.4% [71.2%] 13.7% [12.2%] 17.9% [16.6%]
Travel Expenses 7534 53.4% [57.5%] 25.2% [23.5%] 21.4% [19.0%]
Tuition Assistance 7404 40.5% [42.7%] 50.3% [48.4%] 9.2% [8.9%]
Professional Association Dues 7945 77.5% [78.8%] 9.0% [8.5%] 13.6% [12.7%]
CE Courses/Materials 7856 61.5% [63.7%] 22.9% [21.2%] 15.5% [15.1%]
Note: All statistics (except for Ns and percents) are weighted to national ARRT population.

©2010 ASRT. All rights reserved. Radiologic Technologist Wage and Salary Survey 2010
13
Age
Frequency Percent Valid Percent Est. Population Percent True ARRT Population Percent
18 to 30 years 1205 13.3 16.3 16.7 18.8
31 to 35 years 739 8.1 10.0 10.0 12.1
36 to 40 years 902 9.9 12.2 12.4 13.8
41 to 45 years 928 10.2 12.6 12.3 13.2
46 to 50 years 1093 12.1 14.8 14.6 13.6
51 to 55 years 1065 11.7 14.4 14.2 12.6
56 years or older 1462 16.1 19.8 19.7 16.0
Missing 1674 18.5
Total 9068 100.0 100.0 100.0 100.0
Respondent Age Mean = 43.84 Years Standard Deviation=11.30
Age
Gender
Frequency Percent Valid Percent Est. Population Percent True ARRT Population Percent
Male 2030 22.4 23.0 23.5 27.4
Female 6802 75.0 77.0 76.5 72.6
Missing 236 2.6
Total 9068 100.0 100.0 100.0 100.0
Demographics
Note: All statistics (except for Ns and percents) are weighted to national ARRT population.
25.0%
20.0%
15.0%
10.0%
5.0%
0.0%18 to 30
years31 to 35
years36 to 40
years41 to 45
years46 to 50
years51 to 55
years56 years or older
16.3%
12.2% 12.6%14.8% 14.4%
19.8%
10%

©2010 ASRT. All rights reserved. Radiologic Technologist Wage and Salary Survey 2010
14
Highest level of education completed
Frequency Percent Valid Percent True ARRT Population Percent
Certificate(s) 2181 24.1 24.4 27.5
Associate degree 3990 44.0 44.7 49.9
Bachelor’s degree 2286 25.2 25.6 18.8
Master’s degree 367 4.0 4.1 2.8
Doctoral degree 21 0.2 0.2 0.2
Other 90 1.0 1.0 0.9
Missing 133 1.5
Total 9068 100.0 100.0 100.0
Highest level of education completed
Note: All statistics (except for Ns and percents) are weighted to national ARRT population.
50.0% 40.0%30.0%20.0%10.0%
0.0%
Cert
ifica
tes
Ass
ocia
te d
egre
e
Bach
elor
’s de
gree
Mas
ter’s
deg
ree
Doc
toria
l deg
ree
Oth
er
24.4% 25.6%
4.1%0.2% 1%
44.7%

©2010 ASRT. All rights reserved. Radiologic Technologist Wage and Salary Survey 2010
15
Note: All statistics (except for Ns and percents) are weighted to national ARRT population.
Are you presently employed in the radiologic sciences?
N Percent Valid Percent Est. Population Percent
Yes 8611 95.0 95.0 93.4
No 451 5.0 5.0 6.6
Missing 6 0.1
Total 9068 100.0 100.0 100.0
If not, please select the response that best describes your employment status.
N Percent Valid Percent Est. Population Percent
Looking for employment in the radiologic sciences
131 1.4 28.6 35.2
Working in a differentfield
121 1.3 26.4 20.3
Seeking more education
49 0.5 10.7 16.5
Retired 48 0.5 10.5 12.9
Fulfilling family needs
25 0.3 5.5 10.5
Other 84 0.9 18.3 4.6
Missing 8610 94.9
Total 9068 100.0 100.0 100.0
Reason for not working in the radiologic sciences.
Employment Status
35.0% 30.0%25.0%20.0%15.0%10.0%
5.0%0.0%
Looking for employment
in the radiologic sciences.
Working in adifferent
field.
Seeking more
education.
Retired. Fulfilling family needs
Other
28.6%
10.7% 10.5%5.5%
18.3%
26.4%

©2010 ASRT. All rights reserved. Radiologic Technologist Wage and Salary Survey 2010
16
Note: All statistics (except for Ns and percents) are weighted to national ARRT population.
Approximately how many hours do you work in an average week?
N Percent Valid Percent Est. Population Percent
Mean [St. Deviation]
Median
Part-time (Less than 32 hours/week)
1227 13.5 14.5 14.8 21.01[7.26]
23.10
Full-time (More than 32 hours/week)
7210 79.5 85.5 85.2 41.27[7.33]
40.00
Missing 631 7.0
Total 9068 100.0 100.0 100.0
Part-time Categorized
Full-time Categorized
Employment Setting
42.9%
70.0%
60.0%
50.0%
40.0%
30.0%
20.0%
10.0%
0.0%32 to 39 hours 40 hours 41 to 48 hours 49 hours or more
20.0%
11.8%
59.2%
9.0%
45.0%
40.0%
35.0%
30.0%
25.0%
20.0%
15.0%
10.0%
5.0%
0.0%8 hours or less 9 to 16 hours 17 to 24 hours 25 to 31 hours
9.9%
17.0%
30.2%
42.9%

©2010 ASRT. All rights reserved. Radiologic Technologist Wage and Salary Survey 2010
17
In which employment setting do/did you practice most of the time?
N Percent Valid Percent Est. Population Percent
Hospital (not for profit) 3984 43.9 44.2 40.1
Clinic or physician’s office 1791 19.8 19.9 21.5
Hospital (for profit) 1499 16.5 16.6 16.9
Imaging center/outpatient imaging facility 980 10.8 10.9 11.4
Education 275 3.0 3.1 4.7
Government/V.A. hospital 192 2.1 2.1 2.0
Mobile unit 129 1.4 1.4 1.5
Corporate 80 0.9 0.9 1.1
Locumtenens(temporarystaff) 44 0.5 0.5 0.5
Industrial 15 0.2 0.2 0.2
Other 15 0.2 0.2 0.2
Missing 64 0.7
Total 9068 100.0 100.0 100.0
Respondents by employment setting
Note: All statistics (except for Ns and percents) are weighted to national ARRT population.
50.0% 45.0%40.0%35.0%30.0%25.0%20.0%15.0%10.0%
5.0%0.0%
Hos
pita
l (no
t for
pro
fit)
Clin
ic o
r phy
sici
an’s
office
Hos
pita
l (fo
r pro
fit)
Imag
ing
cent
er/o
utpa
tient
imag
ing
faci
lity
Educ
atio
n
Gov
ernm
ent/
V.A
. hos
pita
l
Mob
ile u
nit
Corp
orat
e
Locu
m te
nens
Indu
stria
l
Oth
er
44.2%
16.6%10.9%
3.1% 2.1% 1.4% 0.9% 0.5% 0.2% 0.2%
19.9%

©2010 ASRT. All rights reserved. Radiologic Technologist Wage and Salary Survey 2010
18
If your primary practice is/was in a hospital, what is/was the size (in no. of beds) of the hospital?
N Percent Valid Percent Est. Population Percent
Fewer than 50 beds 684 7.5 11.5 9.6
50-99 beds 548 6.0 9.2 8.5
100-199 beds 1034 11.4 17.4 16.7
200-299 beds 1207 13.3 20.3 20.9
300-399 beds 877 9.7 14.7 15.0
400-499 beds 550 6.1 9.2 9.7
500 or more beds 1052 11.6 17.7 19.5
Not applicable 1982 21.9
Missing 1134 12.5
Total 9068 100.0 100.0 100.0
Mean [St. Deviation] 282.09 [157.50]
Hospital by number of beds
Are you responsible for any image postprocessing in your position?
N Percent Valid Percent Est. Population Percent
Yes 5521 60.9 61.8 62.1
No 3410 37.6 38.2 37.9
Missing 137 1.5
Total 9068 100.0 100.0 100.0
Note: All statistics (except for Ns and percents) are weighted to national ARRT population.
25.0%
20.0%
15.0%
10.0%
5.0%
0.0%Fewer than
50 beds50-99 beds
100-199 beds
200-299 beds
300-399 beds
400-499 beds
500 or more beds
11.5%9.2%
17.4%
20.3%
14.7%
9.2%
17.7%

©2010 ASRT. All rights reserved. Radiologic Technologist Wage and Salary Survey 2010
19
Note: All statistics (except for Ns and percents) are weighted to national ARRT population.
How long have/had you practiced in the radiologic sciences?
N Percent Valid Percent Est. Population Percent
5 years or less 1675 18.5 18.9 21.6
6 to 10 years 1217 13.4 13.7 13.8
11 to 15 years 1177 13.0 13.3 12.8
16 to 20 years 1197 13.2 13.5 12.7
21 to 25 957 10.6 10.8 10.1
26 to 30 years 1034 11.4 11.7 10.1
More than 30 years 1613 17.8 18.2 17.8
Missing 198 2.2
Total 9068 100.0 100.0 100.0
Mean [St. Deviation] 17.80 [12.13]
Years practiced in the radiologic sciences
20.0%18.0%16.0% 14.0%12.0%10.0%
8.0%6.0%4.0%2.0%0.0%
5 years or less
6 to 10 years
11 to 15years
16 to 20years
21 to 25 years
26 to 30 years
More than30 years
18.9%
13.7% 13.3% 13.5%
10.8% 11.7%
18.2%

©2010 ASRT. All rights reserved. Radiologic Technologist Wage and Salary Survey 2010
20
Note: All statistics (except for Ns and percents) are weighted to national ARRT population.
Please indicate in which discipline you practice(d) most of the time.
N Percent Valid Percent Est. Population Percent
Radiography 2335 25.7 27.9 46.2
Computed Tomography 937 10.3 11.2 11.8
Mammography 932 10.3 11.1 9.0
Radiation Therapy 819 9.0 9.8 6.2
Magnetic Resonance Imaging 820 9.0 9.8 10.1
Cardiovascular/Interventional 712 7.9 8.5 5.3
Sonography 716 7.9 8.5 5.9
Nuclear Medicine 675 7.4 8.1 4.7
Medical Dosimetry 154 1.7 1.8
Quality Management 113 1.2 1.3 0.3
Bone Densitometry 104 1.1 1.2 0.4
Registered Radiologist Assistant 64 0.7 0.8 0.1
Multiple primary disciplines checked 440 4.9
Other 202 2.2
Missing 45 0.5
Total 9068 100.0 100.0 100.0
Primary Discipline
30.0%
25.0%
20.0%
15.0%
5.0%
0.0%
Radi
olog
raph
y
Com
pute
d To
mog
raph
y
Mam
mog
raph
y
Radi
atio
n Th
erap
y
Mag
netic
Res
onan
ce Im
agin
g
Card
iova
scul
ar/In
terv
entio
nal
Tech
nolo
gy
Sono
grap
hy
Nuc
lear
Med
icin
e
Med
ical
Dos
imet
ry
Bone
Den
sitom
etry
Qua
lity
Man
agem
ent
Regi
ster
ed R
adio
logi
st A
ssis
tant
27.9%
11.1% 9.8% 9.8% 8.5% 8.5% 8.1%
1.8% 1.3% 1.2% 0.8%
11.2%
©2010 ASRT. All rights reserved. Radiologic Technologist Wage and Salary Survey 2010
21
30.0%
25.0%
20.0%
15.0%
10.0%
5.0%
0.0%5 years or less
26.5%
6 to 10 years
18.8%
11 to 15years
14.5%
16 to 20years
14.6%
21 to 25 years
10%
26 to 30 years
7.2%
More than30 years
8.4%
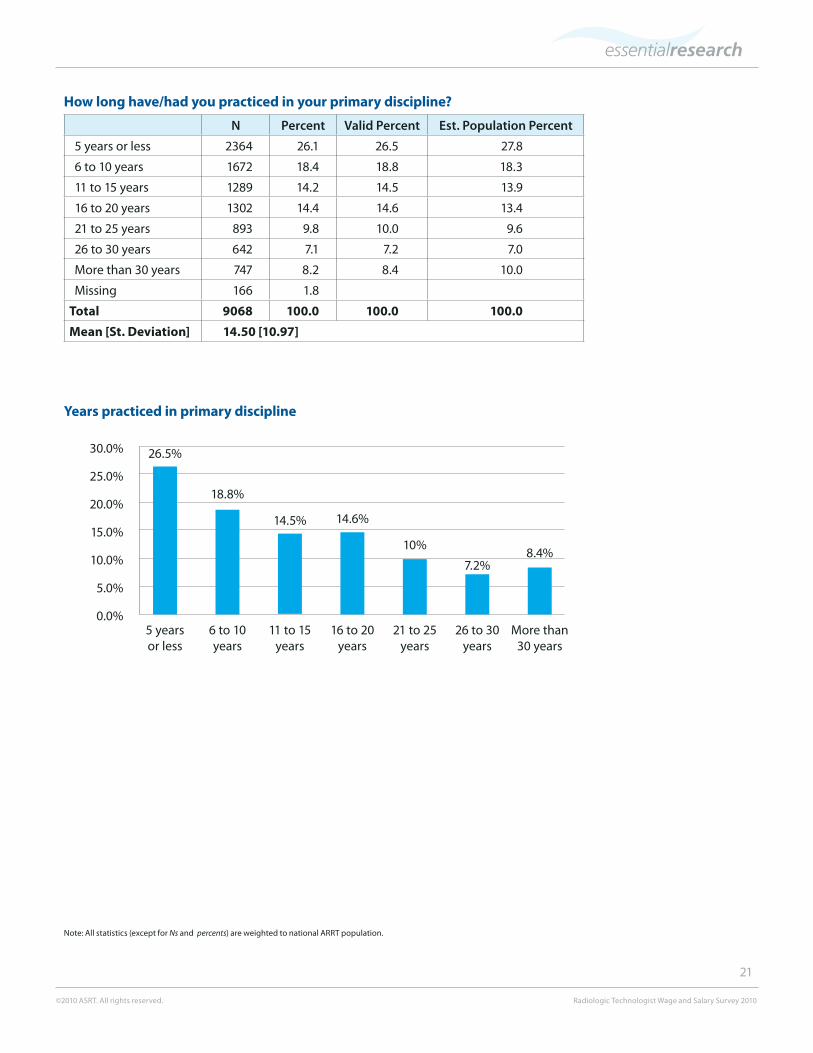
How long have/had you practiced in your primary discipline?
N Percent Valid Percent Est. Population Percent
5 years or less 2364 26.1 26.5 27.8
6 to 10 years 1672 18.4 18.8 18.3
11 to 15 years 1289 14.2 14.5 13.9
16 to 20 years 1302 14.4 14.6 13.4
21 to 25 years 893 9.8 10.0 9.6
26 to 30 years 642 7.1 7.2 7.0
More than 30 years 747 8.2 8.4 10.0
Missing 166 1.8
Total 9068 100.0 100.0 100.0
Mean [St. Deviation] 14.50 [10.97]
Years practiced in primary discipline
Note: All statistics (except for Ns and percents) are weighted to national ARRT population.

©2010 ASRT. All rights reserved. Radiologic Technologist Wage and Salary Survey 2010
22
Note: All statistics (except for Ns and percents) are weighted to national ARRT population.
Which of the following titles best describes your current job position?
N Percent Valid Percent Est. Population Percent
Stafftechnologist/therapist 5674 62.6 63.1 63.8
Senior/lead technologist/therapist 1395 15.4 15.5 14.2
Supervisor/manager 700 7.7 7.8 7.1
Chief technologist/therapist 348 3.8 3.9 3.6
Administrator 147 1.6 1.6 1.6
Instructor/faculty 140 1.5 1.6 2.6
Program director 111 1.2 1.2 1.7
Corporate representative 59 0.7 0.7 0.7
Assistant chief technologist/therapist 48 0.5 0.5 0.4
Other 371 4.1 4.1 4.4
Missing 75 0.8
Total 9068 100.0 100.0 100.0
Current job position
70.0%60.0%50.0%40.0%30.0%20.0%10.0%
0.0%
Staff
techno
logists/therap
ist
Seni
or te
chno
logi
sts/
ther
apis
t
Supe
rvis
or/m
anag
er
Chie
f tec
hnol
ogis
ts/t
hera
pist
Adm
inis
trat
ion
Inst
ruct
or /f
acul
ty
Prog
ram
dire
ctor
Corp
orat
e re
pres
enta
tive
Ass
istan
t chi
ef te
chno
logi
st/
ther
apist
Oth
er
63.1%
17.8%3.9% 1.6% 1.6% 1.2% 0.7% 0.5% 4.1%
15.5%

©2010 ASRT. All rights reserved. Radiologic Technologist Wage and Salary Survey 2010
23
How long have/had you practiced in this current position?
N Percent Valid Percent Est. Population Percent
5 years or less 3839 42.3 43.3 45.4
6 to 10 years 2233 24.6 25.2 24.8
11 to 15 years 971 10.7 10.9 10.2
16 to 20 years 771 8.5 8.7 8.2
21 to 25 years 479 5.3 5.4 5.0
26 to 30 years 291 3.2 3.3 3.2
More than 30 years 285 3.1 3.2 3.2
Missing 199 2.2
Total 9068 100.0 100.0 100.0
Mean [St. Deviation] 9.34 [8.66]
Years practicing in current position
Note: All statistics (except for Ns and percents) are weighted to national ARRT population.
50.0%
40.0%
30.0%
20.0%
10.0%
0.0%5 years or less
6 to 10years
11 to 15years
16 to 20years
21 to 25years
26 to 30years
More than 30 years
43.3%
11.0% 8.7% 5.4%3.2%3.3%
25.2%

©2010 ASRT. All rights reserved. Radiologic Technologist Wage and Salary Survey 2010
24
Note: All statistics (except for Ns and percents) are weighted to national ARRT population.
Are you currently a member of the ASRT?
N Percent Valid Percent Est. Population Percent
Yes 5421 59.8 60.2 62.7
No 3583 39.5 39.8 37.3
Missing 64 0.7
Total 9068 100.0 100.0 100.0
How long have you been a member of the ASRT?
N Percent Valid Percent Est. Population Percent
3 years or less 472 5.2 22.7 24.8
4 to 6 years 351 3.9 17.5 17.3
7 to 9 years 369 4.1 10.4 10.3
10 to12 years 301 3.3 14.9 14.6
13 to 15 years 397 4.4 11.9 11.8
16 to 18 years 1261 13.9 6.2 5.9
19 to 21 years 1575 17.4 6.6 6.2
More than 21 years 539 5.9 9.8 9.2
Missing 3803 41.9
Total 9068 100.0 100.0 100.0
Length of ASRT membershipMean =10.38 Standard Deviation=8.62
How long have you been a member of the ASRT?
ASRT Membership
35.0%30.0%25.0%20.0%15.0%10.0%
5.0%0.0%
1 year or less
2 years 3 years 4 years 5 years 6 to 10 years
11 to 20 years
More than 20 years
9%6.7% 7% 5.7 %
7.5%
24%
29.9%
10.2%

©2010 ASRT. All rights reserved. Radiologic Technologist Wage and Salary Survey 2010
25
Cover Letter
Appendix A

©2010 ASRT. All rights reserved. Radiologic Technologist Wage and Salary Survey 2010
26
PLEASE ANSWER ALL QUESTIONS IN TERMS OF YOUR JOB IN THE RADIOLOGIC SCIENCES ONLY. DO NOT INCLUDE OTHER JOBS YOU MAY HAVE.
1. Are you presently employed in the radiologic sciences? Yes No
1a. Please select the response that best describes your employment status. Seeking more education. Looking for employment in the radiologic sciences. Workinginadifferentfield.Fulfilling family needs. Retired. Other (please specify below). Please specify the “other” employment status .
Demographics
2. In which employment setting do/did you practice most of the time? Education Clinic or physician’s office Hospital (not for profit) Hospital (for profit) Mobile unit Imaging center/outpatient imaging facility Government/V.A. hospital Locumtenens(temporarystaff)Industrial Corporate Please specify the “other” employment setting.
3. If your primary practice is/was in a hospital, what is/was the size (in no. of beds) of the hospital? Fewer than 50 beds 50-99 beds 100-199 beds 200-299 beds 300-399 beds 400-499 beds 500 or more Not applicable
4. In what state is your current or previous work place? Please use 2 letter state abbreviation.
5. Workplace ZIP code:
6. Please indicate in which discipline or specialty you practice(d) most of the time. ( Your primary discipline or specialty) Radiography Radiation Therapy Nuclear Medicine Mammography Cardiovascular/Interventional Technology Computed Tomography Magnetic Resonance Imaging Quality Management Sonography Medical Dosimetry Registered Radiologist Assistant (RRA) Other (please specify below) Please specify the “other” discipline or specialty.
7. Are you responsible for any image post-processing in your position? Yes No
8. Are you credentialed in your primary discipline or specialty? Yes No
9. How long have/had you practiced in the radiologic sciences? Please round to the nearest full year and do not include the number of years for preparatory education.
10. How long have/had you practiced in your primary discipline or specialty? Please round to the nearest full year and do not include clinical training.
11. Which of the following titles best describes your current or previous job position? Stafftechnologist/therapistSenior/lead technologist/therapist Assistant chief technologist/therapist Chief technologist/therapist Supervisor/manager Administrator Instructor/faculty Program director Corporate representative Other (please specify below)
Please specify the “other” job position.
Survey Instrument

©2010 ASRT. All rights reserved. Radiologic Technologist Wage and Salary Survey 2010
27
12. How long have/had you practiced in this current position? Please count consecutive years and round to the nearest full year.
13. Are you currently a member of the ASRT? Yes No
14. If yes, how long have you been a member? Please round to the nearest full year.
15. Year of birth:
16. Gender Male Female
17. Highest level of education completed: Certificate(s) Associate degree Bachelor’s degree Master’s degree Doctoral degree Other (please specify below) Please specify the “other” level of education.
Compensation 18. Approximately how many hours do you work in an
average week? Please round to the nearest full hour.
19. If you are paid on an hourly basis, what is your hourly rate? Base rate, please. Do not figure in pay for on call, over-time,bonusesorshiftdifferential.Example: $22.50
20. If you are a salaried employee, what is your annual gross salary? Base salary, please. Do not figure in pay for on call, overtime,bonusesorshiftdifferential.Example: $52,000
21. Did you receive a raise in your salary/wages in the past 12 months? Yes No Don’t recall
22. By what percentage did your salary/wage increase? Example: 2.0%, 4.5%
23. Are you paid for being on call? Yes No
24. If yes, how much extra per hour are you paid?
25. Are you represented by a collective bargaining agent or union? Yes No
26. Please indicate how much funding your employer provides toward each of the benefits listed below. Benefits Provides no funding -- Provides a fixed % or dollar amount -- Provides 100% -- Unsure Life insurance Health insurance Dental insurance Liability insurance Retirement/pension program Disability protection Professional Development Provides no funding -- Provides a fixed % or dollar amount -- Provides 100% -- Unsure Registration fees Travel expenses Tuition assistance Professional association dues CE courses/materials Other (please specify below) Please specify the “other” employer funded benefit.
27. Please rate your level of satisfaction with your cur-rent salary or wages. Very satisfied Satisfied Neutral Dissatisfied Very dissatisfied
28. Please provide comments you may have:

©2010 ASRT. All rights reserved. Radiologic Technologist Wage and Salary Survey 2010
28
State Weight and Response Rate by StateState Postal Invitation Online Invitation Online Volunteer Total ARRT Registrants State WeightAK 18 88 2 108 591 0.165AL 20 100 15 135 5,084 1.139AR 27 114 9 150 3,345 0.674AZ 20 131 15 166 5,688 1.036CA 24 201 43 268 20,413 2.303CO 36 145 24 205 4,570 0.674CT 38 141 15 194 4,041 0.630DC 5 21 2 28 174 0.188DE 27 75 8 110 1,014 0.279FL 42 189 55 286 20,251 2.141GA 26 152 28 206 9,238 1.356HI 24 82 3 109 1,006 0.279IA 59 171 24 254 3,738 0.445ID 23 110 4 137 1,463 0.323IL 36 153 31 220 13,244 1.821IN 28 159 25 212 7,792 1.112KS 39 129 14 182 3,250 0.540KY 25 110 10 145 5,875 1.225LA 24 107 14 145 5,172 1.079MA 39 186 23 248 6,785 0.827MD 34 109 17 160 5,791 1.095ME 40 110 8 158 1,690 0.323MI 27 188 36 251 10,193 1.228MN 32 175 14 221 5,474 0.749MO 32 172 17 221 6,452 0.883MS 18 88 14 120 3,547 0.894MT 35 109 12 156 1,129 0.219NC 23 160 28 211 10,379 1.488ND 23 114 6 143 816 0.173NE 27 135 9 171 2,218 0.392NH 19 113 4 136 1,571 0.349NJ 38 104 17 159 8,412 1.600NM 33 99 10 142 1,722 0.367NV 27 99 8 134 2,009 0.453NY 24 171 50 245 14,604 1.803OH 39 196 45 280 14,512 1.567OK 32 113 13 158 3,629 0.695OR 47 119 11 177 2,981 0.509PA 39 189 39 267 16,245 1.840RI 32 75 10 117 1,257 0.325SC 31 120 11 162 4,986 0.931SD 27 104 8 139 1,050 0.228TN 27 145 30 202 7,344 1.100TX 29 173 35 237 20,556 2.623UT 32 109 9 150 2,158 0.435VA 20 75 2 97 7,475 1.171VT 31 134 28 193 670 0.209WA 31 156 10 197 5,578 0.856WI 42 206 18 266 7,189 0.817WV 24 85 7 116 2,653 0.692WY 23 82 3 108 639 0.179
Total 1518 6591 893 9002 297,663Missing 66
Appendix B
©2010 ASRT. All rights reserved. Radiologic Technologist Wage and Salary Survey 2010
29
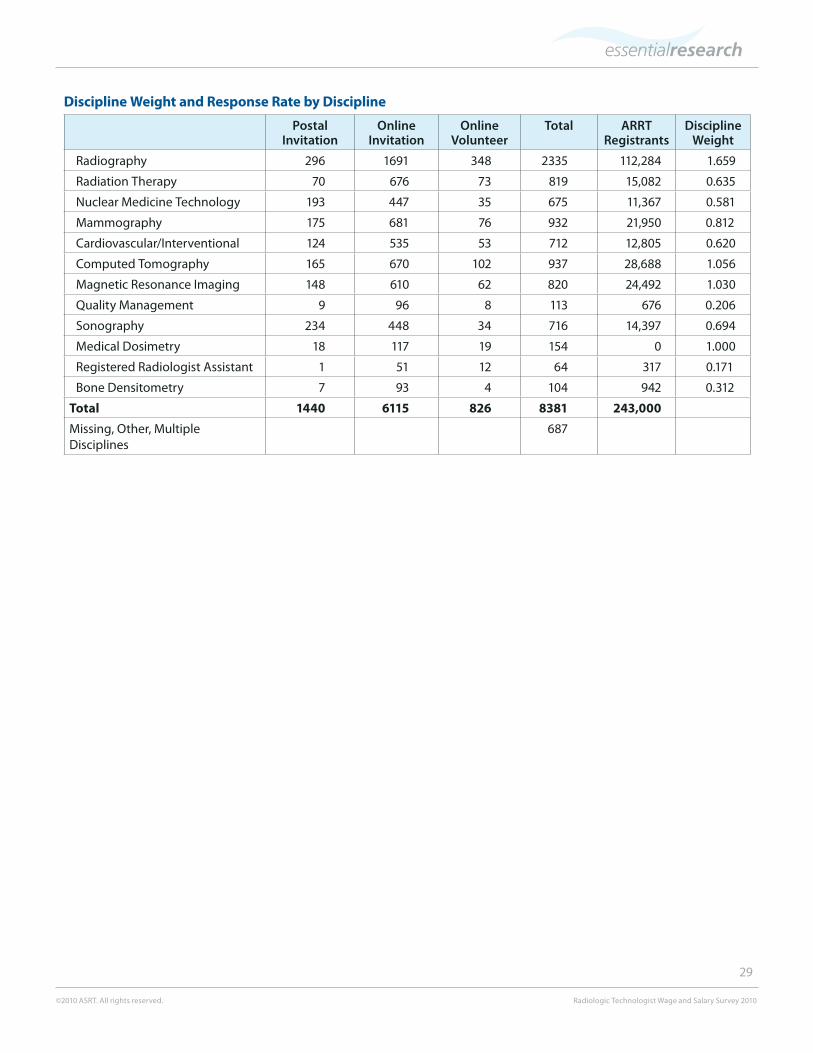
Discipline Weight and Response Rate by Discipline
Postal Invitation
Online Invitation
Online Volunteer
Total ARRT Registrants
Discipline Weight
Radiography 296 1691 348 2335 112,284 1.659
Radiation Therapy 70 676 73 819 15,082 0.635
Nuclear Medicine Technology 193 447 35 675 11,367 0.581
Mammography 175 681 76 932 21,950 0.812
Cardiovascular/Interventional 124 535 53 712 12,805 0.620
Computed Tomography 165 670 102 937 28,688 1.056
Magnetic Resonance Imaging 148 610 62 820 24,492 1.030
Quality Management 9 96 8 113 676 0.206
Sonography 234 448 34 716 14,397 0.694
Medical Dosimetry 18 117 19 154 0 1.000
Registered Radiologist Assistant 1 51 12 64 317 0.171
Bone Densitometry 7 93 4 104 942 0.312
Total 1440 6115 826 8381 243,000
Missing, Other, Multiple Disciplines
687