rbtt bank limited financial statements · 2011-02-01 · 23 rbtt bank limited financial statements...
TRANSCRIPT

22
RBTT Bank LimitedFinancial Statements (expressed in Trinidad & Tobago dollars)
31 October 2010
Chairman’s report
For the 19 months ended 31 October, 2010 the RBTT Bank Limited delivered solid results in the midst of a challenging economic environment. The Bank reported a profit after tax for the period of TT$711 million which compared favourably to the prior year. During this period the Bank experienced significant growth in total deposits of over TT$3 billion to end the period at TT$16 billion. The economic slowdown in the region led to a higher level of non-performing loans with an increase in impairment losses and a reduction in total loans and advances to customers.
The Bank changed its statutory year end from 31 March to 31 October in alignment with the statutory year end of its ultimate parent, Royal Bank of Canada (RBC), giving rise to the one time 19 month reporting period.
During this period, we opened a new lending centre, renovated several branches and introduced new business models to meet clients’ changing needs and to provide a richer client experience. We led the market by introducing a floating Net Asset Value (NAV) for our two Roytrin Income Funds which aligns us with international standards and provides greater transparency to investors on the valuation of the funds. We also implemented a new technology platform and upgraded our technology infrastructure that will allow us to leverage the
capabilities of the broader RBC network. I wish to thank the Bank’s loyal customers for seeing us through this transition period and choosing RBTT.
I would like to thank our employees, who are without a doubt the driving force behind all our achievements. Their commitment to our values, to our clients and to one another continues to position us for long-term growth and success.
Suresh SookooChairman
Statement of management responsibilities
The Financial Institutions Act, 2008 (FIA 2008) requires management to prepare financial statements for each financial period which give a true and fair view of the state of affairs of the company as at the end of the financial period and of the operating results of the company for the period. It also requires management to ensure that the company keeps proper accounting records which disclose with reasonable accuracy at any time the financial position of the company. They are also responsible for safeguarding the assets of the company.
Management is responsible for the preparation and fair presentation of these financial statements in accordance
with International Financial Reporting Standards. This responsibility includes: designing, implementing and maintaining internal controls relevant to the preparation and fair presentation of financial statements that are free from material misstatement, whether due to fraud or error, selecting and applying appropriate accounting policies, and making accounting estimates that are reasonable in the circumstances.
Management accepts responsibility for the annual financial statements, which have been prepared using appropriate accounting policies supported by reasonable and prudent judgments and estimates, in conformity with International Financial Reporting Standards and in the manner required by the FIA 2008. Management is of the opinion that the financial statements give a true and fair view of the state of the financial affairs of the company and of its operating results. Management further accepts responsibility for the
maintenance of accounting records which may be relied upon in the preparation of financial statements, as well as adequate systems of internal financial control.
Nothing has come to the attention of Management to indicate that the company will not remain a going concern for at least the next twelve months from the date of this statement.
Arvinder Bharath Gregory WeekesPresident and Country Head Head – Finance19 January 2011 19 January 2011
Independent auditor’s report
To the shareholders of
RBTT Bank Limited
Report on the financial statements We have audited the accompanying financial statements of RBTT Bank Limited, which comprise the statement of financial position as of 31 October 2010 and the statement of comprehensive income, statement of changes in equity and Statement of cash flows for the period then ended and a summary of significant accounting policies and other explanatory notes.
Management’s responsibility for the financial statementsManagement is responsible for the preparation and the fair presentation of these financial statements in accordance with International Financial Reporting Standards. This responsibility includes: designing, implementing and maintaining internal control relevant to the preparation and fair presentation of financial statements that are free
from material misstatement, whether due to fraud or error; selecting and applying appropriate accounting policies; and making accounting estimates that are reasonable in the circumstances.
Auditor’s responsibilityOur responsibility is to express an opinion on these financial statements based on our audit. We conducted our audit in accordance with International Standards on Auditing. Those standards require that we comply with ethical requirements and plan and perform the audit to obtain reasonable assurance whether the financial statements are free from material misstatement.
An audit involves performing procedures to obtain audit evidence about the amounts and disclosures in the financial statements. The procedures selected depend on the audi-tor’s judgment, including the assessment of the risks of mate-rial misstatement of the financial statements, whether due to fraud or error. In making those risk assessments, the auditor considers internal control relevant to the entity’s preparation and fair presentation of the financial statements in order to design audit procedures that are appropriate in the circum-stances, but not for the purpose of expressing an opinion on
the effectiveness of the entity’s internal control. An audit also includes evaluating the appropriateness of accounting poli-cies used and the reasonableness of accounting estimates made by management, as well as evaluating the overall pre-sentation of the financial statements.
We believe that the audit evidence we have obtained is sufficient and appropriate to provide a basis for our audit opinion.
OpinionIn our opinion, the accompanying financial statements present fairly, in all material respects, the financial position of RBTT Bank Limited as of 31 October 2010, and its financial performance and cash flows for the nineteen months period then ended in accordance with International Financial Reporting Standards.
Deloitte and TouchePort of SpainTrinidad, West Indies19 January 2011
Financial Statements 31 October 2010 - continued(expressed in Trinidad & Tobago dollars)

23
RBTT Bank LimitedFinancial Statements (expressed in Trinidad & Tobago dollars)
31 October 2010Financial Statements 31 October 2010 - continued
(expressed in Trinidad & Tobago dollars)
Statement of financial position 31 31 October March 2010 2009 ($’000) ($’000) Note RestatedAssets Cash on hand and due from banks 4 1,688,119 1,570,917 Balance with Central Bank 5 3,314,629 2,055,007 Loans and advances to customers 6 8,864,329 9,057,366 Investment securities 7 4,809,025 1,603,612 Banker’s acceptances and participatory investments 398,100 240,070 Derivative financial instruments 8 87,271 36,453 Investment in associate company 9 13,637 10,569 Due from affiliated companies 746,892 2,353,470 Intangible assets 10 264,962 83,499 Premises and equipment 11 223,195 236,502 Deferred tax asset 12 64,283 39,454 Other assets 13 257,343 76,748
Total assets 20,731,785 17,363,667
Liabilities Due to banks 116,686 696,201 Customers’ deposits 14 16,419,101 13,436,117 Derivative financial instruments 8 87,271 -- Banker’s acceptances and participatory investments 398,100 240,070 Post-retirement benefit obligations 15 192,882 145,676 Due to affiliated companies 661,474 606,417 Corporation tax payable 51,122 107,921 Deferred tax liability 12 28,621 6,143 Other liabilities 16 569,862 388,060 Provisions 111,410 92,016
Total liabilities 18,636,529 15,718,621
Shareholders’ equity Share capital 17 403,970 403,970 Statutory reserve 18 518,970 378,434 Other reserves 19 40,992 (8,500) Retained earnings 1,131,324 871,142
Total shareholders’ equity 2,095,256 1,645,046
Total shareholders’ equity and liabilities 20,731,785 17,363,667
The accompanying notes form an integral part of these financial statements.On 19 January 2011 the Board of Directors of RBTT Bank Limited authorised these financial statements for issue.
______________________ Director ______________________ Director
Statement of comprehensive income Nineteen Months Year ended ended 31 October 31 March 2010 2009 Note ($’000) ($’000) Restated
Interest income 20 1,749,085 1,293,202Interest expense 21 (223,783) (432,823)
Net interest income 1,525,302 860,379
Other income 22 711,295 421,504
Total net income 2,236,597 1,281,883
Operating expenses 23 (1,177,143) (899,279)Impairment losses on loans and advances to customers 6.2 (239,851) (74,520)Impairment credit/ (losses) on investment securities 7.2 (411) 2,007
Total non-interest expenses (1,417,405) (971,792)
Share of profits of associate companies 9 4,102 2,662
Profit before taxation 823,294 312,753
Taxation 24 (112,576) (76,249)
Profit after taxation 710,718 236,504
Other comprehensive income:
Net value gain on available – for-sale financial assets 19.1 49,492 9,532
Other comprehensive income for the year, net of tax 49,492 9,532
Total comprehensive income for the year 760,210 246,036
The accompanying notes form an integral part of these financial statements.
Statement of changes in equity Total share- Share Statutory Other Retained holders’ capital reserve reserves earnings equity Note ($’000) ($’000) ($’000) ($’000) ($’000)
Period ended 31 October 2010Balance at beginning of period as previously stated 403,970 378,434 (8,500) 980,399 1,754,303Prior year adjustment 30 -- -- -- (109,257) (109,257)
Balance at beginning of period 403,970 378,434 (8,500) 871,142 1,645,046 as restatedOther comprehensive income 19.1 -- -- 49,492 -- 49,492Profit after taxation -- -- -- 710,718 710,718
Total comprehensive income -- -- 49,492 710,718 760,210Transfer to statutory reserve 18 -- 140,536 -- (140,536) --Dividends 25 -- -- -- (310,000) (310,000)
Balance at end of period 403,970 518,970 40,992 1,131,324 2,095,256
Year ended 31 March 2009Balance at beginning of year 403,970 284,022 (18,636) 830,330 1,499,686Other comprehensive income 19.1 -- -- 9,532 -- 9,532Profit after taxation -- -- -- 236,504 236,504
Total comprehensive income -- -- 9,532 236,504 246,036Transfer to statutory reserve 18 -- 94,412 -- (94,412) --General reserve transfer 19 -- -- 604 (604) --Dividends 25 -- -- -- (100,676) (100,676)
Balance at end of year – as restated 403,970 378,434 (8,500) 871,142 1,645,046
The accompanying notes form an integral part of these financial statements.
Statement of cash flows Nineteen Months Year ended ended 31 October 31 March 2010 2009 ($’000) ($’000) Restated
Operating Activities Profit after taxation 710,718 236,504Adjustments for Depreciation/amortisation 60,424 46,772 Post-retirement benefit expense 54,219 147,294 Loss on disposal of premises and equipment 716 3,524 Capitalised interest on investment securities (21,277) (40,799) Net realised and unrealised (gains)/losses on investment securities (25,177) 22,477 Impairment losses/(credit) on investment securities 411 (2,007) Impairment expense on loans and advances to customers 256,501 76,981 Taxation expense 112,576 76,249 Unrealised gain on derivatives -- (1,092) Share of profits of associate company (4,102) (2,662) Operating profit before changes in operating assets and liabilities 1,145,009 563,241(Increase)/decrease in operating assets Balance with central bank (1,259,622) (428,335) Loans and advances to customers (116,806) 135,288 Interest receivable on loans and advances to customers 53,342 (968) Investment securities at fair value through profit and loss 91,424 53,630 Other assets (180,595) (3,827) Derivative financial instruments -- (33,459) Due from affiliated companies 1,606,578 (1,568,477)Increase/(decrease) in operating liabilities Due to banks (579,515) (263,748) Customers’ deposits 3,006,370 776,630 Due to affiliate companies 55,057 (36,734) Interest payable on customers’ deposits (23,386) (11,750) Interest payable on other borrowed funds/debt securities -- (3,050) Derivative financial instruments 36,453 (15,728) Other liabilities 194,183 92,809 Corporation taxes paid (187,188) (130,921)Cash provided by /(used in) operating activities 3,841,304 (875,399)
Investing activitiesPurchase of investment securities (15,102,274) (7,538,746)Proceeds from sale and redemption of investment securities 11,917,470 8,233,118Additions to premises and equipment (230,179) (30,201)Proceeds from disposal of premises and equipment 881 164Cash (used in)/provided by investing activities (3,414,102) 664,335
Financing activities Other borrowed funds/debt securities repaid -- (574,644) Dividends paid (310,000) (100,676)
Cash used in financing activities (310,000) (675,320)
Net increase/(decrease) in cash resources 117,202 (886,384)Cash resources at beginning of period 1,570,917 2,457,301
Cash resources at end of period (Note 4) 1,688,119 1,570,917
The accompanying notes form an integral part of these financial statements.

24
Financial Statements 31 October 2010 - continued(expressed in Trinidad & Tobago dollars)
Notes to the financial statements
1 Incorporation and business activities
RBTT Bank Limited (the Bank) was incorporated in the Republic of Trinidad and Tobago on 26 July 1971. It is a wholly owned subsidiary of RBC Financial (Caribbean) Limited (formerly RBTT Financial Holdings Limited), which is also incorporated in the Republic of Trinidad and Tobago. The address of its registered office is St Clair Place,7-9 St Clair Avenue, Port of Spain. The ultimate parent company is the Royal Bank of Canada which is incorporated in Canada.
The Bank offers a complete range of banking and financial intermediary services to customers in Trinidad and Tobago.
The Bank has a 25% interest in an associated company, Infolink Services Limited, whose principal activity is the provision of automatic banking machine reciprocity.
During fiscal 2010, the Bank changed its end of reporting period to 31 October to align the Bank’s year-end with that of its ultimate parent company, Royal Bank of Canada. Consequently, the results for the period ended 31 October 2010 include the results of operations for nineteen months from 1 April 2009 to 31 October 2010. The results for the comparative year ended 31 March 2009 include the results of operations for twelve months.
2 Significant accounting policies
a) Basis of preparation
These financial statements are prepared in Trinidad and Tobago dollars and in accordance with International Financial Reporting Standards. The financial statements are prepared under the historical cost convention as modified by the revaluation of available-for-sale financial assets, investment securities at fair value through profit and loss and derivative financial instruments and other trading liabilities.
The preparation of financial statements in conformity with International Financial Reporting Standards requires the use of certain critical accounting estimates and assumptions that affect the reported amounts of assets and liabilities and disclosure of contingent assets and liabilities at the date of the financial statements and the reported amounts of revenues and expenses during the reporting period. Although these estimates are based on management’s best knowledge of current events and actions, actual results ultimately may differ from those estimates. The areas involving a higher degree of judgment or complexity, or areas where assumptions and estimates are significant to the financial statements are disclosed in note 3.
The following new interpretations issued by the International Financial Reporting Interpretations Committee and revised standard are effective in the current period:
Standards affecting presentation and disclosure
• IAS1,PresentationofFinancialStatements. Comprehensiverevision requiring a statement of comprehensive income (effective January 1, 2009)
• IAS1, Presentation of Financial Statements. Amendmentsresulting from May 2008 annual improvements to IFRSs (effective January 1, 2009).
IAS 1 has introduced terminology changes (including revised titles for the financial statements) and changes in the format and content of the financial statements.
• Improving Disclosures about Financial Instruments -Amendments to IFRS 7 Financial Instruments: Disclosures (effective for accounting periods beginning on or after 1 January 2009)
The amendments to IFRS 7 expand the disclosures required in respect of fair value measurements and liquidity risk. The Bank has elected not to provide comparative information for these expanded disclosures in the current year in accordance with the transitional reliefs offered in these amendments.
• AmendmentstoIAS39FinancialInstruments:RecognitionandMeasurement and IFRS 7 Financial Instruments: Disclosures regarding reclassification of financial assets (effective 1 July 2008)
The amendments to IAS 39 permit an entity to reclassify non-derivative financial assets out of the ‘fair value through profit
or loss’ (FVTPL) and ‘available-for-sale’ (AFS) categories. Such reclassifications are permitted from 1 July 2008. Reclassifications of financial assets made in periods beginning on or after 1 November 2008 take effect only from the date when the reclassification is made.
In April 2009, the Bank reclassified certain debt securities from at fair value through profit and loss and available-for-sale to loans and advances to customers. These securities would have met the definition of loans and advances to customers if they had not been designated as at fair value through profit and loss and available-for-sale at initial recognition. The Bank’s original intention at initial recognition was to sell the securities at fair value through profit and loss in the short-term and to hold the available for sale securities for an indefinite period. However, as a result of adverse world economic conditions accompanied by the Bank’s intent and ability to hold the financial assets for the foreseeable future or until maturity, the Bank concluded that the criteria for reclassification were met. Consequently, the assets were reclassified at 1 April 2009 (see note 7 for further details). The reclassification has been accounted for in accordance with the relevant transitional provisions and took effect only from the date of reclassification.
The effect of the reclassification is that all transferred securities have been recorded as loans and advances to customers at their fair value on the date of reclassification which became its new amortised cost. For those reclassifications made from securities at fair value through profit and loss, any gain or loss already recognised in profit or loss shall not be reversed. For those reclassifications made from available for sale securities with a fixed maturity, any previous gain or loss is amortised to profit and loss over the remaining life of the security using the effective interest method. Any difference between the new amortised cost and the maturity amount shall also be amortised over the remaining life of the financial asset using the effective interest method. If the security becomes impaired, any gain or loss that was previously recognised in other comprehensive income is reclassified to profit and loss.
Standards and Interpretations adopted with no effect on financial statements
• IFRS8,OperatingSegments(effectiveforaccountingperiodsbeginning on or after 1 January 2009).
• IAS23,BorrowingCosts,Comprehensiverevisiontoprohibitimmediate expensing and amendments resulting from May 2008 improvements to IFRSs (effective for accounting periods beginning on or after 1 January 2009).
• IFRIC 15, Agreements for the construction of Real Estate(effective for accounting periods beginning on or after 1 January 2009).
• IFRS 1, First-Time Adoption of International FinancialReporting Standards – Amendment relating to cost of an investment on first-time adoption (effective for accounting periods beginning on or after 1 January 2009).
• IAS32,Financial Instruments: DisclosureandPresentation:Amendments relating to puttable instruments and obligations arising on liquidation (effective for accounting periods beginning on or after 1 January 2009).
• IAS16,Property,PlantandEquipment.Amendmentsresultingfrom May 2008 annual improvements to IFRSs (effective 1 January 2009).
• IAS 19, Employee Benefits. Amendments resulting fromMay 2008 annual improvements to IFRSs (effective 1 January 2009).
• IAS 36, Impairment of Assets. Amendments resulting fromMay 2008 annual improvements to IFRSs (effective 1 January 2009).
• IAS 38, Intangible Assets. Amendments resulting fromMay2008 annual improvements to IFRSs (effective 1 January 2009).
• IAS 40, Investment Property. Amendments resulting fromMay 2008 annual improvements to IFRSs (effective 1 January 2009).
Standards and Interpretations in issue not yet adopted
• IFRIC18,TransferofassetstoCustomers(effectivefortransfersof assets from customers received beginning on or after 1 July 2009).
• IAS 27, Consolidated and Separate Financial Statements:Consequential amendments arising from amendments to IFRS 3 (effective for accounting periods beginning on or after 1 July 2009).
• IAS28,InvestmentsinAssociates:Consequentialamendmentsarising from amendments to IFRS 3 (effective for accounting periods beginning on or after 1 July 2009).
• IFRIC17,DistributionsofNon-cashAssetstoOwners(effectivefor accounting periods beginning on or after 1 July 2009).
• IAS31,InterestsinJointVentures:Consequentialamendmentsarising from amendments to IFRS 3 (effective for accounting periods beginning on or after 1 July 2009).
• IAS39,FinancialInstruments:RecognitionandMeasurement:Amendments for eligible hedged items (effective for accounting periods beginning on or after 1 July 2009).
• IFRS 5, Non-current assets held for sale and discontinuedoperations. Amendment resulting from May 2008 annual improvements to IFRSs (effective 1 July 2009).
• IFRS 5, Non-current assets held for sale and discontinuedoperations. Amendments resulting from April 2009 annual improvements to IFRS (effective 1 January 2010).
• IFRS9,FinancialInstruments.ClassificationandMeasurement(effective for accounting periods beginning 1 January, 2013).
• IAS 1, Presentation of Financial Statements. Amendmentsresulting from April 2009 annual improvements to IFRSs (effective 1 January 2010).
• IAS7,StatementofCashFlows.Amendments resulting fromApril 2009 annual improvements to IFRSs (effective 1 January 2010).
• IAS17,Leases.AmendmentsresultingfromApril2009annualimprovements to IFRSs (effective 1 January 2010).
• IAS24,Relatedpartydisclosures.Reviseddefinitionofrelatedparties (effective 1 January 2010).
• IAS 32, Financial instruments. Amendment relating toclassification of rights issues (effective 1 January 2010).
• IAS 36, Impairment of Assets. Amendments resulting fromApril 2009 annual improvements to IFRSs (effective 1 January 2010).
• IAS38, IntangibleAssets. Amendments resulting fromApril2009 annual improvements to IFRSs (effective 1 January 2010).
• IFRIC14,Requirementsandtheirinteraction.November2009amendment with respect to voluntary prepaid contributions (to be effected 1 January 2011).
Management is unable to provide a reasonable estimate of the potential impact of the adoption of these amendments until a detailed review is completed.
b) Investment in associated companies
Associates are all entities over which the Bank has significant influence but not control, generally accompanying a shareholding of between 20% and 50% of the voting rights. The investment in associate is initially recognised at cost and is subsequently accounted for using the equity method of accounting. The Bank’s investment in associates includes goodwill (net of any accumulated impairment loss) identified on acquisition.
The Bank’s share of its associates’ post acquisition profits or losses is recognised in the statement of comprehensive income and its share of post acquisition movements in reserves. The Bank’s investment in associates is carried in the statement of financial position at an amount that reflects its share of the net assets of the associates. The associates’ accounting policies have been changed where necessary to ensure that consistency with the policies adopted by the Bank.
Financial Statements 31 October 2010 - continued(expressed in Trinidad & Tobago dollars)

25
Financial Statements 31 October 2010 - continued(expressed in Trinidad & Tobago dollars) Financial Statements 31 October 2010 - continued
(expressed in Trinidad & Tobago dollars)
Notes to the financial statements2 Significant accounting policies (continued)
c) Foreign currency transactions
Functional and presentation currency
The financial statements are presented in Trinidad and Tobago dollars which is the Bank’s functional and presentation currency.
Transactions and balances
Foreign currency transactions are translated into the functional currency using the exchange rates prevailing at the dates of the transactions. Foreign exchange gains and losses resulting from the settlement of such transactions and from the translation at period end exchange rates of monetary assets and liabilities denominated in foreign currencies are recognised in the statement of comprehensive income.
Changes in the fair value of monetary securities denominated in foreign currency classified as available for sale are analyzed between translation differences resulting from changes in the amortised cost of the security and other changes in the carrying amount of the security. Translation differences related to changes in the amortised cost are recognised in the statement of comprehensive income, and other changes in the carrying amount are recognised in other comprehensive income.
d) Financial assets
The Bank classifies its financial assets into the following categories: investment securities at fair value through profit and loss, investment securities available for sale, investment securities held to maturity and loans and advances to customers. Management determines the classification of its financial assets at initial recognition.
EffectiveinterestmethodThe effective interest method is a method of calculating the amortised cost of a debt instrument and of allocating interest income over the relevant period. The effective interest rate is the rate that exactly discounts estimated future cash receipts (including all fees on points paid or received that form an integral part of the effective interest rate, transaction costs and other premiums or discounts) through the expected life of the debt instrument, or, where appropriate, a shorter period to the net carrying amount on initial recognition.
Income is recognised on an effective interest basis for debt instruments other than those financial assets classified as at Fair Value through profit and loss.
i) Investment securities at fair value through profit and loss
This category has two sub-categories: investment securities held for trading and those designated at fair value through profit and loss from inception.
Investment securities are classified as held for trading if they are either acquired or incurred principally for the purpose of selling in the short term or if it is part of a portfolio of identified financial instruments that are managed together and for which there is evidence of a recent actual pattern of short term profit taking.
Financial assets are designated at fair value through profit and loss when:
• The designation significantly reduces measurementinconsistencies that would arise from measuring the assets or recognising gains or losses on them on a different basis; or
• Assetsthatarepartofagroupoffinancialassetsaremanagedand evaluated on a fair value basis in accordance with a documented risk management or investment strategy and reported to key management personnel on that basis.
• Financial instruments, such as debt securities held,containing one or more embedded derivatives significantly modify the cash flows, are designated at fair value through profit and loss.
Investment securities held at fair value through profit and loss are initially recognised at fair value and transaction costs are expensed in the statement of comprehensive income. Investment securities at fair value through profit and loss are subsequently carried at fair value. Gains or losses arising from changes in the fair value of investment securities at fair value through profit and loss are included in net trading income in
the period in which they arise. Interest earned is accrued in interest income according to the terms of the contract.
ii) Investment securities available for sale
Investment securities available for sale are those intended to be held for an indefinite period of time, which may be sold in response to needs for liquidity or changes in interest rates, exchange rates or equity prices. Financial assets available for sale are initially recognised at fair value plus transaction costs and are subsequently carried at fair value. Gains or losses arising from changes in the fair value are recognised in other comprehensive income until the financial asset is derecognised or impaired at which time the cumulative gain or loss previously recognised in other comprehensive income is recognised in the statement of comprehensive income. However, interest calculated using the effective interest method and foreign currency gains and losses on financial assets classified as available for sale are recognised in the statement of comprehensive income.
iii) Investment securities held to maturity
Held to maturity investment securities are non-derivative financial assets with fixed or determinable payments and fixed maturities where management has the positive intention and the ability to hold to maturity. Held to maturity investment securities are carried at amortised cost using the effective interest method, less any provision for impairment. If the Bank were to sell other than an insignificant amount of held to maturity investments, the entire category would be reclassified as available for sale.
The fair values of quoted financial assets in active markets are based on current bid prices. If there is no active market for financial assets, the Bank establishes fair value using valuation techniques. These include the use of recent arm’s length transactions, discounted cash flow analysis, option pricing models and other valuation techniques commonly used by market participants.
Purchases and sales of financial assets are recognised at the settlement date.
iv) Loans and advances to customers
Loans and advances to customers are non-derivative financial assets with fixed determinable payments that are not quoted in an active market, other than: (a) those the entity intends to sell immediately or in the short term, which are classified as held for trading, and those that the entity upon initial recognition designates at fair value through profit and loss; (b) those that the entity upon initial recognition designates as available for sale; or (c) those for which the holder may not recover substantially all of its initial investment, other than because of credit deterioration. Loans and advances to customers are carried at amortised cost using the effective interest method.
e) Impairment of financial assets
i) Financial assets carried at amortised cost
The Bank assesses at each statement of financial position date whether there is objective evidence that a financial asset or group of financial assets is impaired. A financial asset or group of financial assets is impaired and impairment losses are incurred only if there is objective evidence of impairment as a result of one or more events that have occurred after the initial recognition of the asset (a ‘loss event’) and that loss event (or events) has an impact on the estimated future cash flows of the financial asset or group of financial assets that can be reliably estimated.
Objective evidence that a financial asset is impaired includes observable evidence that comes to the attention of the Bank about the following loss events:
(i) Delinquency in contractual payments of principal or interest;
(ii) Cash flow difficulties experienced by the borrower (e.g. equity ratio, net income percentage of sales);
(iii) Breach of loan covenants or conditions;(iv) Initiation of bankruptcy proceedings;(v) Deterioration of the borrower’s competitive position;(vi) Deterioration in the value of value of collateral; and (vii) Downgrading below investment grade level.
The Bank first assesses whether objective evidence of impairment exists individually for financial assets that are individually significant. Individually insignificant financial
assets are included in a group of financial assets with similar credit risk characteristics and collectively assessed for impairment. These characteristics are relevant to the estimates of future cash flows for groups of such assets by being indicative of the debtors’ ability to pay all amounts due according to the contractual term of the assets being evaluated. Assets that are individually assessed for impairment and for which an impairment loss is or continues to be recognised are not included in a collective assessment of impairment.
If there is objective evidence that an impairment loss on loans and advances to customers carried at amortised cost has been incurred, the amount of the loss is measured as the difference between the asset’s carrying amount and the present value of estimated future cash flows (excluding future credit losses that have not been incurred) discounted at the financial asset’s original effective interest rate. The carrying amount of the asset is reduced through the use of an allowance account and the amount of the loss is recognised in the statement of comprehensive income. If a financial asset has a variable interest rate, the discount rate for measuring any impairment loss is the current effective interest rate determined under the contract. As a practical expedient, the Bank may measure impairment on the basis of an instrument’s fair value using an observable market price.
The calculation of the present value of the estimated future cash flows of a collateralised financial asset reflects the cash flows that may result from foreclosure less costs for obtaining and selling the collateral, whether or not foreclosure is probable.
For the purpose of a collective evaluation of impairment, financial assets are grouped together on the basis of similar credit risk characteristics. Those characteristics are relevant to the estimation of future cash flows for groups of such assets by being indicative of the debtors’ ability to pay all amounts due according to the contractual terms of the assets being evaluated. Future cash flows in a group of financial assets that are collectively evaluated for impairment are estimated on the basis of historical loss experience for assets with credit risk characteristics similar to those in the group. Entitiesthat have no entity-specific loss experience or insufficient experience, use peer group experience for comparable groups of financial assets. Historical loss experience is adjusted on the basis of current observable data to reflect the effects of current conditions that did not affect the period on which the historical loss experience is based and to remove the effects of conditions in the historical period that do not exist currently. The methodology and assumptions used for estimating future cash flows are reviewed regularly to reduce any differences between loss estimates and actual loss experience.
When a loan is uncollectible, it is written off against the related provision for impairment loss. Such loans are written off after all the necessary procedures have been completed and the amount of the loss has been determined.
If in the subsequent period, the amount of the impairment loss decreases and the decrease can be related objectively to an event occurring after the impairment was recognised (such as an improved credit rating), the previously recognised impairment loss is reversed by adjusting the allowance account. The amount of the reversal is recognised in the statement of comprehensive income.
Where possible, the Bank seeks to restructure loans rather than to take possession of collateral. This may involve extending the payment arrangements and the agreement of new loan conditions. Once the terms have been renegotiated, the loan is no longer considered past due. Management continuously reviews renegotiated loans to ensure that all criteria are met and that future payments are likely to occur.
ii) Financial assets classified as available for sale
At the end of the reporting period the Bank assesses whether there is objective evidence that a financial asset or a group of financial assets is impaired. A financial asset or a group of financial assets carried at fair value is impaired if its carrying amount is greater than its estimated recoverable amount based on the present value of expected future cash flows discounted at the current market rate of interest.
For listed and unlisted equity investments classified as AFS, a significant or prolonged decline in the fair value of the security below its cost is considered to be objective evidence of impairment.

26
Financial Statements 31 October 2010 - continued(expressed in Trinidad & Tobago dollars)
Notes to the financial statements
2 Significant accounting policies (continued)
e) Impairment of financial assets (continued)
ii) Financial assets classified as available for sale (continued)
At the end of the reporting period if any such evidence exists for financial assets available for sale, the cumulative loss measured as the difference between the acquisition cost and the current fair value, less any impairment loss on that financial asset previously recognised in the other comprehensive income is removed and recognised in profit or loss.
With the exception of AFS equity instruments, if, in a subsequent period, the amount of the impairment loss decreases and the decrease can be related objectively to an event occurring after the impairment was recognised, the previously recognised impairment loss is reversed through profit or loss to the extent that the carrying amount of the investment at the date the impairment is reversed does not exceed what the amortised cost would have been had the impairment not been recognised.
In respect of available for sale equity investments, impairment losses previously recognised in profit or loss are not reversed through profit or loss. Any increase in fair value subsequent to an impairment loss is recognised in other comprehensive income.
f ) Derivative financial instruments
Derivative financial instruments
Derivative financial instruments include interest and currency swaps and options which are initially recognised in the statement of financial position at fair value on the date on which a derivative contract is entered into and subsequently measured at their fair value. Fair values are obtained from quoted market prices in active markets including recent market transactions, and valuation techniques, including discounted cash flow models and option pricing models as appropriate. All derivatives are carried as assets when fair value is positive and as liabilities when fair value is negative.
Certain derivatives embedded in other financial instruments, such as the equity option in an index linked instrument, are treated as separate derivatives when their economic characteristics and risks are not closely related to those of the host contract and the host contract is not carried at fair value through profit or loss. The embedded derivatives are measured at fair value with changes in fair value recognised in the statement of comprehensive income.
Changes in the fair value of derivatives are recognised immediately in the statement of comprehensive income and are included in net trading income.
g) Intangible assets
Intangible assets acquired separately are reported at cost less accumulated amortisation and accumulated impairment losses. Amortisation is charged on a straight-line basis over their estimated useful lives. The estimated useful life and amortisation method are reviewed at the end of each annual reporting period, with the effect of any changes in estimate being accounted for on a prospective basis.
h) Impairment of tangible and intangible assets excluding goodwill
At each statement of financial position date, the Bank reviews the carrying amounts of its tangible and intangible assets to determine whether there is any indication that those assets have suffered an impairment loss. If any such indication exists, the recoverable amount of the assets is estimated in order to determine the extent of the impairment loss (if any). Where it is not possible to estimate the recoverable amount of individual assets, the Bank estimates the recoverable amount of the cash-generating unit to which the assets belongs. Where a reasonable and consistent basis of allocation can be identified, corporate assets are also allocated to individual cash-generating units, or otherwise they are allocated to the smallest group of cash-generating units for which a reasonable and consistent allocation basis can be identified.
Intangible assets with indefinite useful lives and intangible assets not yet available for use are tested for impairment annually, and whenever there is an indication that the asset may be impaired.
Recoverable amount is the higher of fair value less costs to sell and value in use. In assessing value in use the estimated future cash flows are discounted to their present value using a pre-tax discount rate that reflects current market assessments of the time value of money and the risks specific to the asset for which the estimates of future cash flows have not been adjusted.
i) Premises and equipment
Premises and equipment are stated at historical cost less accumulated depreciation. Depreciation is computed principally on the straight line method. Rates in effect are designed to allocate the cost of assets to their residual values over their estimated useful lives. The following rates are used:
Freehold properties - 2%Leasehold properties and improvements - 2% to 10%Equipment - 10%to25%
Freehold land is not depreciated.
Management reviews the estimated useful lives, residual values and method of depreciation at each year-end. Any changes are accounted for prospectively as a change in accounting estimate.
Gains and losses on disposal of premises and equipment are determined by reference to their carrying amounts and are taken into account in determining profit before tax. Cost of repairs and renewals are charged to the Statement of Comprehensive Income when the expenditure is incurred.
Borrowing costs incurred primarily for the purpose of acquiring, constructing or producing an asset that necessarily takes a substantial period of time to get ready for its intended use is capitalised as part of its cost. Borrowing costs capitalised will be mainly interest costs and exchange differences arising on foreign currency borrowings.
j) Impairment of non-financial assets
Assets that have an indefinite useful life are not subject to amortisation and are tested annually for impairment. Assets that are subject to amortisation are reviewed for impairment whenever events or changes in circumstances indicate that the carrying amount may not be recoverable. An impairment loss is recognised for the amount by which the asset’s carrying amount exceeds its recoverable amount. The recoverable amount is the higher of an asset’s fair value less costs to sell and value in use.
k) Cash and cash equivalents
Cash and cash equivalents comprise cash balances on hand and deposits with other banks, and short term investments with maturities of less than three months.
l) Leases
Leases entered into by the Bank are all operating leases. Payments made under operating leases are charged to the statement of comprehensive income on a straight line basis over the period of the lease.
m) Provisions
Provisions are recognised when the Bank has a present legal or constructive obligation as a result of past events, it is probable that an outflow of resources embodying economic benefits will be required to settle the obligations, and a reliable estimate of the amount of the obligation can be made.
The amount recognised as a provision is the best estimate of the consideration required to settle the present obligation at the end of the reporting period, taking into account the risks and uncertainties surrounding the obligation. Where a provision is measured using the cash flows estimated to settle the present obligation, its carrying amount is the present value of those cash flows.
Where there are a number of similar obligations, the likelihood that an outflow will be required in settlement is determined by considering the class of obligations as a whole. A provision is recognised even if the likelihood of an outflow with respect to any one item included in the same class of obligations may be small.
n) Dividends
Dividends that are proposed and declared during the period are accounted for as an appropriation of retained earnings in the statement of changes in equity.
Dividends that are proposed and declared after the statement of financial position date are not shown as a liability on the statement of financial position but are disclosed as a note to the financial statements.
o) Taxation
Current tax
The tax currently payable is based on taxable profit for the year. Taxable profit differs from profit as reported in the statement of comprehensive income because of items of income or expense that are taxable or deductible in other years and items that are never taxable or deductible. The Group’s liability for current tax is calculated using tax rates that have been enacted or substantively enacted by the end of the reporting period.
Deferred tax
Deferred tax is recognised on temporary differences between the carrying amounts of assets and liabilities in the financial statements and the corresponding tax bases used in the computation of taxable profit. Deferred tax liabilities are generally recognised for all taxable temporary differences.
Deferred tax assets are generally recognised for all deductible temporary differences to the extent that it is probable that taxable profits will be available against which those deductible temporary differences can be utilised. Such deferred tax assets and liabilities are not recognised if the temporary difference arises from goodwill or from the initial recognition (other than in a business combination) of other assets and liabilities in a transaction that affects neither the taxable profit nor the accounting profit.
Deferred tax liabilities are recognised for taxable temporary differences associated with investments in subsidiaries and associates, and interests in joint ventures, except where the Group is able to control the reversal of the temporary difference and it is probable that the temporary difference will not reverse in the foreseeable future. Deferred tax assets arising from deductible temporary differences associated with such investments and interests are only recognised to the extent that it is probable that there will be sufficient taxable profits against which to utilise the benefits of the temporary differences and they are expected to reverse in the foreseeable future.
The carrying amount of deferred tax assets is reviewed at the end of each reporting period and reduced to the extent that it is no longer probable that sufficient taxable profits will be available to allow all or part of the asset to be recovered.
Deferred tax assets and liabilities are measured at the tax rates that are expected to apply in the period in which the liability is settled or the asset realised, based on tax rates (and tax laws) that have been enacted or substantively enacted by the end of the reporting period. The measurement of deferred tax liabilities and assets reflects the tax consequences that would follow from the manner in which the Group expects, at the end of the reporting period, to recover or settle the carrying amount of its assets and liabilities.
Deferred tax assets and liabilities are offset when there is a legally enforceable right to set off current tax assets against current tax liabilities and when they relate to income taxes levied by the same taxation authority and the Group intends to settle its current tax assets and liabilities on a net basis.
Current and deferred tax for the period
Current and deferred tax are recognised as an expense or income in profit or loss, except when they relate to items that are recognised outside profit or loss (whether in other comprehensive income or directly in equity), in which case the tax is also recognised outside profit or loss, or where they arise from the initial accounting for a business combination. In the case of a business combination, the tax effect is taken into account in the accounting for the business combination.
p) Acceptances, guarantees, indemnities and letters of credit
The Bank’s potential liability under acceptances, guarantees and letters of credit is reported as a contingent liability. The Bank has equal and offsetting claims against its customers in the event of a call on these commitments.

27
Financial Statements 31 October 2010 - continued(expressed in Trinidad & Tobago dollars)
Notes to the financial statements2 Significant accounting policies (continued)
q) Revenue recognition
i) Interest income and expense
Interest income and expense are recognised in the statement of comprehensive income for all interest bearing instruments on an accrual basis using the effective interest method. The effective interest method is a method of calculating the amortised cost of a financial asset or a financial liability and of allocating the interest income or interest expense over the relevant period. The effective interest rate is the rate that exactly discounts estimated future cash payments or receipts through the expected life of the financial instrument or, when appropriate, a shorter period to the net carrying amount of the financial asset or financial liability. When calculating the effective interest rate, the Bank estimates cash flows consider-ing all contractual terms of the financial instruments but does not consider future credit losses. The calculation includes all fees paid or received between parties to the contract that are an integral part of the effective interest rate, transaction costs and all other premiums and discounts.
Once a financial asset or a group of similar assets has been written down as a result of an impairment loss, interest income is recognised using the rate of interest used to discount the future cash flows for the purpose of measuring the impairment loss.
ii) Fee and commission income
Fees and commissions are generally recognised on an accrual basis when the service has been provided. Fees and commissions primarily include fees from loan commitments and administration, letters of credit, deposit accounts, custody and processing services, debit and credit card products and other financial service-related products. Loan commitment fees for loans that are likely to be drawn down are deferred (together with related direct costs) over the term of the loan. Portfolio and other management advisory and service fees are recognised based on the applicable service contracts, usually on a time-apportionate basis. Other service related fees are recognised rateably over the period in which the service is provided. Performance linked fees or fee components are recognised when the performance criteria is fulfilled.
r) Employee benefits
The Bank’s employees are members of the parent company’s group pension plan. The plan is a defined contribution plan, the assets of which are held in a separate trustee-administered fund. The plan is funded by payments from the Bank based on the recommendations of independent consultants who value the plan once every three years. The Bank’s contribution to the plan is charged to the statement of comprehensive income in the year to which it relates.
s) Financial Liabilities
Financial liabilities are classified as either financial liabilities at Fair Value Through Profit and Loss (FVTPL) or other financial liabilities.
Financial liabilities at FVTPL
Financial liabilities are classified as at FVTPL where the financial liability is either held for trading or it is designated as at FVTPL.
A financial liability is classified as held for trading if:
• it has been incurred principally for the purpose ofrepurchasing in the near future; or
• itisapartofanidentifiedportfoliooffinancialinstrumentsthat the Group manages together and has a recent actual pattern of short-term profit-taking; or
• it is a derivative that is not designated and effective as ahedging instrument.
A financial liability other than a financial liability held for trading may be designated as at FVTPL upon initial recognition if:
• such designation eliminates or significantly reduces ameasurement or recognition inconsistency that would otherwise arise; or
• the financial liability forms part of a group of financialassets or financial liabilities or both, which is managed
and its performance is evaluated on a fair value basis, in accordance with the Group’s documented risk management or investment strategy, and information about the grouping is provided internally on that basis; or
• itformspartofacontractcontainingoneormoreembeddedderivatives, and IAS 39 permits the entire combined contract (asset or liability) to be designated as at FVTPL.
Financial liabilities at FVTPL are stated at fair value, with any resultant gain or loss recognised in profit or loss. The net gain or loss recognised in profit or loss incorporates any interest paid on the financial liability
Other financial liabilities
Other financial liabilities, including borrowings, are initially measured at fair value net of transaction costs.
Other financial liabilities are subsequently measured at amortised cost using the effective interest method, with interest expense recognised on an effective yield basis.
The effective interest method is a method of calculating the amortised cost of a financial liability and of allocating interest expense over the relevant period. The effective interest rate is the rate that exactly discounts estimated future cash payments through the expected life of the financial liability, or, where appropriate, a shorter period.
Derecognition of financial liabilities
The Group derecognises financial liabilities when, and only when, the Group’s obligations are discharged, cancelled or they expire.
t) Other post-retirement benefits
The Bank also provides post-retirement medical benefits to its retirees through the parent company’s plan. The entitlement to these benefits is conditional on the employee remaining in service up to retirement age and the completion of a minimum service period. The cost of providing benefits is determined using the Projected Unit Method, with actuarial valuations being carried out at the end of each reporting period. Actuarial gains and losses that exceed 10 per cent of the greater of the present value of the Bank’s defined benefit obligation and the fair value of plan assets as at the end of the prior year are amortised over the expected average remaining working lives of the participating employees. Past service cost is recognised immediately to the extent that the benefits are already vested, and otherwise is amortised on a straight-line basis over the average period until the benefits become vested.
A valuation of these obligations is carried out by independent qualified actuaries annually.
u) Comparative information
Where necessary, comparative figures have been adjusted to conform with changes in presentation in the current year. Adjustments to previously reported results were made in accordance with International Accounting Standard #8 – Accounting policies, changes in accounting estimates and errors. The impact of these adjustments and reclassifications are summarised in Note 30 - Restatements and reclassifications.
3 Critical accounting estimates and judgments in applying accounting policies
The Bank makes estimates and assumptions that affect the reported amounts of assets and liabilities within the next financial year. Estimates and judgments are continually evaluated andare based on historical experience and other factors, including expectations of future events that are believed to be reasonable under the circumstances.
a) Impairment losses on financial assets
The Bank reviews its loan and investment portfolios to as-sess impairment at least on a quarterly basis. In determining whether an impairment loss should be recorded in the state-ment of comprehensive income, the Bank makes judgments as to whether there is any observable data indicating that there is a measurable decrease in the estimated future cash flows from a portfolio of assets before the decrease can be identified with an individual asset in that portfolio. This evidence may include observable data indicating that there has been an adverse change in the payment status of borrowers in a group, or na-tional or local economic conditions that correlate with default on assets in the Group. Management uses estimates based on
historical loss experience for assets with credit risk character-istics and objective evidence of impairment similar to those in the portfolio when rescheduling its future cash flows. The methodology and assumptions used for estimating both the amount and timing of future cash flows are reviewed regularly to reduce any differences between loss estimates and actual loss experience.
b) Fair value of financial instruments including derivatives
The fair value of financial instruments that are not quoted in active markets are determined by using valuation techniques. Where valuation techniques (for example, models) are used to determine fair values, they are validated and periodically reviewed by qualified personnel independent of the area that created them. To the extent practical, models use only observable data, however areas such as credit risk (both own and counterparty), volatilities and correlations require management to make estimates.
c) Held to maturity investments
The Bank follows the guidance of IAS 39 on classifying non-derivative financial assets with fixed or determinable payments and fixed maturity as held-to-maturity. This classification requires significant judgment. In making this judgment, the Bank evaluates its intention and ability to hold such investments to maturity.
4 Cash on hand and due from banks
2010 2009 ($’000) ($’000)
Cash on hand 294,898 243,406Due from banks 1,202,066 472,652Treasury Bills -- 732,789Items in course of collection from other banks 191,155 122,070
1,688,119 1,570,917
Cash on hand represents cash held in tellers’ tills, the vault and cash dispensing machines.
Due from banks are deposits held with other banks on demand or for fixed periods not exceeding 90 days.
5 Balance with Central Bank
Primary reserve balance 3,070,786 1,875,542Secondary reserve balance 243,843 179,465
3,314,629 2,055,007
Under the Financial Institutions Act, 2008, every licensee is required to maintain a deposit with the Central Bank of Trinidad & Tobago, which shall bear a ratio to the total prescribed liabilities of that institution in such form and to such extent as the Central Bank, may prescribe from time to time.
At 31 October 2010, the primary reserve requirement was 17% (2009 – 17%) of specific deposit liabilities. This balance is held in a non-interest bearing reserve account. The Bank also maintains a secondary reserve requirement of 2% (2009 – 2%) of specific deposit liabilities that yields interest at 0.50% (2009: 5.00%).
6 Loans and advances to customers
Retail 1,533,315 1,577,120Commercial/corporate 5,193,166 5,615,749Mortgages 1,165,658 914,281Other 1,165,841 1,164,796
Gross loans and advances to customers 9,057,980 9,271,946Unearned interest (1,372) (125,984)
9,056,608 9,145,962Interest receivable 46,347 99,689Allowance for impairment losses (238,626) (188,285)
8,864,329 9,057,366 Neither past due nor impaired 6,669,028 7,885,351Past due but not impaired 1,303,207 996,888Impaired 1,085,745 389,707
Gross loans and advances to customers 9,057,980 9,271,946
28
Financial Statements 31 October 2010 - continued(expressed in Trinidad & Tobago dollars)
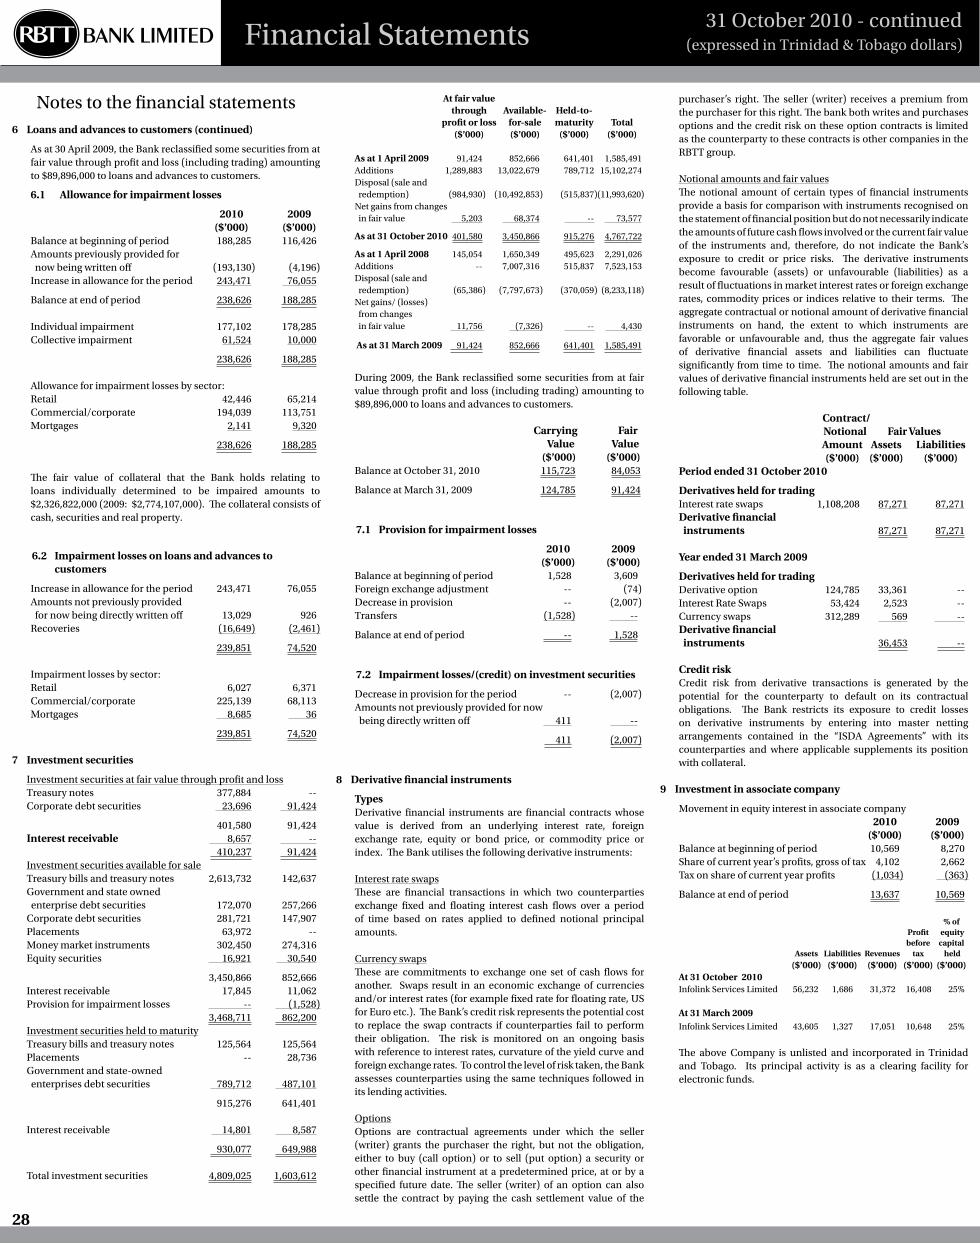
Notes to the financial statements6 Loans and advances to customers (continued)
As at 30 April 2009, the Bank reclassified some securities from at fair value through profit and loss (including trading) amounting to $89,896,000 to loans and advances to customers.
6.1 Allowance for impairment losses
2010 2009 ($’000) ($’000)
Balance at beginning of period 188,285 116,426Amounts previously provided for now being written off (193,130) (4,196)Increase in allowance for the period 243,471 76,055
Balance at end of period 238,626 188,285 Individual impairment 177,102 178,285Collective impairment 61,524 10,000
238,626 188,285 Allowance for impairment losses by sector: Retail 42,446 65,214Commercial/corporate 194,039 113,751Mortgages 2,141 9,320
238,626 188,285
The fair value of collateral that the Bank holds relating to loans individually determined to be impaired amounts to $2,326,822,000 (2009: $2,774,107,000). The collateral consists of cash, securities and real property.
6.2 Impairment losses on loans and advances to customers
Increase in allowance for the period 243,471 76,055Amounts not previously provided for now being directly written off 13,029 926Recoveries (16,649) (2,461)
239,851 74,520 Impairment losses by sector: Retail 6,027 6,371Commercial/corporate 225,139 68,113Mortgages 8,685 36
239,851 74,520
7 Investment securities
Investment securities at fair value through profit and loss Treasury notes 377,884 --Corporate debt securities 23,696 91,424
401,580 91,424Interest receivable 8,657 -- 410,237 91,424Investment securities available for sale Treasury bills and treasury notes 2,613,732 142,637Government and state owned enterprise debt securities 172,070 257,266Corporate debt securities 281,721 147,907Placements 63,972 --Money market instruments 302,450 274,316Equitysecurities 16,921 30,540
3,450,866 852,666Interest receivable 17,845 11,062Provision for impairment losses -- (1,528) 3,468,711 862,200Investment securities held to maturity Treasury bills and treasury notes 125,564 125,564Placements -- 28,736Government and state-owned enterprises debt securities 789,712 487,101
915,276 641,401 Interest receivable 14,801 8,587
930,077 649,988 Total investment securities 4,809,025 1,603,612
At fair value through Available- Held-to- profit or loss for-sale maturity Total ($’000) ($’000) ($’000) ($’000)
As at 1 April 2009 91,424 852,666 641,401 1,585,491Additions 1,289,883 13,022,679 789,712 15,102,274Disposal (sale and redemption) (984,930) (10,492,853) (515,837) (11,993,620)Net gains from changes in fair value 5,203 68,374 -- 73,577
As at 31 October 2010 401,580 3,450,866 915,276 4,767,722
As at 1 April 2008 145,054 1,650,349 495,623 2,291,026Additions -- 7,007,316 515,837 7,523,153Disposal (sale and redemption) (65,386) (7,797,673) (370,059) (8,233,118)Net gains/ (losses) from changes in fair value 11,756 (7,326) -- 4,430
As at 31 March 2009 91,424 852,666 641,401 1,585,491
During 2009, the Bank reclassified some securities from at fair value through profit and loss (including trading) amounting to $89,896,000 to loans and advances to customers.
Carrying Fair Value Value ($’000) ($’000)
Balance at October 31, 2010 115,723 84,053
Balance at March 31, 2009 124,785 91,424
7.1 Provision for impairment losses
2010 2009 ($’000) ($’000)
Balance at beginning of period 1,528 3,609Foreign exchange adjustment -- (74)Decrease in provision -- (2,007)Transfers (1,528) --
Balance at end of period -- 1,528
7.2 Impairment losses/(credit) on investment securities
Decrease in provision for the period -- (2,007)Amounts not previously provided for now being directly written off 411 --
411 (2,007)
8 Derivative financial instruments
TypesDerivative financial instruments are financial contracts whose value is derived from an underlying interest rate, foreign exchange rate, equity or bond price, or commodity price or index. The Bank utilises the following derivative instruments:
Interest rate swapsThese are financial transactions in which two counterparties exchange fixed and floating interest cash flows over a period of time based on rates applied to defined notional principal amounts.
Currency swapsThese are commitments to exchange one set of cash flows for another. Swaps result in an economic exchange of currencies and/or interest rates (for example fixed rate for floating rate, US forEuroetc.).TheBank’screditriskrepresentsthepotentialcostto replace the swap contracts if counterparties fail to perform their obligation. The risk is monitored on an ongoing basis with reference to interest rates, curvature of the yield curve and foreign exchange rates. To control the level of risk taken, the Bank assesses counterparties using the same techniques followed in its lending activities.
OptionsOptions are contractual agreements under which the seller (writer) grants the purchaser the right, but not the obligation, either to buy (call option) or to sell (put option) a security or other financial instrument at a predetermined price, at or by a specified future date. The seller (writer) of an option can also settle the contract by paying the cash settlement value of the
purchaser’s right. The seller (writer) receives a premium from the purchaser for this right. The bank both writes and purchases options and the credit risk on these option contracts is limited as the counterparty to these contracts is other companies in the RBTT group.
Notional amounts and fair valuesThe notional amount of certain types of financial instruments provide a basis for comparison with instruments recognised on the statement of financial position but do not necessarily indicate the amounts of future cash flows involved or the current fair value of the instruments and, therefore, do not indicate the Bank’s exposure to credit or price risks. The derivative instruments become favourable (assets) or unfavourable (liabilities) as a result of fluctuations in market interest rates or foreign exchange rates, commodity prices or indices relative to their terms. The aggregate contractual or notional amount of derivative financial instruments on hand, the extent to which instruments are favorable or unfavourable and, thus the aggregate fair values of derivative financial assets and liabilities can fluctuate significantly from time to time. The notional amounts and fair values of derivative financial instruments held are set out in the following table.
Contract/ Notional Fair Values Amount Assets Liabilities ($’000) ($’000) ($’000)Period ended 31 October 2010
Derivatives held for trading Interest rate swaps 1,108,208 87,271 87,271Derivative financial instruments 87,271 87,271 Year ended 31 March 2009
Derivatives held for trading Derivative option 124,785 33,361 --Interest Rate Swaps 53,424 2,523 --Currency swaps 312,289 569 --Derivative financial instruments 36,453 --
Credit riskCredit risk from derivative transactions is generated by the potential for the counterparty to default on its contractual obligations. The Bank restricts its exposure to credit losses on derivative instruments by entering into master netting arrangements contained in the “ISDA Agreements” with its counterparties and where applicable supplements its position with collateral.
9 Investment in associate company
Movement in equity interest in associate company 2010 2009 ($’000) ($’000)
Balance at beginning of period 10,569 8,270Share of current year’s profits, gross of tax 4,102 2,662Tax on share of current year profits (1,034) (363)
Balance at end of period 13,637 10,569 % of Profit equity before capital Assets Liabilities Revenues tax held
($’000) ($’000) ($’000) ($’000) ($’000)At 31 October 2010 Infolink Services Limited 56,232 1,686 31,372 16,408 25% At 31 March 2009 Infolink Services Limited 43,605 1,327 17,051 10,648 25%
The above Company is unlisted and incorporated in Trinidad and Tobago. Its principal activity is as a clearing facility for electronic funds.

29
Financial Statements 31 October 2010 - continued(expressed in Trinidad & Tobago dollars) Financial Statements 31 October 2010 - continued
(expressed in Trinidad & Tobago dollars)
Notes to the financial statements10 Intangible assets - software
2010 2009 ($’000) ($’000)
Opening net carrying value 83,499 75,603Additions 198,634 22,243Amortisation charge for the year (17,171) (14,347)
Closing net carrying amount 264,962 83,499
Cost 431,622 232,987Accumulated amortisation (166,660) (149,488)
Net book value 264,962 83,499
Included in premises and equipment is floor space leased to third parties under operating leases:
Aggregate rentals receivable 2010 2009 ($’000) ($’000)
Not later than one year -- 382Later than one year and no later than five years -- 553 -- 935
12 Deferred taxation
The following amounts are shown in the statement of financial position: Deferred tax asset 64,283 39,454Deferred tax liability (28,621) (6,143)
35,662 33,311The movement on the deferred tax account is as follows: At beginning of period 33,311 (3,005)Statement of comprehensive income (charge)/credit (Note 24) 18,848 39,494Investment revaluation reserve - Gains from changes in fair value (22,791) 2,442- Gains transferred to the statement of comprehensive income 6,294 (5,620)At end of period 35,662 33,311
Deferred tax assets and liabilities are attributable to the following items:
Deferred tax asset Available for sale securities -- 3,035General provision 15,381 --Other 681 --Post-retirement benefits 48,221 36,419
64,283 39,454Deferred tax liability Accelerated tax depreciation (15,159) (6,143)Available for sale securities (13,462) --
(28,621) (6,143)
13 Other assets
Corporation tax recoverable 10,789 10,789Other 246,554 65,959
257,343 76,748
11 Premises and equipment
Leasehold Capital Freehold Leasehold improve- work in properties properties ments Equipment progress Total ($’000) ($’000) ($’000) ($’000) ($’000) ($’000)
Period ended 31 October 2010 Opening net book value 87,364 27,101 12,378 97,043 12,616 236,502Additions -- -- -- -- 31,544 31,544Disposals -- -- -- (1,598) -- (1,598)Transfers 1,371 -- 1,419 17,173 (19,963) --Depreciation charge (3,498) (333) (3,916) (35,506) -- (43,253)
Closing net book value 85,237 26,768 9,881 77,112 24,197 223,195At 31 October 2010 Cost 116,126 30,657 44,230 348,475 24,197 563,685Accumulated Depreciation (30,889) (3,889) (34,349) (271,363) -- (340,490)
Net book value 85,237 26,768 9,881 77,112 24,197 223,195
Year ended 31 March 2009 Opening net book value 91,004 26,740 14,429 107,243 18,769 258,185Additions -- -- -- -- 14,430 14,430Disposals (3,155) (390) -- (143) -- (3,688)Transfers 1,332 1,322 507 17,422 (20,583) --Depreciation charge (1,817) (571) (2,558) (27,479) -- (32,425)
Closing net book value 87,364 27,101 12,378 97,043 12,616 236,502At 31 March 2009 Cost 114,755 30,657 42,811 335,478 12,616 536,317Accumulated Depreciation (27,391) (3,556) (30,433) (238,435) -- (299,815)
Net book value 87,364 27,101 12,378 97,043 12,616 236,502
14 Customers’ deposits
2010 2009 ($’000) ($’000)
Deposit balances 16,402,545 13,396,175Accrued interest 16,556 39,942
16,419,101 13,436,117Sectoral analysis Consumers 10,677,301 6,263,659Private sector 4,128,061 4,684,790State sector 1,113,123 2,124,552Other 484,060 323,174
16,402,545 13,396,175
15 Post-retirement benefit obligations
The Bank provides post-retirement benefits to its retirees. The entitlement to these benefits is conditional on the employee remaining in service up to retirement age and the completion of a minimum service period.
These post-retirement benefits, which include medical, group life and pensions were previously carried by the parent company, RBC Financial (Caribbean) Limited and this is the first time that these post-retirement benefit obligations have been reflected in the Bank’s financial statements. Details of the post-retirement benefits are not available prior to 31 March 2009, hence the Bank has not been able to restate its records prior to this date and no statement of financial position and associated notes as at 31 March 2008 have been presented.
The most recent actuarial valuation of the present value of the obligations was carried out at 30 September 2010 by Bacon Woodrow & de Souza Limited using the Projected Unit Method.
(i) The amounts recognised on the statement of financial position for the post-retirement benefit plans are as follows:
Period ended 31 October 2010 Defined pension Medical Group life benefit Total ($’000) ($’000) ($’000) ($’000)
Post-retirement benefit obligation 59,181 8,402 111,303 178,886Unrecognised actuarial gain/ (loss) 14,451 (455) -- 13,996
Liability in the statement of financial position 73,632 7,947 111,303 192,882
Year ended 31 March 2009
Post-retirement benefit obligation 48,949 5,773 69,039 123,761Unrecognised actuarial gain 20,450 1,465 -- 21,915
Liability in the statement of financial position 69,399 7,238 69,039 145,676
(ii) The movements in the liability recognised on the statement of financial position are as follows: Period ended 31 October 2010
At the beginning of period 69,399 7,238 69,039 145,676Net benefit cost 6,396 1,200 46,623 54,219Benefits paid by Group (net of retiree’s premiums) (2,163) (491) (4,359) (7,013)
At end of period 73,632 7,947 111,303 192,882
Year ended 31 March 2009
At the beginning of year -- -- -- --Net benefit cost 70,846 7,409 69,039 147,294Benefits paid by Group (net of retiree’s premiums) (1,447) (171) -- (1,618)
At end of year 69,399 7,238 69,039 145,676
(iii) Change in post-retirement benefit obligation:
19 months to 31 October 2010
Defined benefit obligation at beginning of period 48,949 5,773 69,039 123,761Current service cost 2,365 415 1,712 4,492Interest cost 6,268 815 10,041 17,124Actuarial gains 3,762 1,890 34,870 40,522Benefits paid (2,163) (491) (4,359) (7,013)
Defined benefit obligation at end of period 59,181 8,402 111,303 178,886

30
Financial Statements 31 October 2010 - continued(expressed in Trinidad & Tobago dollars)
Notes to the financial statements15 Post-retirement benefit obligations (continued)
(iii) Change in post-retirement benefit obligation (continued):
12 months to 31 March 2009
Defined pension Medical Group life benefit Total ($’000) ($’000) ($’000) ($’000) Defined benefit obligation at beginning of year -- -- -- --Current service cost 69,271 5,628 69,039 143,938Interest cost 3,979 469 -- 4,448Actuarial gains (22,854) (153) -- (23,007)Benefits paid (1,447) (171) -- (1,618)
Defined benefit obligation at end of year 48,949 5,773 69,039 123,761
( iv) The amounts recognised in the statement of comprehensive income are as follows:
19 months to 31 October 2010
Current service cost 2,365 415 1,712 4,492Interest cost 6,268 815 10,041 17,124Actuarial (gains) /losses amortised (2,237) (30) 34,870 32,603
Net benefit cost included in staff costs 6,396 1,200 46,623 54,219
12 months to 31 March 2009
Current service cost 67,812 7,087 69,039 143,938Interest cost 3,979 469 -- 4,448Actuarial gains amortised (945) (147) -- (1,092)
Net benefit cost included in staff costs 70,846 7,409 69,039 147,294
The principal actuarial assumptions used were as follows:
2010 2009
Discount rates – medical and life 6.25% 8.75%Discount rates – pension 6.00% 7.00%Medical costs trend rates 5.00% 7.00%Salary increases 4.50% -5.00% 5.5%-7.00%
16 Other liabilities
2010 2009 ($’000) ($’000)
Accruals and payables 14,216 381Deferred income 72,274 53,156Other 483,372 334,523
569,862 388,060
17 Share capital
Authorised An unlimited number of ordinary shares of no par value Issued and fully paid 147,428,485 ordinary shares of no par value 403,970 403,970
18 Statutory reserve
At beginning of period 378,434 284,022Transfer from retained earnings 140,536 94,412
At end of period 518,970 378,434
The Financial Institutions Act, 2008 requires financial institutions in Trinidad & Tobago to transfer annually a minimum of 10% of its profit after taxation to a reserve fund until the balance on this reserve is not less than the paid up capital of the institution.
19 Other reserves
Investment revaluation reserve 40,388 (9,104)General reserve 604 604
Balance at end of period 40,992 (8,500)
19.1 Investment revaluation reserve
Balance at beginning of period (9,104) (18,636)Fair value gains/(losses) arising during the period, net of tax 68,374 (7,326)Realised (gains)/losses transferred to income, net of tax (18,882) 16,858
Balance at end of period 40,388 (9,104)
19.2 General reserve
2010 2009 ($’000) ($’000)
Balance at beginning of period 604 --Transfer from retained earnings -- 604
Balance at end of period 604 604
20 Interest income
Loans and advances to customers 1,485,069 1,020,648Investment securities 178,014 178,319Due from affiliated companies 68,220 44,849Due from banks 17,782 49,386
1,749,085 1,293,202
21 Interest expense
Customers’ deposits 188,425 361,812Other funding instruments -- 2,203Other borrowed funds -- 10,343Due to affiliated companies 21,629 25,132Due to banks 13,729 33,333
223,783 432,823
22 Other income
Fees and commissions 464,498 252,432Net trading gains/(losses) (See Note 22.1) 30,380 (10,723)Foreign exchange earnings 200,617 168,893Sundry income 15,800 10,902
711,295 421,504
22.1 Net trading gains/ (losses):
Investment securities at fair value through profit or loss - Unrealised gains/(losses) 2,987 (48,429)Investment securities at fair value through profit or loss - Realised (losses)/gains (2,616) 7,612Derivative financial instruments - Unrealised(losses)/gains (3,078) 49,519Derivative financial instruments -Realised gains 7,910 3,052Investment securities available for sale - Realised gains /(losses) 25,177 (22,477)
30,380 (10,723)
23 Operating expenses
2010 2009 ($’000) ($’000)
Staff costs (See Note 23.1) 547,643 489,100Other premises and equipment expenses 63,649 43,941Marketing and promotions 1,547 18,095Amortisation charge on intangible assets 17,171 14,347Depreciation charge on premises and equipment 43,253 32,425Deposit insurance premium (See Note 23.2) 31,333 16,739Operating lease rentals 65,320 43,206Directors’ remuneration 100 186Auditors’ remuneration 635 920Royalties 140,913 77,540Other operating expenses 265,579 162,780
1,177,143 899,279
23.1 Staff costs:
Wages and salaries 328,341 236,843Bonuses 37,641 29,435Employees’pensionbenefitexpense 33,715 20,548Employees’post-retirement benefit expense 54,219 147,294Other staff costs 93,727 54,980
547,643 489,100
23.2 Deposit insurance premium
Statutory regulations governing the operations of banks and other financial institutions in Trinidad & Tobago stipulate that an annual premium be paid to the Deposit Insurance Fund of 0.2% of average deposit liabilities outstanding at the end of each quarter of the preceding year.
24 Taxation
Current tax charge 127,719 113,480Green fund levy 2,585 1,900Prior years 86 --Deferred tax credit (Note 12) (18,848) (39,494)Share of tax charge of associate companies and joint venture (note 9) 1,034 363
112,576 76,249
The tax on the operating profit differs from the theoretical amount that would arise using the basic tax rate as follows:
Profit before tax 823,294 312,753
Prima facie tax calculated at a rate of 25% 205,824 78,188Income exempt from tax (19,329) (10,898)Expensesnotdeductiblefortaxpurposes 1,377 23,577Prior year 86 --Green fund levy 2,585 1,900Other (77,967) (16,518)
112,576 76,249
The deferred income tax credit for the period comprises the following temporary difference:
Accelerated tax depreciation 9,016 (3,075)Other (16,062) --Post-retirement medical benefits (11,802) (36,419)
Credit (18,848) (39,494)
Nineteen Months Year Ended Ended 31 October 31 March 2010 2009 ($’000) ($’000)
Income tax recognised in other comprehensive income Deferred taxArising on income and expenses recognised in other comprehensive income:Revaluations of available-for-sale financial asset (16,497) (3,177)
Financial Statements 31 October 2010 - continued(expressed in Trinidad & Tobago dollars)

31
Financial Statements 31 October 2010 - continued(expressed in Trinidad & Tobago dollars) Financial Statements 31 October 2010 - continued
(expressed in Trinidad & Tobago dollars)
Notes to the financial statements25 Dividends
Dividends accounted for as an appropriation of retained earnings are as follows: 2010 2009 ($’000) ($’000)
Final dividend 100,000 49,676Interim dividend 210,000 51,000
310,000 100,676
26 Financial risk management
26.1 Risk management
Risk is inherent in the Bank’s activities but it is managed through a process of ongoing identification, measurement and monitoring subject to risk limits and other controls. This process of risk management is critical to the Bank’s continuing profitability and is accountable for the risk exposures relating to its responsibilities. The Bank is exposed to credit risk, liquidity risk and market risk, the latter being subdivided into trading and non-trading risks.
The independent risk control process does not include business risks such as changes in the environment, technology and industry.
Risk management structure
While the Board of Directors is ultimately responsible for identifying and controlling risks, there are several bodies responsible for managing and monitoring risks.
Board of Directors
The Board of Directors is responsible for the overall risk management approach and for approving the risk strategies and principles.
Group Risk Management Unit
A centralised Risk Management Unit provides oversight of the implementation and maintenance of risk related procedures to ensure an independent control process. The Unit is also responsible for monitoring compliance with risk policies and limits across the Bank in the three key areas of credit risk, market risk and operational risk.
Group Asset/Liability Committee (ALCO)
The Bank utilises the Group ALCO which has a mandate that includes the recommendation of policies covering investments, liquidity and market risk to the Bank’s Board, and the monitoring of compliance with risk policies and limits in the areas of credit risk and market risk.
Mark to Market Committee
The Bank uses the Group’s established Mark to Market Committee which is responsible for the review and validation of the policies and procedures applied in the valuation of financial assets and liabilities.
Internal audit
Risk management processes throughout the Bank are audited by the Group’s Internal Audit function that examines both the adequacy of the procedures and the Bank’s compliance with the procedures. Internal Audit discusses the results of all assessments with management, and reports its findings and recommendations to the Board Audit Committee.
Risk measurement and reporting systems
The Bank’s risks are measured using methods which reflect the expected loss likely to arise in normal circumstances. The methods make use of probabilities derived from historical experience, adjusted to reflect the economic environment.
Monitoring and controlling risks is primarily performed based on limits established by the Bank. These limits reflect the business strategy and market environment of the Bank as well as the level of risk that the Bank is willing to accept, with additional emphasis on selected industries and geographies.
Information compiled is examined and processed in order to analyse, identify and control risks. This information which consists of several reports is presented and explained to the Board of Directors, the Board’s Committees and the Asset/Liability Committee. The reports include but are not limited to aggregate credit exposures, open currency positions, liquidity ratios and risk profile changes. On a quarterly basis, senior management assesses the appropriateness of the allowance for credit losses.
26.2 Categories of financial instruments
2010 2009 ($’000) ($’000)
Assets
Financial assets at fair value through profit or loss
Investment securities 410,237 91,424Derivative financial instruments 87,271 36,453
497,508 127,877Financial assets available for sale Investment securities 3,468,711 862,200 Financial assets at amortised costs
Held to maturity Investment securities 930,077 649,988 Loans and receivables Cash on hand and due from banks 1,688,119 1,570,917Balances with central banks 3,314,629 2,055,007Loans and advances to customers 8,864,329 9,057,366Investment in associate company 13,637 10,569Banker’s acceptances and participatory investments certificate 398,100 240,070Due from affiliated companies 746,892 2,353,470
15,025,706 15,287,399
Total financial assets 19,922,002 16,927,464 Non-financial assets 809,783 436,203Total assets 20,731,785 17,363,667 Liabilities Financial liabilities at fair value through profit or loss Derivative financial instruments 87,271 --
Liabilities (continued)Financial liabilities at amortised cost Due to banks 116,686 696,201Customers’ deposits 16,419,101 13,436,117Banker’s acceptances and participatory investments certificate 398,100 240,070Due to affiliated companies 661,474 606,417
17,595,361 14,978,805
Total financial liabilities 17,682,632 14,978,805
Non-financial liabilities 953,897 739,816
Total liabilities 18,636,529 15,718,621
Total equity 2,095,256 1,645,046
Total equity and liabilities 20,731,785 17,363,667
26.3 Liquidity Risk
Liquidity risk is the risk that the Bank will be unable to meet its payment obligations when they fall due under normal and stress circumstances. To limit this risk, management has arranged diversified funding sources in addition to its core deposit base and manages assets with liquidity in mind by monitoring future cash flows and the availability of high grade collateral which could be used to secure additional funding if required.
The Bank’s liquidity management process is carried out by the Treasury department and monitored by the Bank’s ALCO. The Bank’s liquidity strategy relies on sufficient cash and marketable instruments such as treasury bills and government securities to meet short term requirements. Fall back techniques include access to local inter-group and institutional markets, call features on selected advances, stand-by lines of credit with external parties, and the ability to close out or liquidate market positions. Daily float, liquid assets, funding concentration and diversification are all prudently managed to ensure that the Bank has sufficient funds to meet its obligations.
26.3.1 Non-derivative cash flows
The table below presents the cash flows payable by the Bank under non-derivative financial liabilities by remaining contractual maturities at the statement of financial position date. Up to one year One to five years Over five years Total ($’000) ($’000) ($’000) ($’000)As at 31 October 2010
Liabilities Due to banks 116,686 -- -- 116,686Customers’ deposits 16,323,175 95,926 -- 16,419,101Banker’s acceptances and participatory investments certificate 398,100 -- -- 398,100Due to affiliated companies 661,474 -- -- 661,474
Total liabilities (contractual maturity dates) 17,499,435 95,926 -- 17,595,361 As at 31 March 2009
Liabilities Due to banks 490,033 206,168 -- 696,201Customers’ deposits 13,433,755 2,362 -- 13,436,117Banker’s acceptances and participatory investments certificate 240,070 -- -- 240,070Due to affiliated companies 606,417 -- -- 606,417
Total liabilities (contractual maturity dates) 14,770,275 208,530 -- 14,978,805
26.3.2 Contingent liabilities and commitments
The table below summarises the Bank’s contingent liabilities and commitments based on contractual maturity dates.
As at 31 October 2010
Guarantees, acceptances, indemnities & letters of credit 604,722 -- -- 604,722Credit commitments 755,830 318,713 220,899 1,295,442Operating lease commitments 31,704 95,112 45,709 172,525Capital commitments 7,005 -- -- 7,005
1,399,261 413,825 266,608 2,079,694 As at 31 March 2009
Guarantees, acceptances, indemnities & letters of credit 1,184,640 -- -- 1,184,640Credit commitments 56,437 130,938 146,881 334,256Operating lease commitments 26,652 78,774 44,870 150,296Capital commitments 380 -- -- 380
1,268,109 209,712 191,751 1,669,572

32
Financial Statements 31 October 2010 - continued(expressed in Trinidad & Tobago dollars)
Notes to the financial statements
26 Financial risk management (continued)
26.4 Market risk
The Bank takes on exposure to market risk, which is the risk that the fair value or future cash flows of a financial instrument will fluctuate because of changes in market prices. Market risks arise from open positions in interest rate, currency and equity products, all of which are exposed to general and specific market movements and changes in the level of volatility of market rates or prices such as interest rates, credit spreads, foreign exchange rates and equity prices. The Bank separates exposures to market risk into either trading or non-trading portfolios.
The market risks arising from trading and non-trading activities are measured separately by the Bank’s Treasury department and the Group’s Market Risk Department. On a quarterly basis, the Mark to Market Committee reviews and approves the valuation of all investment securities and derivatives and submits reports to the Bank’s ALCO.
Non-trading portfolios primarily arise from the interest-rate management of the entity’s retail and commercial banking assets and liabilities. Non-trading portfolios also consist of interest rate, foreign exchange and equity risks arising from the Bank’s and available for sale investments.
26.4.1 Market risk measurement techniques
The major measurement technique used to measure and control market risk is stress testing. The Bank applies stress tests to provide an indication of the potential size of losses that could arise in extreme conditions. The stress tests carried out by Group Market Risk consist of risk sensitivity analyses by applying possible stress events such as changes to interest rates and foreign currency rates on the Bank’s positions.
26.4.2 Interest rate risk
Interest rate risk arises from the possibility that changes in interest rates will affect future cash flows or the fair values of financial instruments. The Board has established limits on the interest rate gaps for stipulated periods. Positions are monitored and hedging strategies are used to ensure positions are maintained within the established limits.
Sensitivity analyses were conducted to determine the effect on net profit and other components of equity arising from a reasonable change in interest rates with all other variables held constant.
Effect on Effect on other other Effect compo- Effect compo- on net nents of on net nents of profit equity profit equity 2010 2010 2009 2009 ($’000) ($’000) ($’000) ($’000)Change in interest rate + 1% 1,004 29,043 19,450 56,431
- 1% (1,004) (29,043) (19,450) (56,431)
26.4.3 Interest sensitivity of assets and liabilities to repricing risk
The table below summarises the Bank’s exposures to interest rate repricing risk. It includes the Bank’s financial instruments at carrying amounts, categorised by the earlier of contractual repricing or maturity dates.
Up to One to Over Non- One Five Five interest Year Years Years bearing Total ($’000) ($’000) ($’000) ($’000) ($’000) As at 31 October 2010 Assets Cash on hand and due from banks 1,567,448 120,000 -- 671 1,688,119Balances with Central Bank 1,954,629 1,360,000 -- -- 3,314,629Loans and advances to customers 5,751,641 2,920,889 145,454 46,345 8,864,329Investment securities 4,374,217 355,592 37,914 41,302 4,809,025Investment in associate company -- -- -- 13,637 13,637Derivatives financial instruments 87,271 -- -- -- 87,271Banker’s acceptances and participatory investments 398,100 -- -- -- 398,100Due from affiliated companies 439,648 59,207 248,000 37 746,892
Total financial assets 14,572,954 4,815,688 431,368 101,992 19,922,002 Liabilities Due to banks 116,686 -- -- -- 116,686Customers’ deposits 11,051,515 5,351,029 -- 16,557 16,419,101Derivative financial instruments 87,271 -- -- -- 87,271Banker’s acceptances and participatory investments 398,100 -- -- -- 398,100Due to affiliated companies 661,474 -- -- -- 661,474
Total liabilities 12,315,046 5,351,029 -- 16,557 17,682,632 Interest sensitivity gap 2,257,908 (535,341) 431,368 As at 31 March 2009 Assets Cash on hand and due from banks 1,099,742 150,000 -- 321,175 1,570,917Balances with Central Bank 695,007 1,360,000 -- -- 2,055,007Loans and advances to customers 6,431,963 2,332,891 192,823 99,689 9,057,366Investment securities 1,373,593 190,077 20,293 19,649 1,603,612Investment in associate company -- -- -- 10,569 10,569Derivatives financial instruments 33,361 -- -- 3,092 36,453Banker’s acceptances and participatory investments 240,070 -- -- -- 240,070Due from affiliated companies 2,335,570 1,518 358 16,024 2,353,470
Total financial assets 12,209,306 4,034,486 213,474 470,198 16,927,464 Liabilities Due to banks 593,579 -- -- 102,622 696,201Customers’ deposits 8,147,582 5,248,592 -- 39,943 13,436,117Banker’s acceptances and participatory investments 240,070 -- -- -- 240,070Due to affiliated companies 606,417 -- -- -- 606,417
Total liabilities 9,587,648 5,248,592 -- 142,565 14,978,805 Interest sensitivity gap 2,621,658 (1,214,106) 213,474
26.4.4 Other price risk
Other price risk arises due to the possibility that the fair value of future cash flows of a financial instrument will fluctuate because of changes in market prices (other than those arising from interest rate risk or currency risk), whether those changes are caused by factors specific to the individual financial instrument or its issuer, or factors affecting all similar financial instruments traded in the market. The Bank is affected by changing prices of equity instruments classified as investment securities available for sale with fair value movements recognised in shareholders’ equity. Management has determined that the impact of other price risk on equity instruments classified as available for sale is immaterial at the end of the current period and the prior year.
Financial Statements 31 October 2010 - continued(expressed in Trinidad & Tobago dollars)

33
Financial Statements 31 October 2010 - continued(expressed in Trinidad & Tobago dollars)
Notes to the financial statements26 Financial risk management (continued)
26.5 Currency risk
Currency risk is the risk that the value of a financial instrument will fluctuate due to changes in foreign exchange rates. The Board has set limits on positions by currency. Positions are monitored on a daily basis and hedging strategies are used to ensure positions are maintained within established limits.
26.5.1 Concentrations of currency risk – on and off-balance sheet financial instruments
Assets are primarily funded by like currency liabilities thus reducing the element of cross-currency risk. Currency exposure resides mainly in trading activity. The table below summarises the Bank’s exposure to foreign currency exchange rate risk.
TT US Other Total ($’000) ($’000) ($’000) ($’000)
As at 31 October 2010
Assets Cash on hand and due from banks 451,130 1,092,210 144,779 1,688,119Balances with Central Bank 3,314,629 -- -- 3,314,629Loans and advances to customers 6,930,704 1,933,625 -- 8,864,329Investment securities 4,313,105 429,484 66,436 4,809,025Investment in associate company 13,637 -- -- 13,637Due from affiliates 612,142 131,573 3,177 746,892Banker’s acceptances and participatory investments 391,730 6,370 -- 398,100Derivatives financial instruments -- 87,271 -- 87,271
Total financial assets 16,027,077 3,680,533 214,392 19,922,002 Liabilities Due to banks 1,638 44,164 70,884 116,686Customers’ deposits 12,366,598 3,939,389 113,114 16,419,101Due to affiliates 448,008 212,974 492 661,474Banker’s acceptances and participatory investments 391,730 6,370 -- 398,100Derivative financial instruments -- 87,271 -- 87,271
Total financial liabilities 13,207,974 4,290,168 184,490 17,682,632
Net balance sheet position 2,819,103 (609,635) 29,902 2,239,370
Credit commitments 577,778 717,664 -- 1,295,442 As at 31 March 2009
Total financial assets 12,174,437 4,442,510 310,517 16,927,464Total financial liabilities (9,792,928) (4,907,539) (278,338) (14,978,805)
Net balance sheet position 2,381,509 (465,029) 32,179 1,948,659
Credit commitments 246,800 87,456 -- 334,256
26.5.2 Currency risk non-trading portfolio
The table below demonstrates the sensitivity to reasonable possible movements of the US dollar against the Trinidad and Tobago dollar to which the Bank had significant exposure in respect of its non-trading financial assets and liabilities holding all other variables constant.
Change in currency rate Effect on in % in profit 31 October before tax Effect on 2010 2010 equity ($’000) ($’000)Currency USD (1) 5,786 --
Change in currency rate Effect on in % in profit 31 March before tax Effect on 2009 2009 equity ($’000) ($’000)Currency USD (1) 4,286 --
26.6 Credit risk
Credit risk is the risk that the Bank will incur a loss because its customers, clients or counterparties failed to discharge their contractual obligations. The Bank manages and controls credit risk by setting limits on the amount of risk it is willing to accept for individual counterparties and for geographical and industry concentrations, and by monitoring exposures in relation to such limits.
The Bank has established a credit quality review process to provide early identification of possible changes in the creditworthiness of counterparties, including regular collateral reviews. Counterparty limits for Corporate and Commercial counterparties are established by the use of a credit risk classification system, which assigns each counterparty a risk rating. Risk ratings are subject to regular revision. For the retail portfolio the Bank has stringent lending criteria which include conservative debt service coverage, loan to value ratios and stability of earnings. These exposures are continuously monitored to identify any change in the credit worthiness of the borrower. The credit quality review process allows the Bank to assess the potential loss as a result of the risks to which it is exposed and take corrective action.
Loans and advances to customers
The Bank measures the credit risk of loan and advances to Corporate and Commercial customers and to banks at the counterparty level using an internal risk rating matrix. The ratings are generated by combining weighted financial and statistical criteria with credit officer judgment which is mapped against established internal benchmarks at the time credit is granted. The Bank risk rating is seven tiered as shown below and reflects the perceived counterparty risk. This means that, in principle, exposures migrate between levels as the assessment of their riskiness changes. The risk weightings and internal benchmarks are consistently reviewed and upgraded as necessary.
26.6.1 Credit risk management
The Bank’s internal ratings scale and mapping of external ratings are as follows:
Bank’s rating Description of the grade Credit quality1 Excellent Highgrade2 Very Good High grade3 Good Standard grade4 Special Mention Substandard grade5 Unacceptable Past due or impaired6 Bad and Doubtful Past due or impaired7 Virtual Certain Loss Past due or impaired
Loans and advances to customers
The ratings of the major rating agency shown in the table above are mapped to our rating classes based on the long-term average default rates of each external grade. The Bank uses the external ratings where available to benchmark our internal credit risk assessment. Observed defaults per rating category vary year on year, especially over an economic cycle.
Debt securities and other bills
For debt securities and other bills, external rating such as Standard & Poor’s rating or their equivalents are used by the Bank for managing of the credit risk exposures.
26.6.2 Risk limit control and mitigation policies
The Bank structures the levels of credit risk it undertakes by placing limits on the amount of risk accepted in relation to one borrower, or group of borrowers, and to geographical and industry segments. Such risks are monitored on a revolving basis and subject to an annual or more frequent review when considered necessary. Limits on the level of credit risk by product, industry sector and by country are approved by the Board of Directors.
Collateral
The Bank employs a range of policies and practices to mitigate credit risk. The most traditional of these is the taking of security for funds advances. The Bank implements guidelines on the acceptability of specific classes of collateral or credit risk mitigation. The principal collateral types for loans and advances to customers are:
• Mortgagesoverresidentialproperties;• Chargesoverbusinessassetssuchaspremises,inventoryandaccountsreceivable;• Chargesoverfinancialinstrumentssuchasdebtsecuritiesandequities.
Management monitors the market value of collateral, requests additional collateral in accordance with the underlying agreement and monitors the market value of collateral obtained during its periodic review of loan accounts in arrears.
Derivatives
The amount subject to credit risk is limited to the current fair value of instruments that are favorable to the Bank (i.e. assets where their fair value is positive), which in relation to derivatives is only a small fraction of the contract, or notional values used to express the volume of instruments outstanding. This credit risk exposure is managed as part of the overall lending limits with customers, together with potential exposures from market movements. Collateral or other security is not usually obtained for credit risk exposures on these instruments, except where the Bank requires margin deposits from counterparties.
Master netting arrangements
The Bank further restricts its exposure to credit losses by entering into master netting arrangements with counterparties with which it undertakes a significant volume of transactions. Master netting arrangements do not generally result in an offset of statement of financial position assets and liabilities, as transactions are usually settled on a gross basis. However, the credit risk associated with favorable contracts is reduced by a master netting arrangement to the extent that if a default occurs, all amounts with the counterparty are terminated and settled on a net basis.

34
Financial Statements 31 October 2010 - continued(expressed in Trinidad & Tobago dollars)
Notes to the financial statements
26 Financial risk management (continued)
26.6 Credit risk (continued)
26.6.2 Risk limit control and mitigation policies (continued)
Credit-related commitments
The primary purpose of these instruments is to ensure that funds are available to a customer as required. Guarantees and standby letters of credit carry the same credit risk as loans. Documentary and commercial letters of credit – which are written undertakings by the Bank on behalf of a customer authorising a third party to draw drafts on the Bank up to a stipulated amount under specific terms and conditions – are collateralised by the underlying shipments of goods to which they relate and therefore carry less risk than a direct loan.
26.6.3 Impairment and provisioning policies
Impairment provisions are recognised for financial reporting purposes only for losses that have been incurred at the statement of financial position date based on objective evidence of impairment (see Note 2e). Due to the different methodologies applied, the amount of incurred credit losses provided for in the financial statements are usually lower than the amount determined from the expected loss model that is used for banking regulation purposes.
The Bank’s policy requires the review of individual financial assets that are above materiality thresholds at least annually or more regularly when individual circumstances require. Impairment allowances on individually assessed accounts are determined by an evaluation of the incurred loss at statement of financial position date on a case-by-case basis, and are applied to all individually significant accounts.
The assessment normally encompasses collateral held (including re-confirmation of its enforceability) and the anticipated receipts for that individual account.
Collectively assessed impairment allowances are provided for portfolios of homogenous assets that are individually below materiality thresholds by using the available historical experience and experienced judgment.
26.6.4 Maximum exposure to credit risk before collateral held or other credit enhancements
Gross Gross maximum maximum exposure exposure 2010 2009 ($’000) ($’000) Credit risk exposures are as follows:
On-balance sheet Loans and advances to customers 9,057,980 9,271,946Securities at fair value through profit or loss 401,580 91,424Securities available for sale at fair value excluding equities 3,433,945 822,126Securities held to maturity at amortised cost 915,276 641,401Due from banks 1,202,066 472,652Banker’s acceptances and participatory investments 398,100 240,070Derivative financial instruments 87,271 36,453
15,496,218 11,576,072 Off-balance sheet Guarantees, acceptances, indemnities and letters of credit 604,722 1,261,035Credit commitments 1,295,442 334,256
1,900,164 1,595,291
Total credit risk exposure 17,396,382 13,171,363
26.6.7 Credit quality by class of financial assets
Neither Past due past due but not nor impaired impaired Impaired Total ($’000) ($’000) ($’000) ($’000)As at 31 October 2010 Due from banks 1,202,066 -- -- 1,202,066 Derivative financial instruments 87,271 -- -- 87,271Banker’s acceptances and participatory investments 398,100 -- -- 398,100
At fair value through profit or loss: - Government debt 377,884 -- -- 377,884- Corporate debt 23,696 -- -- 23,696Available for sale: - Government debt 2,785,802 -- -- 2,785,802- Corporate debt 281,721 -- -- 281,721- Other 366,422 -- -- 366,422Held to maturity: - Government 915,276 -- -- 915,276- Other -- -- -- --
4,750,801 -- -- 4,750,801Loans and advances to customers - Retail 1,222,250 241,594 69,471 1,533,315- Commercial/corporate 3,326,145 864,774 1,002,247 5,193,166- Mortgages 985,498 173,918 6,242 1,165,658- Other 1,135,135 22,921 7,785 1,165,841
6,669,028 1,303,207 1,085,745 9,057,980
13,107,266 1,303,207 1,085,745 15,496,218
26.6.5 Concentration of risk of financial assets with credit risk exposure by industry sectors
The following table breaks down the Bank’s main credit exposure of their carrying amounts, as categorised by industry sectors of counterparties: Gross Gross maximum maximum exposure exposure 2010 2009 ($’000) ($’000) Consumer 3,111,348 3,060,348Manufacturing 1,147,722 1,075,476Distribution 981,296 1,263,471Financial services 1,835,463 1,024,694Transport 323,929 176,333Construction 553,379 599,097Petroleum 100,460 220,998Agriculture 15,685 59,219Real estate 882,983 964,442Tourism 366,077 673,688Professional services 24,676 37,267Utilities 125,372 225,735Health services 85,462 52,802Government 4,435,257 1,322,754Other 1,507,109 819,748
15,496,218 11,576,072
26.6.6 Risk concentrations of the maximum exposure to credit risk
Concentration of risk is managed by client/counterparty, by geographical region and by industry sector. The maximum credit to any client or counterparty as at October 31, 2010 was $4,109,706,000 (2009: $3,090,305,000) before taking account of account collateral or other credit enhancements.
Neither Past due past due but not nor impaired impaired Impaired Total ($’000) ($’000) ($’000) ($’000) As at 31 March 2009 Due from banks 472,652 -- -- 472,652Derivative financial instruments 36,453 -- -- 36,453Banker’s acceptances and participatory investments 240,070 -- -- 240,070
At fair value through profit or loss: - Corporate debt 91,424 -- -- 91,424Available for sale: - Government debt 391,036 -- 8,868 399,904- Corporate debt 166,820 -- -- 166,820- Other 255,402 -- -- 255,402Held to maturity: - Government 612,665 -- -- 612,665- Other 28,736 -- -- 28,736 1,546,083 -- 8,868 1,554,951
Loans and advances to customers - Retail 1,304,215 233,697 39,208 1,577,120- Commercial/Corporate 4,581,394 734,206 300,149 5,615,749- Mortgages 914,236 45 -- 914,281- Other 1,085,506 28,940 50,350 1,164,796
7,885,351 996,888 389,707 9,271,946
10,180,609 996,888 398,575 11,576,072
Financial Statements 31 October 2010 - continued(expressed in Trinidad & Tobago dollars)

35
Financial Statements 31 October 2010 - continued(expressed in Trinidad & Tobago dollars)
Notes to the financial statements
26 Financial risk management (continued)
26.6 Credit risk (continued)
26.6.8 Credit risk exposure based on the Bank’s internal corporate rating system
Standard & Poor’s Total Total equivalent grades 2010 2009 ($’000) ($’000)
ExcellentAA BB+ 1,646,286 2,453,191 Very good A+ BB 1,429,623 2,279,978A BB- 6,012,790 1,634,230 Good A- B+ 4,369,390 3,995,493B+ B Special mention B B- 17,149 445,705C+ CCC+ 1,102,356 -- Unacceptable C CCC 260,109 541,422D+ CCC- Bad and doubtful D CC+ 414,855 225,886E+ CC Virtual certain loss E CC- 243,660 167
15,496,218 11,576,072
26.6.9 Aging analysis of past due but not impaired loans and advances by class
Less than More than 1 mth 1-3 mths 3-6 mths 6 mths Total ($’000) ($’000) ($’000) ($’000) ($’000)
As at 31 October 2010Loans and advances to customers: Retail 178,752 62,842 -- -- 241,594Commercial/Corporate 442,162 422,612 -- -- 864,774Mortgages 142,720 31,198 -- -- 173,918Other 16,129 6,792 -- -- 22,921
779,763 523,444 -- -- 1,303,207
As at 31 March 2009Loans and advances to customers: Retail 203,279 30,418 -- -- 233,697Commercial/corporate 588,032 146,174 -- -- 734,206Mortgages -- -- -- 45 45Other 19,861 9,079 -- -- 28,940
811,172 185,671 -- 45 996,888
26.6.10 Carrying amount per class of financial assets whose terms have been renegotiated
2010 2009 ($’000) ($’000)Investment securities available for sale -- --
Loans and advances to customers Retail 3,879 573Commercial/corporate 88,179 2,020Mortgages -- 210
92,058 2,803
Total renegotiated financial assets 92,058 2,803
26.6.11 Repossessed collateral
Repossessed collateral are sold as soon as practicable, with the proceeds used to reduce the outstanding indebtedness.
26.7 Capital management
The Bank’s objectives when managing capital, which is a broader concept than the ‘equity’ on the face of the statement of financial position, are:
• TocomplywiththecapitalrequirementssetbytheCentralBankofTrinidadandTobago;
• TosafeguardtheBank’sabilitytocontinueasagoingconcernsothatitcancontinuetoprovidereturns for shareholders and benefits for other stakeholders; and
• Tomaintainastrongcapitalbasetosupportthedevelopmentofitsbusiness.
Capital adequacy and the use of regulatory capital are monitored daily by the Bank’s management, employing techniques based on the guidelines developed by the Basel Committee on Banking Supervision as implemented by the Central Bank of Trinidad and Tobago. The required information is filed with the Authority on a monthly basis.
The table below summarises the composition of regulatory capital and the ratios of the Bank at the statement of financial position date. During those two years, the Bank complied with all of the externally imposed capital requirements to which it is subject. 2010 2009 ($’000) ($’000)Tier 1 capital
Share capital (net of the treasury shares) 403,970 403,970Statutory reserve 518,970 378,434Retained earnings 1,131,324 871,142
Total qualifying Tier 1 capital 2,054,264 1,653,546
Tier 2 capital
General Reserve 604 604Revaluation reserve/(deficit) – available-for-sale investments 40,388 (9,104)
Total qualifying Tier 2 capital 40,992 (8,500)
Total regulatory capital 2,095,256 1,645,046 Risk-weighted assets:
On-balance sheet 10,514,263 10,567,190Off-balance sheet 1,748,427 2,051,694
Total risk-weighted assets 12,262,690 12,618,884
Total regulatory capital to risk weighted assets 15.59% 12.23%
27 Contingent liabilities and commitments
Legal proceedings
As at 31 October 2010, there were certain legal proceedings outstanding against the Bank. A provision has been made of $9 million based on professional advice as to the likely obligations arising from these litigation matters.
Customers’ liability under acceptances, guarantees and letter of credit
The contractual amounts of the Bank’s off-balance sheet financial instruments that may commit it to extend credit to customers are as follows:
2010 2009 ($’000) ($’000) Bonds outstanding, letters of credit and guarantees 604,722 1,184,640 Sectoral analysis Private sector 525,751 1,157,151State sector 550 678Consumers 73,469 18,521Other 4,952 8,290
604,722 1,184,640
There are equal and offsetting claims against the Bank’s customers in the event of a call on these commitments.

36
Financial Statements 31 October 2010 - continued(expressed in Trinidad & Tobago dollars)
Notes to the financial statements
27 Contingent liabilities and commitments (continued)
2010 2009 ($’000) ($’000)
Credit commitments
Sectoral analysis of credit commitments is as follows: Distribution 23,050 53,149Construction 14,827 49,055Consumer 81,567 61,336Manufacturing 222,509 60,680Financial services -- 5,000Transport 850 100Tourism -- 7,815Professional services 4,900 4,270Petroleum 250,600 2,520Real estate 3,283 10,574Government 623,500 --Other 70,356 79,757
1,295,442 334,256
Capital commitments
The Bank has capital commitments totaling $7.00 million at 31 October 2010 (2009 - $0.38 million). See Note 26.3.2. Operating lease commitments
The future minimum lease payments under non-cancellable building operating leases are shown in Note 26.3.2
28 Related party transactions
Parties are considered to be related if one party has the ability to control the other party or exercise significant influence over the other party in making financial or operational decisions. The ultimate parent of the Bank is Royal Bank of Canada.
A number of banking transactions are entered into with related parties in the normal course of business. These include loans, deposits and foreign currency transactions. These transactions are carried out on commercial terms and conditions and at market rates.
Loans and investments Directors and key management personnel 5,750 26,828Other related parties 605,456 1,270,461
611,206 1,297,289 No provisions have been recognised in respect of loans given to related parties (2009: nil). Deposits and other liabilities Directors and key management personnel 5,232 28,075Other related parties 661,474 606,417
666,706 634,492Interest income Directors and key management personnel 76 2,451Other related parties 68,220 44,849
68,296 47,300Other income Other related parties 72,682 61,082 Interest expense Directors and key management personnel 37 381Other related parties 21,729 25,132
21,766 25,513Operating expenses Other related parties 154,949 94,238
Key management compensationKey management personnel are those persons having authority and responsibility for planning, directing and controlling the actions of the Bank.
Salaries, benefits and fees 4,874 1,125
29 Fair value of financial assets and liabilities
Financial assets and liabilities not carried at fair value include cash on hand and due from banks, loans and advances to customers, customers’ deposits, due to banks, debt securities in issue, other funding instruments and other borrowed funds. The following comments are relevant to their fair value.
AssetsCash on hand and due to banks Since these amounts are short-term in nature, the values are taken as indicative of realisable value.
Loans and advances to customersThese assets result from transactions conducted under typical market conditions and their values are not adversely affected by unusual terms. The inherent rates of interest in the portfolio approximate market conditions and yield discounted cash flow values which are substantially consistent with their carrying values.
Investment securities held to maturityThe fair value is calculated using a discounted cash flow model based on a current yield curve appropriate for the remaining term to maturity. Carrying Fair Value Value ($’000) ($’000) Balance at 31 October 2010 915,276 916,740
Balance at 31 March 2009 641,401 606,113
LiabilitiesDue to banks and customers’ depositsThe fair values of items with no stated maturity are assumed to be equal to their carrying value. Deposits with fixed rate characteristics are at rates which are not significantly different from current rates and are assumed to have discounted cash flow values which approximate carrying values.
The following table provides an analysis of financial instruments that are measured subsequent to initial recognition at fair value, grouped into Levels 1 to 3 based on the degree to which the fair value is observable.
• Level1fairvaluemeasurementsarethosederivedfromquotedprices (unadjusted) in active markets for identical assets or liabilities.
• Level 2 fair value measurements are those derived frominputs other than quoted prices included within Level 1 that are observable for the asset or liability, either directly (i.e. as prices) or indirectly (i.e. derived from prices).
• Level 3 fair value measurements are those derived fromvaluation techniques that include inputs for the asset or liability that are not based on observable market data (unobservable inputs).
Level 1 Level 2 Level 3 Total ($’000) ($’000) ($’000) ($’000)
Securities at fair value through profit or loss (including trading) Government and state-owned enterprises debt securities -- -- 377,884 377,884Corporate debt securities -- -- 23,696 23,696
-- -- 401,580 401,580
Securities available-for-sale at fair valueTreasury bills and treasury notes -- -- 2,613,732 2,613,732Government and state-owned enterprises debt securities -- -- 172,070 172,070Corporate debt securities -- -- 281,721 281,721Other debt securities -- -- 63,972 63,972Money market instruments -- -- 302,450 302,450Equitysecurities -- 13,519 3,402 16,921
-- 13,519 3,437,347 3,450,866
Reconciliation of Level 3 fair value measurements of financial assets At fair value through profit Available- and loss for-sale Total
As at April 1, 2009 91,424 852,666 944,090
Additions 1,289,883 13,022,679 14,312,562Disposal (Sale and redemption) (984,930) (10,478,069) (11,462,999)Gains from changes in fair value 5,203 40,071 45,274
As at October 31, 2010 401,580 3,437,347 3,838,927
30 Restatements and re-classifications
Adjustments and re-classifications to prior year figures have been made to correct errors and to represent balances in conformity with the current year’s reporting.
The effect of these changes to the 2009 statement of financial position and statement of comprehensive income is summarised in the table below. As previously Revised stated Re-classification Adjustments balance ($’000) ($’000) ($’000) ($’000)As at 31 March 2009 Statement of financial position Assets Cash on hand and due from banks 1,570,917 -- -- 1,570,917Balances with central banks 2,055,007 -- -- 2,055,007Loans and advances to customers 9,057,366 -- -- 9,057,366Investment securities 1,603,612 -- -- 1,603,612Banker’s acceptances and participatory investments -- -- 240,070 240,070Investment in associate company 10,569 -- -- 10,569Due from affiliate companies 2,353,470 -- -- 2,353,470Derivative financial instruments 36,453 -- -- 36,453Intangible assets -- 83,499 -- 83,499Premises and equipment 320,001 (83,499) -- 236,502Deferred tax assets 3,035 -- 36,419 39,454Other assets 76,748 -- -- 76,748
Total assets 17,087,178 -- 276,489 17,363,667
Liabilities Due to banks 696,201 -- -- 696,201Customers’ deposits 13,436,117 -- -- 13,436,117Banker’s acceptances and participatory investments -- -- 240,070 240,070Due to affiliated companies 606,417 -- -- 606,417Provision for taxation 107,921 -- -- 107,921Deferred tax liabilities 6,143 -- -- 6,143Post-retirement benefit -- -- 145,676 145,676Other liabilities 480,076 (92,016) -- 388,060Provisions -- 92,016 -- 92,016
Total liabilities 15,332,875 -- 385,746 15,718,621

37
Financial Statements 31 October 2010 - continued(expressed in Trinidad & Tobago dollars)
Notes to the financial statements
30 Restatements and re-classifications (continued)
As previously Revised stated Re-classification Adjustments balance ($’000) ($’000) ($’000) ($’000)As at 31 March 2009 Statement of financial position Shareholders’ Equity Share capital 403,970 -- -- 403,970Statutory reserves 378,434 -- -- 378,434Other reserves (8,500) -- -- (8,500)RetainedEarnings 980,399 -- (109,257) 871,142
Total shareholders’ equity 1,754,303 -- (109,257) 1,645,046
Total equity and liabilities 17,087,178 -- 276,489 17,363,667
Statement of comprehensive incomeInterest income 1,293,202 -- -- 1,293,202Interest expense (432,823) -- -- (432,823) Net interest income 860,379 -- -- 860,379
Other income 421,504 -- -- 421,504
Net income 1,281,883 -- -- 1,281,883
Operating expenses (753,603) -- (145,676) (899,279)Impairment losses on loans and advances (74,520) -- -- (74,520)Impairment credit on investment securities 2,007 -- -- 2,007
Total non-interest expenses (826,116) -- (145,676) (971,792)
Share of profits of associate companies before tax 2,662 -- -- 2,662
Profit before taxation 458,429 -- (145,676) 312,753Taxation (112,668) -- 36,419 (76,249)
Profit after taxation 345,761 -- (109,257) 236,504
Reconciliation of prior year adjustments to the statement of changes in shareholders’ equity
There were no restatements or reclassifications made to the statement of changes in equity at 31 March 2008.
The prior year adjustment made to shareholders equity at 31 March 2009 relates to the recognition of post-retirement benefits previously carried by the parent company and the details are set out in note 15.