real time pcr and digital pcr - vhir and digital pcr_applied... · • taqman® mutation detection...
TRANSCRIPT

The world leader in serving science1 10/12/12
Bea CabotField Application SpecialistThermo Fisher Scientific
Real Time PCR and Digital PCR

2
• Real Time PCR:
• Introduction: TaqMan™ MGB probes and SYBR™ Green dye
• Applications:
• Absolute Quantification
• Relative Quantification: Gene Expression, microRNA,
Protein Quantification, CNV and Mutation Detection
• Genotyping: Allelic Discrimination
• TaqMan Array Cards
• Digital PCR - Introduction
Agenda
3
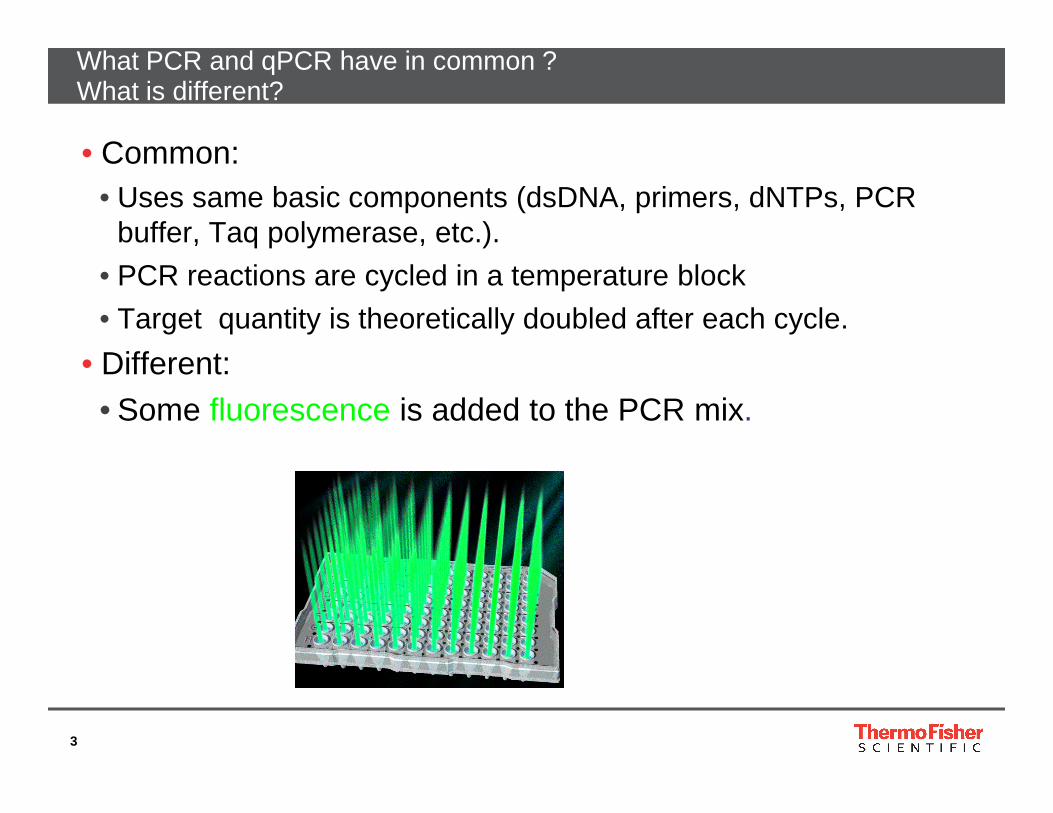
• Common: • Uses same basic components (dsDNA, primers, dNTPs, PCR
buffer, Taq polymerase, etc.).
• PCR reactions are cycled in a temperature block
• Target quantity is theoretically doubled after each cycle.
• Different:
• Some fluorescence is added to the PCR mix.
What PCR and qPCR have in common ?What is different?

4
What is different?
Plateau phase
Linear phase
Exponential phase
Cycles
PC
R P
rodu
ct
5
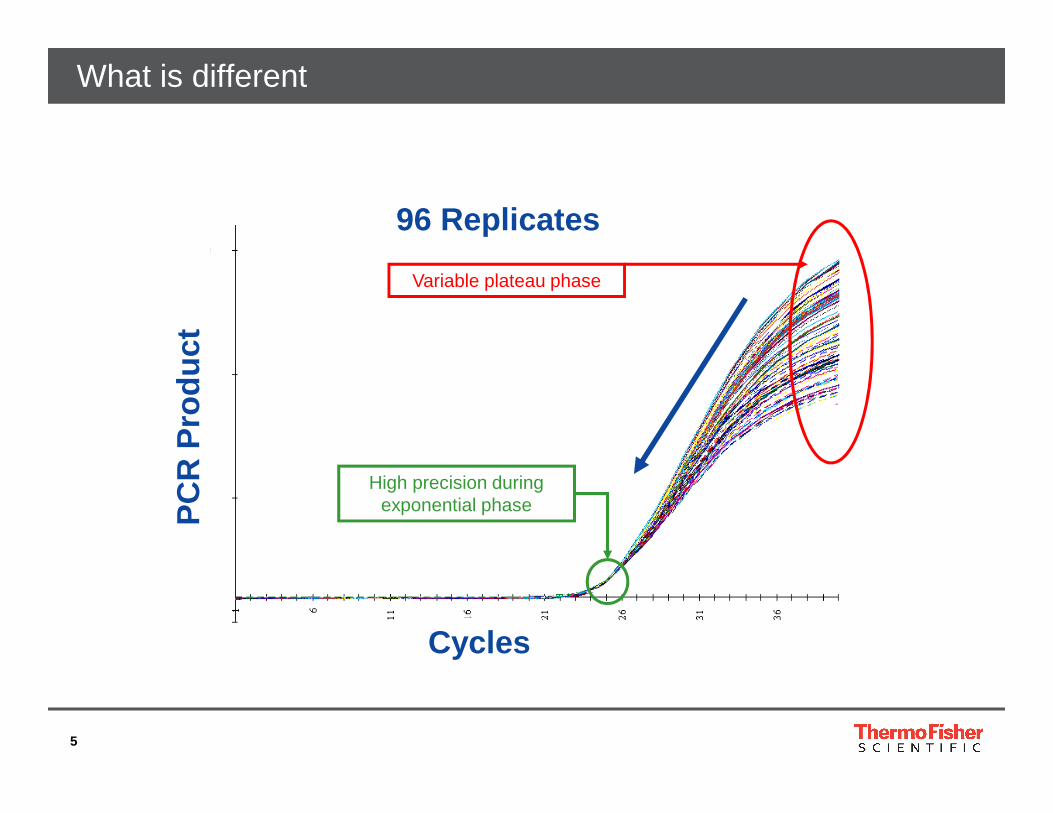
What is different
Variable plateau phase
96 Replicates
Cycles
High precision during exponential phaseP
CR
Pro
duct

6
Signal Generation with TaqMan Probe
•The 5′-Nuclease assay
•This method uses 2 principles:
• FRET Technology
• 5′- Nuclease activity of the Taq polymerase

7
5’ Nuclease Assay Using TaqMan Probes
ReversePrimer
Dyes: FAM™, VIC™
ForwardPrimer
TaqMan MGB Probe
3’
5’3’
5’
68 - 70°C
5’
5’
60°C
60°CRR NFQ

8
5’3’
5’5’3’
5’
R Q
• Fluorescence Resonance Energy Transfer (FRET) from high energy (Reporter) to low energy (Quencher) dye
• No reporter signal with intact probe
5’ Nuclease Assay Using TaqMan Probes

9
• Cleavage of probe by 5‘ nuclease activity of Taq polymerase
• FRET disabled, generation of reporter signal
5’3’
5’5’3’
5’
Q
R
5’ Nuclease Assay Using TaqMan Probes

10
• SYBR® Green I dye fluoresces upon binding to double-stranded PCR product
• Signal is increasing by 1000 fold when binding
• Emitted fluorescence is proportional to amount of amplified product detected in every cycle
Signal Generation with SYBR Green Dye
excitation : 497 nmemission : 520 nm

11
• Can monitor non-specific fluorescence using dissociation curve analysis after PCR (slow heating from 60° to 95°C)
• “Melting” of ds DNA reduces fluorescence
• Sharp, single peak indicates specific amplification
• Diffuse or multiple peaks indicate nonspecific amplification
SYBR Green I Dye: CHECKING FOR SPECIFICITY
Dissociation Curve
Dissociation Curve (Derivative)
Dissociation Curve (Derivative)
One, clean peak = no extraneous products

12
-
TaqMan probes
+•• More specific
• No concern about dimers
• Allows for multiplexing
• Minimal optimization
• Millions of pre-developed
Assays!
•• Can be more expensive
TaqMan or SYBR Green I Dye?
•• Can be cheaper
•• Less specific• Must run melt curves • No multiplexing / Optimization
SYBR Green I
-
+

13
Gene Expression TaqMan AssaysXS:
75/150 rx for ONLY 79.25€
1 rx- 1 € (Vol 20ul)
1 rx- 0.5 € (Vol 10ul)

14
Threshold
CT value
Rn
CyclesBaseline
Let‘s go over Terminology
Amplification Plot Terminology

15
Applications
Plus/minus
Allelic Discrimination
Relative Quantification
AbsoluteQuantification
QuantitativeApplications
End-Point Applications

16
• Forensic labs: Knowing if there is any amplifiable DNA is
necessary to decide if further investigation on sample makes
sense or not
• Microorganism Quantitation: Viruses, Bacteria, Fungi,
Parasites
Applications
AbsoluteQuantification
QuantitativeApplications

17
Ct‘s
Log copy number
Ct v
alue
s
0 1 2 3 4 5 6 7
The well contains 400 target copies

18
TARGET
• Gene Expression: mRNA
• Fusion transcripts: mRNA
• microRNA Analysis: MicroRNA
• Protein Quantification: Protein
• Copy Number Variation (CNV): gDNA
• TaqMan® Mutation Detection: gDNA
Applications
Relative Quantification
QuantitativeApplications
19
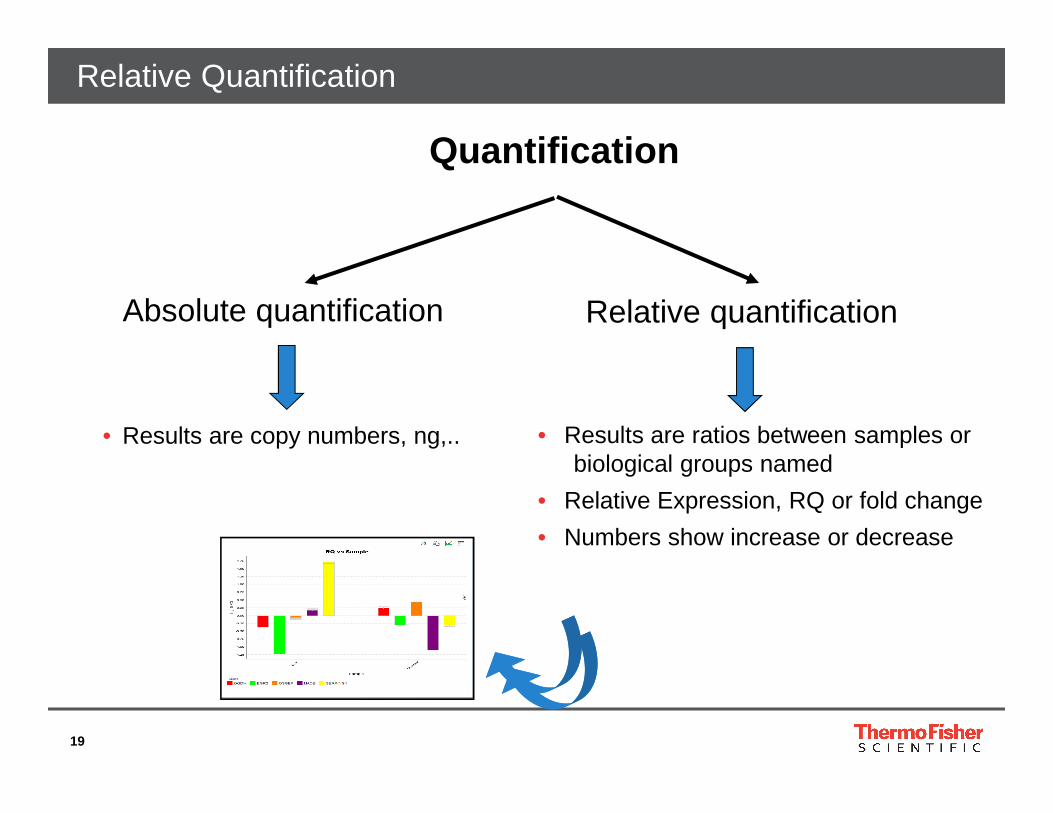
Relative Quantification
Quantification
Relative quantificationAbsolute quantification
• Results are copy numbers, ng,.. • Results are ratios between samples or biological groups named
• Relative Expression, RQ or fold change
• Numbers show increase or decrease

20
• What is a translocation and why is that important?
Fusion transcripts
� Translocations can cause Cancer
� Example: chronic myeloid leukemia (CML) & Philadelphia Chromosome
� Sometimes a fusion transcript between two genes occurs (e.g. BCR-ABL)
� Fusion transcripts are complex, and difficult to study

21
Fusion transcripts

22
• Detection from 10-500 cells or 1-1000 ng protein from tissues• Combines protein detection using Antibodies with robust, sensitive real-
time PCR• Relative quantification of proteins in cell and tissue lysates
• no purification of proteins required!• Just lyse and dilute….
TaqMan Protein Assays
• Applications:− Small sample protein analysis− Correlation of RNA & Protein
> miRNA:protein
> mRNA:protein− Validation of siRNA induced silencing− Validation of Gene Transfection/Transduction− Sample analysis from FFPE & Frozen Tumor tissues− Analysis of in vitro protein:protein interactions

23
• Assay probes are made from biotinylated-antibodies & streptavidin-linked oligonucleotides
Single tube of biotinylated polyclonal antibodies- many specificities
Combine for Binding in Assay
TargetTarget
Connector oligoSASA BBB
SASABBB
++SASA
3’
Streptavidin-oligo
SASA
5’Streptavidin-oligo
BBB B
BBB
BB
BBB B
BBBBB
BBB B
BBB
BB
Split in half
Assay probe B
SASA5’
BBB
Assay probe A
SASAB
BB
3’
TaqMan Protein Assays

24
TargetTarget
SASAB
BB
SASABBB
3’ 5’
Connector oligo
DNALigase
vs.
Connector oligo
DNALigase
SASA5’
BBBSASA
BBB
3’
TargetTarget
TargetTarget
SASA BBB
SASABBB
primer
probe
primer
• Ligation + qPCR• Protein Target-specific amplification & signal
No LigationNo qPCRNo Target-specific signal
TaqMan Protein Assays

25
Data AnalysisLigationBindingPrepare Sample
Target
3’
BBB B
BBB
BB
3’ 5’
Target
connector
BBB
0
0
1
10
100
1 4 10 14 28
Day
Fol
d C
hang
e
0.1
0.01
TaqMan® Fast Real-Time PCR
TaqMan® Protein Assay Overview
Cycle number
Lyse cells and
dilute into plate
Only 2 uL sample
required!
Bind Assay Probes
(2 uL) to protein in
crude lysate
Ligate Oligos after
binding (100 uL)
Run Fast Real-
Time PCR (20 uL)
Analyze Data for
Relative Quant
Compatible with StepOnePlus TM, 7500, 7500Fast, 7900HT, & ViiA TM 7 Real-Time PCR Systems
~3.5 hrs
~1.5 hrs
Total Time
Time to Results
Hands on Time
~3.5 hrs
~1.5 hrs
Total Time
Time to Results
Hands on Time
TaqMan Protein Assays

26
ProteinAssist Software

27
From Nature, Vol. 437 (Oct. 20, 2005)
• CNV is one of the important structural variations in the genome
• Represents a copy number change involving a DNA fragment that is ≧ 1 kb
• CNV may account for a significant proportion of normal variation and also disease association
• Genetic diseases, cancer, neurological disorders, and immune diseases
• CNVs have impacts on levels of gene expression and therefore produces gene dosage effects
Copy Number Variations

28
• PRE-DESIGNED ASSAYS (FAM-MGB)
• >1.6 million pre-designed TaqMan Copy Number Assays available
• Genome-wide coverage (~ 1 kb average spacing) including:
• known genes (~ 95% RefSeq genes covered; ~ 50% of assays)
• known CNVs (~ 85% of CNVs in DGV Nov 2008 release; ~ 25% of assays)
• Extragenic and non-known-CNV regions (~ 25% of assays)
• CUSTOM DESIGN PIPELINE AVAILABLE (FAM-MGB)
• COPY NUMBER REFERENCE ASSAYS (FAM-TAMRA)
• Human: RNase P – recommended as first choice
TERT - option in event of chromosome 14 abberation or other issue
• Mouse: Tfrc – recommended as first choice (Transferrin Receptor on Chr. 16)
Tert - alternative (Telomerase Reverse Transcriptase on Chr. 13)
Copy Number Variations - Assays

29
TaqMan CopyCaller Software

30
• TaqMan® Mutation Detection (MD) Assays using castPCR™ technology
• Higher specificity for SOMATIC mutation detection: all assays can detect
100 copies of mutant allele in the background of 104 copies of wild type
allele (1% mutation); 80% assay can detect 10 copies of mutant allele
(0.1% mutation)
• TaqMan® Mutation Detection Assays applications:
• Screening and mutation profiling of research cancer samples
• Validation of results from NGS platforms
TaqMan Mutation Detection

31
Mutant allele assay
• An allele-specific primer detects the mutant allele
• An MGB oligonucleotide blocker suppresses the wild type allele
Gene reference assay
• A locus-specific primer pair amplify a mutation-free region of the target gene
• Contain TaqMan® FAM™ dye-MGB probes
Two Main Types of TaqMan Mutation Detection Assays
ASP – allele specific primerASB – allele specific blocker (MGB oligo)LST – locus specific TaqMan ® FAM™-MGB probeLSP – locus specific primer
LST – locus specific TaqMan ® FAM™-MGB probeFP – forward primerRP – reverse primer

32
Mutation Detection Analysis Results Table

33
• Single Nucleotide Polymorphism (SNP)• Base substitution involving only one single nucleotide
• ~10 millions are thought to be present in the human genome at >1%, leading to an average of one SNP difference per 1250 bases between randomly chosen individuals (The International HapMap Consortium (2003))
Applications
Allelic Discrimination
End-Point Applications
34
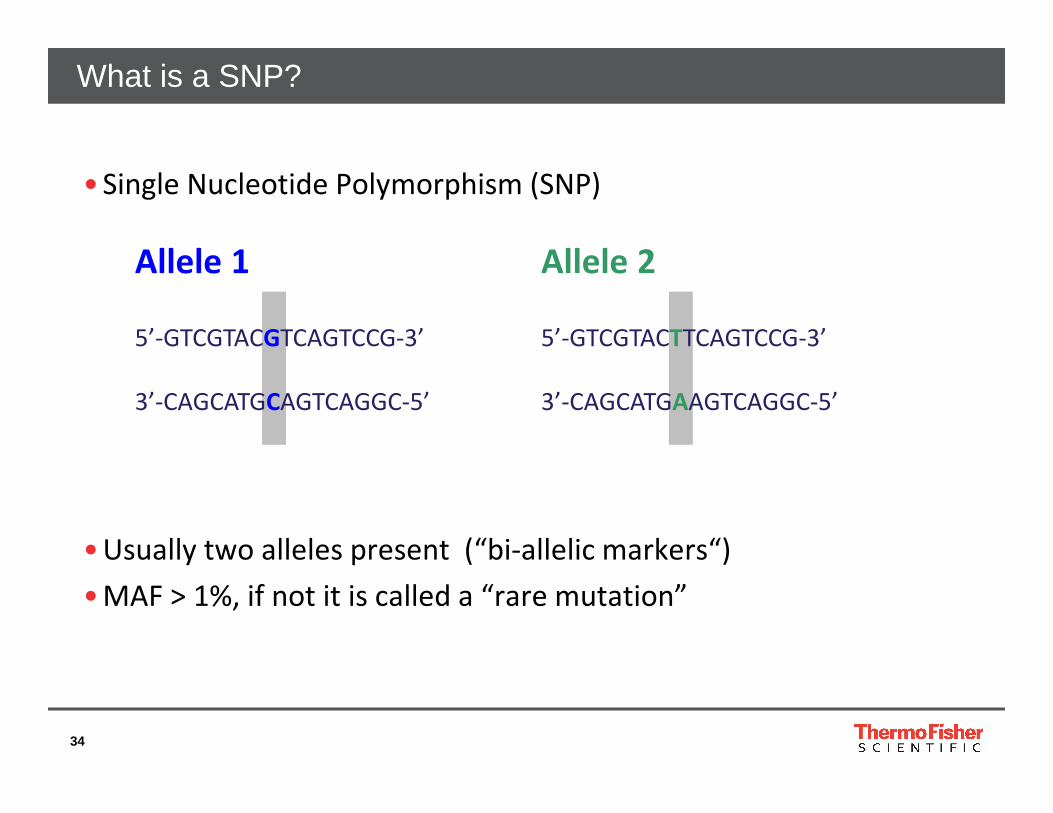
Allele 1
5’-GTCGTACGTCAGTCCG-3’
3’-CAGCATGCAGTCAGGC-5’
Allele 2
5’-GTCGTACTTCAGTCCG-3’
3’-CAGCATGAAGTCAGGC-5’
• Single Nucleotide Polymorphism (SNP)
• Usually two alleles present (“bi-allelic markers“)
• MAF > 1%, if not it is called a “rare mutation”
What is a SNP?

35
Presence of Allele
1
R Q
PMGB
Q
PMGB
R
Presence of
Allele 2Q
PMGB
Q
PMGB
R
R
Allelic Discrimination Application

36
Allele calling: end point analysis
Genotype Allele Signal
FAM™ dye VIC® dye
Homozygous 1/1
Homozygous 2/2
Heterozygous 1/2

37
• TaqMan® Genotyper™ Software : Standalone and free data analysis software for Applied Biosystems® TaqMan® Genotyping Solutions
• Thermo Fisher Cloud
Allelic Discrimination Analysis

38
TaqMan Genotyper Software: Results

39
Gene Expression Studies

40
• Measurement of the concentration of the gene target in the sample
using arbitrary units
• “Relative” means the results have no meaning unless compared to
other samples
• Relative quantification allows sample to sample, but not gene to
gene quantity comparisons
Relative Quantification

41
• Difference to absolute Quantification:• No standard curve needed!
• Calculation of results by comparison of Ct values• Method used: “Comparative Ct method“
• Based on assumption that genes used in the study show similar PCR efficiencies and
• Amplification efficiency is close to 100% as in formula 2-∆ ∆ Ct is used
• Normalization with:• Endogenous Control
• Calibrator (or Reference Sample)
Relative quantification
42
• Endogenous control gene: allows for the normalization of the target's gene
expression to another gene that is constantly expressed across samples.
• Usually, the endogenous control is used to normalize for differences in the
amount of cDNA used in the PCR reaction as well as any PCR inhibition caused
by the sample.
• Choosing the appropriate endogenous control will depend upon several factors.
• Scientists have to validate their own samples to see which candidate control is stably
expressed across all of your samples.
• You can find more information on the expression of common human and mouse
control genes in the application note:
https://tools.lifetechnologies.com/content/sfs/brochures/cms_042279.pdf
What is an endogenous control, and how do I pick one?

43
Normalization with Endogenenous Control Gene
• Single Endogenous Control (TaqMan® Assays)• Select ”study-representative” samples
• Run RT with equal amounts of RNA in parallel, load equal amounts of cDNA
• Choose gene with little / no variation
• Tip: Try other candidates if no gene deliversacceptable results
• Alternatively - Run several candidates throughout the entire study and choose normaliser at the end
• Often done e.g. on TaqMan® Arrays

44
• Simultaneous evaluation of 32 candidate endogeneous controls
• Pre-loaded primers and TaqMan® probes at optimized concentrations
Testing Expression of Candidate Genes - Setup
Sample 1 Sample 2 Sample 3

45
• expression levels of reference gene and gene of interest do not need to be similar but …
• First criteria to choose an endogenous control should be always the gene expression stability across samples.
• When working in multiplex, it is recommended you choose those candidates that show similar expression to target genes, in order to not inhibit target gene amplification.
• Working in singleplex, it is recommended you avoid those endogenous controls with vey low Ct values, which require an intermediate sample dilution to increase Ct values. This step increases error in the final measure.
Misconception for normalization

46
• Evaluation of 10 commonly used endogenous control genes in 5 different tissue panels
http://medgen.ugent.be/~jvdesomp/genorm/
Algorithms of Normalization- geNorm

47
Normalization Strategies
• Endogenous Control (Reference Gene)
• Single Endogenous Control
• Multiple Endogenous Control
• Global Normalization
• Spike-In

48
• What is the Function of a certain gene ?
• What happens when I knock it down ?
Example for relative quantificaton experiment

49
Validate si-RNA directed gene knock down
Silencer® Select siRNATransfection Reagent (e.g. Lipofectamine® /
Electroporation
Cells-to-Ct™ kit• Lysis of cells directly in 96well plate• Stop lysis • Set up Reverse Transcription reaction• Real-Time PCR
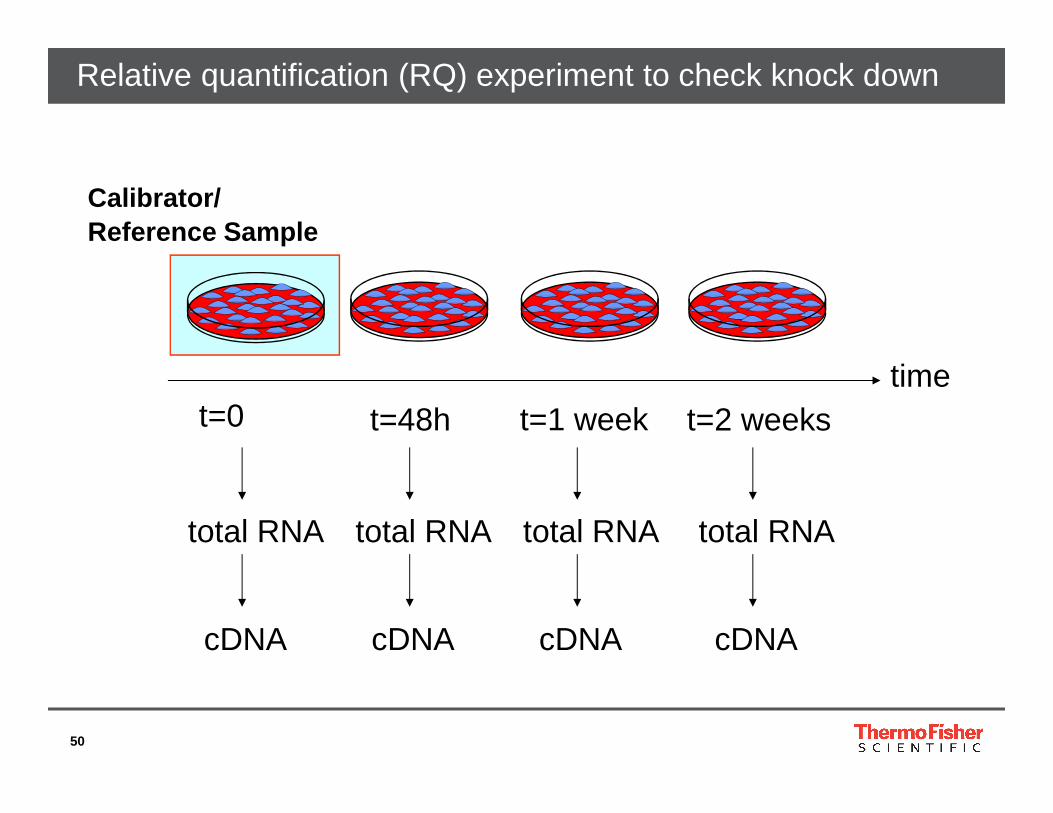
50
Calibrator/ Reference Sample
timet=0 t=48h t=1 week t=2 weeks
total RNA
cDNA
total RNA
cDNA
total RNA
cDNA
total RNA
cDNA
Relative quantification (RQ) experiment to check knock down

51
∆Rn
CyclesCt =14 Ct = 24
∆Ct = 24 – 14 = 10
Endogenous controlTarget gene
Comparison of target and endogenous control

52
∆Rn
CyclesCt=15 Ct=33
t=48h∆Rn
CyclesCt=15 Ct=30
t=0
∆Rn
Cycles
Ct=9 Ct=24
t=2 weeks∆Rn
CyclesCt=14 Ct=32
t=1 week
Endogenous control Target gene
Comparative Ct method: an example using the four samples

53
Comparative Ct method calculation steps
2. Normalization to calibrator/reference
DCt Sample – DCt Calibrator = DDCt
1. Normalization to endogenous control
Ct Target gene – Ct Endogenous control = DCt
For calibrator/reference and all other samples
3. use the formula
2-DDCt

54
CyclesCt=15 Ct=33
t=48h
CyclesCt=15 Ct=30
t=0
CyclesCt=9 Ct=24
t=2 weeks
CyclesCt=14 Ct=32
t=1 week
∆∆∆∆Ct=15 ∆∆∆∆Ct=18∆∆∆∆Ct=18 ∆∆∆∆Ct=15
∆Ct = Ct [Target]- ∆Ct [Endogenous control]
Endogenous control Target gene
Comparative Ct method

55
2 - ∆∆∆∆∆∆∆∆CT =1
Normalized expression relative to t=0 = 2 - ∆∆CT
2 - ∆∆∆∆∆∆∆∆CT =0.125 2 - ∆∆∆∆∆∆∆∆CT =0.125 2 - ∆∆∆∆∆∆∆∆CT =1
Endogenous control Target gene
CyclesCt=15 Ct=33
t=48h
CyclesCt=15 Ct=30
t=0
CyclesCt=9 Ct=24
t=2 weeks
CyclesCt=14 Ct=32
t=1 week
∆∆ Ct=0 ∆∆ Ct=3∆∆ Ct=3 ∆∆ Ct=0
Comparative Ct method

56
Relative quantification result of the 4 samples
0
0,2
0,4
0,6
0,8
1
1,2
Samples
x-fo
ld c
hang
et=0
t=48h
t=1 week
t=2 weeks
Reference sample
t=0
87.5 %Downregulation
Calculation of knock downe.g.
Result from RQ = 0.125 fold change
100 * (1 - 0.125) =
87.5%
1 / 0.125 = 8-fold down regulation
57
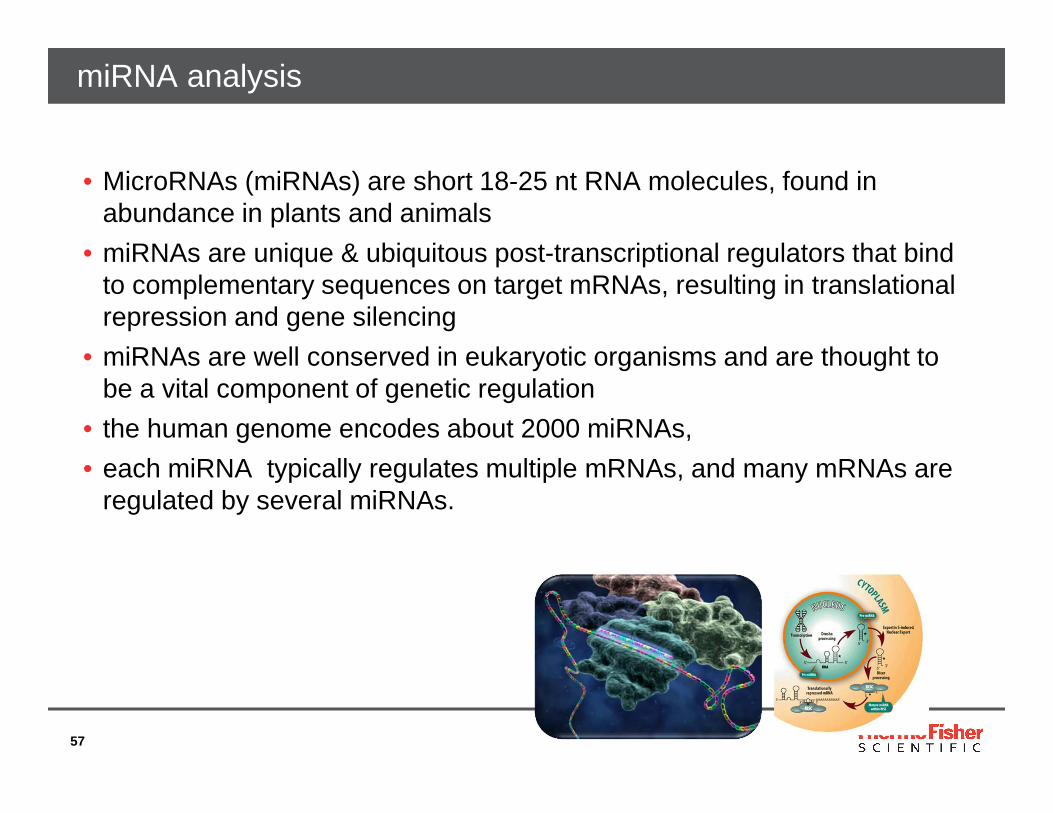
• MicroRNAs (miRNAs) are short 18-25 nt RNA molecules, found in abundance in plants and animals
• miRNAs are unique & ubiquitous post-transcriptional regulators that bind to complementary sequences on target mRNAs, resulting in translational repression and gene silencing
• miRNAs are well conserved in eukaryotic organisms and are thought to be a vital component of genetic regulation
• the human genome encodes about 2000 miRNAs,
• each miRNA typically regulates multiple mRNAs, and many mRNAs are regulated by several miRNAs.
miRNA analysis

58
MicroRNA Implications
DevelopmentDevelopment
TimingLee et al. 1993
Cell proliferation Brennecke et al.
2003
NeuronHatfield et al., 2005
Cell deathCell death
Baehrecke 2003Chen et al. 2006
DiseasesDiseases
Cancers Calin et al. 2002;
2004Lu et al. 2005
Voorhoeve et al. 2006
DiabetesPoy et al. 2004
EpigeneticsEpigenetics
Bao et al. 2004Henderson et al.
2006

59
*mature active strand
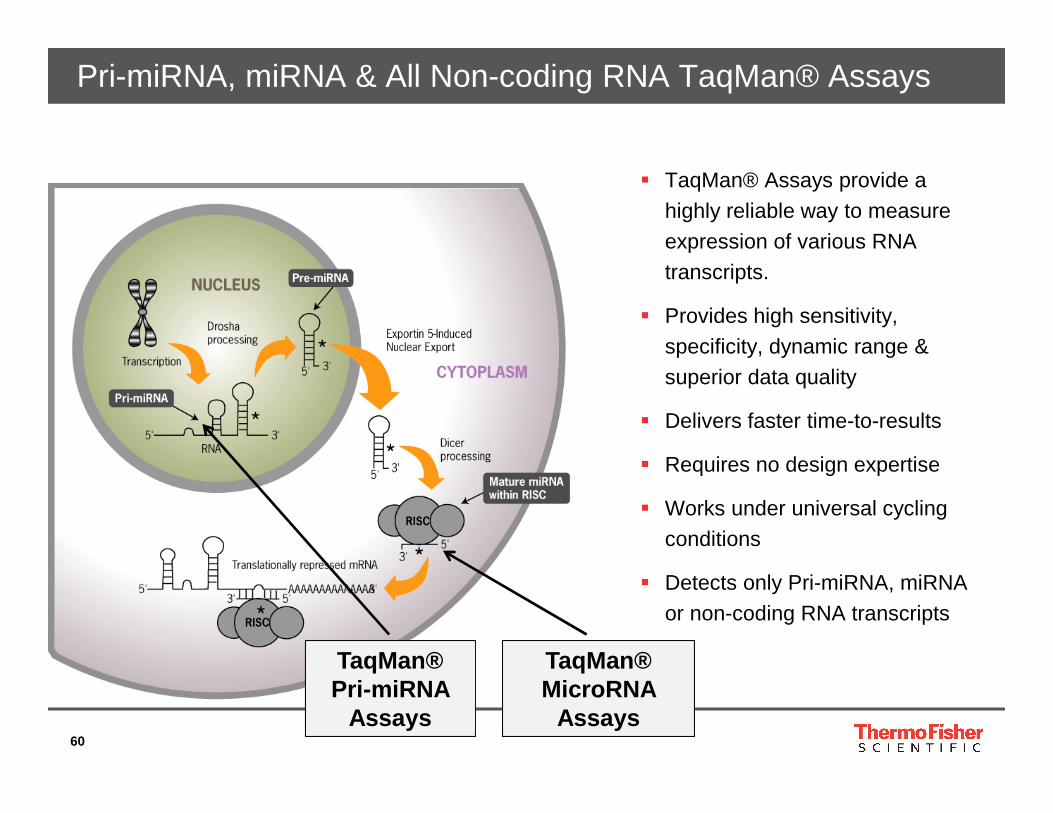
• Primary miRNA transcripts processed into precursor hairpin miRNA (pre-miRNA)
• Pre-miRNA transport into cytoplasm & processed by Dicer
• Mature miRNA bound by RISC complex (RNA Induced Silencing Complex)
• Bind to complementary mRNA & suppress protein expression
• Results in translational repression or mRNA degradation, depending homology
• Regulate as much as 50% of genome & implicated in many disease states
MicroRNA Biogenesis
*
60
� TaqMan® Assays provide a highly reliable way to measure expression of various RNA transcripts.
� Provides high sensitivity, specificity, dynamic range & superior data quality
� Delivers faster time-to-results
� Requires no design expertise
� Works under universal cycling conditions
� Detects only Pri-miRNA, miRNAor non-coding RNA transcripts
Pri-miRNA, miRNA & All Non-coding RNA TaqMan® Assays
TaqMan® MicroRNA
Assays
TaqMan® Pri-miRNA
Assays

61
Analysis of Gene Expression and MicroRNA Studies:ExpressionSuite SoftwareThermo Fisher Cloud

62
What is ExpressionSuite Software?
• Free web-downloadable software package− http://www.lifetechnologies.com/us/en/home/technical-resources/software-
downloads.html
• System Requirements:− Windows® XP with Service Pack 3 or Windows® 7, SP1
• Utilizes ∆∆Ct run files (.sds or .eds) to create a study file
• Compatible with the following data collection software versions / qPCRinstruments (no AB7000)

63
Features
• ∆∆Ct method is used to calculate RQ values
• Normalization
• Enables endogenous control (EC) selection (one or more)
• Viewing EC expression across all samples / groups
• Enables Global Normalization
• Flag summary for quality control
• Option to exclude outliers automatically using modified Grubbs’ test
• Easily analyze over 100x 384-well array plates or cards or 10 OpenArray® plates in one study

64
Selection of Endogenous Control(s): Control Plot
• Displays Ct values of candidate controls for all samples as well as the calculated “stability score” (geNorm/geNormPlus).Determines the best EC

65
• Box Plot - Quickly ID outliers in biological groups
• Use Flags to filter out aberrant data
• Signal Correlation plot - Assess Ct correlation between samples or bio groups by looking at shades of color and patterns on the plot. Think overview.
• Hone in on correlation details with Scatter Plot.
Quality Check (QC) Plots

66
• Gene Expression Plot – Overview of fold changes in gene expression by target or by sample / biological group
• RQ Settings Comparison – Compare results in parallel using different analysis settings.
• Volcano Plot – Quickly assess biologically & statistically significant data points in one plot.
• Heat Map - Birds of a feather flock together. Easily view relationships between samples and gene expression patterns
Results Plots

67
Gene Expression Data

68
Results Plots: Heat Map - Clustering Analysis
• What do you do once you have a list of significantly differentially expressed genes from your experiment?• Sometimes, it’s useful to look at how various subsets or groups of genes
change in different experimental conditions
• We can do this using different types of clustering analysis
What to cluster?−Genes:
• Identify groups of genes that have correlated expression profiles
−Samples:• Put samples into groups with similar overall gene
expression profiles
• Displays similarity in expression patterns and relationships of samples and genes

69
Recommendations for gene expression studiesby qPCR

70
Gene expression using real-time PCR
Before you set up an experiment:• Decide the type of real-time chemistry to use (TaqMan® or SYBR®).
• Select a reverse transcription method.
• RT-qPCR can be performed as a one-step or two-step procedure.
• Preamplification is needed?
• Select or design assays.• Target of interest, Specificity, Efficiency, Reproducibility
• Endogenous controls
• Singleplex PCR vs. duplex PCR
• Select a quantitation method.
• Comparative CT method, Relative standard curve method or Standard curve method
Analyzing data• View the amplification plots for the entire plate.
• Set the baseline and threshold values each sample and target/detector
• Use Expression Suite or CLOUD software

71
Gene expression using real-time PCR
• https://www.lifetechnologies.com/es/en/home/technical-resources/technical-reference-library/real-time-digital-PCR-applications-support-center/gene-expression-support.html

72
How do I know how much cDNA to use ?
• We recommend using 1–100 ng of cDNA per 20 µL qPCR reaction.
• However, the exact amount to use can best be determined by running a dilution series of
your input.
• Some genes may be expressed at low levels in your samples, in which case more input may
be required. If you do not know what level of expression to expect from your sample, you
can check if there is a known expression profile in NCBI by following these steps:
• Search for your TaqMan® Gene Expression Assay using the Assay ID at lifetechnologies.com.
• Click on the “View Details” button.
• Click on the UniGene ID hyperlink.
• Click on the “EST Profile” link under the
“Gene Expression” section.
• These data can give you an idea of what level of expression to expect from your particular
samples, or what tissue source would make a good positive control.
Gene Expression Support
73
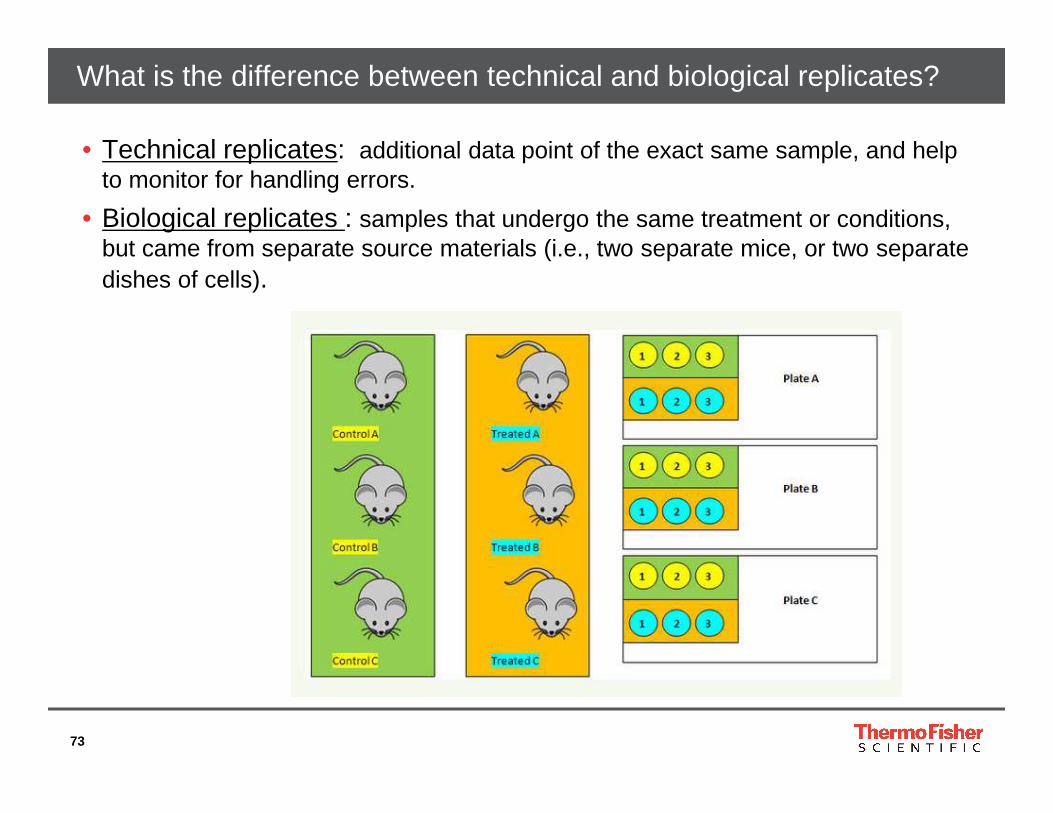
• Technical replicates: additional data point of the exact same sample, and help to monitor for handling errors.
• Biological replicates : samples that undergo the same treatment or conditions, but came from separate source materials (i.e., two separate mice, or two separate dishes of cells).
What is the difference between technical and biological replicates?
74
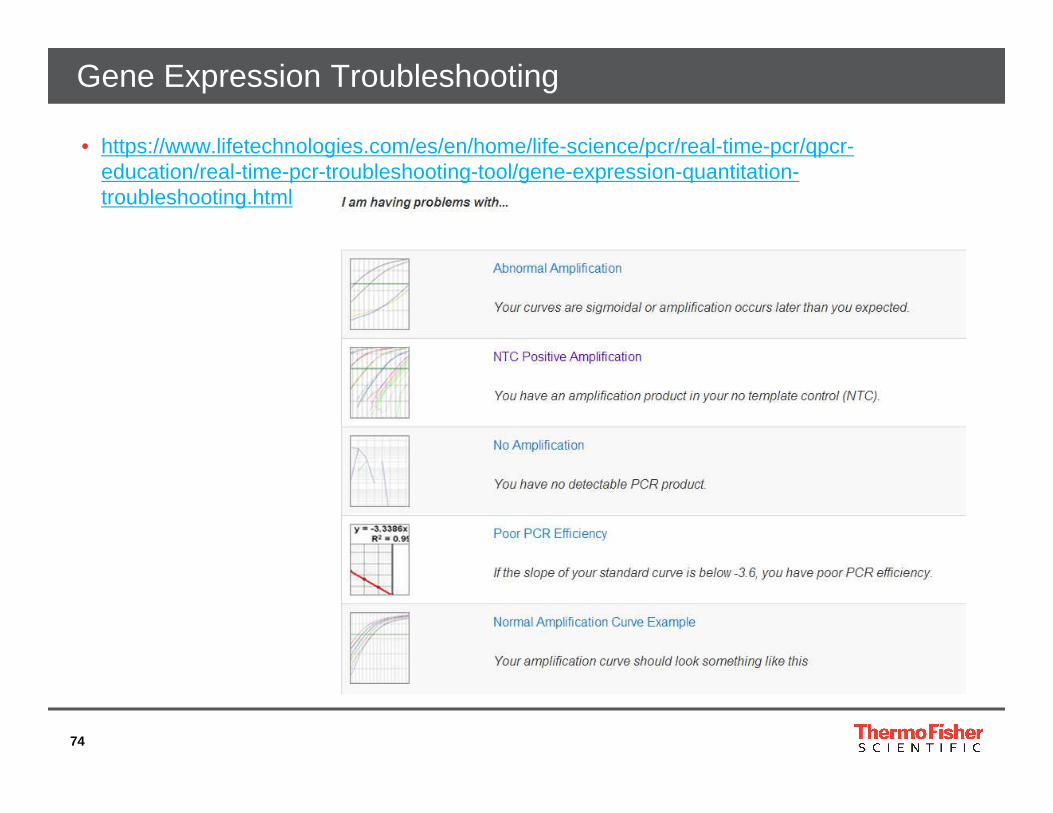
• https://www.lifetechnologies.com/es/en/home/life-science/pcr/real-time-pcr/qpcr-education/real-time-pcr-troubleshooting-tool/gene-expression-quantitation-troubleshooting.html
Gene Expression Troubleshooting

75
• To distinguish real differences from random variability
• Our natural inclination (especially with our own data) is to conclude that
differences are real and to minimize the contribution of random variability
• Statistical rigor prevents you from making this mistake
Why do we need statistics?
76
• For medium to big Gene Expression, microRNA and
Genotyping projects:
• Taqman Array Card: is a 384-well microfluidic card
designed to perform 384 simultaneous real-time PCR
(qPCR) reactions
• This format allows for 1–8 samples to be run in parallel against 12–
384 TaqMan® Gene Expression Assay targets that are pre-loaded
into each of the wells on the card.
High-throughput platforms: TaqMan Array Card

77
• Pipet optimal amount cDNA* determined previously, and Universal Master Mix in a final volume of 100 ul for each sample reservoir
TaqMan Array Card
POP-6TaqMan®2x PCR
Master Mix
Applied Biosys

78
• 1 minute @ 1200 rpm (two times) Sealing Device ready to be loaded
Analysis of results: using ExpressionSuite Software
TaqMan Array Card

79
WHAT is Digital PCR?

80
• Less susceptible to noise• More accurate• More precise • More repeatable• Easier to analyze and interpret
Relative to analog, digital is typically
…
Example: what time is it?
AnalogApproximately
8:30pm
Digital8:28:47pm
Digital vs. Analog Measurement

81
The Evolution of PCR

82
Two Methods to Quantify
?
Answer: 672 yellow, 912 red…
Answer: same # as in reference jar
Unknown “Known”
• How many beans in the jar?

83
• Digital PCR is an analytical technique for quantification of nucleic acid samples based on PCR amplification of single template molecules, without reference to a standard curve.
• Use the number of positive and negative PCR reactions to count the number of target molecules
Digital PCR Workflow

84
• Digital PCR is a statistical technique requiring tens to thousands of
reaction replicates to accurately quantify the absolute number of starting
copies of a target nucleic acid sequence without the use of a standard
• Digital PCR analysis requires that at least some reactions within the
sample replicate group have zero copies
• Amplification is detected in reactions receiving at least one molecule and
classified as positive while no amplification is detectable in reactions not
receiving target and is conversely classified as negative. Following PCR,
the number of positive and negative reactions is counted and fit to a
Poisson distribution to estimate the absolute copies of template
molecules present in the sample volume.
What is a digital PCR experiment?

85
WHEN Should I Use Digital PCR?

86
Applications for Digital PCR
Gene Expression , miRNA & Copy Number Variation
Generation of references and standards
NGS library quantification
Absolute quantification
Rare cancer target detection
Confirmation of NGS variant detection
Allele detection
Absolute quantification of pathogen (e.g. viral load)
Detection of harmful strains of pathogens
GMO detection and monitoring

87
Copy Number Discrimination
� 20% copy number difference is easier to detect usin g Digital PCR
Real-Time PCR
Cycle
Rn
dCt ~ log2(1.2) = 0.26~ 1% difference in
signal
Digital PCR
# copies / well
20% difference in signal
15 pos.
13 pos.
20% more target in Sample A than Sample B

88
WHY I Should Use Digital PCR?
89
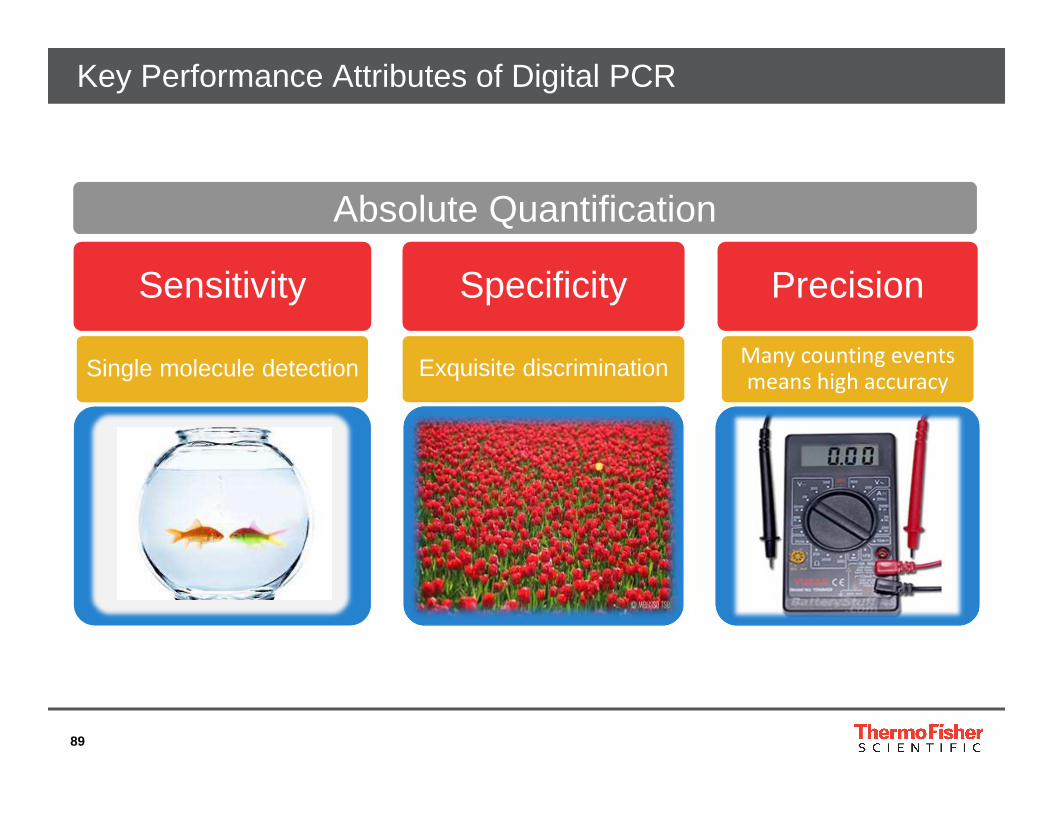
Key Performance Attributes of Digital PCR
Sensitivity
Single molecule detection
Specificity
Exquisite discrimination
Precision
Many counting events means high accuracy
Absolute Quantification

90
QuantStudio™ 3D Digital PCR System Digital PCR Within Reach
Affordable Priced at more than 50% less than competing platforms
Simple As little as a minute to load, a minute to read
Scalable ArchitectureChip-based platform easily scales throughput & dynamic range

91
Sealed System
AmplifyLoad ReadMix
� SEALED SYSTEM
� LIMITED HANDS-ON
� MINIMAL SAMPLE LOSS
Chip-based
Droplet-basedamplify
Simple Workflow With Minimal Sample Handling

92
Just How Small is QuantStudio™ 3D Digital PCR System

93
• Intuitive Touchscreen Functionalities
QuantStudio™ 3D Touchscreen
<1 minute
• Instant results in copies/ µL and result quality displayed on the touch-screen

94
Ability to detect the KRAS G12C Mutation at frequen cyof .025% and .01% vs. the Wild Allele
Representative datasets
Detection Of Rare Somatic Mutation Down To 0.01%

9595
For Research Use Only. Not for use in diagnostic procedures.
© 2015 Thermo Fisher Scientific Inc. All rights reserved. All trademarks are the property of Thermo Fisher Scientific and its subsidiaries unless otherwise specified. TaqMan is a trademark of Roche Molecular Systems, Inc., used under permission and license. Windows is a trademark of Microsoft Corporation.