real-time quadrupole mass spectrometer analysis of gas …127616... · · 2012-08-03real-time...
TRANSCRIPT

Real-time Quadrupole Mass Spectrometer Analysis of Gas in Borehole Fluid Samples Acquired Using the U-Tube Sampling Methodology Barry M. Freifeld1 and Robert C. Trautz Lawrence Berkeley National Laboratory Berkeley, CA, USA 1Corresponding Author (510) 486-4381 [email protected] Abstract Sampling of fluids in deep boreholes is challenging because of the necessity to minimize external contamination and maintain sample integrity during recovery. The U-tube sampling methodology was developed to collect large volume, multiphase samples at in situ pressures. As a permanent or semi-permanent installation, the U-tube can be used for rapidly acquiring multiple samples or it may be installed for long-term monitoring applications. The U-tube was first deployed in Liberty County, TX to monitor crosswell CO2 injection as part of the Frio CO2 sequestration experiment. Analysis of gases (dissolved or separate phase) was performed in the field using a quadrupole mass spectrometer, which served as the basis for determining the arrival of the CO2 plume. The presence of oxygen and argon in elevated concentrations, along with reduced methane concentration, indicate sample alteration caused by the introduction of surface fluids during borehole completion. Despite producing the well to eliminate non-native fluids, measurements demonstrate that contamination persists until the immiscible CO2 injection swept formation fluid into the observation wellbore. Introduction Sampling representative formation fluids from depth is complicated by many factors, including contamination caused by well completion activities and the sample collection process itself. Non-native fluids introduced by drilling and completion often carry distinct signatures, indicating geochemical alteration. Erzinger et al. [2004] performed real-time gas logging of drilling mud and noted drill activities introduced abundant quantities of oxygen, as well as nitrogen and argon, to the formation. The geothermal and petroleum industries have long used tagged drilling fluids as an indicator of drilling fluid contamination [Withjack and Durham, 1996] [Millar, and Buckles, 1974]. In order to obtain representative samples, the wellbore needs to be developed to eliminate drill mud and purge altered fluids. The use of submersible pumps, one of the most common sampling methods, leads to reductions in sample pressure, possibly inducing degassing and resulting in chemical changes. External contamination can occur at any time during sample collection, handling, and analysis, producing erroneous analytical results. Therefore, an appropriate process must exist for maintaining sample integrity while the sample is being collected, transferred, and analyzed using carefully designed sampling and analytical equipment. The U-tube was developed to recover high quality geochemical fluid samples from deep wells. In its first application, the U-tube provided fluid samples from an observation well

perforated at 1.5 km depth to monitor the nearby injection of 1600 metric tons of CO2 during the Frio Pilot Test, Liberty County, Texas [Freifeld et al., 2005]. The geochemistry of the aqueous phase of the U-tube samples as analyzed using a combination of field and laboratory analysis that have been presented in [Kharaka et al., 2005] and [Freifeld et al. 2005]. This paper provides a detailed description of the gas sampling equipment and the quadrupole mass spectrometer (QMS) gas analysis employed at the Frio field site. For a detailed description of the Frio Pilot carbon sequestration experiment and tracer analysis, the reader is referred to Freifeld et al. [2005]. The use of QMS to perform field analysis of gases in borehole fluids is not new [Naumann et al., 2000 ][Wiersberg et al., 2001][Freifeld, 2001][Erzinger et al., 2004]. In previous work, borehole fluids were recovered at reduced pressures, leading to samples that may have undergone fractionation and alteration of the relative gas concentrations. In particular, Naumann et al. [2000] noted that gas chemistry measurements are affected by borehole fluid contamination, wellbore pressure conditions, and gas/liquid disequilibrium. Accurate quantification of gas content per unit volume of formation fluid therefore necessitates that the integrity of the gas composition is preserved during sample recovery. In addition, the volume of source fluid and dissolved gas must also be known. During the Frio Pilot Test, U-tube sampling and field QMS analysis provided estimates for gas concentration of dissolved gas components (CH4, CO2, Ar, N2 and O2) in addition to elution curves for noble gas, perfluorocarbon and SF6 tracers that were used as discrete spikes in the injected CO2. The data revealed considerable alteration from expected values, particularly increased concentrations of Ar and O2, and reductions in CH4. Observations of disturbed gas chemistry provide an explanation for unexpected variations in other measured geochemical parameters, particularly unexpected fluctuations in pH. U-Tube Sampling The U-tube subsurface completion consists of a U-shaped loop of small diameter (9.5 mm) stainless steel tubing forming a drive and sample leg, and a check valve (Autoclave Engineers SWB6600). The drive leg originates at land surface, extends to depth within the well to the screened or perforated zone of interest, and returns via the sampling leg to the surface [Figure 1]. The check valve located downhole, at the bottom of the U between the drive and sample legs, controls the movement of fluid from the perforated interval into the U-tube. A pneumatic packer (Baker Hughes) set on production tubing isolates the perforated interval in the borehole from the large cased volume above, thus minimizing the amount of fluid that needs to be purged to obtain a representative sample. A porous sintered stainless steel filter (Mott Metallurgical Corporation, 40 μm pore size) mounted below the packer in the perforated interval, serves as the inlet to the U-tube and prevents particulates from clogging the check valve and U-tube during sampling. To recover the fluid in the tubing, compressed high-purity N2 gas is applied to the drive leg causing the check valve to close and fluid is forced up the sample tube leg, which leads to an evacuated high-pressure sampling vessel. The U-tube is refilled by shutting off the

compressed gas and venting both the sample and drive legs to the atmosphere, causing the check valve to open and fluid to fill the tubing. The U-tube surface completion consists of six different manifold assemblies, allowing for careful control of sampling conditions. The six manifolds are (1) a high-pressure N2 supply, (2) a N2 purge manifold, (3) a vacuum manifold, (4) a sample manifold, (5) a vent manifold, and (6) a drain manifold [Figure 2]. Each manifold is composed of various combinations of manual and automated valves, pumps and compressors, pressure regulators, transducers, gages, sample vessels, tanks and tubing. In most cases manual and automated valves are installed in parallel to permit either manual or computer controlled operation of the sampling system. The initial operation of the sampling system was performed manually, but as the sequence of sampling steps and timing was determined, a computer controlled automated sampling routine was implemented. Pressure transducers provided continuous feedback on system pressures and strain gages mounted under the sample cylinders measured the weight of the sample collected. To initiate sampling, the surface manifolds and the U-tube were purged of residual fluids using high-purity, high-pressure N2. This prevents cross contamination by removing residual fluids from the system. In addition, the purge, drain, and sample manifolds (including the sample cylinders) were evacuated to ~0.1 bar using a rotary vane vacuum pump (Gast Model 0523-101Q-G582DX) to remove the purged N2, further minimizing sample cross contamination. After completing the purge cycle, the U-tube is filled with reservoir fluid. This is accomplished by opening the vent valves and allowing the drive and sample legs of the U-tube to fill with wellbore fluid as the compressed N2 is vented to the atmosphere. When the fluid level in the U-tube equilibrates with the hydrostatic head in the perforated interval, inflow of fluid ceases. After filling the U-tube, high-purity N2 at 250 bars (approximately twice the bottom hole pressure) is applied to the U-tube drive leg to drive the fluid up the sample leg. The N2 is supplied from a 12,000 L liquid dewar, vaporized, and compressed using a five-stage six cylinder compressor (Greenfield Compression Model 65N 210G). The initial 25 liters recovered, considered more likely to be phase-segregated due to the reduced pressure further up the U-tube, is discharged through the drain manifold. Towards the end of the draining cycle, aqueous samples were collected (at 1 bar pressure) from the sample manifold for pH, EC, major ion, and metal analysis. The drain manifold is then closed and the U-tube sample stream is diverted for collection into the sample cylinders. The middle of the sample stream, consisting of the fluid from the lower half of the U-tube, is considered more representative of the formation fluid, and is subsequently collected in the four 13-liter high-pressure sample cylinders. The sample was permitted to fill the high pressure cylinders until the pressure reached 143 bars (formation pressure). The remaining fluid in the U-tube, roughly 25 liters, was then diverted to the drain manifold and the U-tube was flushed with high pressure N2, repeating the purge cycle once again. After sample collection, the vertically oriented sample cylinders are filled with fluid at formation pressure. Using sample valves located on the tops and bottoms of the cylinders, the collected fluid can be preferentially sampled for both gaseous (at the top) and liquid
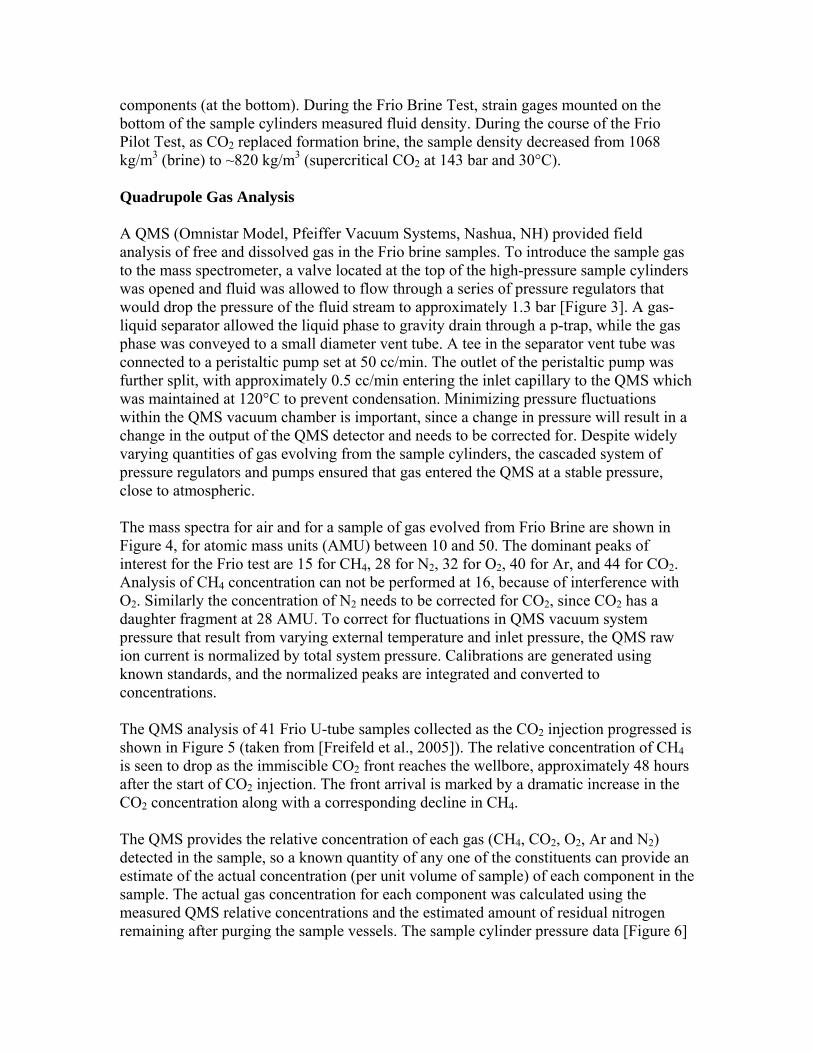
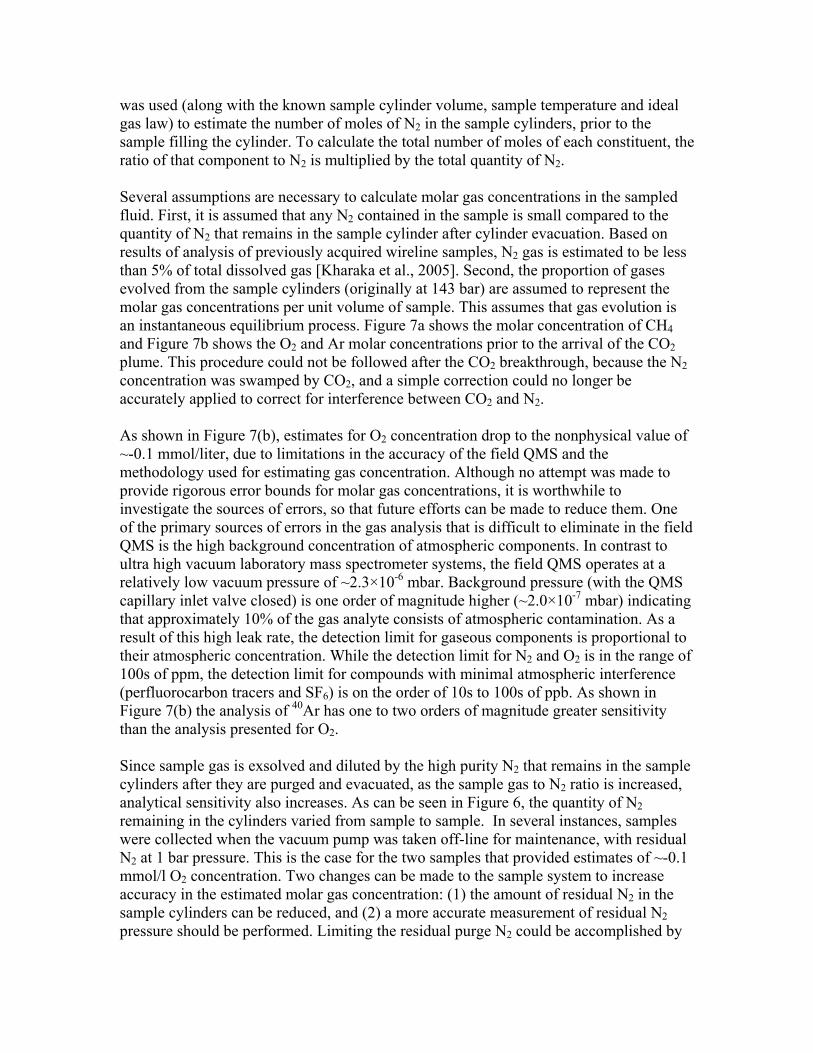
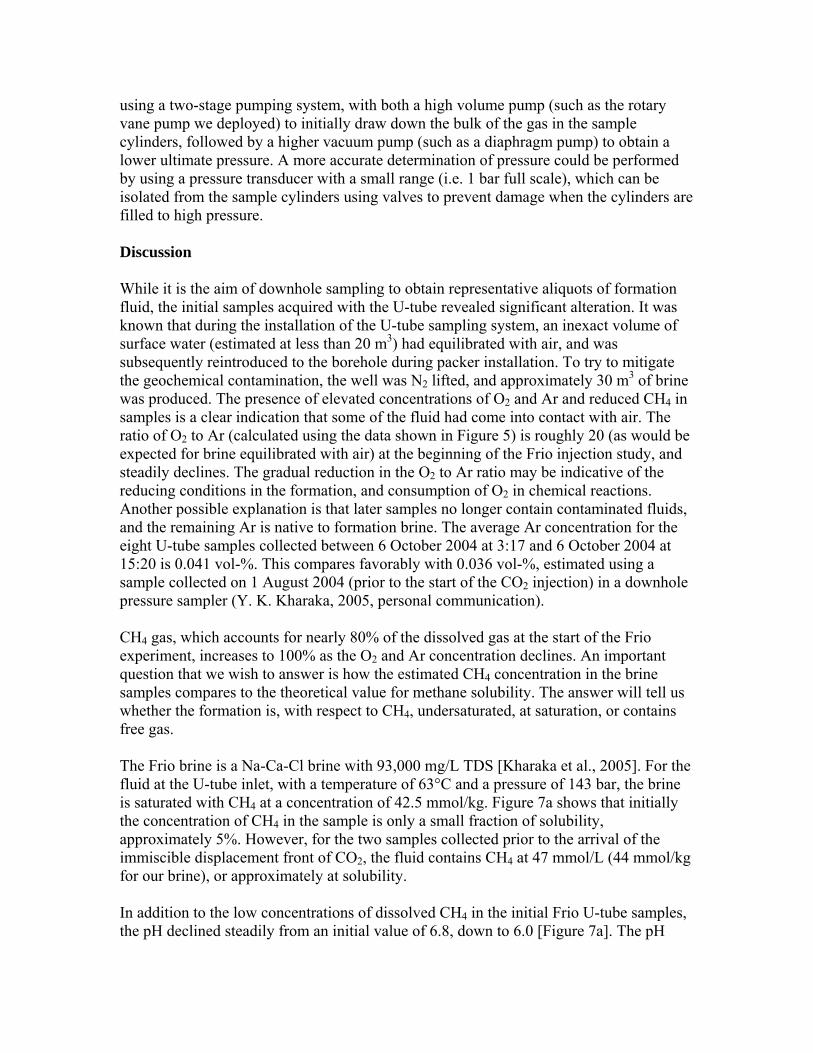
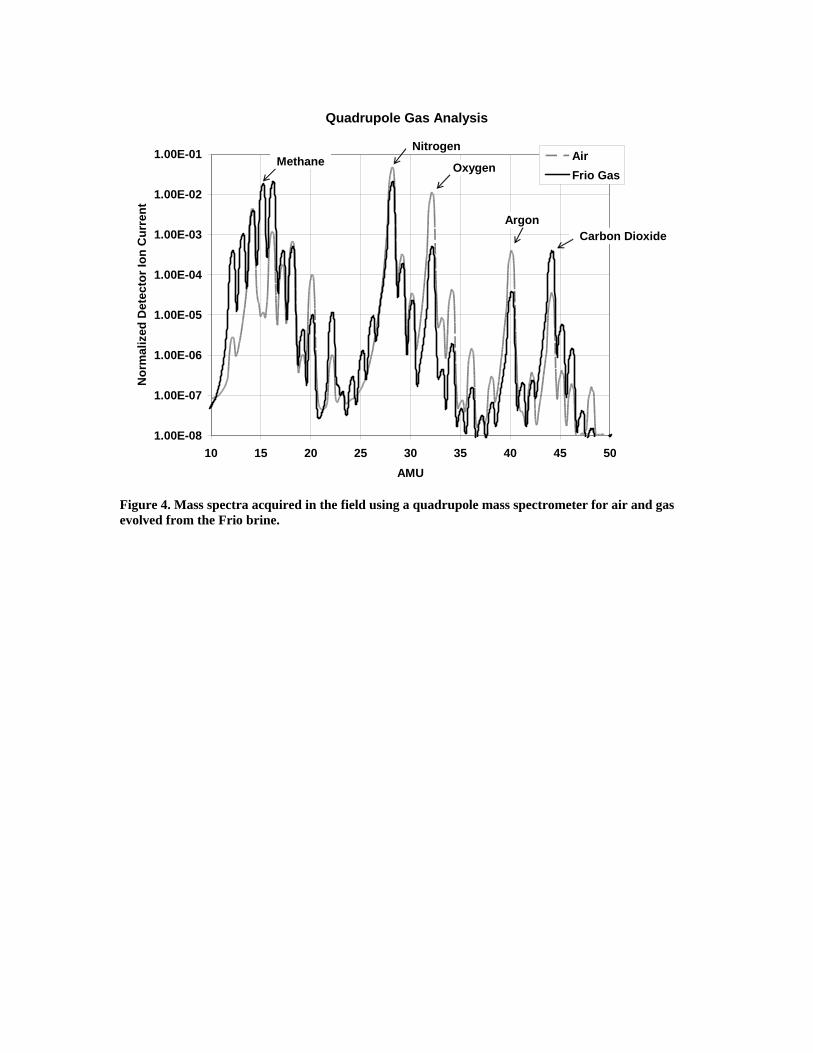
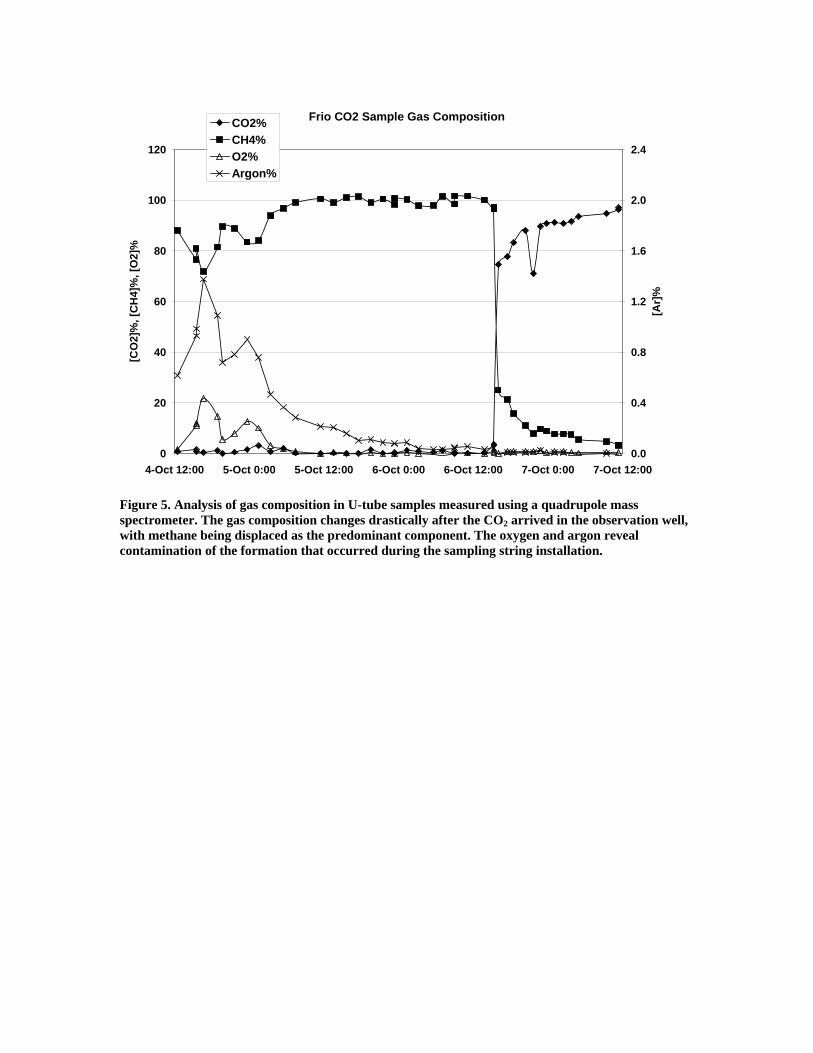
components (at the bottom). During the Frio Brine Test, strain gages mounted on the bottom of the sample cylinders measured fluid density. During the course of the Frio Pilot Test, as CO2 replaced formation brine, the sample density decreased from 1068 kg/m3 (brine) to ~820 kg/m3 (supercritical CO2 at 143 bar and 30°C). Quadrupole Gas Analysis A QMS (Omnistar Model, Pfeiffer Vacuum Systems, Nashua, NH) provided field analysis of free and dissolved gas in the Frio brine samples. To introduce the sample gas to the mass spectrometer, a valve located at the top of the high-pressure sample cylinders was opened and fluid was allowed to flow through a series of pressure regulators that would drop the pressure of the fluid stream to approximately 1.3 bar [Figure 3]. A gas-liquid separator allowed the liquid phase to gravity drain through a p-trap, while the gas phase was conveyed to a small diameter vent tube. A tee in the separator vent tube was connected to a peristaltic pump set at 50 cc/min. The outlet of the peristaltic pump was further split, with approximately 0.5 cc/min entering the inlet capillary to the QMS which was maintained at 120°C to prevent condensation. Minimizing pressure fluctuations within the QMS vacuum chamber is important, since a change in pressure will result in a change in the output of the QMS detector and needs to be corrected for. Despite widely varying quantities of gas evolving from the sample cylinders, the cascaded system of pressure regulators and pumps ensured that gas entered the QMS at a stable pressure, close to atmospheric. The mass spectra for air and for a sample of gas evolved from Frio Brine are shown in Figure 4, for atomic mass units (AMU) between 10 and 50. The dominant peaks of interest for the Frio test are 15 for CH4, 28 for N2, 32 for O2, 40 for Ar, and 44 for CO2. Analysis of CH4 concentration can not be performed at 16, because of interference with O2. Similarly the concentration of N2 needs to be corrected for CO2, since CO2 has a daughter fragment at 28 AMU. To correct for fluctuations in QMS vacuum system pressure that result from varying external temperature and inlet pressure, the QMS raw ion current is normalized by total system pressure. Calibrations are generated using known standards, and the normalized peaks are integrated and converted to concentrations. The QMS analysis of 41 Frio U-tube samples collected as the CO2 injection progressed is shown in Figure 5 (taken from [Freifeld et al., 2005]). The relative concentration of CH4 is seen to drop as the immiscible CO2 front reaches the wellbore, approximately 48 hours after the start of CO2 injection. The front arrival is marked by a dramatic increase in the CO2 concentration along with a corresponding decline in CH4. The QMS provides the relative concentration of each gas (CH4, CO2, O2, Ar and N2) detected in the sample, so a known quantity of any one of the constituents can provide an estimate of the actual concentration (per unit volume of sample) of each component in the sample. The actual gas concentration for each component was calculated using the measured QMS relative concentrations and the estimated amount of residual nitrogen remaining after purging the sample vessels. The sample cylinder pressure data [Figure 6]
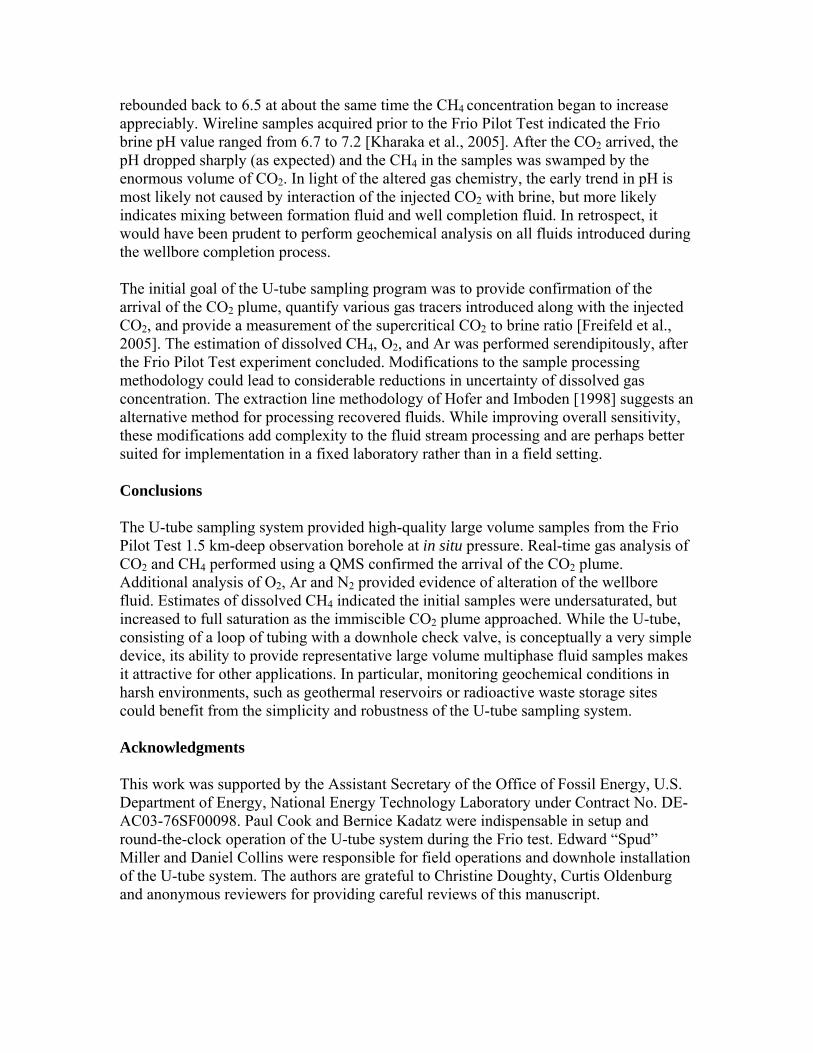
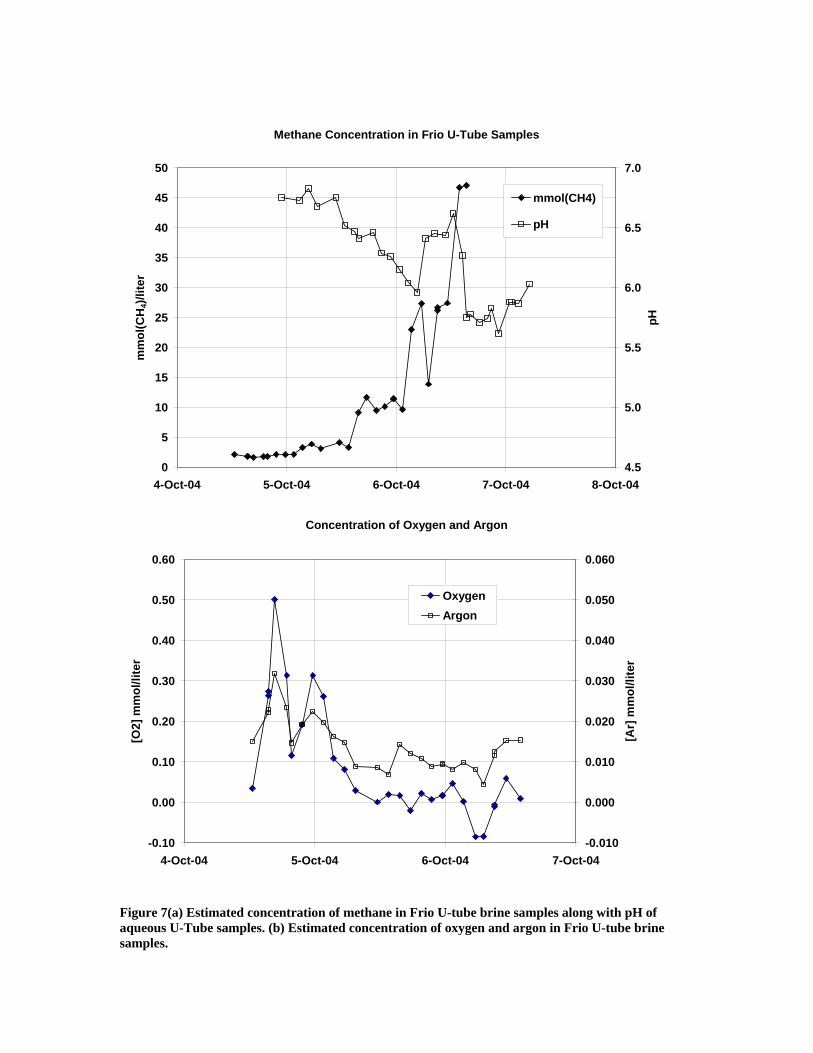
was used (along with the known sample cylinder volume, sample temperature and ideal gas law) to estimate the number of moles of N2 in the sample cylinders, prior to the sample filling the cylinder. To calculate the total number of moles of each constituent, the ratio of that component to N2 is multiplied by the total quantity of N2. Several assumptions are necessary to calculate molar gas concentrations in the sampled fluid. First, it is assumed that any N2 contained in the sample is small compared to the quantity of N2 that remains in the sample cylinder after cylinder evacuation. Based on results of analysis of previously acquired wireline samples, N2 gas is estimated to be less than 5% of total dissolved gas [Kharaka et al., 2005]. Second, the proportion of gases evolved from the sample cylinders (originally at 143 bar) are assumed to represent the molar gas concentrations per unit volume of sample. This assumes that gas evolution is an instantaneous equilibrium process. Figure 7a shows the molar concentration of CH4 and Figure 7b shows the O2 and Ar molar concentrations prior to the arrival of the CO2 plume. This procedure could not be followed after the CO2 breakthrough, because the N2 concentration was swamped by CO2, and a simple correction could no longer be accurately applied to correct for interference between CO2 and N2. As shown in Figure 7(b), estimates for O2 concentration drop to the nonphysical value of ~-0.1 mmol/liter, due to limitations in the accuracy of the field QMS and the methodology used for estimating gas concentration. Although no attempt was made to provide rigorous error bounds for molar gas concentrations, it is worthwhile to investigate the sources of errors, so that future efforts can be made to reduce them. One of the primary sources of errors in the gas analysis that is difficult to eliminate in the field QMS is the high background concentration of atmospheric components. In contrast to ultra high vacuum laboratory mass spectrometer systems, the field QMS operates at a relatively low vacuum pressure of ~2.3×10⁻⁶ mbar. Background pressure (with the QMS capillary inlet valve closed) is one order of magnitude higher (~2.0×10⁻⁷ mbar) indicating that approximately 10% of the gas analyte consists of atmospheric contamination. As a result of this high leak rate, the detection limit for gaseous components is proportional to their atmospheric concentration. While the detection limit for N2 and O2 is in the range of 100s of ppm, the detection limit for compounds with minimal atmospheric interference (perfluorocarbon tracers and SF6) is on the order of 10s to 100s of ppb. As shown in Figure 7(b) the analysis of 40Ar has one to two orders of magnitude greater sensitivity than the analysis presented for O2. Since sample gas is exsolved and diluted by the high purity N2 that remains in the sample cylinders after they are purged and evacuated, as the sample gas to N2 ratio is increased, analytical sensitivity also increases. As can be seen in Figure 6, the quantity of N2 remaining in the cylinders varied from sample to sample. In several instances, samples were collected when the vacuum pump was taken off-line for maintenance, with residual N2 at 1 bar pressure. This is the case for the two samples that provided estimates of ~-0.1 mmol/l O2 concentration. Two changes can be made to the sample system to increase accuracy in the estimated molar gas concentration: (1) the amount of residual N2 in the sample cylinders can be reduced, and (2) a more accurate measurement of residual N2 pressure should be performed. Limiting the residual purge N2 could be accomplished by
using a two-stage pumping system, with both a high volume pump (such as the rotary vane pump we deployed) to initially draw down the bulk of the gas in the sample cylinders, followed by a higher vacuum pump (such as a diaphragm pump) to obtain a lower ultimate pressure. A more accurate determination of pressure could be performed by using a pressure transducer with a small range (i.e. 1 bar full scale), which can be isolated from the sample cylinders using valves to prevent damage when the cylinders are filled to high pressure. Discussion While it is the aim of downhole sampling to obtain representative aliquots of formation fluid, the initial samples acquired with the U-tube revealed significant alteration. It was known that during the installation of the U-tube sampling system, an inexact volume of surface water (estimated at less than 20 m3) had equilibrated with air, and was subsequently reintroduced to the borehole during packer installation. To try to mitigate the geochemical contamination, the well was N2 lifted, and approximately 30 m3 of brine was produced. The presence of elevated concentrations of O2 and Ar and reduced CH4 in samples is a clear indication that some of the fluid had come into contact with air. The ratio of O2 to Ar (calculated using the data shown in Figure 5) is roughly 20 (as would be expected for brine equilibrated with air) at the beginning of the Frio injection study, and steadily declines. The gradual reduction in the O2 to Ar ratio may be indicative of the reducing conditions in the formation, and consumption of O2 in chemical reactions. Another possible explanation is that later samples no longer contain contaminated fluids, and the remaining Ar is native to formation brine. The average Ar concentration for the eight U-tube samples collected between 6 October 2004 at 3:17 and 6 October 2004 at 15:20 is 0.041 vol-%. This compares favorably with 0.036 vol-%, estimated using a sample collected on 1 August 2004 (prior to the start of the CO2 injection) in a downhole pressure sampler (Y. K. Kharaka, 2005, personal communication). CH4 gas, which accounts for nearly 80% of the dissolved gas at the start of the Frio experiment, increases to 100% as the O2 and Ar concentration declines. An important question that we wish to answer is how the estimated CH4 concentration in the brine samples compares to the theoretical value for methane solubility. The answer will tell us whether the formation is, with respect to CH4, undersaturated, at saturation, or contains free gas. The Frio brine is a Na-Ca-Cl brine with 93,000 mg/L TDS [Kharaka et al., 2005]. For the fluid at the U-tube inlet, with a temperature of 63°C and a pressure of 143 bar, the brine is saturated with CH4 at a concentration of 42.5 mmol/kg. Figure 7a shows that initially the concentration of CH4 in the sample is only a small fraction of solubility, approximately 5%. However, for the two samples collected prior to the arrival of the immiscible displacement front of CO2, the fluid contains CH4 at 47 mmol/L (44 mmol/kg for our brine), or approximately at solubility. In addition to the low concentrations of dissolved CH4 in the initial Frio U-tube samples, the pH declined steadily from an initial value of 6.8, down to 6.0 [Figure 7a]. The pH
rebounded back to 6.5 at about the same time the CH4 concentration began to increase appreciably. Wireline samples acquired prior to the Frio Pilot Test indicated the Frio brine pH value ranged from 6.7 to 7.2 [Kharaka et al., 2005]. After the CO2 arrived, the pH dropped sharply (as expected) and the CH4 in the samples was swamped by the enormous volume of CO2. In light of the altered gas chemistry, the early trend in pH is most likely not caused by interaction of the injected CO2 with brine, but more likely indicates mixing between formation fluid and well completion fluid. In retrospect, it would have been prudent to perform geochemical analysis on all fluids introduced during the wellbore completion process. The initial goal of the U-tube sampling program was to provide confirmation of the arrival of the CO2 plume, quantify various gas tracers introduced along with the injected CO2, and provide a measurement of the supercritical CO2 to brine ratio [Freifeld et al., 2005]. The estimation of dissolved CH4, O2, and Ar was performed serendipitously, after the Frio Pilot Test experiment concluded. Modifications to the sample processing methodology could lead to considerable reductions in uncertainty of dissolved gas concentration. The extraction line methodology of Hofer and Imboden [1998] suggests an alternative method for processing recovered fluids. While improving overall sensitivity, these modifications add complexity to the fluid stream processing and are perhaps better suited for implementation in a fixed laboratory rather than in a field setting. Conclusions The U-tube sampling system provided high-quality large volume samples from the Frio Pilot Test 1.5 km-deep observation borehole at in situ pressure. Real-time gas analysis of CO2 and CH4 performed using a QMS confirmed the arrival of the CO2 plume. Additional analysis of O2, Ar and N2 provided evidence of alteration of the wellbore fluid. Estimates of dissolved CH4 indicated the initial samples were undersaturated, but increased to full saturation as the immiscible CO2 plume approached. While the U-tube, consisting of a loop of tubing with a downhole check valve, is conceptually a very simple device, its ability to provide representative large volume multiphase fluid samples makes it attractive for other applications. In particular, monitoring geochemical conditions in harsh environments, such as geothermal reservoirs or radioactive waste storage sites could benefit from the simplicity and robustness of the U-tube sampling system. Acknowledgments This work was supported by the Assistant Secretary of the Office of Fossil Energy, U.S. Department of Energy, National Energy Technology Laboratory under Contract No. DE-AC03-76SF00098. Paul Cook and Bernice Kadatz were indispensable in setup and round-the-clock operation of the U-tube system during the Frio test. Edward “Spud” Miller and Daniel Collins were responsible for field operations and downhole installation of the U-tube system. The authors are grateful to Christine Doughty, Curtis Oldenburg and anonymous reviewers for providing careful reviews of this manuscript.
References Erzinger, J., Wiersberg, T. and Dahms, E., 2004, Real-time mud gas logging during drilling of the SAFOD Pilot Hole in Parkfield, CA, Geophys. Res. Lett., 31, L13S18, doi:10.1029/2003GL019395. Freifeld, B.M., 2001, Estimation of fracture porosity in an unsaturated fractured welded tuff using gas tracer testing, Ph.D. dissertation, U.C. Berkeley 2001. Freifeld, B. M., R. C. Trautz, Y. K. Kharaka, T. J. Phelps, L. R. Myer, S. D. Hovorka, and D. J. Collins, 2005, The U-tube: A novel system for acquiring borehole fluid samples from a deep geologic CO2 sequestration experiment, J. Geophys. Res., 110, B10203, doi:10.1029/2005JB003735. Hofer, M. and Imboden, D.M., 1998, Simultaneous determination of CFC-11, CFC-12, N2, and Ar in water, Analytical Chem., 70, 724–729. Kharaka, Y. K. Cole, D., Gunter, W., Knauss, K., and Nance, S., 2005, Geochemistry of water and gases in the Frio Brine Pilot Test: baseline data and changes during and post CO2 injection, Fourth Annual Conference on Carbon Capture & Sequestration, May 2–5, Alexandria, Virginia, USA. Millar, R.H.G., and Buckles, R.S., 1974, Tritiated water as a drilling mud tracer in Beaufort exploration wells: Petroleum Society of Canadian Institute of Mining and Metallurgy Annual Meeting, 25th, Calgary, 1974, Paper 374030, 5 p. Naumann, D., Zimmer, M., Erzinger, J., and Wiersberg, T., 2001, Gas monitoring, fluid flux and fluid sampling at well GPK-2 (Soultz-sous-Forets, France)–first results from the 5000 m production test, in Geothermische Technologieentwicklung - geologische und energietechnische, Ansatzpunkte, Scientific Technical Report of the GeoForschungsZentrum Potsdam, 123, 73–86. Wiersberg, T., Erzinger, J., Zimmer, M., Woith, H., and Kafri, U., 2001, Gas monitoring of an artesian water well in the Arava Rift Valley, Israel, European Union of Geosciences 2001 Meeting, April 8–12, Strasbourg, France. Withjack, E.M., and Durham, J.R., 1996, Characterization and saturation determination of geothermal rock by CT and NMR (4 p. abstract) in Research results from The Geysers Coring Project (J.B. Hulen, editor): University of Utah, Earth Sciences and Resources Institute (now Energy and Geoscience Institute), Report No. ESRI-27495-96/3, 173 p.

Figure 1. Details of the U-Tube sampling system downhole assembly. When the drive and sample legs are depressurized by venting purge gas, downhole fluid enters the U-tube through the inlet filter. By hydrostatic pressure, fluid is forced through the check valve until the head in the tubing equals the hydrostatic head in the reservoir, at which time the check valve closes. The sample is recovered by pressurizing the drive leg and collecting the fluid from the sample leg.
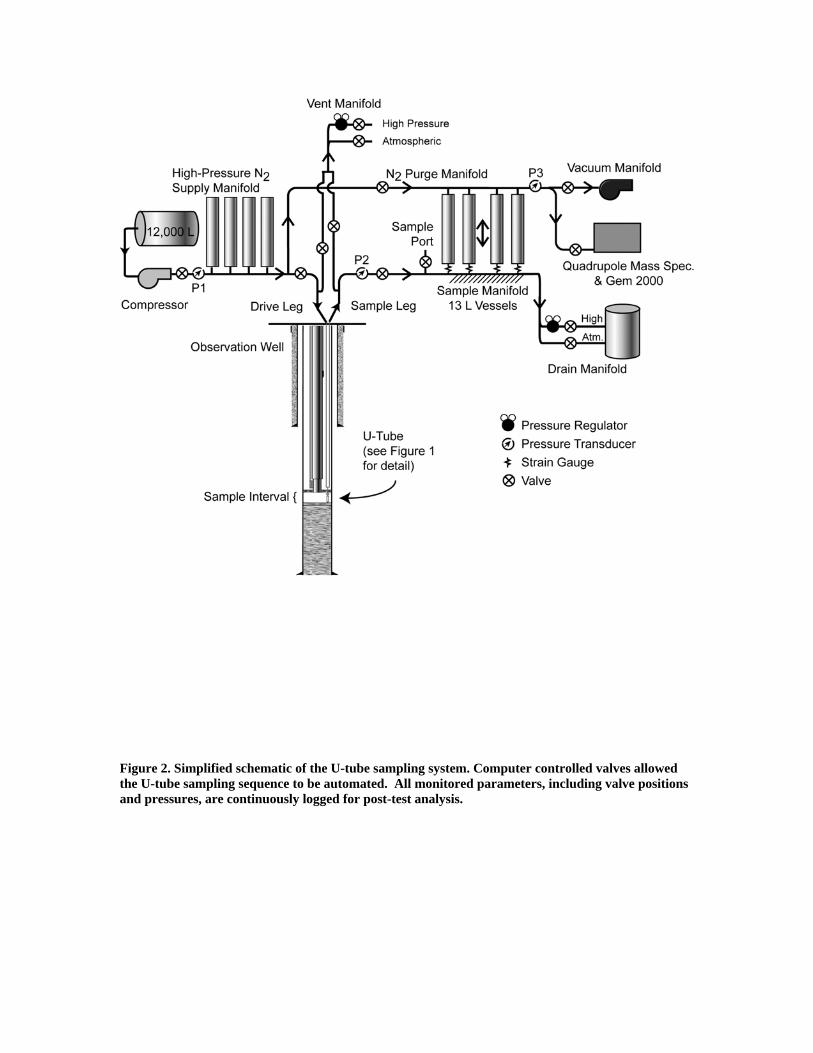
Figure 2. Simplified schematic of the U-tube sampling system. Computer controlled valves allowed the U-tube sampling sequence to be automated. All monitored parameters, including valve positions and pressures, are continuously logged for post-test analysis.

Figure 3. Schematic of the gas analysis manifold for performing real-time quadrupole mass spectrometry.
Quadrupole Gas Analysis
1.00E-08
1.00E-07
1.00E-06
1.00E-05
1.00E-04
1.00E-03
1.00E-02
1.00E-01
10 15 20 25 30 35 40 45 50AMU
Nor
mal
ized
Det
ecto
r Ion
Cur
rent
AirFrio Gas
Methane
Argon
Nitrogen
Oxygen
Carbon Dioxide
Figure 4. Mass spectra acquired in the field using a quadrupole mass spectrometer for air and gas evolved from the Frio brine.
Frio CO2 Sample Gas Composition
0
20
40
60
80
100
120
4-Oct 12:00 5-Oct 0:00 5-Oct 12:00 6-Oct 0:00 6-Oct 12:00 7-Oct 0:00 7-Oct 12:00
[CO
2]%
, [C
H4]
%, [
O2]
%
0.0
0.4
0.8
1.2
1.6
2.0
2.4
[Ar]
%
CO2%CH4%O2%Argon%
Figure 5. Analysis of gas composition in U-tube samples measured using a quadrupole mass spectrometer. The gas composition changes drastically after the CO2 arrived in the observation well, with methane being displaced as the predominant component. The oxygen and argon reveal contamination of the formation that occurred during the sampling string installation.

Sample Cylinder Pressure
0
0.5
1
1.5
2
06-Oct-04 6:00 06-Oct-04 12:00 06-Oct-04 18:00
Pres
sure
(bar
)
Vacuum Pump Removed for Maintenance
Figure 6. Pressure in the sample cylinders. Each low pressure reading corresponds to the pre-sample pressure after the nitrogen purge and evacuation cycle. The pressure can be used to provide an estimate of the quantity of residual nitrogen in the sample cylinders prior to sampling.
Methane Concentration in Frio U-Tube Samples
0
5
10
15
20
25
30
35
40
45
50
4-Oct-04 5-Oct-04 6-Oct-04 7-Oct-04 8-Oct-04
mm
ol(C
H4)
/lite
r
4.5
5.0
5.5
6.0
6.5
7.0
pH
mmol(CH4)
pH
Concentration of Oxygen and Argon
-0.10
0.00
0.10
0.20
0.30
0.40
0.50
0.60
4-Oct-04 5-Oct-04 6-Oct-04 7-Oct-04
[O2]
mm
ol/li
ter
-0.010
0.000
0.010
0.020
0.030
0.040
0.050
0.060
[Ar]
mm
ol/li
ter
OxygenArgon
Figure 7(a) Estimated concentration of methane in Frio U-tube brine samples along with pH of aqueous U-Tube samples. (b) Estimated concentration of oxygen and argon in Frio U-tube brine samples.