recent trends in the - us forest service · recent trends in the asian forest products trade and...
TRANSCRIPT
Recent Trends in the Asian Forest Products Trade and Their Impact on AlaskaJoseph A. Roos, Daisuke Sasatani, Allen M. Brackley, and Valerie Barber1
United States Department of Agriculture
Forest Service
Pacific Northwest Research Station
Research NotePNW-RN-564June 2010
DEPAR TMENT OF AGRICULT URE
1 Joseph A. Roos is a research associate and Daisuke Sasatani is a research assistant, University of Washington, Seattle, WA 98105; Allen M. Brackley is a research forester, U.S. Department of Agriculture, Forest Service, Pacific Northwest Research Station, Alaska Wood Utilization Research and Development Center, 204 Siginaka Way, Sitka, AK 99835; and Valerie Barber is an assistant professor, Forest Products Program, University of Alaska Fairbanks, Palmer, AK 99645.
AbstractThis paper analyzes patterns of forest products trade between Asia and Alaska. Secondary data were collected and analyzed to identify Alaska forest product trading partners and the species used. Some of the many trends occurring in the Asian forest products industry include the shift from solid wood products to engineered wood products, the evolution of China as “the factory to the world” where low-cost labor enables manufacturers to produce price-competitive wood products that are shipped to markets throughout the globe, and the entry of Russia, Europe, Asia, and Southern Hemisphere nations into the market with both log and lumber products. In spite of the global economic downturn, forest products exports from several suppliers are increasing. Analysis of U.S. trade data indicates that exports of spruce (Picea spp.), western hemlock (Tsuga heterophylla (Raf.) Sarg.), Douglas-fir (Pseudotsuga menziesii (Mirb.) Franco), and western redcedar (Thuja plicata Donn ex D. Don) logs remain strong. Likewise, Douglas-fir, western hemlock, and western redcedar lumber exports are also improving. Douglas-fir lumber exports to Japan and western hemlock lumber exports to South Korea showed strong recent gains. The outlook for continued increases in forest products exports to Asia is strong, and the authors recommend a coordinated Alaska forest products market effort targeting China, South Korea, and Japan.
Keywords: Forest products, lumber, export, timber, Japan, China, Korea.

2
ReseARch noTe Pnw-Rn-564
IntroductionThe three largest forest products import countries in the world are the United States, Japan, and China. In 2008, the value of forest products imported by these countries was US$7.5 billion for the United States, US$5.3 billion for Japan, and US$4.2 billion for China (GTI 2009). Another key forest products market is Europe. In 2008, Germany, France, United Kingdom, and Italy imported a combined total value of US$14.2 billion of forest products (harmonized code 4400) (GTI 2009). A general trade pattern has developed where logs are exported to China from North America, Europe, and Asia, and finished forest products are exported from China to the United States, Japan, and Europe. Alaska forest products are an important part of this trade pattern, and it is important that Alaska manufacturers understand where their competitive advantages lie within this trade pattern. The purpose of this paper is to examine the Alaska, China, Japan trade pattern and the opportunities for Alaska forest products.
In the United States, forest products producers are currently experiencing one of the worst economic downturns since World War II. In 2008, there were 904,300 U.S. housing starts, which was a 56 percent decline from 2.1 million in 2005. As a result of the depressed housing market, lumber prices have also fallen to a historic low. According to the Random Lengths Lumber Composite Price Index (Random Lengths 2008), lumber prices in 2008 were approximately 50 percent below 2004 levels (fig. 1). One strategy for U.S. suppliers to offset losses as a result of the economic downturn is to export. A well-planned export strategy can provide market diversification, which can help companies lessen the losses associated with economic downturns. However, embarking on an export venture is not a simple endeavor. Cunningham and Eastin’s (2002) survey of North American exporters found that a successful export strategy requires a strong marketing commitment including translating product literature and providing strong customer support, after-sale service, and market maintenance. Individual foreign markets also have their own unique challenges. In China, for example, many construction projects are controlled by government agencies. Therefore, understanding government policy and establishing relationships with government officials is often critical to success (Cao et al. 2006).
One example of how exporting has helped a mill during this economic down-turn is the Native American tribe-owned Warm Springs Forest Products Mill2 located in Oregon. In April of 2008, poor sales forced Warm Springs mill managers
2 The use of firm or trade names in this publication is for reader information and does not imply endorsement by the U.S. Department of Agriculture of any product or service.

3
Recent Trends in the Asian Forest Products Trade and Their Impact on Alaska
0
0.5
1.0
1.5
2.0
2.5
0
50
100
150
200
250
300
350
400
450
Hous
ing
star
ts (m
illio
ns)
Lum
ber p
rice
(dol
lars
per
thou
sand
boa
rd fe
et)
Year
Housing starts Lumber price
1995
1996
1997
1998
1999
2000
2001
2002
2003
2004
2005
2006
2007
2008
Figure 1—United States housing starts and lumber prices (Random Lengths 2008, U.S. Census Bureau 2009).
to lay off 115 workers. Following the initial round of layoffs, Warm Springs managers leased the mill to Vanport International with the agreement to cut lumber exclusively for the Japanese market (Nadvornick 2009). Vanport was established in 1967 and has been supplying lumber cut to Japanese dimensions and grades since the early 1970s. Vanport understood that Warm Spring’s tight vertical grain logs could be manufactured into lumber products that are in high demand in Japan. Vanport implemented a strategy of manufacturing specialty Japanese lumber rather than commodity lumber, and this allowed the mill to rehire workers and increase mill employment to 122 workers.
The manufacturing of value-added forest products has been shifting to China since the late 1990s. China’s cheap labor and capital costs have given Chinese manufacturers an extreme advantage compared to their higher cost competitors (Cao et al. 2006). China imports large quantities of logs to supply its domestic processors. In 2007, China’s two largest forest product suppliers were Russia, with a 37.2-percent share, and the United States, with a 7.5-percent share of China’s total imports (harmonized code 4400) (GTI 2009). The logs are milled in China and the finished forest products are then exported. In 2007, China’s two largest forest product export markets were the United States, with a 26-percent share, and Japan,
4
ReseARch noTe Pnw-Rn-564
with a 13.5-percent share. The United States has lost significant share of its value-added wood products market in Japan to China.
There are a number of recent developments in the global forest products market that could be advantageous for Alaska forest products manufacturers. First, between December 2006 and December 2008, the U.S. dollar devalued approximately 23 percent against the Japanese yen, making U.S. forest products substantially cheaper. Second, on January 1, 1997, Russia imposed a log export tax. The tax was scheduled to increase to 80 percent on January 1, 2009, but the increase was postponed and the duty remains at 25 percent (Random Lengths International 2008). The Russian log export tax and uncertainty over how much it will increase has Japanese and Chinese forest products companies searching for new suppliers to reduce their reliance on Russian timber. Third, Alaska has increased their kiln-drying capacity from an estimated 94,000 board feet (21 cubic meters) in 2000, to an estimated 220,000 board feet (49 cubic meters) (Nicholls et al. 2006). As in the United States, the Japanese market has shifted from using green lumber to kiln-dried lumber for most residential construction applications, and increased kiln-drying capacity opens up more opportunity in the Japanese market (Sasatani et al. 2005).
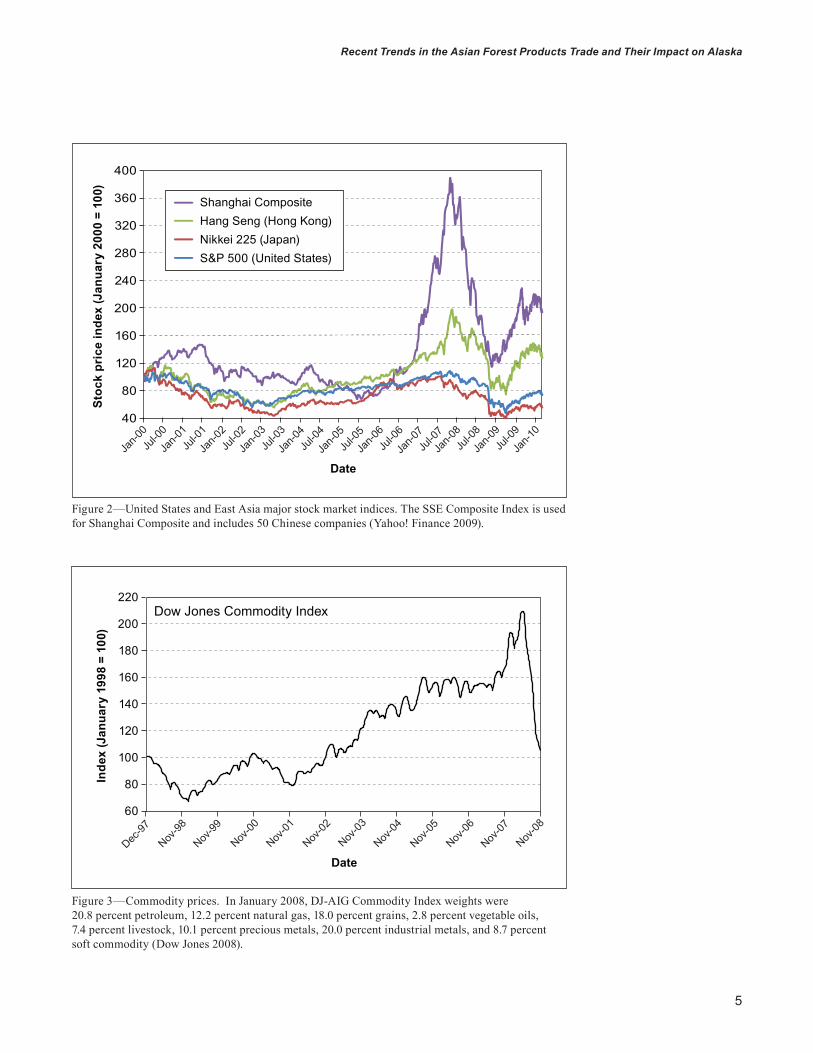
economic BackgroundIn 2008, the global economy continued to suffer from events triggered by the 2007 subprime credit crisis and overall stagnant demand. Stock markets around the globe plunged (fig. 2), and reduced consumer confidence. Additionally, com-modity prices, as measured by the Dow Jones-AIG Commodity Index, declined sharply in 2008, reflecting reduced demand for raw materials (fig. 3).
The forest products industry has been deeply affected by this economic crisis. With credit tight and consumer confidence at historical lows, U.S. housing starts in 2008 and 2009 were at the lowest levels since the government began keeping records in 1959. Housing starts are the primary driver for softwood lum-ber demand, and as housing starts fell, so did lumber prices (see fig. 1). Although the housing sector remains sluggish, in the second half of 2009, the United States emerged from its recession with third quarter economic growth at 2.2 percent and fourth quarter economic growth at 5.7 percent (BEA 2010).
5
Recent Trends in the Asian Forest Products Trade and Their Impact on Alaska
DateJa
n-00Ju
l-00
Jan-0
1Ju
l-01
Jan-0
2Ju
l-02
Jan-0
3Ju
l-03
Jan-0
4Ju
l-04
Jan-0
5Ju
l-05
Jan-0
6Ju
l-06
Jan-0
7Ju
l-07
Jan-0
8Ju
l-08
Jan-0
9Ju
l-09
Jan-1
0
Stoc
k pr
ice
inde
x (J
anua
ry 2
000
= 10
0)
400
360
320
280
240
200
160
120
80
40
Shanghai CompositeHang Seng (Hong Kong)Nikkei 225 (Japan)S&P 500 (United States)
Figure 2—United States and East Asia major stock market indices. The SSE Composite Index is used for Shanghai Composite and includes 50 Chinese companies (Yahoo! Finance 2009).
Figure 3—Commodity prices. In January 2008, DJ-AIG Commodity Index weights were 20.8 percent petroleum, 12.2 percent natural gas, 18.0 percent grains, 2.8 percent vegetable oils, 7.4 percent livestock, 10.1 percent precious metals, 20.0 percent industrial metals, and 8.7 percent soft commodity (Dow Jones 2008).
DateDec
-97
Nov-98
Nov-99
Nov-00
Nov-01
Nov-02
Nov-03
Nov-04
Nov-05
Nov-06
Nov-07
Nov-08
Inde
x (J
anua
ry 1
998
= 10
0)
Dow Jones Commodity Index220
200
180
160
140
120
100
80
60
6
ReseARch noTe Pnw-Rn-564
China’s Economic Background China is one of the world’s leading suppliers of value-added wood products. It is also one of the world’s largest consumer markets (USITC 2009). In late 1978, the Communist Party of China began shifting the economy from a centrally planned, Soviet-style economy to a market-oriented economy. The Chinese economy was still suffering from the effects of the “Cultural Revolution” (1966–1976) and the “Great Leap Forward policy” (1957–1960). To jump start the economy and encour-age companies to improve their productivity and profitability, Deng Xiaoping, the leader of the Communist Party, introduced the “socialism with Chinese characteris-tics” program. This was an effort to encourage state-run entities to increase pro-ductivity. The initial problem with this reform was motivating workers to increase production of goods and services. Production incentives were added that eventually helped improve efficiency.
In 1979, Shenzhen, Zhuhai, and Shantou (Swatou) in Guangdong (Canton) Province and Xiamen (Amoy) in Fujian Province were named special economic zones (SEZ), which were designed to attract foreign capital (fig. 4). Foreign com-panies wishing to establish businesses in these SEZs were required to establish joint ventures with Chinese firms. The benefits of the SEZ included preferential tax treatment and greater business autonomy for foreign firms. For example, foreign companies located within a SEZ were exempt from import tariffs and corporate taxes for the first 3 years of operation. Most of the first SEZs were concentrated on the southern coast of China neighboring cities known as international finance and business hubs such as Hong Kong and Macau.
China’s programs to attract foreign direct investment were successful, and in 1984 the Communist Party opened the following 14 coastal cities to foreign direct investment: Dalian, Qinhuangdao, Tianjin, Yantai, Qingdao, Lianyung-gang, Nantong, Shanghai, Ningbo, Wenzhou, Fuzhou, Guangzhou, Zhanjiang, and Beihai. These areas, although open for foreign direct investment, did not offer tax incentives and other benefits granted to the SEZs. Since 1988, China’s open foreign direct investment policy has been expanded to the economic zones of the Yangtze River Delta, Pearl River Delta, the Xiamen-Zhangzhou-Quanzhou Triangle in south Fujian, Shangdong Peninsula, Liaodong Peninsula, Hebei, and Guangxi. Then, Hainan Island became the fifth SEZ in 1988. Although it is not an official SEZ, Pudong New District in Shanghai established similar incentives for foreign compa-nies in the early 1990s. Pudong is now one of the most attractive Chinese locations for foreign investment.

7
Recent Trends in the Asian Forest Products Trade and Their Impact on Alaska
In the 1980s, the Communist Party changed from a “centralized price-controlled economy” to a “price-driven market economy.” This new market system relied on a dual-track pricing system, where the prices of some goods and services were controlled by the state and others were decided by the free market. Gradually, China increased the portion of goods and services that were priced by the market.
In 1989, the Tian’an-men Square incident temporarily interrupted China’s economic reform (Wu 1997). However, economic reforms resumed in the 1990s as the Communist Party reformed the banking system, gradually began to close unprofitable state-owned enterprises, and eventually allowed foreign investors to establish wholly foreign-owned enterprises.
In 2001, China became a member of the World Trade Organization, and the central government strengthened trade liberalization policies. The result of China’s economic development was the creation of a unique economic system that could be called “controlled capitalism.” This is a hybrid economy, where both socialism
Figure 4—People’s Republic of China and its special economic zones (SEZ). Map is based on China Administrative Regions geographic information system data (Liu et al. 1996). SAR = special administrative region.

8
ReseARch noTe Pnw-Rn-564
and capitalism play important roles. Deng Xiaoping summed up the system in an October 1985 Beijing speech when he said, “Let some people get rich first” and this will lead to prosperity for others (Fan 2007).
The Chinese currency (yuan) is called the renmin-bi (RMB) in China, which is literally translated as “the people’s currency.” When inflation rose above 20 percent in 1984, the Communist Party responded by implementing an economic stabiliza-tion plan that included fixing the RMB at 8.28 RMB to 1 U.S. dollar. Although the policy reduced inflation substantially, China has been criticized by the international community for unfairly keeping prices of Chinese goods low through the fixed exchange rate.
China faced another economic challenge with the 1997 Asian financial crisis, which devaluated many Asian countries’ currencies and sent much of Asia into a recession. Premier Zhu Rongji stated that China would not devalue their currency in reaction to the Asian financial crisis, and the RMB remained pegged to the U.S. dollar until July 21, 2005. On this date, the People’s Bank of China announced that the RMB would be pegged to a basket of foreign currencies rather than strictly being pegged to the U.S. dollar. The RMB would be pegged to the basket of other currencies, but it would be allowed to trade within a narrow 0.3-percent band daily (People’s Bank of China 2005). China has stated that the major currencies in the basket include the U.S. dollar, euro, Japanese yen, South Korean won, and British pound sterling. Other currencies were also included such as the Thai baht, Russian ruble, Australian dollar, Canadian dollar, and Malaysian ringgit (Yan and Lam 2005). Although the official policy is to allow the currency to float within the offi-cial band, one of the main objectives of the Communist Party is job creation, and it appears the Chinese government pursues policies to keep the RMB artificially cheap against other currencies in order to stimulate exports and create more jobs.
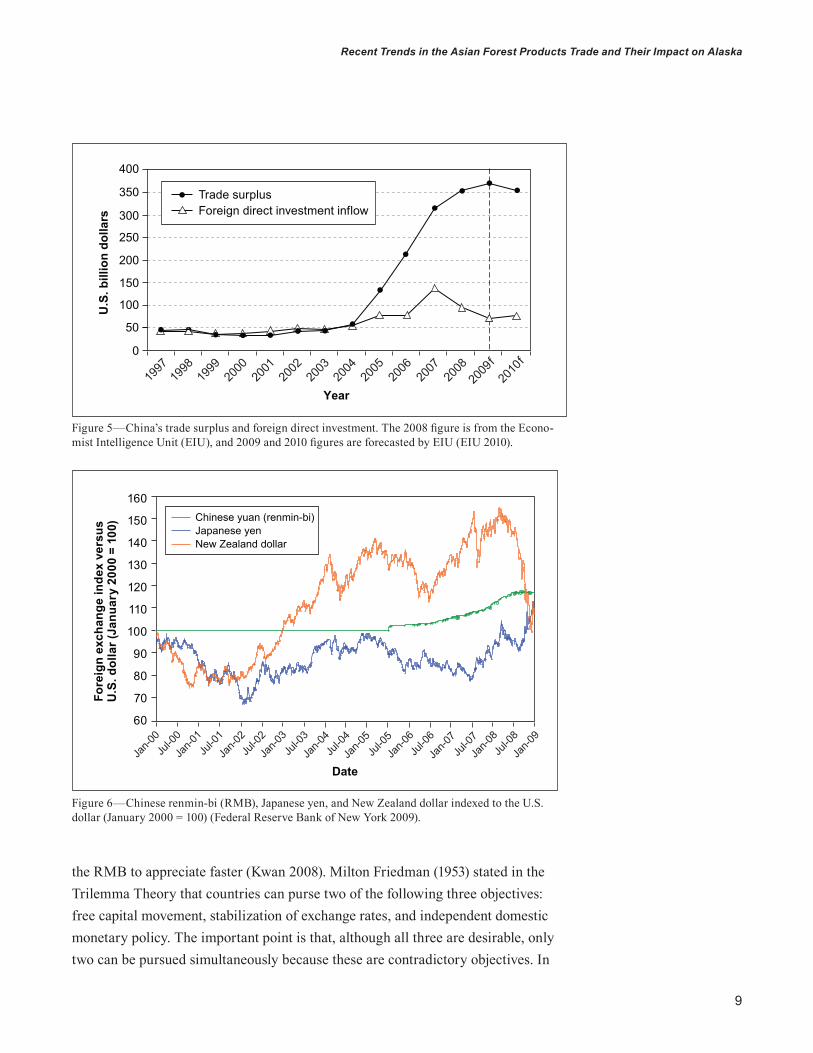
Consequently, one major challenge to China’s exchange rate policy is accumula-tion of foreign reserves and its effect on their trading partners. China exports more than it imports, thus producing a trade surplus and an accumulation of foreign reserves (fig. 5). Also, foreign direct investment in China exceeds China’s direct investment abroad. China’s trade surplus has caused friction with the United States and other trading partners.
The main question with respect to the future of the RMB is if it will remain a managed float system or move toward a market-based free-float system. The weak-ening of the U.S. dollar has placed tremendous upward pressure on the RMB. As of January 2009, the RMB was trading at 6.84 RMB to 1 U.S. dollar, which is about a 17 percent increase from 8.28 RMB fixed level (fig. 6). This indicates the policy stance of the People's Bank of China is to reduce inflationary pressures by allowing
9
Recent Trends in the Asian Forest Products Trade and Their Impact on Alaska
Figure 5—China’s trade surplus and foreign direct investment. The 2008 figure is from the Econo-mist Intelligence Unit (EIU), and 2009 and 2010 figures are forecasted by EIU (EIU 2010).
0
50
100
150
200
250
300
350
400
U.S
. bill
ion
dolla
rs
Year19
9719
9819
9920
0020
0120
0220
0320
0420
0520
0620
0720
0820
09f
2010
f
Trade surplusForeign direct investment inflow
Figure 6—Chinese renmin-bi (RMB), Japanese yen, and New Zealand dollar indexed to the U.S. dollar (January 2000 = 100) (Federal Reserve Bank of New York 2009).
Fore
ign
exch
ange
inde
x ve
rsus
U
.S. d
olla
r (Ja
nuar
y 20
00 =
100
) Chinese yuan (renmin-bi)Japanese yenNew Zealand dollar
DateJa
n-00Ju
l-00
Jan-0
1Ju
l-01
Jan-0
2Ju
l-02
Jan-0
3Ju
l-03
Jan-0
4Ju
l-04
Jan-0
5Ju
l-05
Jan-0
6Ju
l-06
Jan-0
7Ju
l-07
Jan-0
8
Jan-0
9Ju
l-08
160
150
140
130
120
110
100
90
80
70
60
the RMB to appreciate faster (Kwan 2008). Milton Friedman (1953) stated in the Trilemma Theory that countries can purse two of the following three objectives: free capital movement, stabilization of exchange rates, and independent domestic monetary policy. The important point is that, although all three are desirable, only two can be pursued simultaneously because these are contradictory objectives. In
10
ReseARch noTe Pnw-Rn-564
order to control inflation via monetary policy, China may soon reach the conclusion that it must allow its currency to float freely.
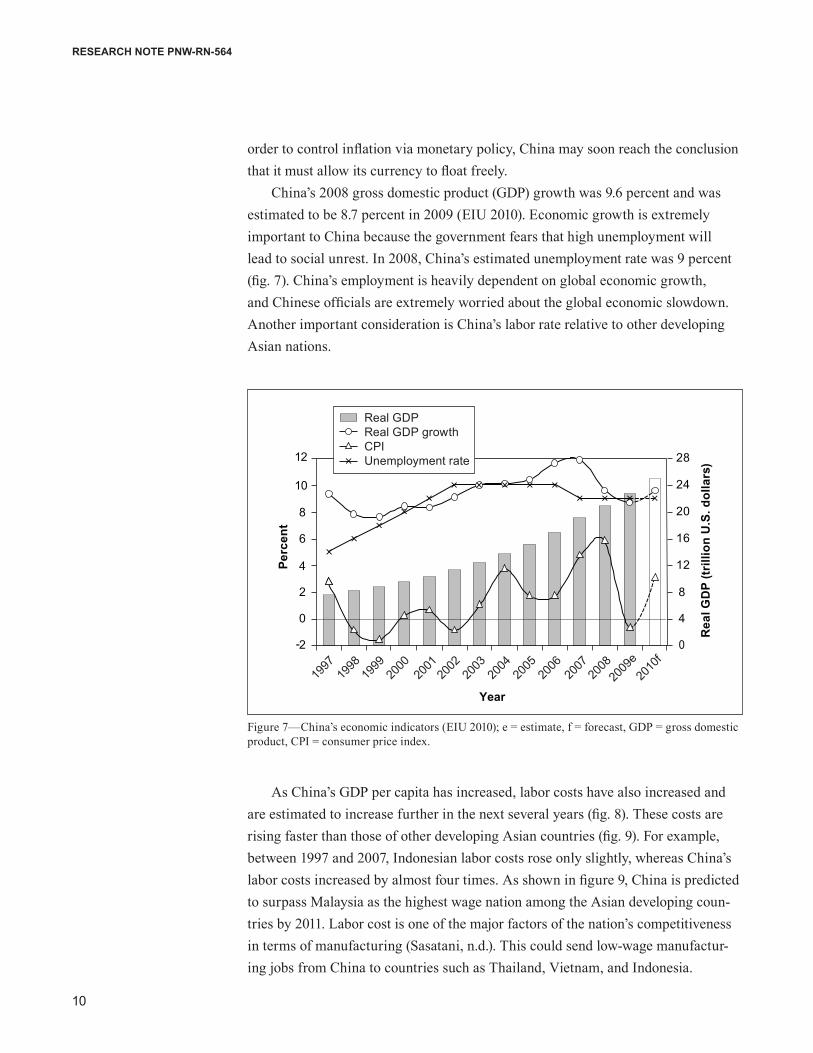
China’s 2008 gross domestic product (GDP) growth was 9.6 percent and was estimated to be 8.7 percent in 2009 (EIU 2010). Economic growth is extremely important to China because the government fears that high unemployment will lead to social unrest. In 2008, China’s estimated unemployment rate was 9 percent (fig. 7). China’s employment is heavily dependent on global economic growth, and Chinese officials are extremely worried about the global economic slowdown. Another important consideration is China’s labor rate relative to other developing Asian nations.
Figure 7—China’s economic indicators (EIU 2010); e = estimate, f = forecast, GDP = gross domestic product, CPI = consumer price index.
0
4
8
12
16
20
24
28
-2
0
2
4
6
8
10
12
Rea
l GD
P (tr
illio
n U
.S. d
olla
rs)
Perc
ent
Year
1997
1998
1999
2000
2001
2002
2003
2004
2005
2006
2007
2008
2009
e20
10f
Real GDPReal GDP growthCPIUnemployment rate
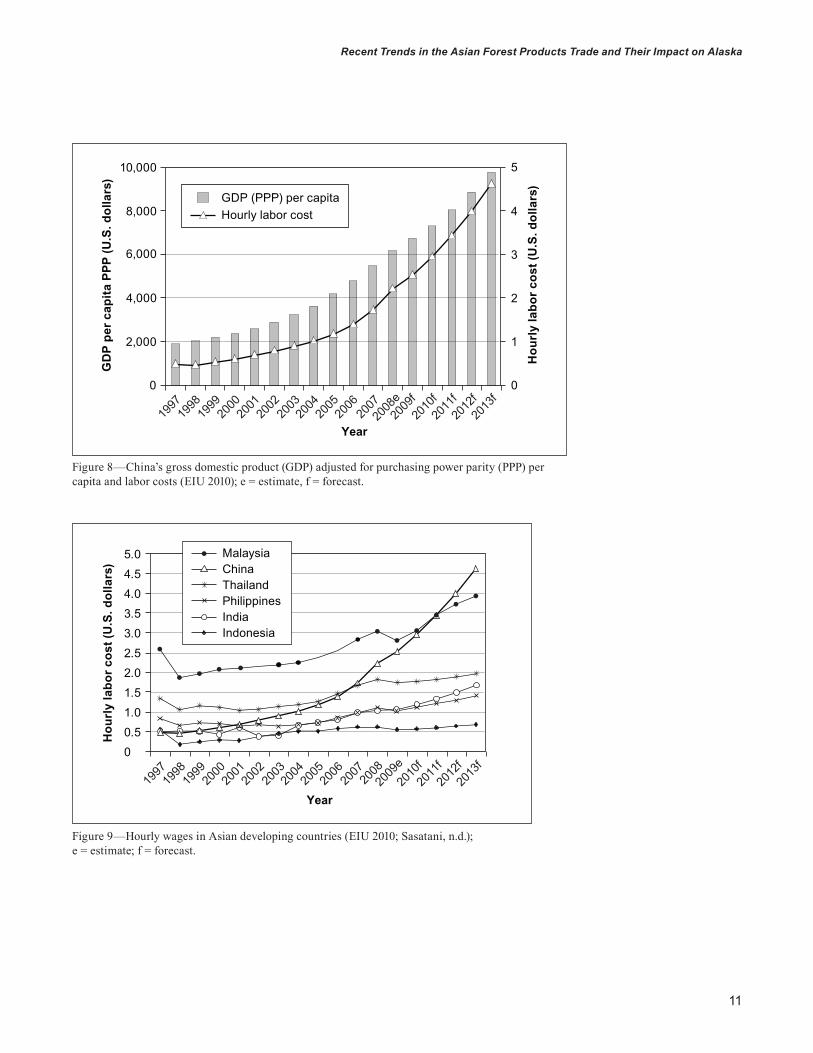
As China’s GDP per capita has increased, labor costs have also increased and are estimated to increase further in the next several years (fig. 8). These costs are rising faster than those of other developing Asian countries (fig. 9). For example, between 1997 and 2007, Indonesian labor costs rose only slightly, whereas China’s labor costs increased by almost four times. As shown in figure 9, China is predicted to surpass Malaysia as the highest wage nation among the Asian developing coun-tries by 2011. Labor cost is one of the major factors of the nation’s competitiveness in terms of manufacturing (Sasatani, n.d.). This could send low-wage manufactur-ing jobs from China to countries such as Thailand, Vietnam, and Indonesia.
11
Recent Trends in the Asian Forest Products Trade and Their Impact on Alaska
0
1
2
3
4
5
0
2,000
4,000
6,000
8,000
Hou
rly
labo
r cos
t (U
.S. d
olla
rs)
GD
P pe
r cap
ita P
PP (U
.S. d
olla
rs)
GDP (PPP) per capitaHourly labor cost
Year19
9719
9819
9920
0020
0120
0220
0320
0420
0520
0620
0720
08e20
09f20
10f20
11f20
12f20
13f
10,000
Figure 8—China’s gross domestic product (GDP) adjusted for purchasing power parity (PPP) per capita and labor costs (EIU 2010); e = estimate, f = forecast.
Figure 9—Hourly wages in Asian developing countries (EIU 2010; Sasatani, n.d.); e = estimate; f = forecast.
Year1997199819992000200120022003200420052006200720082009e2010f2011f2012f2013f
00.51.01.52.02.53.03.54.04.55.0
Hou
rly
labo
r cos
t (U
.S. d
olla
rs)
MalaysiaChinaThailandPhilippinesIndiaIndonesia

12
ReseARch noTe Pnw-Rn-564
In an effort to prop up the economy and reduce unemployment, China’s cen-tral government announced a $584 billion economic stimulus package aimed at infrastructure and housing development in November of 2008. This is expected to be followed by another stimulus package in 2009. Another step China has taken to stimulate the economy is to aggressively cut interest rates. China cut the benchmark 1-year lending rate five times in 3 months, with the latest cut of 0.27 percentage point on December 23, 2008. This reduced China’s benchmark 1-year lending to 2.25 percent, which is the lowest it has been since 2004. However, in order to avoid inflation, China may raise the benchmark rate if inflation rises above the 2.25 percent benchmark rate (Reuters 2010). The future of China’s economy will rely largely on how well the central government can manage this current economic crisis.
Japan’s Economic BackgroundAs with many other countries, Japan is suffering one of the worst recessions since World War II. In November of 2008, Japanese annual industrial output declined 8.1 percent and exports plummeted by 27 percent compared to the previous year (Dickson 2008). This is occurring just as the Japanese economy was recovering from what is called “Japan’s lost decade.” In 1990, the bubble of an inflated Japanese economy burst, resulting in a period characterized by slow economic growth, bad debt, and deflation. The Japanese economy recovered and returned to growth from 2003 to 2007 (fig. 10). However, Japanese GDP growth in 2008 was a negative 1.2 percent and 2009 is estimated to be a negative 5.5 percent (EIU 2010). This will be coupled with an increase in unemployment, which was predicted to increase from 4.1 percent in 2008 to approximately 5 percent in 2009 (fig. 11).
Japan, similar to China, has a trade surplus with the rest of the world (even with China), which has caused friction with their trading partners (fig. 12). In contrast to the United States, where the economy is driven in large part by domestic consumer spending, Japan’s economic growth relies largely on exports. As shown in figure 13, overall export growth has substantially exceeded domestic demand growth. There are many factors that have contributed to this, but two of the main causes are strong global demand for Japanese products and a relatively undervalued yen. However, Japan’s trade surplus is estimated to be 65 billion dollars in 2008, which is a sharp decrease from 105 billion dollars trade surplus in 2007 (EIU 2010).
One recent development is that Japan is now less reliant on the United States and more reliant on other Asian trading partners. In 2006, Japan’s biggest trade surplus was with the following regions: United States (+$77,580 million), Hong Kong (+$34,948 million), European Union (+$29,536 million), Taiwan (+$23,807

13
Recent Trends in the Asian Forest Products Trade and Their Impact on Alaska
Figure 10—Japan’s real gross domestic product (GDP) growth and the consumer price index (CPI) (EIU 2010); e = estimate, f = forecast.
Figure 11—Japan’s gross domestic product (GDP) growth per capita and the unemployment rate. Data for 2009 and 2010 are estimated by Economist Intelligence Unit (EIU 2010); PPP = purchasing power parity, e = estimate.
5.55.04.54.03.53.02.52.01.51.00.500.51.01.52.02.53.0
Cha
nges
from
pre
viou
s ye
ar (p
erce
nt)
Year19
9719
9819
9920
0020
0120
0220
0320
0420
0520
0620
0720
0820
09e
2010
f
Real GDP changesCPI changes
3.5
3.0
4.0
4.5
5.0
5.5
GD
P (1
,000
U.S
. dol
lars
at P
PP)
Une
mpl
oym
ent r
ate
(per
cent
)
35
30
25
20
15
10
Year19
9719
9819
9920
0020
0120
0220
0320
0420
0520
0620
0720
0820
09e20
10e
GDP (PPP) per capitaUnemployment rate

14
ReseARch noTe Pnw-Rn-564
Figure 12—Japan’s trade surplus. Note: total goods imports + trade surplus = total goods exports (EIU 2010, Japanese Cabinet Office 2009), e = estimate, f = forecast.
Figure 13—Components of Japan’s real gross domestic product (GDP) growth (Japanese Cabinet Office 2009).
0
100
200
300
400
500
600
700
800
900
Billi
on U
.S. d
olla
rs
Year19
9719
9819
9920
0020
0120
0220
0320
0420
0520
0620
0720
0820
09e
2010
f
Good importsTrade surplus
0
-1
-2
-3
1
2
3
4
Cha
nge
in G
DP
(per
cent
)
Real GDPDomestic demandExportsImports
Year19
9719
9819
9519
9619
9920
0020
0120
0220
0320
0420
0520
0620
0720
08

15
Recent Trends in the Asian Forest Products Trade and Their Impact on Alaska
million), South Korea (+$22,976 million), and Singapore (+$11,875 million). It is important to note the impact other Asian countries have on Japan’s economy. Combined, Japan’s trade surplus with Hong Kong, Taiwan, South Korea, and Singapore was $93,606 million in 2005, which exceeds Japan’s trade surplus with the United States (Roos et al. 2008b). Ultimately, this export diversity will reduce Japan’s reliance on the North American market.
Forest Products Trade Patterns Globalization has resulted in major changes to the forest products industry. For example, in the 1980s, U.S. producers exported large quantities of lumber directly to Japan. During the 1990s, European forest products companies aggressively entered the Japanese market, and the United States lost tremendous market share. Western hemlock (Tsuga heterophylla (Raf.) Sarg.) posts from the United States were replaced by lower priced European laminated posts. In addition to price, changing legislation in Japan has also played a role. In 2000, Japan enacted the Housing Quality Assurance Act (HQAA) and this required homebuilders to provide a 10-year warranty for homebuyers. As a result, Japanese builders began to use materials that would minimize claims from homeowners under the HQAA. Glulam beams were seen by builders as stable material that would reduce claims arising from the warping and twisting of lumber. Thus, many builders switched from solid sawn beams to glulam beams, and this had a negative impact on the demand for Douglas-fir (Pseudotsuga menziesii (Mirb.) Franco) (Roos et al. 2008b).
Solid Douglas-fir and western hemlock posts were traditionally referred to in the trade as “baby squares” (Evans 2000). It is interesting to note that a large por-tion of the solid posts have been replaced by laminated posts made from European white woods. Material now flowing to Japan includes both laminated posts and laminating stock that is manufactured into posts once it arrives at the Asian Rim.
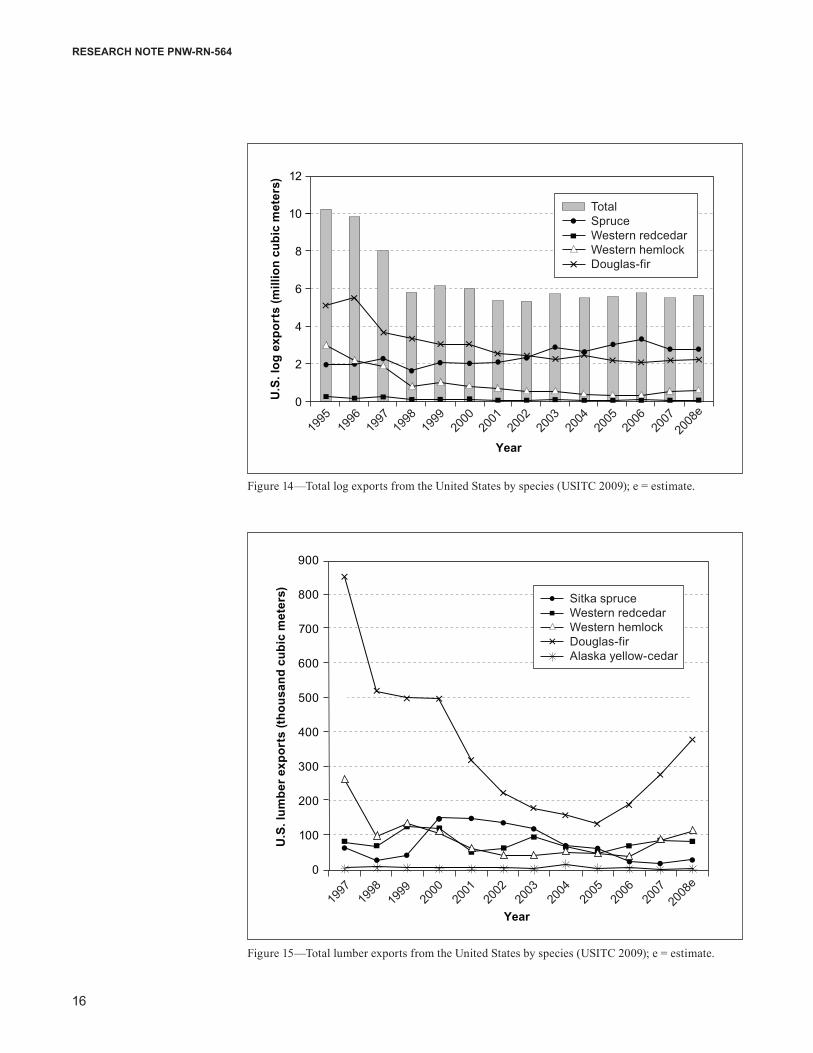
Figure 14 shows total U.S. log exports by species. After steady declines during the 1990s, log exports appear to have leveled off and spruce (Picea spp.) and western hemlock are rising. In 2003, spruce log exports surpassed Douglas-fir log exports. Aggregate log exports declined until 2001, but have remained fairly steady since then.
Lumber exports are improving (fig. 15). Since 2005, western hemlock, Douglas-fir, and western redcedar (Thuja plicata Donn ex D. Don) lumber exports have all increased. The strongest gains have been by Douglas-fir lumber, which increased almost threefold from approximately 134,000 cubic meters in 2005 to 381,000 cubic meters in 2008.
16
ReseARch noTe Pnw-Rn-564
Figure 14—Total log exports from the United States by species (USITC 2009); e = estimate.
Figure 15—Total lumber exports from the United States by species (USITC 2009); e = estimate.
900
800
700
600
500
400
300
200
100
0
U.S
. lum
ber e
xpor
ts (t
hous
and
cubi
c m
eter
s) Sitka spruceWestern redcedarWestern hemlockDouglas-firAlaska yellow-cedar
Year19
9719
9819
9920
0020
0120
0220
0320
0420
0520
0620
0720
08e
12
10
8
6
4
2
0U.S
. log
exp
orts
(mill
ion
cubi
c m
eter
s)
TotalSpruceWestern redcedarWestern hemlockDouglas-fir
Year19
9719
9819
9519
9619
9920
0020
0120
0220
0320
0420
0520
0620
0720
08e
17
Recent Trends in the Asian Forest Products Trade and Their Impact on Alaska
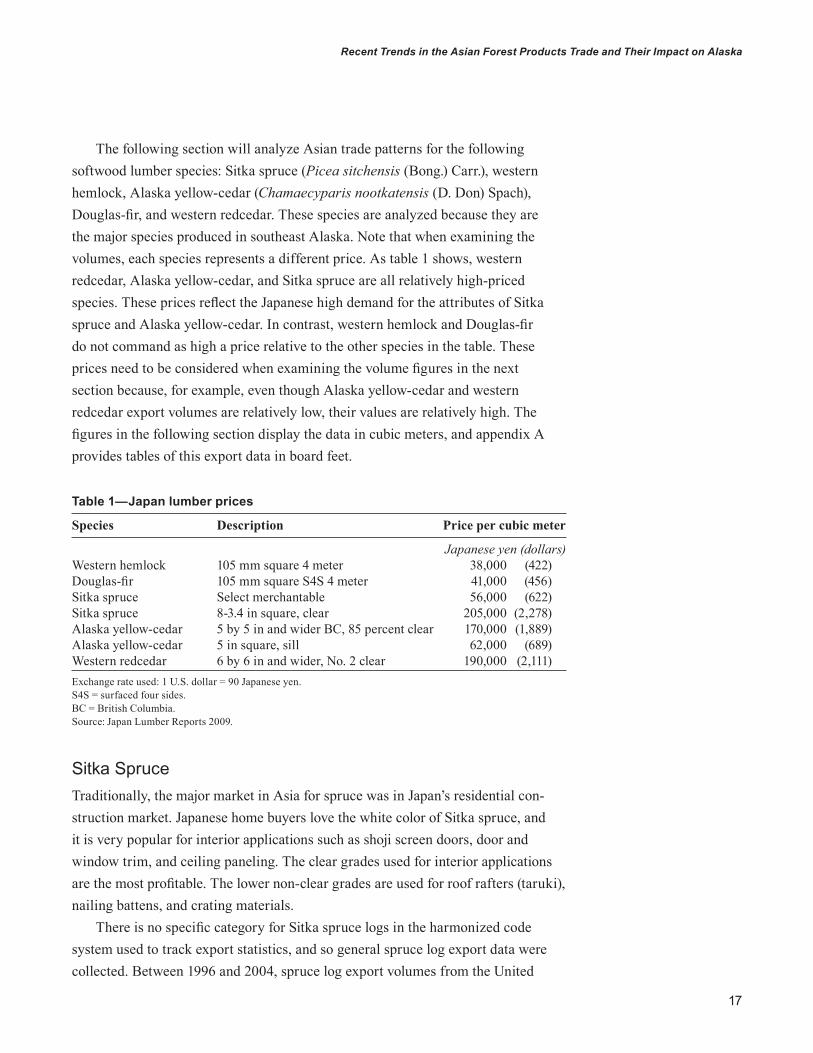
The following section will analyze Asian trade patterns for the following softwood lumber species: Sitka spruce (Picea sitchensis (Bong.) Carr.), western hemlock, Alaska yellow-cedar (Chamaecyparis nootkatensis (D. Don) Spach), Douglas-fir, and western redcedar. These species are analyzed because they are the major species produced in southeast Alaska. Note that when examining the volumes, each species represents a different price. As table 1 shows, western redcedar, Alaska yellow-cedar, and Sitka spruce are all relatively high-priced species. These prices reflect the Japanese high demand for the attributes of Sitka spruce and Alaska yellow-cedar. In contrast, western hemlock and Douglas-fir do not command as high a price relative to the other species in the table. These prices need to be considered when examining the volume figures in the next section because, for example, even though Alaska yellow-cedar and western redcedar export volumes are relatively low, their values are relatively high. The figures in the following section display the data in cubic meters, and appendix A provides tables of this export data in board feet.
Table 1—Japan lumber prices
Species Description Price per cubic meter
Japanese yen (dollars)Western hemlock 105 mm square 4 meter 38,000 (422)Douglas-fir 105 mm square S4S 4 meter 41,000 (456)Sitka spruce Select merchantable 56,000 (622)Sitka spruce 8-3.4 in square, clear 205,000 (2,278)Alaska yellow-cedar 5 by 5 in and wider BC, 85 percent clear 170,000 (1,889)Alaska yellow-cedar 5 in square, sill 62,000 (689)Western redcedar 6 by 6 in and wider, No. 2 clear 190,000 (2,111)Exchange rate used: 1 U.S. dollar = 90 Japanese yen.S4S = surfaced four sides.BC = British Columbia.Source: Japan Lumber Reports 2009.
Sitka Spruce Traditionally, the major market in Asia for spruce was in Japan’s residential con-struction market. Japanese home buyers love the white color of Sitka spruce, and it is very popular for interior applications such as shoji screen doors, door and window trim, and ceiling paneling. The clear grades used for interior applications are the most profitable. The lower non-clear grades are used for roof rafters (taruki), nailing battens, and crating materials.
There is no specific category for Sitka spruce logs in the harmonized code system used to track export statistics, and so general spruce log export data were collected. Between 1996 and 2004, spruce log export volumes from the United

18
ReseARch noTe Pnw-Rn-564
States to Japan declined (fig. 16). In contrast, between 1998 and 2006, spruce log export volumes from the United States to South Korea steadily increased. Figure 16 shows a fairly large increase in log exports to Canada since 1995. The authors believe that a large portion of the exports to Canada are re-exported from Canada to Asia either as logs or finished products.
Figure 16—United States spruce (Picea spp.) log exports to Asian countries. Note: Spruce includes Sitka spruce (Picea sitchensis (Bong.) Carr.), black spruce (Picea mariana (Mill.) Britton, Sterns & Poggenb.), white spruce (Picea glauca (Moench) Voss), Engelmann spruce (Picea engelmannii Parry ex Engelm.), and other spruce (USITC 2009); e = estimate.
3,000
2,500
2,000
1,500
1,000
500
0
Spru
ce lo
g ex
port
s(th
ousa
nd c
ubic
met
ers)
Year19
9719
9819
9519
9619
9920
0020
0120
0220
0320
0420
0520
0620
0720
08e
2007
TotalJapanSouth KoreaChinaCanada
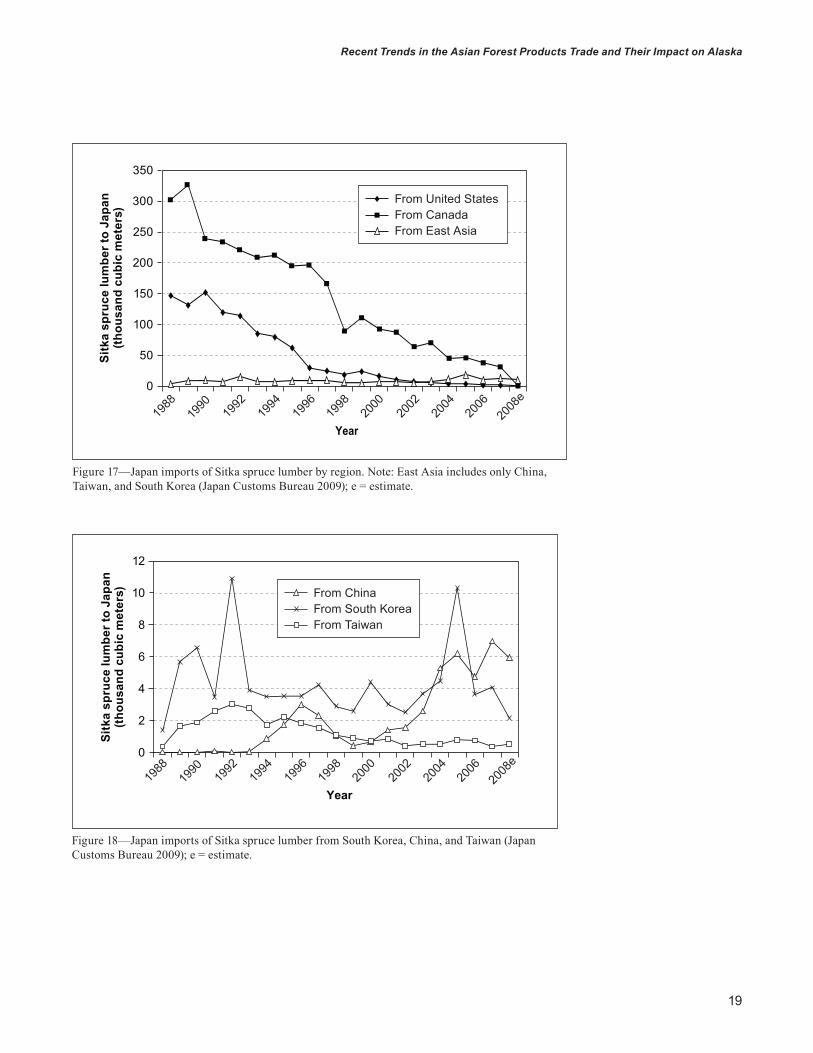
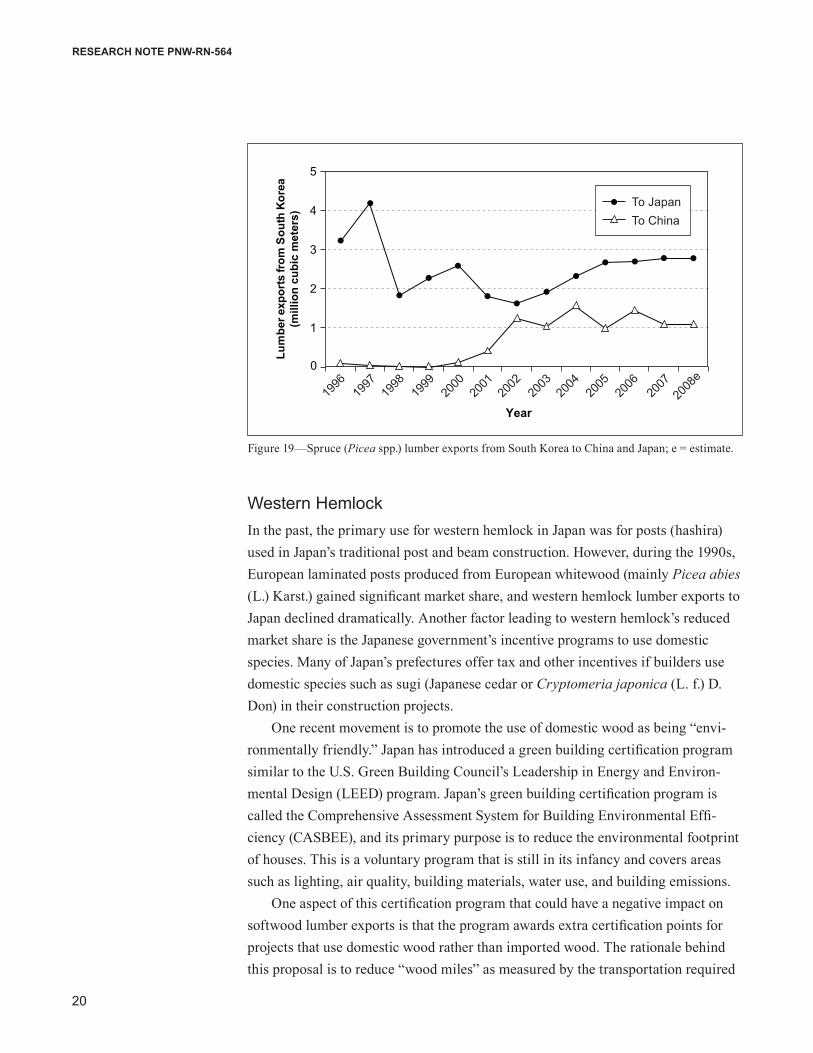
There is a specific harmonized code for Sitka spruce lumber, allowing export data for this category to be analyzed. The volume of Sitka spruce lumber exported from the United States to East Asian countries has declined sharply since around 2000 (fig. 17). The milling of logs has generally shifted from North America to Asian mills. Figure 17 shows that Sitka spruce lumber from the United States and Canada has declined a lot, but Sitka spruce lumber from East Asian regions has been steady. Figure 18 shows exports from East Asian countries to Japan. Lumber exports from China and South Korea to Japan have been fairly strong. China and South Korea are importing spruce logs from North America, milling the logs into lumber, and then exporting a large percentage of this lumber to Japan. South Korea also exports a fairly large quantity of spruce lumber to China and Japan (fig. 19).
19
Recent Trends in the Asian Forest Products Trade and Their Impact on Alaska
Figure 17—Japan imports of Sitka spruce lumber by region. Note: East Asia includes only China, Taiwan, and South Korea (Japan Customs Bureau 2009); e = estimate.
Figure 18—Japan imports of Sitka spruce lumber from South Korea, China, and Taiwan (Japan Customs Bureau 2009); e = estimate.
Year19
8819
9019
9219
9419
9619
9820
0020
0220
0420
0620
08e
Sitk
a sp
ruce
lum
ber t
o Ja
pan
(thou
sand
cub
ic m
eter
s)
12
10
8
6
4
2
0
From ChinaFrom South KoreaFrom Taiwan
Year19
8819
9019
9219
9419
9619
9820
0020
0220
0420
0620
08e
From United StatesFrom CanadaFrom East Asia
Sitk
a sp
ruce
lum
ber t
o Ja
pan
(thou
sand
cub
ic m
eter
s)
350
300
250
200
150
100
50
0
20
ReseARch noTe Pnw-Rn-564
Western HemlockIn the past, the primary use for western hemlock in Japan was for posts (hashira) used in Japan’s traditional post and beam construction. However, during the 1990s, European laminated posts produced from European whitewood (mainly Picea abies (L.) Karst.) gained significant market share, and western hemlock lumber exports to Japan declined dramatically. Another factor leading to western hemlock’s reduced market share is the Japanese government’s incentive programs to use domestic species. Many of Japan’s prefectures offer tax and other incentives if builders use domestic species such as sugi (Japanese cedar or Cryptomeria japonica (L. f.) D. Don) in their construction projects.
One recent movement is to promote the use of domestic wood as being “envi-ronmentally friendly.” Japan has introduced a green building certification program similar to the U.S. Green Building Council’s Leadership in Energy and Environ-mental Design (LEED) program. Japan’s green building certification program is called the Comprehensive Assessment System for Building Environmental Effi-ciency (CASBEE), and its primary purpose is to reduce the environmental footprint of houses. This is a voluntary program that is still in its infancy and covers areas such as lighting, air quality, building materials, water use, and building emissions.
One aspect of this certification program that could have a negative impact on softwood lumber exports is that the program awards extra certification points for projects that use domestic wood rather than imported wood. The rationale behind this proposal is to reduce “wood miles” as measured by the transportation required
Figure 19—Spruce (Picea spp.) lumber exports from South Korea to China and Japan; e = estimate.
Year19
9719
9819
9619
9920
0020
0120
0220
0320
0420
0520
0620
0720
08e
0
1
2
3
4
5
Lum
ber e
xpor
ts fr
om S
outh
Kor
ea(m
illio
n cu
bic
met
ers)
To JapanTo China

21
Recent Trends in the Asian Forest Products Trade and Their Impact on Alaska
Figure 20—United States western hemlock log exports to Asia (USITC 2009); e = estimate.
to deliver wood to the job site. However, research has shown that imported wood has a similar carbon footprint as domestically harvested wood. Although the wood miles are longer for imported wood, ocean shipping is more efficient than road transport as measured by carbon dioxide per distance traveled (Eastin 2008). Another potential result associated with encouraging the consumption of domestic wood (which is generally more expensive than imported wood) is that steel and concrete construction could become more cost competitive compared with wood construction. However, it has been shown that a shift from wood construction to steel and concrete construction increases the carbon footprint of structures (Edmonds and Lippke 2005).
Western hemlock log exports from North America to Japan also declined from the mid-1990s until 2006. However, they rebounded, and between 2006 and 2008, western hemlock log exports to Japan more than doubled (from 253 719 cubic meters to an estimated 602 465 cubic meters) (fig. 20). This shows that the Japanese lumber market for western hemlock is relying on Japanese mills to manufacture the logs into lumber rather than importing the lumber directly. Unlike spruce logs, only a small quantity of western hemlock logs go to China and South Korea.
One important finding was the sharp increase in western hemlock lumber exports from the United States to South Korea (fig. 21). Although the total volume was relatively small at approximately 45 785 cubic meters in 2008, the increase was surprising. This sudden rise in western hemlock export volumes to South Korea
Year
1,600
1,400
1,200
1,000
800
600
400
200
0Hem
lock
log
expo
rts
(thou
sand
cub
ic m
eter
s)
To JapanTo South KoreaTo China
1997
1998
1996
1995
1999
2000
2001
2002
2003
2004
2005
2006
2007
2008
e

22
ReseARch noTe Pnw-Rn-564
Figure 21—United States western hemlock lumber exports to Asia (USITC 2009); e = estimate.
may be due to the appreciation of the New Zealand dollar relative to the U.S. dollar in 2006 and 2007 (see fig. 6). This sudden appreciation of the New Zealand dollar against the U.S. dollar made western hemlock a relative value compared with New Zealand radiata pine (Pinus radiata D. Don) for packaging and crating uses. How-ever, in 2008 the New Zealand dollar weakened against the U.S. dollar, so this trend could be reversed.
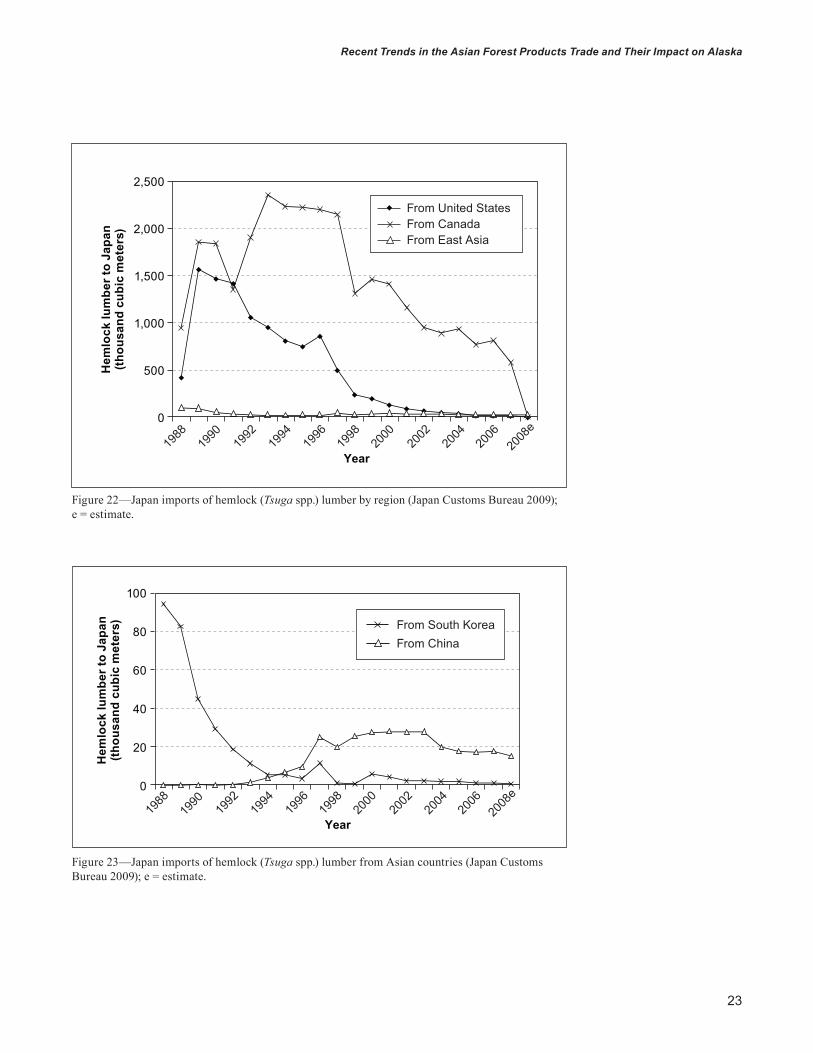
Canada exports a large quantity of western hemlock; thus, Canada export data are included as well as U.S. export data in figure 22. The volume of hemlock lum-ber (Tsuga spp.) exported from the United States and Canada to Japan has declined since the early 1990s (fig. 22). Figure 23 shows exports from select East Asian countries to Japan. Hemlock lumber exports from South Korea to Japan declined, whereas exports from China increased until 2003 and then declined slightly.
Year
210200190
60
50
40
30
20
10
0
Wes
tern
hem
lock
lum
ber e
xpor
ts(th
ousa
nd c
ubic
met
ers)
1997
1998
1999
2000
2001
2002
2003
2004
2005
2006
2007
2008
e
To JapanTo ChinaTo South KoreaTo Taiwan
201000 m3 (Japan )201 000 m3 (Japan)
23
Recent Trends in the Asian Forest Products Trade and Their Impact on Alaska
Figure 22—Japan imports of hemlock (Tsuga spp.) lumber by region (Japan Customs Bureau 2009); e = estimate.
Figure 23—Japan imports of hemlock (Tsuga spp.) lumber from Asian countries (Japan Customs Bureau 2009); e = estimate.
Hem
lock
lum
ber t
o Ja
pan
(thou
sand
cub
ic m
eter
s)
100
80
60
40
20
0
Year19
8819
9019
9219
9419
9619
9820
0020
0220
0420
0620
08e
From South KoreaFrom China
Year19
8819
9019
9219
9419
9619
9820
0020
0220
0420
0620
08e
Hem
lock
lum
ber t
o Ja
pan
(thou
sand
cub
ic m
eter
s)
2,500
2,000
1,500
1,000
500
0
From United StatesFrom CanadaFrom East Asia

24
ReseARch noTe Pnw-Rn-564
Figure 24—United States Alaska yellow-cedar log exports to East Asia (Japan Customs Bureau 2009, Warren 2008), e = estimate.
Year19
9719
9819
9619
9920
0020
0120
0220
0320
0420
0520
0620
07
100
80
60
40
20
0
Ala
ska
yello
w-c
edar
log
expo
rts
(thou
sand
cub
ic m
eter
s)
To JapanTo TaiwanTo China (e)
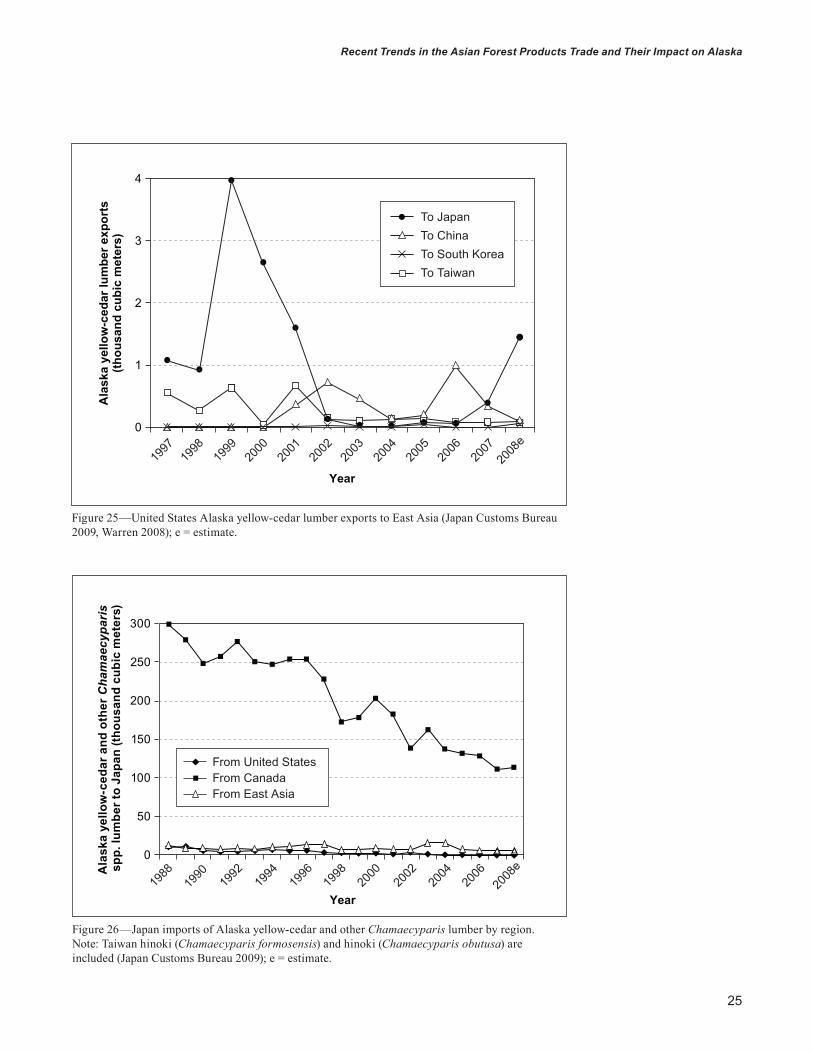
Alaska Yellow-CedarDue to their natural decay-resistant properties, the primary use for Alaska yellow-cedar in Japan is for sill plates (dodai), which sit on top of the foundations of houses. Alaska yellow-cedar is also used for lamstock. As with other species, Alaska yellow-cedar export volumes have declined sharply. One of the major reasons has been the increased adoption of treated lumber such as Russian larch (Larix sibirica Ledeb., Larix gmelinii (Rupr.) Rupr.).
Japan is the leading Asian importer of Alaska yellow-cedar logs, yet U.S. export volumes to Japan declined significantly starting in 1999 and remained low (fig. 24). In 2008, the total of Alaska yellow-cedar lumber exports from the United States to Asia was less than 2000 cubic meters (fig. 25). Taiwan consistently imports a small amount of Alaska yellow-cedar from the United States and uses the species as a substitute for the Taiwan species Formosan-cypress (Taiwan hinoki or Chamaecyparis formosensis Matsum). China imports only a very small volume of Alaska yellow-cedar logs.
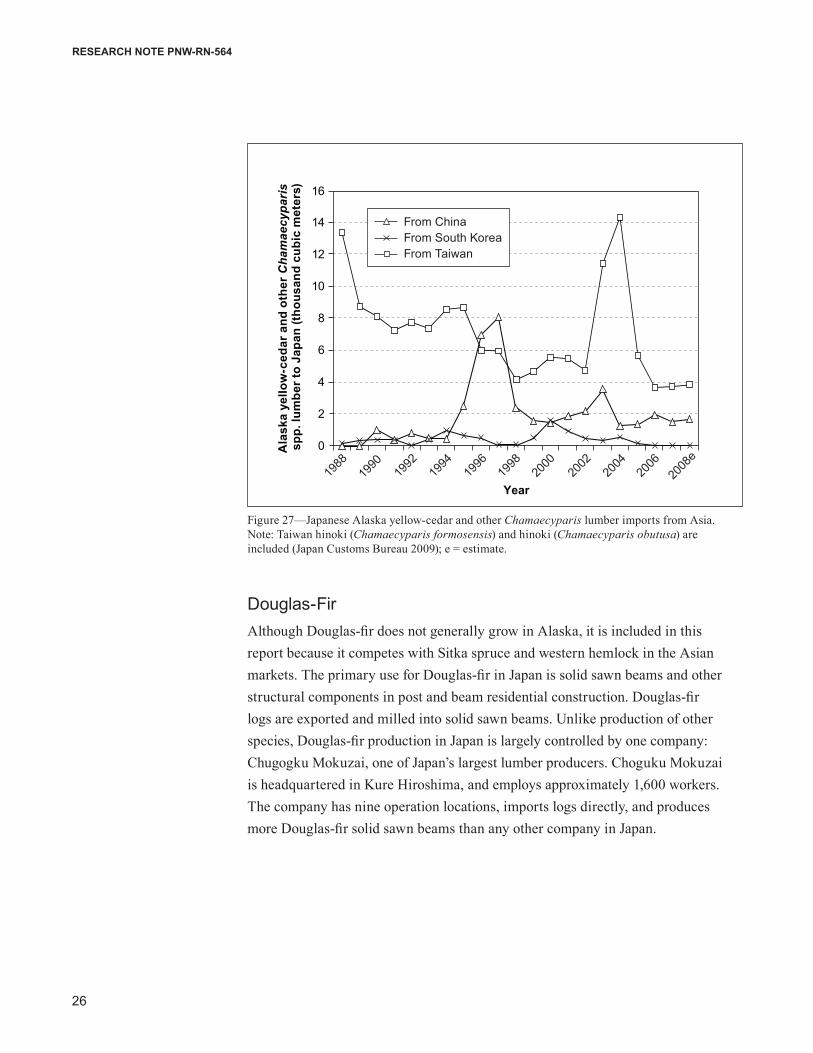
Canada is Japan’s major supplier of Alaska yellow-cedar lumber. However, Canadian Alaska yellow-cedar exports to Japan are also declining rapidly (fig. 26). China and Taiwan export some Alaska yellow-cedar lumber to Japan, but these volumes are still small, with both countries exporting less than 4000 cubic meters in 2008 (fig. 27).
25
Recent Trends in the Asian Forest Products Trade and Their Impact on Alaska
Figure 26—Japan imports of Alaska yellow-cedar and other Chamaecyparis lumber by region. Note: Taiwan hinoki (Chamaecyparis formosensis) and hinoki (Chamaecyparis obutusa) are included (Japan Customs Bureau 2009); e = estimate.
Figure 25—United States Alaska yellow-cedar lumber exports to East Asia (Japan Customs Bureau 2009, Warren 2008); e = estimate.
Year19
8819
9019
9219
9419
9619
9820
0020
0220
0420
0620
08eA
lask
a ye
llow
-ced
ar a
nd o
ther
Cha
mae
cypa
ris
spp.
lum
ber t
o Ja
pan
(thou
sand
cub
ic m
eter
s)
300
250
200
150
100
50
0
From United StatesFrom CanadaFrom East Asia
Year
4
3
2
1
0
Ala
ska
yello
w-c
edar
lum
ber e
xpor
ts(th
ousa
nd c
ubic
met
ers)
1997
1998
1999
2000
2001
2002
2003
2004
2005
2006
2007
2008
e
To JapanTo ChinaTo South KoreaTo Taiwan
26
ReseARch noTe Pnw-Rn-564
Figure 27—Japanese Alaska yellow-cedar and other Chamaecyparis lumber imports from Asia. Note: Taiwan hinoki (Chamaecyparis formosensis) and hinoki (Chamaecyparis obutusa) are included (Japan Customs Bureau 2009); e = estimate.
Ala
ska
yello
w-c
edar
and
oth
er C
ham
aecy
pari
s sp
p. lu
mbe
r to
Japa
n (th
ousa
nd c
ubic
met
ers)
Year19
8819
9019
9219
9419
9619
9820
0020
0220
0420
0620
08e
16
14
12
10
8
6
4
2
0
From ChinaFrom South KoreaFrom Taiwan
Douglas-Fir Although Douglas-fir does not generally grow in Alaska, it is included in this report because it competes with Sitka spruce and western hemlock in the Asian markets. The primary use for Douglas-fir in Japan is solid sawn beams and other structural components in post and beam residential construction. Douglas-fir logs are exported and milled into solid sawn beams. Unlike production of other species, Douglas-fir production in Japan is largely controlled by one company: Chugogku Mokuzai, one of Japan’s largest lumber producers. Choguku Mokuzai is headquartered in Kure Hiroshima, and employs approximately 1,600 workers. The company has nine operation locations, imports logs directly, and produces more Douglas-fir solid sawn beams than any other company in Japan.
27
Recent Trends in the Asian Forest Products Trade and Their Impact on Alaska
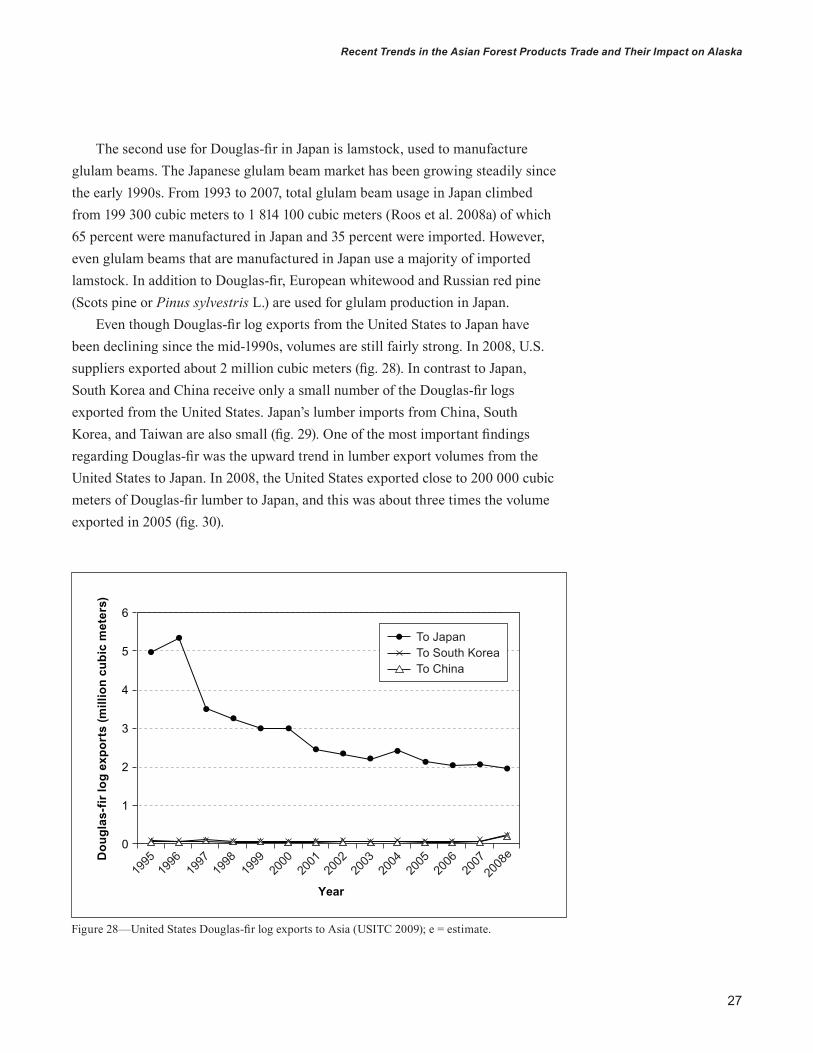
Figure 28—United States Douglas-fir log exports to Asia (USITC 2009); e = estimate.
Dou
glas
-fir
log
expo
rts
(mill
ion
cubi
c m
eter
s)
6
5
4
3
2
1
0
To JapanTo South KoreaTo China
Year19
9719
9819
9619
9519
9920
0020
0120
0220
0320
0420
0520
0620
0720
08e
The second use for Douglas-fir in Japan is lamstock, used to manufacture glulam beams. The Japanese glulam beam market has been growing steadily since the early 1990s. From 1993 to 2007, total glulam beam usage in Japan climbed from 199 300 cubic meters to 1 814 100 cubic meters (Roos et al. 2008a) of which 65 percent were manufactured in Japan and 35 percent were imported. However, even glulam beams that are manufactured in Japan use a majority of imported lamstock. In addition to Douglas-fir, European whitewood and Russian red pine (Scots pine or Pinus sylvestris L.) are used for glulam production in Japan.
Even though Douglas-fir log exports from the United States to Japan have been declining since the mid-1990s, volumes are still fairly strong. In 2008, U.S. suppliers exported about 2 million cubic meters (fig. 28). In contrast to Japan, South Korea and China receive only a small number of the Douglas-fir logs exported from the United States. Japan’s lumber imports from China, South Korea, and Taiwan are also small (fig. 29). One of the most important findings regarding Douglas-fir was the upward trend in lumber export volumes from the United States to Japan. In 2008, the United States exported close to 200 000 cubic meters of Douglas-fir lumber to Japan, and this was about three times the volume exported in 2005 (fig. 30).

28
ReseARch noTe Pnw-Rn-564
Figure 30—United States Douglas-fir lumber exports to Asian countries (USITC 2009); e = estimate.
Dou
glas
-fir
lum
ber e
xpor
ts (t
hous
and
cubi
c m
eter
s)
600
500
400
300
200
100
0
To JapanTo South KoreaTo ChinaTo Taiwan
1997
1998
1999
2000
2001
2002
2003
2004
2005
2006
2007
2008
e
Year
Figure 29—Japan imports of Douglas-fir lumber from Asian regions (Japan Customs Bureau 2009); e = estimate.
Dou
glas
-fir
lum
ber t
o Ja
pan
(thou
sand
cub
ic m
eter
s)
Year19
9019
8819
9219
9419
9619
9820
0020
0220
0420
0620
08e
12
10
8
6
4
2
0
From ChinaFrom South KoreaFrom Taiwan
29
Recent Trends in the Asian Forest Products Trade and Their Impact on Alaska
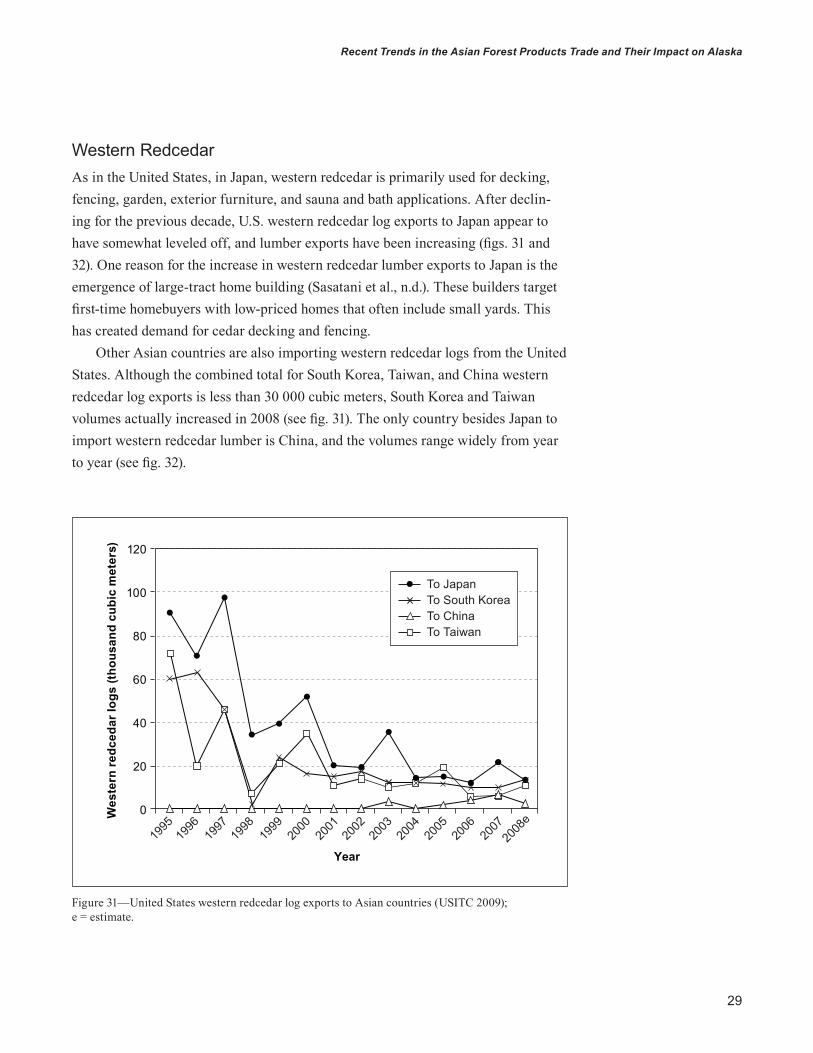
Figure 31—United States western redcedar log exports to Asian countries (USITC 2009); e = estimate.
Wes
tern
redc
edar
logs
(tho
usan
d cu
bic
met
ers) 120
100
80
60
40
20
0
To JapanTo South KoreaTo ChinaTo Taiwan
Year19
9719
9819
9619
9519
9920
0020
0120
0220
0320
0420
0520
0620
0720
08e
Western RedcedarAs in the United States, in Japan, western redcedar is primarily used for decking, fencing, garden, exterior furniture, and sauna and bath applications. After declin-ing for the previous decade, U.S. western redcedar log exports to Japan appear to have somewhat leveled off, and lumber exports have been increasing (figs. 31 and 32). One reason for the increase in western redcedar lumber exports to Japan is the emergence of large-tract home building (Sasatani et al., n.d.). These builders target first-time homebuyers with low-priced homes that often include small yards. This has created demand for cedar decking and fencing.
Other Asian countries are also importing western redcedar logs from the United States. Although the combined total for South Korea, Taiwan, and China western redcedar log exports is less than 30 000 cubic meters, South Korea and Taiwan volumes actually increased in 2008 (see fig. 31). The only country besides Japan to import western redcedar lumber is China, and the volumes range widely from year to year (see fig. 32).

30
ReseARch noTe Pnw-Rn-564
conclusionsThis paper examined trends in North American and Asian forest products trade. The results show that in spite of the recent economic downturn, forest products exports to Asia remain fairly strong. The decline in the U.S. dollar relative to other currencies has made U.S. forest products an attractive value in Asia. In summary, the data showed the following trends in forest products exports to Asia:• Since 2001, there has been an increase in spruce log exports from the
United States to Japan, China, and South Korea. • Since the late 1980s, there has been a steady decline in Sitka spruce lumber
exports from North America to Japan. The trade pattern appears to have shifted from exporting finished lumber from North America, to exporting logs.
• In contrast to exports from North America, general Sitka spruce lumber exports from South Korea to Japan and China have been increasing since 2001. Sitka spruce lumber from South Korea is manufactured from logs imported from, not only the United States, but also Canada and Europe.
Figure 32—United States western redcedar lumber exports to Asian countries (USITC 2009); e = estimate.
Wes
tern
redc
edar
lum
ber e
xpor
ts
(thou
sand
cub
ic m
eter
s)
15
12
9
6
3
0
To JapanTo South KoreaTo ChinaTo Taiwan
1997
1998
1999
2000
2001
2002
2003
2004
2005
2006
2007
2008
e
Year
31
Recent Trends in the Asian Forest Products Trade and Their Impact on Alaska
• After a steady decline, there has been an increase in western hemlock log exports to Japan since 2006.
• There is an upward trend in western hemlock lumber exports to Japan, South Korea, Taiwan, and China. The increase in western hemlock lum-ber exports to South Korea was especially strong, increasing from almost zero in 2006 to approximately 45 000 cubic meters in 2008. The increase in South Korean western hemlock use appears to be coming at the expense of New Zealand radiata pine. The value of the New Zealand dollar has increased against the U.S. dollar, and this has made U.S. western hemlock relatively cheaper for packaging and crating uses.
• United States Alaska yellow-cedar log exports to Japan have been in steady decline since the mid-1990s. There are almost no Alaska yellow-cedar logs being exported to other Asian countries. In addition, there is very little Alaska yellow-cedar lumber exported directly from the United States to Japan and other Asian countries.
• Douglas-fir log exports from the United States to Japan have been declin-ing since the mid-1990s but appear to have leveled off at around 2 million cubic meters annually. Douglas-fir lumber exports from the United States to Japan have been increasing since 2005, and in 2008 the quantity was close to 200 000 cubic meters. Other Asian countries do not import Douglas-fir in significant quantities.
• The quantities of western redcedar log exports to Asia have been declin-ing since the mid-1990s but have recently leveled off. In 2008, the leading markets for western redcedar logs were Japan, South Korea, Taiwan, and China. Western redcedar lumber exports from the United States to Japan have been increasing since 2005, whereas exports to China have been extremely volatile.
For Alaska forest products manufacturers to increase their Asian market share, they need to establish a coordinated marketing effort in Japan, South Korea, and China. The markets for lumber and other value-added forest products are firmly established in Japan and South Korea; thus, the strategy for these two countries should focus on market expansion. In contrast, China does not have a strong developed market in imported lumber and finished forest products; thus, the China marketing campaign should focus on market penetration and development. Appen-dix B lists several organizations that are available to assist Alaska forest products producers interested in exporting to Asia. Developing strong relationships with

32
ReseARch noTe Pnw-Rn-564
these organizations, participating in Asian forest products trade shows, and estab-lishing trade missions to Asia would all raise awareness of Alaska forest products in Asia. As the current economic downturn has shown, market diversification into global markets is a strong strategy for forest products firms to maintain business in difficult times.
english equivalentsWhen you know: Multiply by: To find:
Cubic meters, log scale 222.2222 Board feet, logsCubic meters, lumber scale 416.6666 Board feet, lumberMeters 3.28 FeetCentimeters .394 Inches (in)Millimeters (mm) . 0394 Inches
Literature citedBureau of Economic Analysis [BEA]. 2010. Gross domestic product:
fourth quarter 2009. Washington, DC: U.S. Department of Commerce. http://www.bea.gov/newsreleases/national/gdp/gdpnewsrelease.htm. (January 2010).
Cao, J.; Braden, R.; Eastin, I. 2006. Distribution systems for value-added wood products in China. Working Paper 102. Seattle, WA: Center for International Trade in Forest Products (CINTRAFOR). 68 p.
Cunningham, K.; Eastin, I. 2002. Factors that influenced the export success of forest products companies in the Pacific Northwest during the 1997-1998 Japanese economic downturn. Working Paper 89. Seattle, WA: Center for International Trade in Forest Products (CINTRAFOR). 57 p.
Dickson, D. 2008. Japan dives deeper into recession. Washington Times. December 27.
Dow Jones. 2008. Dow Jones-AIG data and weighting. On file with: Daisuke Sasatani, University of Washington, Seattle, WA 98105.
Eastin, I. 2008. Review of the Japanese green building program and the domestic wood program. Working Paper 111. Seattle, WA: Center for International Trade in Forest Products (CINTRAFOR). 52 p.
Economist Intelligence Unit [EIU]. 2010. China outlook for 2010—forecasts of economic and political trends. London, United Kingdom. January.

33
Recent Trends in the Asian Forest Products Trade and Their Impact on Alaska
Edmonds, L.; Lippke, B. 2005. Reducing environmental consequences of residential construction through product selection and design. Fact Sheet 4. Seattle, WA: Consortium for Research on Renewable Industrial Materials (CORRIM). 4 p.
Evans, D., ed. 2000. Terms of the trade. 4th ed. Eugene, OR: Random Lengths Publications. 426 p.
Fan, M. 2007. Cashing in on communism. Washington Post Online. February 18. http://www.washingtonpost.com/wp- dyn/content/article/2007/02/13/AR2007021301109.html. (February 2009).
Federal Reserve Bank of New York. 2009. Foreign exchange rates. http://www.federalreserve.gov/releases/h10/summary/. (January 2009).
Friedman, M. 1953. The case for flexible exchange rates. In: Friedman, M., ed. Essays in positive economics. Chicago, IL: University of Chicago Press: 157–203.
Global Trade Information Services, Inc. [GTI]. 2009. Global Trade Atlas. http://www.gtis.com. (January 2010). On file with: Joseph Roos, University of Washington, Seattle, WA 98105.
Japan Customs Bureau. 2009. Export and import data. [Japanese] http://www.customs.go.jp/toukei/srch/index.htm?M=01&P=0. (January 10, 2009).
Japan Lumber Reports. 2009. Tokyo, Japan: Nihon Mokuzai Shimbunsha Publication. June.
Japanese Cabinet Office. 2009. Official gross domestic product data. [Japanese] http://www.esri.cao.go.jp/jp/sna/gaiyou.html#qe. (January 10, 2009).
Kwan, C.H. 2008. Accelerating appreciation of the RMB—a major step toward a free floating exchange system. China in Transition Series. Tokyo, Japan: Research Institute of Economy, Trade, and Industry. http://www.rieti.go.jp/en/china/08050801.html. (January 22, 2010).
Liu Chuang; Yao Xurong; Lavely, W. [et al.]. 1996. China administrative regions GIS data: 1:1M, county level, 1990. Published and Disseminated by CIESIN.
Nadvornick, D. 2009. Mill rebounds by cutting timber for Asian buyers. KUOW Radio. http://www.kuow.org/program.php?id=17560. (May 15).
34
ReseARch noTe Pnw-Rn-564
Nicholls, D.; Brackley, A.; Rojas, T. 2006. Alaska’s lumber-drying industry—impacts from a federal grant program. Gen. Tech. Rep. PNW-GTR-683. Portland, OR: U.S. Department of Agriculture, Forest Service, Pacific Northwest Research Station. 23 p.
People’s Bank of China. 2005. Public announcement of the People’s Bank of China on reforming the RMB Exchange Rate Regime. July 21. http://www.pbc.gov.cn/english/detail.asp?col=6400&ID=542. (February 2010).
Random Lengths. 2008. Random Lengths yearbook and 2008 publications. Eugene, OR: 267–283.
Random Lengths International. 2008. Russia delays 80% log export tax; Canadians disappointed. Eugene, OR. 41(22): 3.
Reuters. 2010. China moves again on lending, economy shows strength. http://www.reuters.com/article/idUSTRE6100PY20100201. (February 23).
Roos, J.; Barber, V.; Sasatani, D.; Eastin, I. 2008a. The Japanese market for laminated lumber and glulam beams: implications for Alaskan forest products. Working Paper 113. Seattle, WA: Center for International Trade in Forest Products (CINTRAFOR). 23 p.
Roos, J.; Sasatani, D.; Barber, V.; Eastin, I. 2008b. Trends in the Japanese market for forest products: implications for Alaska. Working Paper 114. Seattle, WA: Center for International Trade in Forest Products (CINTRAFOR). 53 p.
Sasatani, D. [N.d.]. Competitiveness of forest products industry in Asia-Pacific region. United Nations Food and Agricultural Organization. Working Paper. On file with: Daisuke Sasatani, University of Washington, Seattle, WA 98105.
Sasatani, D.; Roos, J.; Brackley, A.; Eastin, I. 2005. Niche market opportunities for Alaska forest products in Japan (2005 update). Working Paper 100. Seattle, WA: Center for International Trade in Forest Products (CINTRAFOR). 52 p.
Sasatani, D.; Roos, J.; Eastin, I. [N.d.]. Power builders: Japan’s transitional housing industry after the lost decade. Seattle, WA: Center for International Trade in Forest Products (CINTRAFOR). On file with: Daisuke Sasatani, University of Washington, Seattle, WA 98105.
U.S. Department of Commerce, Bureau of the Census [U.S. Census Bureau]. 2009. New residential construction data. http://www.census.gov/const/www/newresconstindex.html. (January 2009).

35
Recent Trends in the Asian Forest Products Trade and Their Impact on Alaska
U.S. International Trade Commission [USITC]. 2009. Interactive tariff and trade dataweb. http://dataweb.usitc.gov/. (January 9, 2009).
Warren, D.D. 2008. Harvest, employment, exports, and prices in Pacific Northwest forests, 1965–2007. Gen. Tech. Rep. PNW-GTR-770. Portland, OR: U.S. Department of Agriculture, Forest Service, Pacific Northwest Research Station. 17 p.
Wu, H.X. 1997. Measuring China’s GDP. Briefing Paper No. 8. Barton ACT, Australia: Australia Department of Foreign Affairs and Trade, East Asia Analytical Unit. 37 p.
Yahoo! Finance. 2009. Quote historical prices. http://finance.yahoo.com. (January 20, 2009).
Yan, D.; Lam, V. 2005. Composition of currency basket revealed. China Daily. August 11. http://www.chinadaily.com.cn/english/doc/2005-08/11/content_467988.htm. (November 2008).
36
ReseARch noTe Pnw-Rn-564
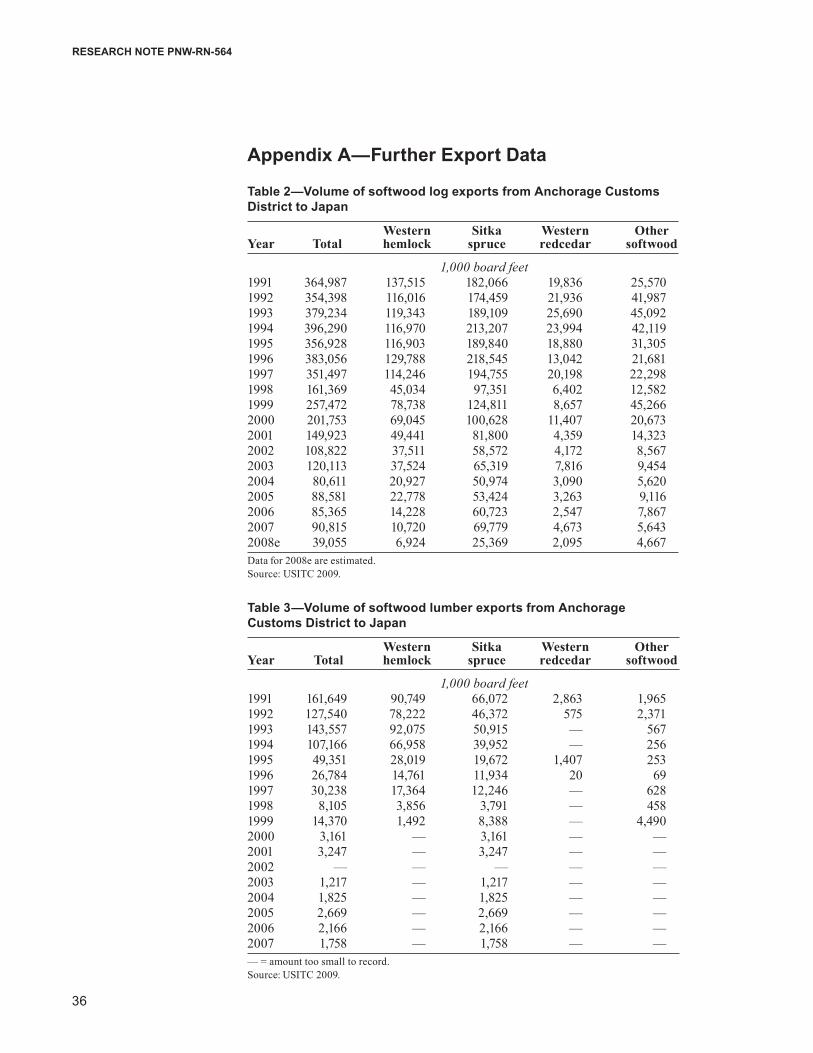
Appendix A—Further export Data
Table 2—Volume of softwood log exports from Anchorage customs District to Japan
Western Sitka Western Other Year Total hemlock spruce redcedar softwood
1,000 board feet1991 364,987 137,515 182,066 19,836 25,5701992 354,398 116,016 174,459 21,936 41,9871993 379,234 119,343 189,109 25,690 45,0921994 396,290 116,970 213,207 23,994 42,1191995 356,928 116,903 189,840 18,880 31,3051996 383,056 129,788 218,545 13,042 21,6811997 351,497 114,246 194,755 20,198 22,2981998 161,369 45,034 97,351 6,402 12,5821999 257,472 78,738 124,811 8,657 45,2662000 201,753 69,045 100,628 11,407 20,6732001 149,923 49,441 81,800 4,359 14,3232002 108,822 37,511 58,572 4,172 8,5672003 120,113 37,524 65,319 7,816 9,4542004 80,611 20,927 50,974 3,090 5,6202005 88,581 22,778 53,424 3,263 9,1162006 85,365 14,228 60,723 2,547 7,8672007 90,815 10,720 69,779 4,673 5,6432008e 39,055 6,924 25,369 2,095 4,667Data for 2008e are estimated. Source: USITC 2009.
Table 3—Volume of softwood lumber exports from Anchorage customs District to Japan
Western Sitka Western Other Year Total hemlock spruce redcedar softwood
1,000 board feet1991 161,649 90,749 66,072 2,863 1,9651992 127,540 78,222 46,372 575 2,3711993 143,557 92,075 50,915 — 5671994 107,166 66,958 39,952 — 2561995 49,351 28,019 19,672 1,407 2531996 26,784 14,761 11,934 20 691997 30,238 17,364 12,246 — 6281998 8,105 3,856 3,791 — 4581999 14,370 1,492 8,388 — 4,4902000 3,161 — 3,161 — —2001 3,247 — 3,247 — —2002 — — — — —2003 1,217 — 1,217 — —2004 1,825 — 1,825 — —2005 2,669 — 2,669 — —2006 2,166 — 2,166 — —2007 1,758 — 1,758 — —— = amount too small to record. Source: USITC 2009.

37
Recent Trends in the Asian Forest Products Trade and Their Impact on Alaska
Table 4—Volume of softwood log exports from Anchorage customs District to china
Western Sitka Western Other Year Total hemlock spruce redcedar softwood
1,000 board feet1991 21,813 1,325 20,489 — —1992 33,661 2,745 30,917 — —1993 19,068 1,464 17,605 — —1994 13,434 4,232 9,202 — —1995 5,426 — 5,426 — —1996 3,062 — 3,062 — —1997 2,256 — 2,256 — —1998 2,870 1,987 883 — —1999 2,653 — 2,653 — —2000 6,324 507 5,817 — —2001 4,325 1,190 3,135 — —2002 5,562 129 5,433 — —2003 4,272 269 2,967 670 3662004 3,947 944 2,928 — 752005 9,519 524 8,927 68 —2006 19,443 2,481 16,460 383 1192007 36,497 4,773 31,655 — 692008e 55,000 14,000 40,000 300 700Data for 2008e are estimated. — = amount too small to record. Source: USITC 2009.
38
ReseARch noTe Pnw-Rn-564
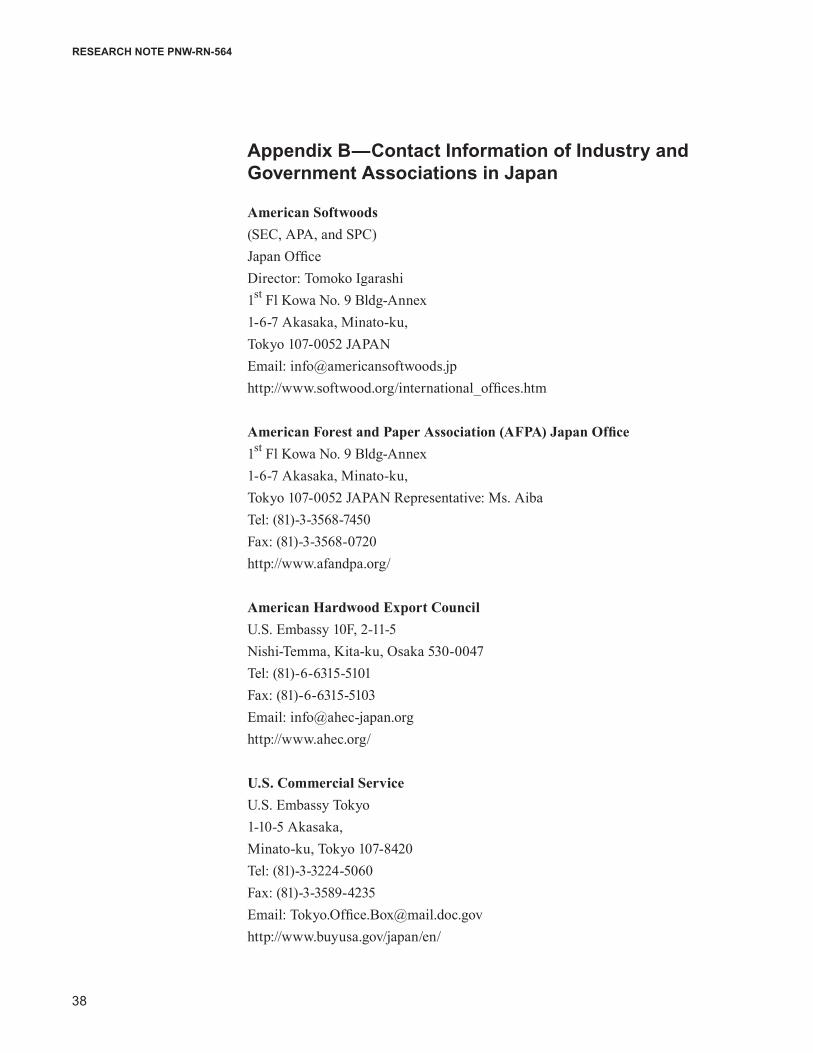
Appendix B—contact Information of Industry and Government Associations in Japan
American Softwoods (SEC, APA, and SPC)Japan OfficeDirector: Tomoko Igarashi1st Fl Kowa No. 9 Bldg-Annex1-6-7 Akasaka, Minato-ku,Tokyo 107-0052 JAPAN Email: [email protected]://www.softwood.org/international_offices.htm
American Forest and Paper Association (AFPA) Japan Office1st Fl Kowa No. 9 Bldg-Annex1-6-7 Akasaka, Minato-ku,Tokyo 107-0052 JAPAN Representative: Ms. AibaTel: (81)-3-3568-7450Fax: (81)-3-3568-0720http://www.afandpa.org/
American Hardwood Export CouncilU.S. Embassy 10F, 2-11-5 Nishi-Temma, Kita-ku, Osaka 530-0047Tel: (81)-6-6315-5101Fax: (81)-6-6315-5103Email: [email protected]://www.ahec.org/
U.S. Commercial ServiceU.S. Embassy Tokyo 1-10-5 Akasaka, Minato-ku, Tokyo 107-8420Tel: (81)-3-3224-5060 Fax: (81)-3-3589-4235Email: [email protected]://www.buyusa.gov/japan/en/

39
Recent Trends in the Asian Forest Products Trade and Their Impact on Alaska
Japan External Trade Organization (JETRO)(Tokyo Headquarter)Ark Mori Building, 6F 12-32, Akasaka 1-chome, Minato-ku, Tokyo, Japan 107-6006Tel: (81)-3-3583-2850Fax: (81)-3-3589-1560http://www.jetro.go.jp/
(San Francisco Office)235 Pine Street, Suite 1700San Francisco, CA 94104Tel: 415-392-1333Fax: 415-788-6927
Japan Lumber Journal25 Sankyo Bldg. No. 5231-48-10, Higashi Ikebukuro,Toshima-ku, Tokyo Japan 170-0013Tel: (81)-3-5950-2251Fax: (81)-3-5950-2271Email: [email protected]://www.jlj.gr.jp/
Japan Laminated Wood AssociationTakamine Dai-2 Bldg. 2-22-4 Nishi-ShinbashiMinato-ku, Tokyo, Japan 105-0003Tel: (81)-3-3434-6527Fax: (81)-3-3434-6547

Pacific northwest Research station
web site http://www.fs.fed.us/pnw/Telephone (503) 808-2592Publication requests (503) 808-2138FAX (503) 808-2130e-mail [email protected] address Publications Distribution Pacific Northwest Research Station P.O. Box 3890 Portland, OR 97208-3890
U.S. Department of Agriculture Pacific Northwest Research Station 333 SW First Avenue P.O. Box 3890 Portland, OR 97208-3890
Official Business Penalty for Private Use, $300