reconstruction of the post-glacial formation of the
TRANSCRIPT

Bates CollegeSCARAB
Standard Theses Student Scholarship
Spring 5-2015
Reconstruction of the Post-Glacial Formation ofthe Peddocks Island Salt Marsh, Hull, MASean W. EnosBates College, [email protected]
Follow this and additional works at: http://scarab.bates.edu/geology_theses
This Open Access is brought to you for free and open access by the Student Scholarship at SCARAB. It has been accepted for inclusion in StandardTheses by an authorized administrator of SCARAB. For more information, please contact [email protected].
Recommended CitationEnos, Sean W., "Reconstruction of the Post-Glacial Formation of the Peddocks Island Salt Marsh, Hull, MA" (2015). Standard Theses.23.http://scarab.bates.edu/geology_theses/23

Reconstruction of the Post-Glacial Formation of the Peddocks Island Salt Marsh, Hull, MA
Bates College Geology Department Th esis
Presented to the Faculty of the Department of Geology, Bates College, in partial fulfi llment of the requirements for the Degree of Bachelor of Science
by
Sean Enos
Lewiston, Maine April 8th, 2015

Abstract Climate change and associated sea level rise are of a large concern, and studying the environment’s history will allow for better predictions on the future. Salt marshes provide an excellent site for the study of changes that have occurred, as they accrete at a rate synonymous to sea level rise. Tidal salt marshes accrete upwards and landwards as diurnal tides fl ood the marsh, bringing in sediment. Major storm events also are known to provide sediment for marsh accretion. Lower rates of sea level rise allow marsh plants to keep in pace with incoming sediments (Niering and Warren, 1980). Sediment cores at a tidal salt marsh on Peddocks Island in Boston Harbor, Hull, MA were analyzed in order to determine the post-glacial history of marsh and island formation. Marsh stratigraphies were compared with other fi ndings and fi t to a relative sea level curve to develop the history and provide evidence for post-glacial conditions in Boston Harbor.
Th ree main units in Peddocks Marsh stratigraphy display evidence of major post-glacial events in Boston Harbor. Th e bottom unit was found the be the Boston Blue Clay, a glaciomarine mud deposited 13,500 years BP as meltwater from the retreating ice sheet inundated Boston Harbor. Th e middle unit was a dark brown silty mud, with no roots or rhizomes evident in the bottom but an increasing amount towards the top. Increases in % organic carbon content up the core quantify this, as peat layers contained an average 18.1% organic matter, and bottom clay layers 3.0%. Th is correlates to tidal mud fl ats that acted as a platform in which marsh could begin to colonize. Marsh likely colonized the fl ats between 4000 and 2000 years BP, when rates of sea level rise decreased from 2.5 mm/yr to 1 mm/yr (Warren and Niering, 1993). Th e top unit was a lighter brown silty peat, with roots and rhizomes all throughout. Th is correlates to a time of full marsh colonization, evident in present day.
A radiocarbon date of a wood chip found at 48 cm in Peddocks Core 14-1-1 was obtained, yielding an age of 300 14C BP, or 1559 AD with calibration. Th is wood chip was found right at the contact of a 5 cm thick gravel deposit. Th is gravel deposit was interpreted as overwash sediment associated with the Great Colonial Hurricane of 1635. Evidence of less signifi cant storm events may exist in peaks of larger grain sizes throughout the core.

Acknowledgments Th ere are so many people that I am forever grateful to for helping me with this project, from its conception to its fi nish. I would like to fi rst give a whole-hearted thank you to my advisor, Mike Retelle. Th ough this project stemmed from just an idea in the summer of 2014, Mike was eager to help me devise a plan to complete this project. On top of being a great adviser, Mike is a wonderful person, and I enjoy so much every conversation we had, and will surely miss them. Th e passion he puts into his work every day is inspiring as a young geologist.
I also would like to extend a lot of gratitude to Beverly Johnson, who was always there to help me with any marsh-related questions or issues. Even on sabbatical, Bev was so willing to help when I needed it, and was a huge savior on the second fi eld trip to collect sediment cores in the marsh. My understanding of marshes would be nowhere near as where it is without her.
An additional huge thank you to all at Bates who helped with this project in any way, I really could not have done it without them. Th ank you to Phil Dostie for helping assemble fi eld equipment and guiding me through proper lab procedures, thank you to Will Ash for helping me attain high-resolution images of the sediment cores in the Imaging Center, thank you to Matt Duvall for helping me with any ArcGIS issues and for miraculously fi nding LiDAR of Peddocks Island! I could also not have done it without the support of my friends and fellow Geo seniors, you guys are amazing and I know we will somehow eventually miss the late night Coram thesis sessions. Th ank you to those who I hold close to me at Bates, I could not have made it through the year without you. You all mean so much to me.
Funding for this project would also not at all be possible without the generosity of the Bates Research Fund, allowing me to do the fi eld research and lab procedures that were so important for this project. A huge thanks to the Bates STEM grant for allowing us to travel and present at the Northeast GSA Conference, it was a really cool experience.
My last two acknowledgments are very important to me on a personal level. I fi rst would like to thank my Portuguese ancestors for building a cottage on Peddocks Island over 100 years ago. I hold my family’s history to this island so close to my heart, and that is a huge reason why I did my study here. Th ank you to my great-great grandfather Frank Enos, his son Walter Enos, and my grandfather Walter Enos for tying our family to this beautiful island full of a rich and fascinating history. I hold my childhood memories of collecting crabs and sea glass on the beach, hiking around the island, and wading through the marsh lagoons so close to my heart. Whatever happens to the family cottage, it will always live on in the family’s most precious memories.
My last and most important thank you is to my parents, Jack and Barbara. It is no exaggeration to say I would not be anywhere close to where I am today without them. Every step of the way, they cared so much and taught me all they could. Th e support they provided me during this thesis study is insurmountable and I will never forget that. Th ank you.

ContentsAbstract. . . . . . . . . . . . . . . . . . . . . . . . . . . . . . . . . . . . . . . . . . . . . . . . . . . . . . . . . . . . . . . . . . . . . . iiIntroduction . . . . . . . . . . . . . . . . . . . . . . . . . . . . . . . . . . . . . . . . . . . . . . . . . . . . . . . . . . . . . . . . . . .1
Overview and Purpose . . . . . . . . . . . . . . . . . . . . . . . . . . . . . . . . . . . . . . . . . . . . . . . . . . . . . . . . . . . . . . .1Study Area . . . . . . . . . . . . . . . . . . . . . . . . . . . . . . . . . . . . . . . . . . . . . . . . . . . . . . . . . . . . . . . . . . . . . . . .1Glacial History of Boston Harbor and Massachusetts Bay. . . . . . . . . . . . . . . . . . . . . . . . . . . . . . . . . . . . .5Evidence of Glacial Extent in Massachusetts . . . . . . . . . . . . . . . . . . . . . . . . . . . . . . . . . . . . . . . . . . . . . . .6Sea Level Rise . . . . . . . . . . . . . . . . . . . . . . . . . . . . . . . . . . . . . . . . . . . . . . . . . . . . . . . . . . . . . . . . . . . . . .7
Globally . . . . . . . . . . . . . . . . . . . . . . . . . . . . . . . . . . . . . . . . . . . . . . . . . . . . . . . . . . . . . . . . . . . . . . .7Boston Harbor and Gulf of Maine . . . . . . . . . . . . . . . . . . . . . . . . . . . . . . . . . . . . . . . . . . . . . . . . . . .9
Historical Signifi cance of Peddocks Island. . . . . . . . . . . . . . . . . . . . . . . . . . . . . . . . . . . . . . . . . . . . . . . .10Goals of Study . . . . . . . . . . . . . . . . . . . . . . . . . . . . . . . . . . . . . . . . . . . . . . . . . . . . . . . . . . . . . . . . . . . .11
Methods . . . . . . . . . . . . . . . . . . . . . . . . . . . . . . . . . . . . . . . . . . . . . . . . . . . . . . . . . . . . . . . . . . . . .12Field Methods. . . . . . . . . . . . . . . . . . . . . . . . . . . . . . . . . . . . . . . . . . . . . . . . . . . . . . . . . . . . . . . . . . . . .12Lab Methods . . . . . . . . . . . . . . . . . . . . . . . . . . . . . . . . . . . . . . . . . . . . . . . . . . . . . . . . . . . . . . . . . . . . .14
Magnetic Susceptibility . . . . . . . . . . . . . . . . . . . . . . . . . . . . . . . . . . . . . . . . . . . . . . . . . . . . . . . . . .14Grain Size Analysis . . . . . . . . . . . . . . . . . . . . . . . . . . . . . . . . . . . . . . . . . . . . . . . . . . . . . . . . . . . . . .14Loss on Ignition (LOI). . . . . . . . . . . . . . . . . . . . . . . . . . . . . . . . . . . . . . . . . . . . . . . . . . . . . . . . . . .15
Surfi cial Mapping . . . . . . . . . . . . . . . . . . . . . . . . . . . . . . . . . . . . . . . . . . . . . . . . . . . . . . . . . . . . . . . . . .15Radiocarbon Dating . . . . . . . . . . . . . . . . . . . . . . . . . . . . . . . . . . . . . . . . . . . . . . . . . . . . . . . . . . . . . . . .16
Results. . . . . . . . . . . . . . . . . . . . . . . . . . . . . . . . . . . . . . . . . . . . . . . . . . . . . . . . . . . . . . . . . . . . . . .17Visual Stratigraphy . . . . . . . . . . . . . . . . . . . . . . . . . . . . . . . . . . . . . . . . . . . . . . . . . . . . . . . . . . . . . . . . .17Lab Analyses . . . . . . . . . . . . . . . . . . . . . . . . . . . . . . . . . . . . . . . . . . . . . . . . . . . . . . . . . . . . . . . . . . . . . .19
Dry and Wet Bulk Density. . . . . . . . . . . . . . . . . . . . . . . . . . . . . . . . . . . . . . . . . . . . . . . . . . . . . . . .19% Loss on Ignition. . . . . . . . . . . . . . . . . . . . . . . . . . . . . . . . . . . . . . . . . . . . . . . . . . . . . . . . . . . . . .19Magnetic Susceptibility . . . . . . . . . . . . . . . . . . . . . . . . . . . . . . . . . . . . . . . . . . . . . . . . . . . . . . . . . .20Grain Size Analysis . . . . . . . . . . . . . . . . . . . . . . . . . . . . . . . . . . . . . . . . . . . . . . . . . . . . . . . . . . . . . .21
Surfi cial Mapping . . . . . . . . . . . . . . . . . . . . . . . . . . . . . . . . . . . . . . . . . . . . . . . . . . . . . . . . . . . . . . . . . .23Former Beach Shoreline . . . . . . . . . . . . . . . . . . . . . . . . . . . . . . . . . . . . . . . . . . . . . . . . . . . . . . . . . . . . .23Radiocarbon Dating . . . . . . . . . . . . . . . . . . . . . . . . . . . . . . . . . . . . . . . . . . . . . . . . . . . . . . . . . . . . . . . .26
Discussion. . . . . . . . . . . . . . . . . . . . . . . . . . . . . . . . . . . . . . . . . . . . . . . . . . . . . . . . . . . . . . . . . . . .27Stratigraphy of the Peddocks Marsh . . . . . . . . . . . . . . . . . . . . . . . . . . . . . . . . . . . . . . . . . . . . . . . . . . . .27Evidence of Storm Deposits . . . . . . . . . . . . . . . . . . . . . . . . . . . . . . . . . . . . . . . . . . . . . . . . . . . . . . . . . .29Vegetation Patterns of the Peddocks Marsh. . . . . . . . . . . . . . . . . . . . . . . . . . . . . . . . . . . . . . . . . . . . . . .30Holocene Sea level Fluctuations and Drumlin Welding . . . . . . . . . . . . . . . . . . . . . . . . . . . . . . . . . . . . .31Sequence of Marsh Formation in Post-Glacial Context . . . . . . . . . . . . . . . . . . . . . . . . . . . . . . . . . . . . . .32Future of the Peddocks Salt Marsh . . . . . . . . . . . . . . . . . . . . . . . . . . . . . . . . . . . . . . . . . . . . . . . . . . . . .37
Conclusion . . . . . . . . . . . . . . . . . . . . . . . . . . . . . . . . . . . . . . . . . . . . . . . . . . . . . . . . . . . . . . . . . . .38Future Work . . . . . . . . . . . . . . . . . . . . . . . . . . . . . . . . . . . . . . . . . . . . . . . . . . . . . . . . . . . . . . . . . . . . . .38
Bibliography . . . . . . . . . . . . . . . . . . . . . . . . . . . . . . . . . . . . . . . . . . . . . . . . . . . . . . . . . . . . . . . . . .40

v
ContentsFigure 1.1: Maps of Massachusetts Bay and Boston Harbor with the location of Peddocks Island. Maps
created with ArcGIS. . . . . . . . . . . . . . . . . . . . . . . . . . . . . . . . . . . . . . . . . . . . . . . . . . . . . . . . . . . . . . . . .2
Figure 1.2: Aerial map of Peddocks Island, noting the location of the marsh and four drumlins (East Head, Middle Head, West Head, and Prince Head). Map from National Park Service. . . . . . . . . . . . . . . . . . . . .3
Figure 1.3: Aerial image of the Peddocks Island Salt Marsh. Middle Head drumlin sits on the left, and West Head sits on the right. Photograph from Island Alliance. . . . . . . . . . . . . . . . . . . . . . . . . . . . . . . . . . . . . .3
Figure 1.4: Generalized cross-section of a New England salt marsh showing major vegetation types, where Sat = tall Spartina alternifl ora; Sp = Spartina patens; Ds = Distichlis spicata; Sas = short Spartina alternifl ora; Se = Salicornia europaea; If = Iva fructescens; Jg = Juncus gerardii, Pv = Panicum virgatum; Pa = Phragmites australis. Figure from Johnson et al. (2007), modifi ed from Niering and Warren (1980). . . . .4
Figure 1.5: Diagrammatic cross-section of a tidal marsh and its existing units. Figure from Miller and Egler (1950). . . . . . . . . . . . . . . . . . . . . . . . . . . . . . . . . . . . . . . . . . . . . . . . . . . . . . . . . . . . . . . . . . . . . . . . . . . .5
Figure 1.6: Drumlin locations in Boston Harbor and Massachusetts Bay. Figure from Rosen and FitzGerald (2004). . . . . . . . . . . . . . . . . . . . . . . . . . . . . . . . . . . . . . . . . . . . . . . . . . . . . . . . . . . . . . . . . . . . . . . . . . . .6
Figure 1.7: Map of Southern New England, including positions of moraine ridges. Figure from Balco et al. (2002). . . . . . . . . . . . . . . . . . . . . . . . . . . . . . . . . . . . . . . . . . . . . . . . . . . . . . . . . . . . . . . . . . . . . . . . . . . .7
Figure 1.8: Global relative sea level from the Last Glacial Maximum to the present. Figure from Peltier and Fairbanks (2006). . . . . . . . . . . . . . . . . . . . . . . . . . . . . . . . . . . . . . . . . . . . . . . . . . . . . . . . . . . . . . . . . . . .8
Figure 1.9: Future predictions of sea level rise based on several models. Figure from IPCC 2013 5th Assessment Report. . . . . . . . . . . . . . . . . . . . . . . . . . . . . . . . . . . . . . . . . . . . . . . . . . . . . . . . . . . . . . . . . . .8
Figure 1.10: Relative sea level in Massachusetts from the Last Glacial Maximum to the present. Figure from Oldale et al. (1993). . . . . . . . . . . . . . . . . . . . . . . . . . . . . . . . . . . . . . . . . . . . . . . . . . . . . . . . . . . . . . . . . .9
Figure 1.11: Picture of Peddocks Island in the early 1900’s. Image from Silva (2003). . . . . . . . . . . . . . . . . . .10
Figure 2.1: Retrieval of Core 14-2-1 on Peddocks Island. Photograph by Beverly Johnson. . . . . . . . . . . . . . .12
Figure 2.2: Core Locations of the fi rst Peddocks Island visit on September 20, 2014. Map created with ArcGIS. . . . . . . . . . . . . . . . . . . . . . . . . . . . . . . . . . . . . . . . . . . . . . . . . . . . . . . . . . . . . . . . . . . . . . . . . .13
Figure 2.3: Visible lineaments seen in the beach deposits at Peddocks Marsh. Lineaments were interpreted as former beach ridge extents. . . . . . . . . . . . . . . . . . . . . . . . . . . . . . . . . . . . . . . . . . . . . . . . . . . . . . . . . . . .16
Figure 3.1: Stratigraphic column of Peddocks Core 14-1-1 including color, lithology, depth, and visual description.. . . . . . . . . . . . . . . . . . . . . . . . . . . . . . . . . . . . . . . . . . . . . . . . . . . . . . . . . . . . . . . . . . . . . . .17
Figure 3.2: High-resolution image of Peddocks Core 14-1-1. . . . . . . . . . . . . . . . . . . . . . . . . . . . . . . . . . . . .18
Figure 3.3: Wet and dry bulk density values for Peddocks Core 14-1-1. . . . . . . . . . . . . . . . . . . . . . . . . . . . .19
Figure 3.4: % Loss on Ignition values for Peddocks Core 14-1-1. . . . . . . . . . . . . . . . . . . . . . . . . . . . . . . . . .20
Figure 3.5: Magnetic Susceptibility values for Peddocks Core 14-1-1. . . . . . . . . . . . . . . . . . . . . . . . . . . . . . .21
Figure 3.6: Grain size values of for the silt-clay fraction (<63µm) for Peddocks Core 14-1-1. . . . . . . . . . . . .22
Figure 3.7: Grain size values of for the sand and gravel fractions for Peddocks Core 14-1-1. . . . . . . . . . . . . .22

vi
Figure 3.8: Surfi cial Map of the Peddocks Marsh. . . . . . . . . . . . . . . . . . . . . . . . . . . . . . . . . . . . . . . . . . . . . .24
Figure 3.9: Aerial Map of the Peddocks Marsh including interpreted former beach extents. . . . . . . . . . . . . .25
Figure 3.10: Calibration probability curve of wood chip sample at 48 cm, using CALIB 7.1 program. . . . . .26
Figure 4.1: Revised cross-sectional diagram of salt marsh development from Niering and Warren, 1980, using the work of Redfi eld, 1965. . . . . . . . . . . . . . . . . . . . . . . . . . . . . . . . . . . . . . . . . . . . . . . . . . . . . . . . . . .28
Figure 4.2: Cross Sectional diagram of overwash deposits in a barrier marsh complex, from Donnelly et al., 2001. . . . . . . . . . . . . . . . . . . . . . . . . . . . . . . . . . . . . . . . . . . . . . . . . . . . . . . . . . . . . . . . . . . . . . . . . . . .29
Figure 4.3: Map showing the distribution of sedimentary environments in Boston Harbor. Th e units mapped as “Erosion” are till retreat platforms. Units mapped as “Deposition” are areas of deposition of the Boston Blue Clay. Figure from Knebel et al. (1991). . . . . . . . . . . . . . . . . . . . . . . . . . . . . . . . . . . . . . . . . . . . . . .32
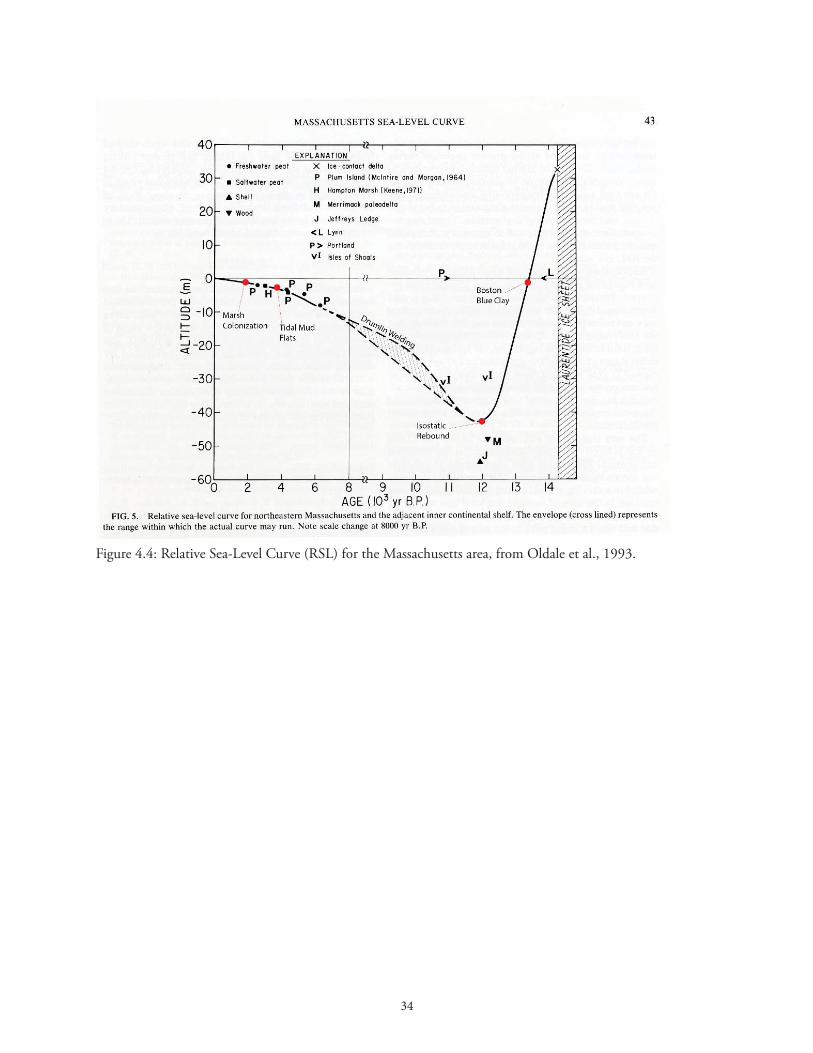
Figure 4.4: Relative Sea-Level Curve (RSL) for the Massachusetts area, from Oldale et al., 1993. . . . . . . . . .34
Figure 4.5: Conceptual diagram of series of post-glacial events in Boston Harbor and how they infl uenced the formation of modern Peddocks Island and the Peddocks Marsh. . . . . . . . . . . . . . . . . . . . . . . . . . . . . . .35
Figure 4.6: Th eoretical cross sectional diagram of Peddocks Marsh stratigraphy. . . . . . . . . . . . . . . . . . . . . . .36
Figure 4.7: Aerial images of the smaller marsh on West Head of Peddocks Island, showing the eff ects of accelerated sea level rise on marshes. Images from Google Earth. . . . . . . . . . . . . . . . . . . . . . . . . . . . . . .37

1
Introd uctionOverview and Purpose Changes in global climate due to greenhouse gas emissions have an insurmountable eff ect on many aspects of the environment. Increased emissions of Greenhouse gases have specifi cally led to increases in relative sea level (IPCC, 2013). Relative sea level rise (RSLR) refers to increases in sea level in relation to the present time. Th e major drivers of RLSR global changes are thermal expansion of ocean waters as the climate changes and meltwater associated with melting of glaciers, ice sheets, and ice caps (IPCC, 2013). Th e distribution of this meltwater from these sources is non-uniform, thus the RLSR is studied from various locations due to regional diff erences (Barlow et al., 2013).
Salt marshes and other low-lying coastal environments will receive the greatest impact from rising sea level. Salt marshes are classifi ed as grass-dominated tidal wetlands of temperate regions and play a major role in biological activity of marsh-estuarine ecosystems, as they facilitate nutrient cycling, pollution fi ltration, erosion control, and contain a wide variety of fl ora, fauna, and other wildlife (Niering and Warren, 1980).
Salt marshes have been found to be excellent indicators of recent relative sea level changes due to their proximity to the ocean and reliability on tidal sediments (Barlow et al., 2014). Tidal fl ooding and large storm events carry beach and marine sediments into the salt marsh, leading to upward and landward accretion of salt marshes (Niering and Warren, 1980). Low enough rates of sea level rise allow this development, however rapidly increased rates of sea level rise may result in inundation and destruction of salt marshes (Kirwan and Temmerman, 2009). Continuous records of sea-level change are best developed from low energy salt marsh deposits along mid latitude coastlines (Barlow et al., 2014).
Th e purpose of this study is to reconstruct the history of salt marsh formation of the Peddocks Island Salt Marsh in Boston, Massachusetts using a detailed analysis of sediment cores. By reconstructing the formation of this marsh, rates of marsh accretion can be used to formulate measurements of recent sea level rise in the Boston Harbor area.
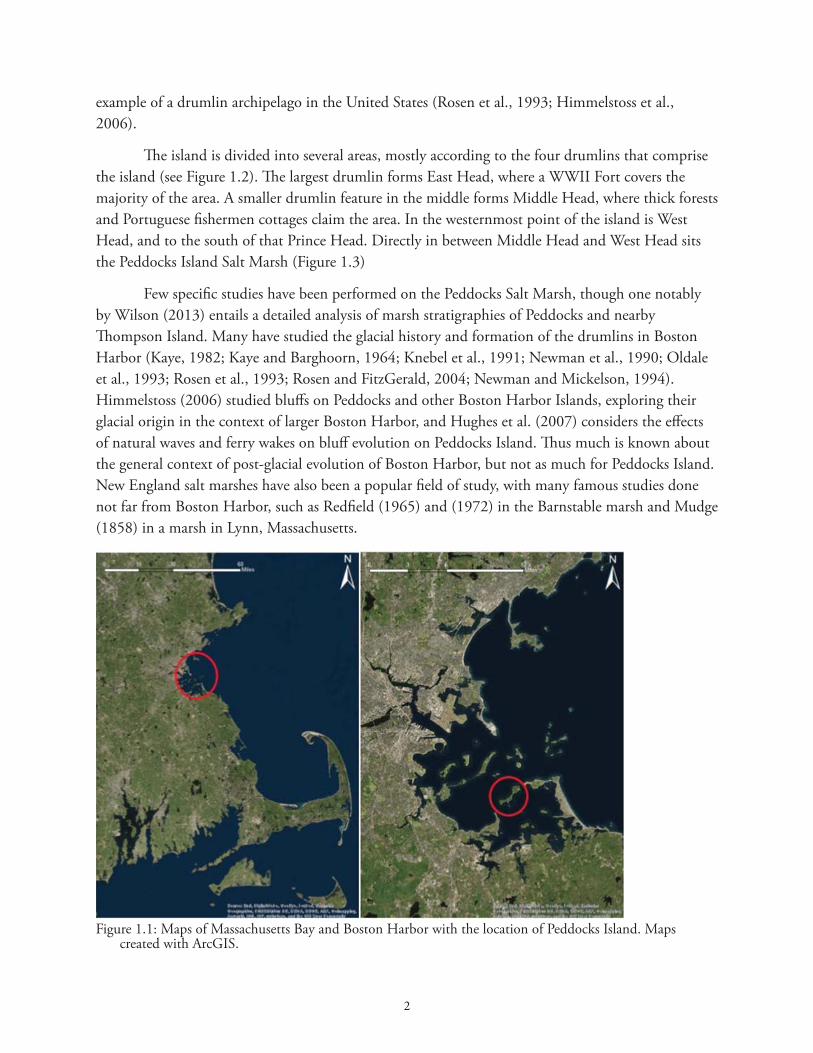
Study Area Peddocks Island is located in Hingham Bay, less than 1 mile off of the coast of Boston, Massachusetts. Peddocks Island is one of 34 islands located in Hingham and Quincy Bays, altogether forming the Boston Harbor Islands (see Figure 1.1). One of the largest islands in Boston Harbor, Peddocks Island contains 118 acres of land and stretches over 1 mile long (Rosen and FitzGerald, 2004). Th e formation of these islands is strongly correlated to the post-glacial history of Boston Harbor and the larger Gulf of Maine. Th e Boston Harbor Islands are a series of drumlins formed in the Pleistocene as glaciers scoured the bedrock and covered the area with drift, and are the only
2
example of a drumlin archipelago in the United States (Rosen et al., 1993; Himmelstoss et al., 2006).
Th e island is divided into several areas, mostly according to the four drumlins that comprise the island (see Figure 1.2). Th e largest drumlin forms East Head, where a WWII Fort covers the majority of the area. A smaller drumlin feature in the middle forms Middle Head, where thick forests and Portuguese fi shermen cottages claim the area. In the westernmost point of the island is West Head, and to the south of that Prince Head. Directly in between Middle Head and West Head sits the Peddocks Island Salt Marsh (Figure 1.3)
Few specifi c studies have been performed on the Peddocks Salt Marsh, though one notably by Wilson (2013) entails a detailed analysis of marsh stratigraphies of Peddocks and nearby Th ompson Island. Many have studied the glacial history and formation of the drumlins in Boston Harbor (Kaye, 1982; Kaye and Barghoorn, 1964; Knebel et al., 1991; Newman et al., 1990; Oldale et al., 1993; Rosen et al., 1993; Rosen and FitzGerald, 2004; Newman and Mickelson, 1994). Himmelstoss (2006) studied bluff s on Peddocks and other Boston Harbor Islands, exploring their glacial origin in the context of larger Boston Harbor, and Hughes et al. (2007) considers the eff ects of natural waves and ferry wakes on bluff evolution on Peddocks Island. Th us much is known about the general context of post-glacial evolution of Boston Harbor, but not as much for Peddocks Island. New England salt marshes have also been a popular fi eld of study, with many famous studies done not far from Boston Harbor, such as Redfi eld (1965) and (1972) in the Barnstable marsh and Mudge (1858) in a marsh in Lynn, Massachusetts.
Figure 1.1: Maps of Massachusetts Bay and Boston Harbor with the location of Peddocks Island. Maps created with ArcGIS.

3
Figure 1.2: Aerial map of Peddocks Island, noting the location of the marsh and four drumlins (East Head, Middle Head, West Head, and Prince Head). Map from National Park Service.
Figure 1.3: Aerial image of the Peddocks Island Salt Marsh. Middle Head drumlin sits on the left, and West Head sits on the right. Photograph from Island Alliance.

4
Salt Marsh Formation Salt marshes are a relatively recent coastal wetland formation. Th eir formation derives from the interaction of tidal marsh vegetation and factors such as local sediment supply, tidal range, and rate of sea level rise (Kelley et al., 1988; Niering and Warren, 1980). Rates of sea level rise between 4000 BP and 3000 BP decreased from 2.3 mm/yr to about 1 mm/yr, enough that marsh could begin to form on the coast (Niering and Warren, 1980). Th e slowed rates of sea level rise and concurrent tidal accretion then allowed halophytic marsh vegetation to colonize and encroach upon the land, leading to a steady buildup of marsh peat.
Th e transgression of marsh environments landward has generated diff erences in vegetation patterns, leading to the popular zone classifi cation scheme for tidal marshes. Th e low marsh zone is categorized by high salinity levels and the presence of the tall form of smooth cordgrass Spartina alternifl ora (Bertness and Ellison, 1987). Low marsh is located between mean high tide and mean high water level, and experiences semidiurnal tidal fl ooding (Johnson et al., 2007). Th e high marsh zone is categorized by moderate salinity and the presence of Spartina patens, Distichlis spicata, and the short form of smooth cordgrass Spartina alternifl ora (Bertness and Ellison, 1987). High marsh is located above mean high water level and is fl ooded less frequently at high tides, but often fl oods in large storm events (Johnson et al., 2007). An even further zone classifi cation is the higher high marsh, which involves low salinity levels and fl ooding only in large storm events. Higher high marsh sits at the marsh border, and contains more glycophytic vegetation such as Juncus spp. and Scirpus spp. (Johnson et al., 2007). Figures 1.4 and Figure 1.5 show theoretical cross-section diagrams of the zonation classifi cation of marshes.
Figure 1.4: Generalized cross-section of a New England salt marsh showing major vegetation types, where Sat = tall Spartina alternifl ora; Sp = Spartina patens; Ds = Distichlis spicata; Sas = short Spartina alternifl ora; Se = Salicornia europaea; If = Iva fructescens; Jg = Juncus gerardii, Pv = Panicum virgatum; Pa = Phragmites australis. Figure from Johnson et al. (2007), modifi ed from Niering and Warren (1980).

5
Glacial History of Boston Harbor and Massachusetts Bay Th e formation of the Boston Harbor Islands and the surfi cial geology of the surrounding area is dominated by post-glacial processes. Th e glacial features seen mostly include drumlin hills formed in the last glacial maximum. Th e Boston Harbor Island drumlins are only a small part of a fi eld of over 200 drumlins that extend 16 km from the shore out to Massachusetts Bay (Rosen and FitzGerald, 2004). Figure 1.6 shows the location and scope of the Boston Harbor and Massachusetts Bay drumlins (from Rosen and FitzGerald, 2004). Drumlins generally trend in the NW-SE direction. Th ese drumlins are dominantly composed two glacial drift deposits. Th e older deposit is Illinoisan in age and primarily composes the drumlins of Boston Harbor. Th e younger deposit is late Wisconsinan in age and is composed of thin discontinuous drift of gravel, sand, till, and relatively thick extensive layers of glaciomarine mud (Rosen et al., 1993). Th is was followed by ice retreat and marine submergence, in which sea level rose to about +18 m approximately 14,000 14C BP. After the ice retreated, isostatic rebound associated with ice mass relief was followed by rapid marine regression to about -40 m in the Boston Harbor area from 15,000 to 12,000 14C BP. Subsequent rapid transgression as eustatic sea level outpaced the rebound occurred from 12,000 to 8,000 14C BP (Colgan and Rosen, 2001; Oldale et al., 1993; Himmelstoss et al. 2006; Rosen and FitzGerald, 2004). As sea level re-entered the harbor and reached the drumlins by 5,630 14C BP, wave action and transgressing tides eroded and transported drumlin bluff sediments into tombolos and salients, linking the drumlins and creating the island formation that is seen today (Rosen and FitzGerald, 2004; Himmelstoss et al. 2006).
Figure 1.5: Diagrammatic cross-section of a tidal marsh and its existing units. Figure from Miller and Egler (1950).

6
Evidence of Glacial Extent in Massachusetts Evidence of the extent of the Laurentide Ice Sheet in the Wisconsinan glaciation is well observed along the Cape Cod Bay area in end moraines. Th ese end moraines infer the furthest extent of the ice sheet as it pushed underlying sediments forward. As seen in Figure 1.7, the moraine ridges are present along Long Island and southern Rhode Island, and extend across Martha’s Vineyard, Buzzards Bay, and along Cape Cod itself. Th e Buzzard’s Bay moraine, forming the Elizabeth Islands and western margin of Cape Cod, was dated to an age of 18,600 ± 400 years using cosmogenic-nuclide dating techniques along the moraine ridges. Th e Martha’s Vineyard moraine, which forms Martha’s Vineyard itself, was dated to an age of 23,200 ± 500 years, also using cosmogenic-nuclide dating (Balco et al., 2002).
Figure 1.6: Drumlin locations in Boston Harbor and Massachusetts Bay. Figure from Rosen and FitzGerald (2004).

7
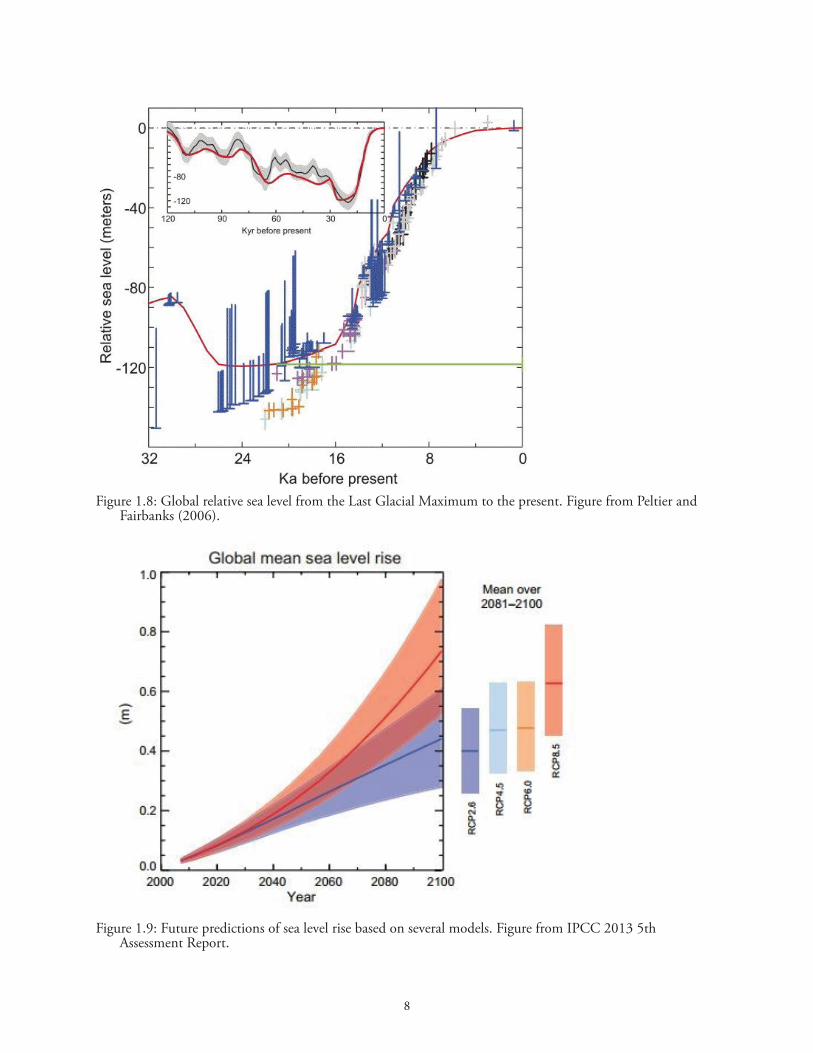
Sea Level RiseGlobally Sea level rise is closely linked to the output of meltwater from warming glaciers, ice sheets, and ice caps. Rates of sea level change, therefore, are directly aff ected by climate change (IPCC, 2013). Climate change since the last glacial maximum is evident in relative sea level changes, as seen in Figure 1.8. Since the last glacial maximum in the Wisconsinan age, sea level has risen globally (Nixon, 1982). It is clear from the model in Figure 1.8 that sea level is strongly correlated to glacial presence. Th e last glacial maximum occurred between 26,000 and 19,000 BP, and is characterized by a lowstand in global relative sea level, as the majority of global waters were locked in continental ice sheets (Peltier and Fairbanks, 2006). Th e global deglaciation process is evident at 19,000 BP with increasing global relative sea level. During the last glacial maximum, global sea levels were as low as 120 m below present levels. Figure 1.8 also displays relative sea levels for the past 120,000 years BP. It is evident that global sea levels have fl uctuated over this extended period, likely directly linking to glacial periods.
Figure 1.9 shows relative sea level predictions for the next century from the IPCC 2013 5th Assessment Report. Th is implies that as factors associated with climate change, such as greenhouse gas emissions, continue to increase, relative sea level will rapidly escalate from increased meltwater output of warming glaciers and ice sheets. According to the RCP2.6 model, global sea level will increase by 0.26 to 0.55 m, the RCP4.5 model by 0.32 to 0.63 m, the RCP6.0 model by 0.33 to 0.63 m, and the RCP8.5 by 0.52 to 0.98 m (IPCC, 2013). Using the RCP8.5 scenario, sea level rise rates will be between 8 and 16 mm/yr between 2081 and 2100.
Figure 1.7: Map of Southern New England, including positions of moraine ridges. Figure from Balco et al. (2002).
8
Figure 1.8: Global relative sea level from the Last Glacial Maximum to the present. Figure from Peltier and Fairbanks (2006).
Figure 1.9: Future predictions of sea level rise based on several models. Figure from IPCC 2013 5th Assessment Report.
9
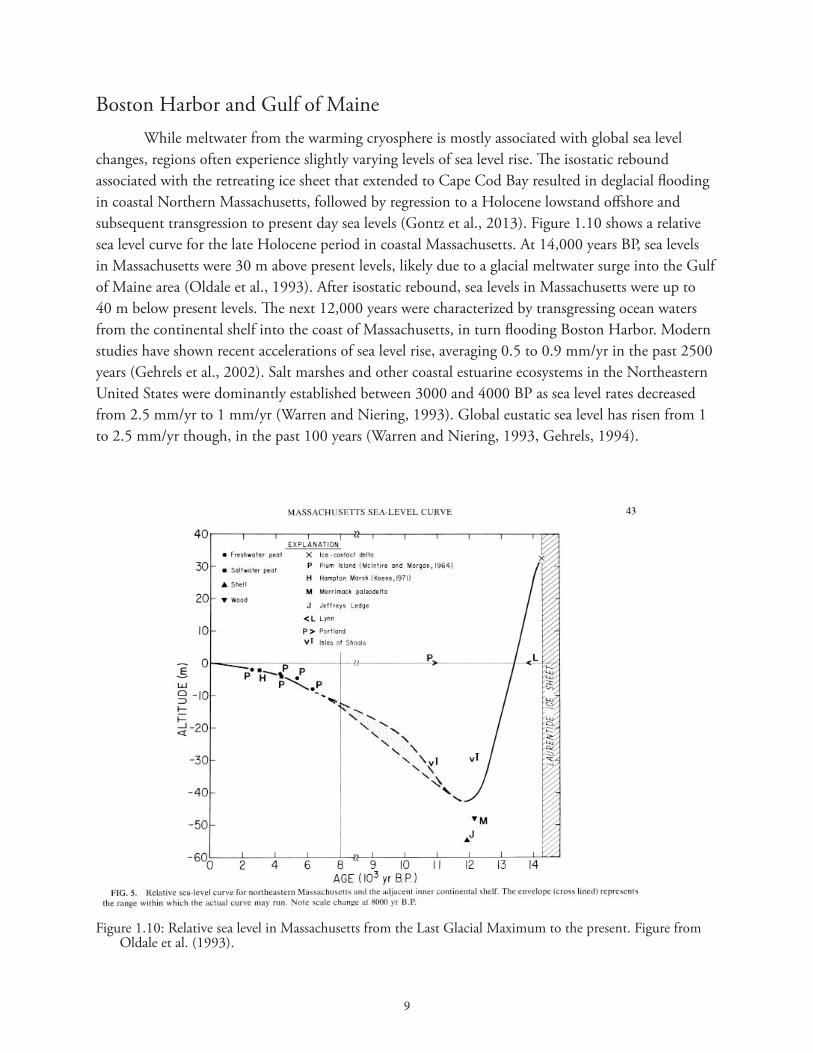
Boston Harbor and Gulf of Maine While meltwater from the warming cryosphere is mostly associated with global sea level changes, regions often experience slightly varying levels of sea level rise. Th e isostatic rebound associated with the retreating ice sheet that extended to Cape Cod Bay resulted in deglacial fl ooding in coastal Northern Massachusetts, followed by regression to a Holocene lowstand off shore and subsequent transgression to present day sea levels (Gontz et al., 2013). Figure 1.10 shows a relative sea level curve for the late Holocene period in coastal Massachusetts. At 14,000 years BP, sea levels in Massachusetts were 30 m above present levels, likely due to a glacial meltwater surge into the Gulf of Maine area (Oldale et al., 1993). After isostatic rebound, sea levels in Massachusetts were up to 40 m below present levels. Th e next 12,000 years were characterized by transgressing ocean waters from the continental shelf into the coast of Massachusetts, in turn fl ooding Boston Harbor. Modern studies have shown recent accelerations of sea level rise, averaging 0.5 to 0.9 mm/yr in the past 2500 years (Gehrels et al., 2002). Salt marshes and other coastal estuarine ecosystems in the Northeastern United States were dominantly established between 3000 and 4000 BP as sea level rates decreased from 2.5 mm/yr to 1 mm/yr (Warren and Niering, 1993). Global eustatic sea level has risen from 1 to 2.5 mm/yr though, in the past 100 years (Warren and Niering, 1993, Gehrels, 1994).
Figure 1.10: Relative sea level in Massachusetts from the Last Glacial Maximum to the present. Figure from Oldale et al. (1993).

10
Historical Signifi cance of Peddocks Island Peddocks Island has a rich, diverse history that spans centuries back from present time. Leonard Peddock fi rst settled the island in 1622 (Rosen and FitzGerald, 2004). He cleared the island of vegetation and utilized its space for agriculture and cattle farming. Sitting in the entrance to Hingham Bay, the island was situated perfectly for establishing military defenses to protect the harbor. 600 militia were encamped on the island to protect the harbor against the British after they left in 1776 (Rosen and FitzGerald, 2004). Th e U.S. Government purchased land on the western side of the island in 1897, and established Fort Andrews, a military fort complete with mortar batteries, barracks, and a hospital (Silva, 2003). Th roughout World War I and II, the fort served as protection of Boston Harbor against any foreign threats. In World War II, over 1,000 Italian prisoners of war were kept on the island (Rosen and FitzGerald, 2004). Italian prisoners of war were eventually released, and migrated to populate the Boston’s North End.
In the late 1800’s, immigrant Portuguese fi shermen settled the eastern side of the island. Th ey established a community of cottages, many of them still standing today. While many have called Peddocks Island their home for over 100 years, the Metropolitan District Commission claimed ownership of the island, and intend to transform the island into a tourist facility (Silva, 2003). Figure 1.11 shows a picture of the island from the early 1900’s. Peddocks Island has changed dramatically since this time, as thick forests and marshland now dominate the island.
Figure 1.11: Picture of Peddocks Island in the early 1900’s. Image from Silva (2003).

11
Goals of Study Th is study aims to reconstruct the history of post-glacial marsh formation at the Peddocks Island Salt Marsh. Salt marshes have been found to be excellent indicators of sea level rise due to their proximity to the coast and their reliability on tidal sediment infl ux. Salt marshes accrete at a rate synonymous to sea level rise and associated sediment deposition (Barlow et al., 2014). Th e resulting record of the formation of the marsh is thus evident in the marsh stratigraphy. Th e history of how the marsh formed will also provide evidence of recent Holocene sea level changes and further insight into the post-glacial environmental conditions of the Boston Harbor. Comparisons of marsh stratigraphy and geochronological dating will allow marsh formation history to be put into context with regional post-glacial events. Surfi cial observations of the marsh area will also be used to determine processes involved with marsh function and its interaction with the surrounding sediments. Th is in turn will yield an interpretation of how the marsh formation history fi ts into the larger formation history of Peddocks Island. With knowledge of the function of the Peddocks Island Salt Marsh, predictions of future sea level rise can be used to infer the safety of the marsh and the other lowland coastline.

12
MethodsField Methods Th e fi rst set sediment cores of the Peddocks Island Marsh were retrieved on September 20, 2014. Th e island was accessed by boat from Quincy Yacht Club. Th ree cores were retrieved using a 1 meter long, 3 inch diameter Dutch corer (Figure 2.1). Core locations were chosen according to varying marsh grass types, and GPS locations were logged using a Garmin eTrex Venture HC GPS Unit (Figure 2). Th e grass type, length and thickness, amount of overwash debris, GPS location, length of core retrieved, and any other observations were noted for each core location. Cores were placed in 3 in. PVC pipe tubes and sealed shut with Saran Wrap and Duct Tape. Th ey were then transported to a cold core storage room at Carnegie Science Center at Bates College, Lewiston, Maine.
Th e second set of sediment cores were retrieved on November 25, 2014. Four cores of about 1 m length each were retrieved using the 1 in. diameter Dutch corer. GPS locations were logged using a Garmin eTrex Venture HC GPS Unit (see Figure 2.2). Th e cores were cut in half in the fi eld, described in detail from visual observations, and stored in 1 in. diameter PVC pipes. Vegetation patterns and types were described in fi eld notes and observed vegetation zones were drawn on a map.
Figure 2.1: Retrieval of Core 14-2-1 on Peddocks Island. Photograph by Beverly Johnson.

13
Figure 2.2: Core Locations of the fi rst Peddocks Island visit on September 20, 2014. Map created with ArcGIS.

14
Lab Methods Each sediment core retrieved was processed in the Sedimentology/Quaternary Geology Laboratory at Bates College. Two of the three cores were saved for analysis, cores 14-1-1 and 14-1-2. Core 14-1-3 only contained 30 cm of sediment, of which lost its stratigraphic integrity during transport. After opening up the PVC pipes, the cores were carefully split using a putty knife, serrated bread knife, and fi shing line. Th e core halves were wrapped in plastic wrap and sealed in D-tubes, one half as an archive half, the other a working half. Th e working half was opened for analysis, and resealed for storage when not in use. Nondestructive analyses were fi rst performed, followed by subsampling. A high-resolution photograph was taken of each core in the Bates College Imaging Center Photography Studio. Visual core logs were also taken of each core, noting the length, Munsell soil color, grain size, and any signifi cant observations of each stratigraphic layer.
Magnetic Susceptibility Magnetic susceptibility was analyzed for Cores 14-1-1 and 14-1-2 using the Bartington MS2E Sensor at a 3.8 mm spatial resolution. Magnetic susceptibility is the measurement of how magnetic a material is. Th is can reveal mineral content in sediments, grain size, as well as gross changes in lithostratigraphy (Dearing, 1999). Magnetic minerals are grouped into Ferrimagnetic minerals (e.g. magnetite, titanomagnetite) and Canted-Ferromagnetic minerals (e.g. hematite, goethite) (Hall, 1998). Before measurement, the cores were warmed for one hour to room temperature. Th e sensor was placed every 1 cm down each core, and a reading of the Magnetic Susceptibility in units of cgs’s (centimeter-gram-seconds) was recorded using the Multisus 2 computer program for Windows. Th e units were then converted from cgs’s to SI units, and values were plotted on a graph by depth.
Grain Size Analysis Grain size was measured in subsamples every 5 cm for Cores 14-1-1 and 14-1-2. One cubic centimeter of sediment was taken for each subsample and placed in pre-weighed crucibles. Th e samples were dried in an oven at 60° C overnight, and masses of samples were recorded before and after drying. Subsamples were then individually placed in 50 mL Oak Ridge centrifuge tubes, and 5 mL of 30% Hydrogen Peroxide (H2O2) were pipetted into each tube to disintegrate organic matter. Distilled water was added to bring tubes to even level, and a glass-stirring rod was used to break up the sediment in the liquid. Th e tubes were placed uncapped in a rack in a warm bath at 50° C for 5 hours in a Precision Water Bath Model 183, and left to sit capped overnight. Distilled water was then added to fi ll the Oak Ridge tubes entirely. Th e tubes were placed in an IEC CU-5000 centrifuge at 1500 rpm for 10 minutes, and supernatant was carefully decanted. Distilled water was again added to fi ll to the top, and each tube was placed on the Vortex Genie and sonically dismembrated for 30 seconds. Th e centrifuge process was then repeated. After decanting the supernatant, 17 mL of dispersant solution (sodium metaphosphate) and 20 mL of distilled water were added to each sample tube. Th e tubes were placed on the Vortex Genie and sonically dismembrated again, and each sample

15
was poured through a 2 mm sieve. Residual organic matter was picked out, and grains above 2 mm were dried overnight and weighed. Th e remaining liquid sample was then poured through a 63 µm wet sieve into a 250 mL Oak Ridge centrifuge tube. Grains above 63 µm were collected, dried overnight, and weighed. Samples were again centrifuged at 1500 rpm for 10 minutes in the 250 mL Oak Ridge tubes, and supernatant was carefully decanted. 5 mL of dispersant solution were added to each sample tube, and the samples were placed on the Vortex Genie and sonically dismembrated for 30 seconds each. Grain size data for grains smaller than 63 µm was then obtained by running each sample through the Beckman Coulter system. Histograms of grain size distribution were created, and mean and median grain sizes were obtained for each sample.
Loss on Ignition (LOI) Measurements of organic matter content in the cores was obtained by performing Loss on Ignition analyses on subsamples every 5 cm down the cores. One cubic centimeter of sediment were subsampled for each depth interval and placed in pre-weighed crucibles. Th e samples were dried overnight at 60° C, and weighed before and after drying. Wet and dry bulk densities were calculated using wet sample mass and dry sample mass, respectively. Th e calculation was as follows:
Once dried, samples were placed in a Yokogawa UP150 furnace and heated to 450° C over the course of 1 hour, stabilized at 450° C for 4 hours, and back down to 25° C over the course of 1 hour. Following ignition of samples, each crucible was cooled for 30 minutes and weighed. Using this data, the percent Loss on Ignition, or the percent organic matter, was calculated. Th e calculation was as follows:
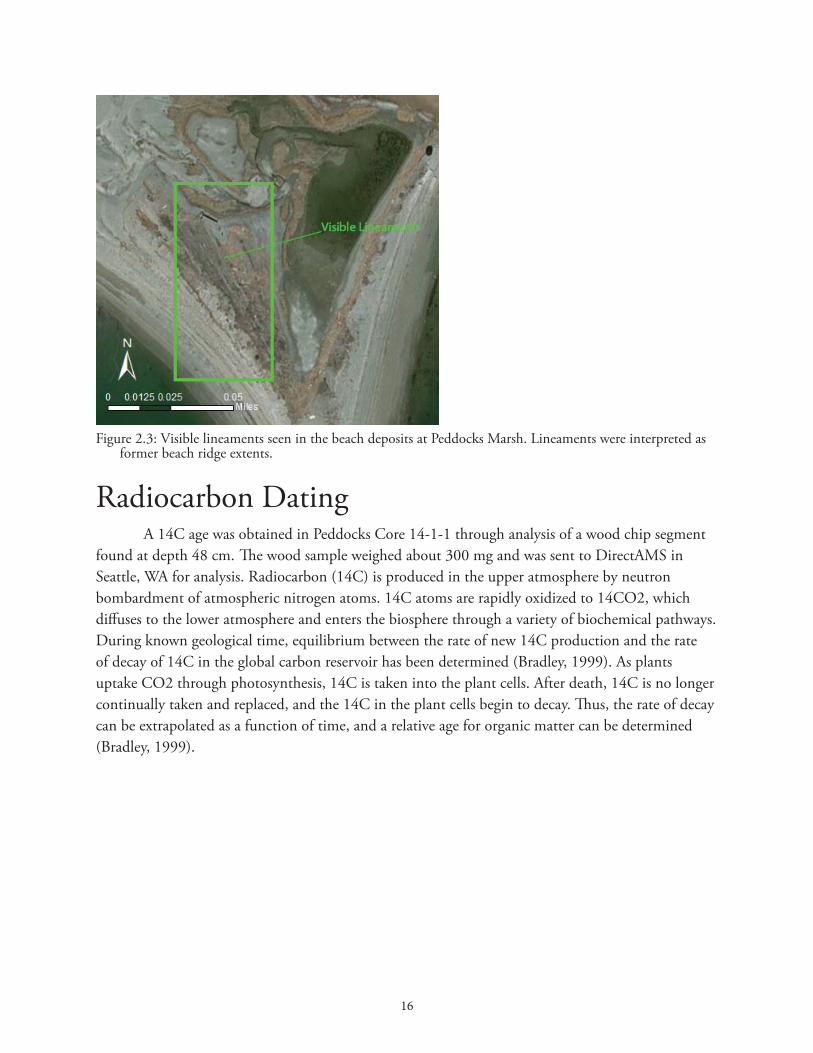
Surfi cial Mapping A surfi cial map for the Peddocks Island Salt Marsh was created with ESRI’s ArcMap software. A DEM raster from LiDAR (Light Detection and Ranging) data was obtained for the Peddocks Island area and used to analyze the surfi cial deposits seen in and around the marsh. Vegetation patterns were outlined according to elevation and appearance. Visible lineaments along the beach area were outlined and used to interpret former shoreline extents. Figure 2.3 shows these lineaments. A fi nal map of the observable units was then produc ed.
16
Radiocarbon Dating A 14C age was obtained in Peddocks Core 14-1-1 through analysis of a wood chip segment found at depth 48 cm. Th e wood sample weighed about 300 mg and was sent to DirectAMS in Seattle, WA for analysis. Radiocarbon (14C) is produced in the upper atmosphere by neutron bombardment of atmospheric nitrogen atoms. 14C atoms are rapidly oxidized to 14CO2, which diff uses to the lower atmosphere and enters the biosphere through a variety of biochemical pathways. During known geological time, equilibrium between the rate of new 14C production and the rate of decay of 14C in the global carbon reservoir has been determined (Bradley, 1999). As plants uptake CO2 through photosynthesis, 14C is taken into the plant cells. After death, 14C is no longer continually taken and replaced, and the 14C in the plant cells begin to decay. Th us, the rate of decay can be extrapolated as a function of time, and a relative age for organic matter can be determined (Bradley, 1999).
Figure 2.3: Visible lineaments seen in the beach deposits at Peddocks Marsh. Lineaments were interpreted as former beach ridge extents.
17
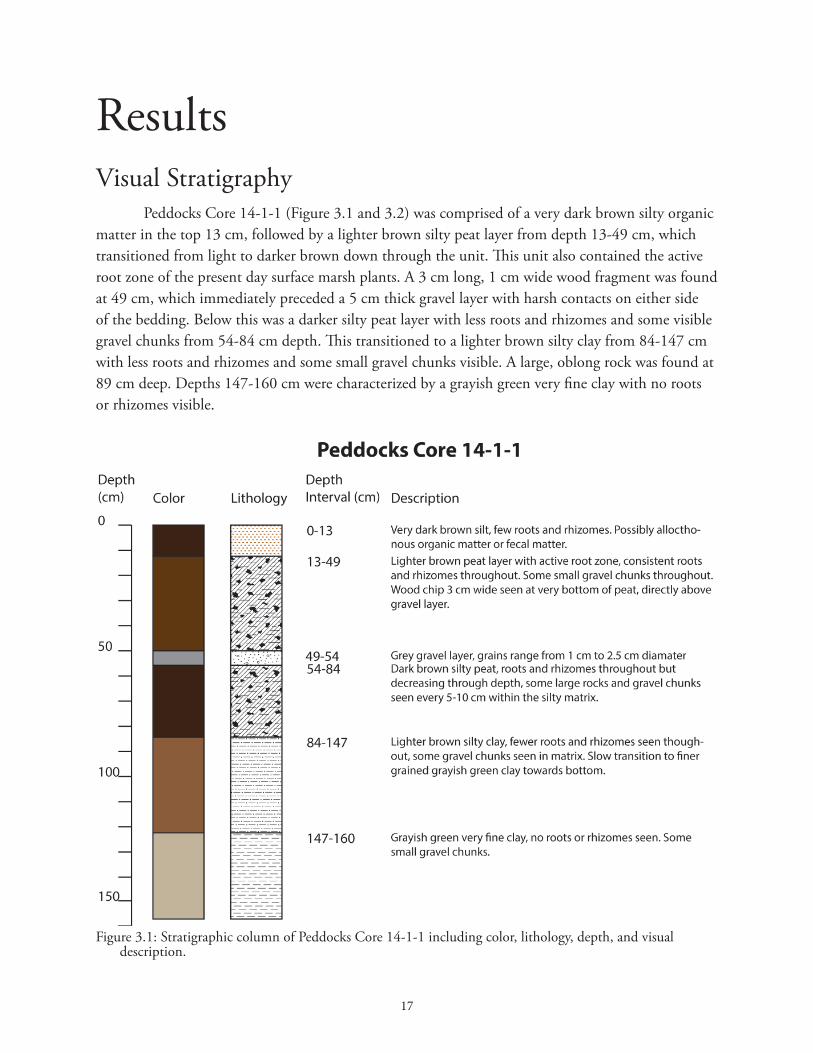
Results Visual Stratigraphy Peddocks Core 14-1-1 (Figure 3.1 and 3.2) was comprised of a very dark brown silty organic matter in the top 13 cm, followed by a lighter brown silty peat layer from depth 13-49 cm, which transitioned from light to darker brown down through the unit. Th is unit also contained the active root zone of the present day surface marsh plants. A 3 cm long, 1 cm wide wood fragment was found at 49 cm, which immediately preceded a 5 cm thick gravel layer with harsh contacts on either side of the bedding. Below this was a darker silty peat layer with less roots and rhizomes and some visible gravel chunks from 54-84 cm depth. Th is transitioned to a lighter brown silty clay from 84-147 cm with less roots and rhizomes and some small gravel chunks visible. A large, oblong rock was found at 89 cm deep. Depths 147-160 cm were characterized by a grayish green very fi ne clay with no roots or rhizomes visible.
Figure 3.1: Stratigraphic column of Peddocks Core 14-1-1 including color, lithology, depth, and visual description.

18
Figure 3.2: High-resolution image of Peddocks Core 14-1-1.

19
Lab AnalysesDry and Wet Bulk Density Dry and wet bulk density (Figure 3.3) was calculated down core for each 1 cc subsample every 7 cm on Peddocks Core 14-1-1. Th e wet bulk density and dry bulk density for Core 14-1-1 were very similar. For dry bulk density, values began around 0.4 and generally increased down core to 2.0. For wet bulk density, values began around 1.2 and generally increased down core to 2.4. Both dry and bulk density values were generally lower in the organic-rich peat layers, and higher in the more inorganic layers.
% Loss on Ignition Subsamples of 1 cc every 7 cm were also used to calculate % Loss on Ignition (LOI) (Figure 3.4) down core for Core 14-1-1. Th e % LOI is synonymous to the amount of organic matter in a subsample. From depth 0-13 cm, the %LOI ranged from 5% to 20%. From 13-49 cm, the light brown peat layer, %LOI values were higher, ranging from 18-40%. From 49-54 cm in the gravel layer, the %LOI drastically drops to close to 0%. Values increase again in the following peat layer from 54-84 cm. From 84-147 cm in the silty clay, values slowly decrease to 0.2%. Values continue to decrease in from 147-160 cm in the grayish green clay to close to 0% LOI.
Figure 3.3: Wet and dry bulk density values for Peddocks Core 14-1-1.

20
Magnetic Susceptibility Magnetic susceptibility measurements (Figure 3.5) were taken every 1 cm down core for Peddocks Core 14-1-1 using the Bartington MS2E meter. Th e values are measured in centimeter*gram*seconds (CGS). Th e values are relatively low through the fi rst two stratigraphic units from 0-49 cm. Th ere is a rapid increase in magnetic susceptibility values for several centimeters at around the 50 cm mark. Values decrease and stay relatively low in the rest of the peat from 54-84 cm. In the following silty clay and grayish green clay layers, the magnetic susceptibly gradually increases, with several large spikes at 150-155 cm.
Figure 3.4: % Loss on Ignition values for Peddocks Core 14-1-1.

21
Grain Size Analysis Grain size measurements were obtained every 5 cm down core in Peddocks Core 14-1-1. Th ese measurements produced values in the gravel fraction (>2mm), the sand fraction (<2mm>63µm), and the silt clay fraction (<63µm). Figure 3.6 shows the silt-clay fractions and Figure 3.7 shows the sand and gravel fractions. In the silt-clay fraction, the mean and median grain sizes were calculated for every 5 cm. Values remain generally the same from 0-20 cm at a mean of 5 microns, but abruptly increase around 25 cm to 15 microns. Values continue to vary until 100 cm, where there is a large increase to a mean of 30 microns. Values then gradually decrease from 105-160 cm to around 7 microns. Several peaks are evident down core at 30 cm, 70 cm, and 95 cm depth.
Th e sand and gravel fractions were calculated by grams/cc of sediment. After organic matter was disintegrated from each subsample, the sand and gravel fractions were sieved out because the
Figure 3.5: Magnetic Susceptibility values for Peddocks Core 14-1-1.

22
Coulter could not analyze grains this large. In both fractions, the values start very high in the fi rst 5 cm, but decrease to almost 0 g/cc from 15-45 cm. At 50 cm there is a very large spike in both sand and gravel, up to 0.4 and 0.5 g/cc respectively. Th e values then vary from 55-75 cm for both sand and gravel. From 75-160 cm, the sand fraction then remains very low, just slightly above 0 g/cc. However the gravel fraction experiences a gradual increase from 75-160 cm, as it moves through the silty clay and the grayish green clay units. Peaks are evident at 0, 10, 50, 65, 100, 110, 120, 130, 145, and 160 cm for the sand fraction. Peaks are evident at 0, 10, 50, 65, 100, and 160 cm for the gravel fraction.
Figure 3.6: Grain size values of for the silt-clay fraction (<63µm) for Peddocks Core 14-1-1.
Figure 3.7: Grain size values of for the sand and gravel fractions for Peddocks Core 14-1-1.
23
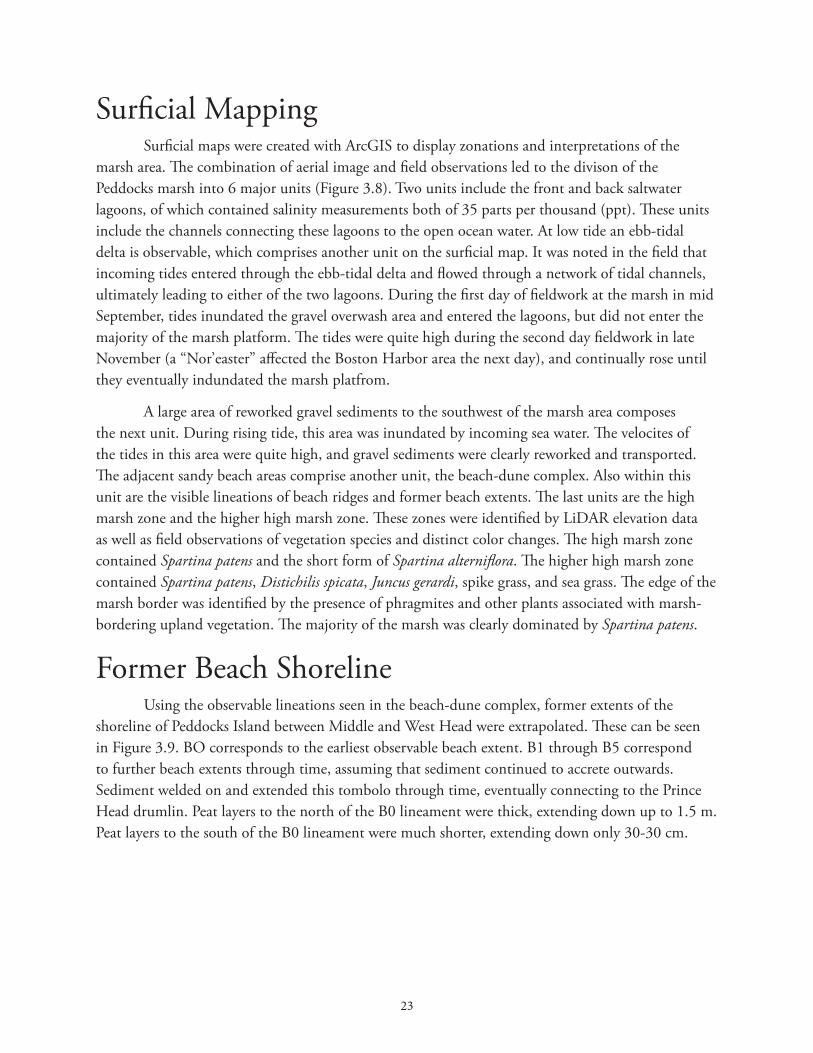
Surfi cial Mapping Surfi cial maps were created with ArcGIS to display zonations and interpretations of the marsh area. Th e combination of aerial image and fi eld observations led to the divison of the Peddocks marsh into 6 major units (Figure 3.8). Two units include the front and back saltwater lagoons, of which contained salinity measurements both of 35 parts per thousand (ppt). Th ese units include the channels connecting these lagoons to the open ocean water. At low tide an ebb-tidal delta is observable, which comprises another unit on the surfi cial map. It was noted in the fi eld that incoming tides entered through the ebb-tidal delta and fl owed through a network of tidal channels, ultimately leading to either of the two lagoons. During the fi rst day of fi eldwork at the marsh in mid September, tides inundated the gravel overwash area and entered the lagoons, but did not enter the majority of the marsh platform. Th e tides were quite high during the second day fi eldwork in late November (a “Nor’easter” aff ected the Boston Harbor area the next day), and continually rose until they eventually indundated the marsh platfrom.
A large area of reworked gravel sediments to the southwest of the marsh area composes the next unit. During rising tide, this area was inundated by incoming sea water. Th e velocites of the tides in this area were quite high, and gravel sediments were clearly reworked and transported. Th e adjacent sandy beach areas comprise another unit, the beach-dune complex. Also within this unit are the visible lineations of beach ridges and former beach extents. Th e last units are the high marsh zone and the higher high marsh zone. Th ese zones were identifi ed by LiDAR elevation data as well as fi eld observations of vegetation species and distinct color changes. Th e high marsh zone contained Spartina patens and the short form of Spartina alternifl ora. Th e higher high marsh zone contained Spartina patens, Distichilis spicata, Juncus gerardi, spike grass, and sea grass. Th e edge of the marsh border was identifi ed by the presence of phragmites and other plants associated with marsh-bordering upland vegetation. Th e majority of the marsh was clearly dominated by Spartina patens.
Former Beach Shoreline Using the observable lineations seen in the beach-dune complex, former extents of the shoreline of Peddocks Island between Middle and West Head were extrapolated. Th ese can be seen in Figure 3.9. BO corresponds to the earliest observable beach extent. B1 through B5 correspond to further beach extents through time, assuming that sediment continued to accrete outwards. Sediment welded on and extended this tombolo through time, eventually connecting to the Prince Head drumlin. Peat layers to the north of the B0 lineament were thick, extending down up to 1.5 m. Peat layers to the south of the B0 lineament were much shorter, extending down only 30-30 cm.
24
Figure 3.8: Surfi cial Map of the Peddocks Marsh.

25
Figure 3.9: Aerial Map of the Peddocks Marsh including interpreted former beach extents.

26
Radiocarbon Dating Analysis of a wood chip found at 48 cm for 14C age by DirectAMS in Seattle, WA yielded a 14C age of 300 years BP, with a 1σ error of 23. Using the CALIB 7.1 program, a calibration to calendar years yielded a median of 1559 AD for the wood chip. Figure 3.10 shows the calibration curve and calculated sigma peaks. Th e 1 sigma peak had a 68.3% area enclosed, and calendar year ranges of 1523-1572 AD and 1630-1645 AD. Th e 2 sigma peak had a 95.4% area enclosed, and calendar year ranges of 1497-1505 AD, 1513-1600 AD, and 1616-1650 AD.
Figure 3.10: Calibration probability curve of wood chip sample at 48 cm, using CALIB 7.1 program.

27
Discussion In order to interpret the history of the formation of the Peddocks Marsh, it is important to utilize the combination of sediment stratigraphy, marsh surfi cial mapping, and previously studied glacial history. Although several sediment cores were taken, Core 14-1-1 was especially helpful for interpreting the history of post-glacial marsh formation. Not many studies have been performed on the Peddocks Island Marsh, however one study by Wilson (2013) performed a similar analysis of Boston Harbor Island marshes, utilizing sediment stratigraphy, SETs (Sediment Elevation Tables), and radiocarbon/210Pb dating. While this study did not directly interpret rates of sea level rise through analysis on sediment core samples, the stratigraphy was compared with fi ndings of others, and matched to a Massachusetts sea level curve (Figure 1.10) in order to fi t the order of events into context.
Stratigraphy of the Peddocks Marsh Th e three main stratigraphic units seen in the Peddocks Island Marsh are excellent indicators of the post-glacial environments of the Boston Harbor area, and have been identifi ed in other studies of the area. Th e lowest unit seen was the grayish green-blue very fi ne clay (median grain size between 5 and 10 microns), which contained no roots and rhizomes and extended from 147 to 160 cm deep. Th is layer likely corresponds to the Boston Blue Clay, a glaciomarine deposit between 14,000 and 12,600 14C BP (Kaye, 1982; Rosen et al., 1993). Th e Boston Blue Clay is a moist, greenish gray clay underlying most of Boston Harbor, the Boston area, and some of the Massachusetts Bay area, deposited in a glaciomarine setting in front of the retreating late Wisconsinan Ice Sheet (Kaye, 1982). Rosen et al, 1993 suggest its equivalence to the Presumpscot Formation seen in Maine, which was deposited at approximately 11,600 14C BP. Th e middle dominant unit was the darker brown silty mud, containing some roots and rhizomes throughout. Organic matter was relatively high in the upper parts of this unit at ~30% LOI, however progressively lowered down core to values closer to ~3%. Wilson (2013) found similar units at Peddocks Island and Th ompson Island, another island in the Boston Harbor Island system. Th e fact that roots and rhizomes are sparse to nonexistent in the lower parts of this unit and become more abundant in upper parts suggest evidence of colonization of marsh plants. Th is unit likely corresponds to a tidal mud fl at that served as a platform for marsh accretion and colonization. Many studies in New England salt marshes have found evidence of marsh colonization over aggrading tidal fl ats (Knight, 1935; Redfi eld, 1972; Kelley et al., 1988; Niering and Warren, 1980).
However, the process by which salt marshes colonize underlying mud fl ats is not simply a landward accretion. Redfi eld, 1972 and Knight, 1935 consider the two original theories of marsh development, Mudge’s Th eory (1858) and Shaler’s Th eory (1886). Mudge proposed that marshes initially involved the colonization in the high marsh and developed towards the low marsh during a period of land submergence (Redfi eld, 1972; Knight, 1935). Shaler proposed that since Spartina

28
alternifl ora occupied the intertidal zone and Spartina patens occupied the level above high water, these layers would accumulate and migrate over tidal mud fl ats (Redfi eld, 1972). Both theories have been utilized to formulate a more modern theory on salt marsh development. As sea level rises and sediment accumulates, Spartina alternifl ora will spread over the accumulating sediment whenever its elevation is above the lower limit necessary for the growth of this plant (a factor of salinity). Sea level rise leads to the upward and seaward movement of this lower limit as sediment accumulates to the area. Th is will create a layer of intertidal peat along the extent of this lower limit. Peat above the Mean High Water level will accumulate into a thick layer, accreting upward and landward (Redfi eld, 1972). Figure 4.1 shows a cross-sectional diagram of salt marsh development created by Niering and Warren, 1980, using Redfi eld’s fi ndings.
Th us over time, the formation of the Peddocks Marsh was characterized by upward, landward, and seaward accretion of peat on tidal mud fl ats. Th e tidal mud fl ats started with little to no marsh plant present (% organic contents ~0-3%), and began to become dominated by marsh plants through time (% organic contents ~20-30%). As marsh plants (S. alternifl ora and S. patens) began to root in the accumulating sediments, erosion was prevented, allowing the colonization and further accretion of sediments.
Th e third main unit seen in the Peddocks Island stratigraphy was the light brown silty peat at the top. Organic matter was quite high (~40%), likely from the dominant presence of roots and rhizomes. Th is unit also contains the active root zone of the present living marsh plants. Th is unit coincides with full colonization of the Peddocks Marsh, which is evident in present day. Additionally, of importance to note is 13 cm thick layer of very dark brown material that lied above this unit which contained no roots or rhizomes and had a strange, decomposing smell. Th is material is interpreted to be allochthonous to the marsh, and likely some sort of manure or waste that was dumped onto the marsh. Core 14-1-1 was the only core to see this layer, however.
Figure 4.1: Revised cross-sectional diagram of salt marsh development from Niering and Warren, 1980, using the work of Redfi eld, 1965.
29
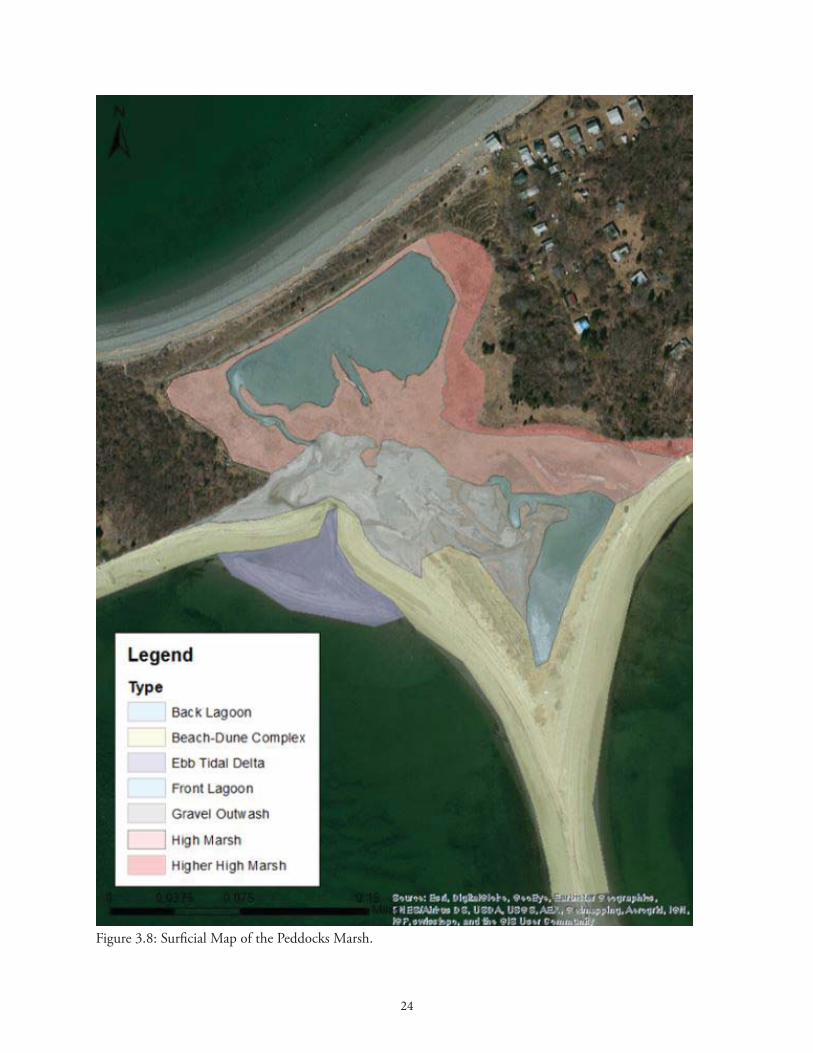
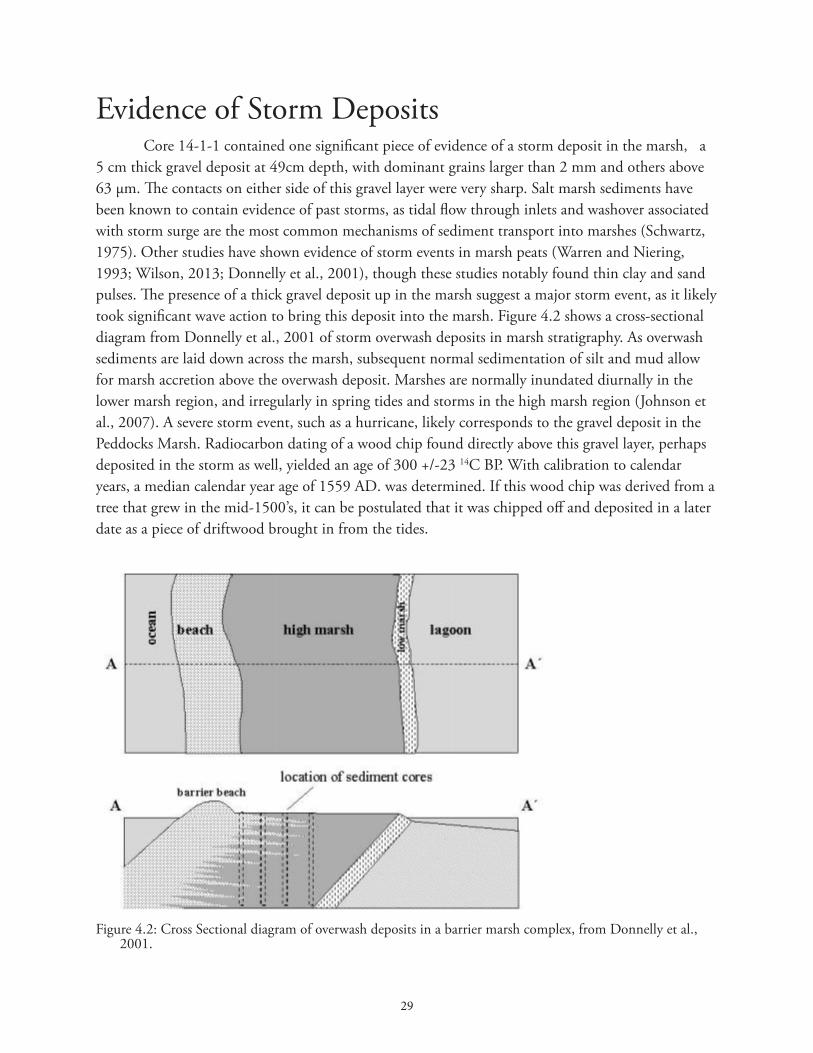
Evidence of Storm Deposits Core 14-1-1 contained one signifi cant piece of evidence of a storm deposit in the marsh, a 5 cm thick gravel deposit at 49cm depth, with dominant grains larger than 2 mm and others above 63 µm. Th e contacts on either side of this gravel layer were very sharp. Salt marsh sediments have been known to contain evidence of past storms, as tidal fl ow through inlets and washover associated with storm surge are the most common mechanisms of sediment transport into marshes (Schwartz, 1975). Other studies have shown evidence of storm events in marsh peats (Warren and Niering, 1993; Wilson, 2013; Donnelly et al., 2001), though these studies notably found thin clay and sand pulses. Th e presence of a thick gravel deposit up in the marsh suggest a major storm event, as it likely took signifi cant wave action to bring this deposit into the marsh. Figure 4.2 shows a cross-sectional diagram from Donnelly et al., 2001 of storm overwash deposits in marsh stratigraphy. As overwash sediments are laid down across the marsh, subsequent normal sedimentation of silt and mud allow for marsh accretion above the overwash deposit. Marshes are normally inundated diurnally in the lower marsh region, and irregularly in spring tides and storms in the high marsh region (Johnson et al., 2007). A severe storm event, such as a hurricane, likely corresponds to the gravel deposit in the Peddocks Marsh. Radiocarbon dating of a wood chip found directly above this gravel layer, perhaps deposited in the storm as well, yielded an age of 300 +/-23 14C BP. With calibration to calendar years, a median calendar year age of 1559 AD. was determined. If this wood chip was derived from a tree that grew in the mid-1500’s, it can be postulated that it was chipped off and deposited in a later date as a piece of driftwood brought in from the tides.
Figure 4.2: Cross Sectional diagram of overwash deposits in a barrier marsh complex, from Donnelly et al., 2001.
30
Because of the date of the wood chip, the gravel layer is interpreted to be possible evidence of the Great Colonial Hurricane of 1635. Th e date of this hurricane matches well with the radiocarbon date of the wood chip and its inferred time of deposition, and coincides with one of the fi rst recorded large hurricanes in the Northeastern U.S. in colonial times. Records from colonists and ship workers document an intense storm that was undeniably very destructive on the coast of Massachusetts. In 1635, Anthony Th atcher gave an account of the hurricane as he rode his ship off the coast of Ipwich, MA: “O cousin, it hath pleased God to cast us here between two rocks, the shore not far from us, for I saw the tops of trees when I looked forth!” (Stedman, 1889). John Winthrop, the Governor of Massachusetts, also gave a detail account in his journal, noting the winds powerful enough to fl atten forests and rip houses from the ground (Ludlum, 1963). From these accounts, many have hypothesized that the storm seen in August 1635 was a Category 3 hurricane (Boose et al., 2001; Ludlum, 1963). Buynevich et al., 2004 found similar evidence of the Great Colonial Hurricane in ground-penetrating radar (GPR) and sedimentological data of buried storm scarps of sandy barrier along Maine’s southern coast.
While many studies have looked at evidence of storm deposits along the coast, another form of study by Besonen et al., 2008 provides a higher resolution record of major storm events in the Boston area. Besonen interpreted that thicker varves indicative of increased rapid sedimentation from storm events, in the Lower Mystic Lake just outside of Boston, in 1635, 1706, 1727, 1770, 1804, 1850, and 1869. While it is notable that they also discovered evidence of a signifi cant hurricane in 1635, evidence of other major storm events may be evident in the Peddocks Core as varying pulses coarser sediments. In the grain size analysis of Core 14-1-1, several coarser grain pulses are seen throughout the core. Th ough only one or two visible pulses lie above the 1635 deposit, one of these may correspond to another storm event found by Besonen et al., 2008. Pulses of silt and clay are also seen throughout the core, possibly corresponding to other rapid sediment overwash events.
Vegetation Patterns of the Peddocks Marsh Th e surfi cial map of the Peddocks Island marsh (Figure 3.8) shows the observed zonations of the marsh platform and in further characterizes surfi cial deposits seen in aerial images not previously noted by other studies. Marsh vegetation was dominated by the less fl ood-tolerant Spartina patens, which was seen in both the high marsh and higher high marsh platforms. As New England salt marshes are initially dominated by the more halophytic tall form of Spartina alternifl ora in initial colonization, it is evident that the Peddocks Marsh is well-colonized (Niering and Warren, 1980). Th e tall form of Spartina alternifl ora is normally seen between mean high tide and mean high water (MHW) (Johnson et al., 2007). Spartina patens is normally seen above MHW level, in addition to Distichilis spicata and the short form of Spartina alternifl ora, all observed in the high marsh platform in the Peddocks Marsh.. From this, we can conclude that the majority of the Peddocks Marsh sits above MHW level, and is inundated less frequently.
Th e absence of a low marsh platform at the marsh is peculiar, though the surfi cial deposits seen throughout the marsh may help explain this. As noted in the fi eld, the incoming tides

31
dominantly fl owed through the tidal channels originating from the ebb-tidal delta, eventually ending at either of the two lagoons. As the tides continued to rise above normal, the marsh platform was eventually inundated. It is likely that the presence of the tidal channels and lagoons prevents the diurnal fl ooding of the marsh, thus the absence of the low marsh platform and more halophytic vegetation. Th e dominant tidal infl ow through channels and the dominant presence of Spartina patens allows us to conclude that the marsh is inundated only in abnormally high tides (spring tides) or storm events. Th e higher high marsh platform seen in the western edge of the marsh was dominated by Spartina patens, Distichilis spicata, Juncus gerardi, spike grass, and sea grass. Th is vegetation pattern is normal to the higher high marsh platform, and is inundated only during large storm events (Johnson et al., 2007). Th us a large storm event, such as the Great Colonial Hurricane of 1635, would ideally leave overwash deposits in most of the Peddocks Marsh and into the higher marsh platform. A hurricane of this magnitude may even inundate past the marsh border, thus future coring outside the marsh border would be advantageous. A smaller storm event would likely only inundate the high marsh platform of Peddocks.
Holocene Sea level Fluctuations and Drumlin Welding Th ough the cores retrieved from Peddocks Marsh in this study did not penetrate to glacial that till underlies the peat and Boston Blue Clay, other studies such as Wilson (2013) have taken cores in other areas of the Peddocks Marsh where till was found underlying the Boston Blue Clay. Cores retrieved for this study only extended less than 2 m into the marsh. Depth to refusal for cores taken at the Peddocks Marsh were often infl uenced by diffi culty augering through thicker sediments, such as gravel. Nonetheless, using the fi ndings of this study and that of Wilson (2013) allows a fuller interpretation of post-glacial marsh development.
Th e presence of glacial till under the marsh stratigraphy as well as the marsh’s position between the West Head and Middle Head drumlins infers that the marsh was built upon a platform between these topographic highs. Th ick peat layers found proximal to steep upland boundaries at Peddocks Marsh suggest that the marsh developed within basins between topographic highs (drumlins) (Wilson, 2013). Th us after glacial retreat and deposition of the drumlins, a connection was likely formed between them, evident in present day as tombolo formations (FitzGerald et al., 2011). Tombolos, however, are not controlled simply by wave regime, but more by the underlying geology. Th e fact that the outline of the till platforms at Boston Harbor (Figure 4.3) is delineated by the bottom sediment characteristics is evidence that these tombolos are infl uenced by pre-existing glacial topography (Rosen and FitzGerald, 2004). Th e area between the West and Middle Head drumlins is a drowned retreat platform of the glacial topographic highs on which sediment accumulated. As the glacial till was eroded, it dominantly migrated to between these drumlins. Th e welding of sediment between the drumlins likely occurred 7000-5000 14C BP (Colgan and Rosen, 2001). Th is welding event allowed for a platform upon which further fi ne grained sediments could accrete, yielding the tidal mud fl ats that likely dominated the area for some time. Th e mud

32
fl ats, again, are evident in the middle silty mud unit with little to no organic content in its initial deposition. After the platform of tidal mud fl ats was developed, a sequence of marsh colonization of the fl ats followed.
Using the beach extent lineations in mapped in Figure 3.9, it is evident that at some point a tombolo reached out and extended to the Prince Head drumlin. Th e timeline of these events is not certain, but it can be inferrred additionally from the shorter peat layers on the southern side of the marsh that a younger marsh was formed. Th e division between older marsh and younger marsh is evident in lineation B0. After this younger marsh area formed, the sediments then likely accreted out towards the Prince Head drumlin. During this time, the second marsh lagoon was also likely formed.
Sequence of Marsh Formation in Post-Glacial Context Using the stratigraphic analysis of the Peddocks Marsh sediments and the known glacial history of Boston Harbor, a full sequence of events of marsh formation can be extrapolated. A timeline of this sequence can also be determined via previously studied dates of post-glacial events
Figure 4.3: Map showing the distribution of sedimentary environments in Boston Harbor. Th e units mapped as “Erosion” are till retreat platforms. Units mapped as “Deposition” are areas of deposition of the Boston Blue Clay. Figure from Knebel et al. (1991).
33
in Boston Harbor as well as depth of stratigraphic layers in the Peddocks Marsh by placement on a Massachusetts Relative Sea Level (RSL) Curve (Oldale et al., 1993), seen in Figure 4.4. A visual diagram of the sequence of marsh formation was created in order to better conceptualize the events (Figure 4.5).
Th e formation began with the retreat of the late Wisconsinan Ice Sheet in a Northwest direction, leaving behind the drumlins that constitute the topographic highs between the present day marsh. Th is retreat occurred in Boston Harbor before 14,000 14C BP (Himmelstoss et al., 2006; Knebel et al., 1991; Newman et al., 1990; Rosen et al., 1993). During this time of glacial retreat, glaciomarine waters deposited the Boston Blue Clay between 14,000 and 12,600 14C BP (Kaye, 1982). Th is deposit overlays the underlying till, and is evident in marsh stratigraphy. Following the deposition of the Boston Blue Clay and glaciomarine muds, sea level rapidly fell due to isostatic rebound, creating an erosional unconformity. Th is unconformity is seen in seismic refl ection profi les along the inner shelf (Kelley et al., 1986). Isostatic rebound in Boston Harbor is dated to approximately 12,000 14C BP (Oldale et al., 1993). Th is unconformity is thus evident in the Peddocks Marsh stratigraphy between the bottom third Boston Blue Clay unit and the middle silty unit. As sea level transgressed over thousands of years, the incoming waters eventually fl ooded Boston Harbor again. As the sea level encroached the drumlin fi eld, erosion led to drumlin welding. Using the direct correlation between marsh sediment depth and sea level, the timing of this event likely began between 7000 and 5000 BP (Colgan and Rosen, 2001). Th e tidal mud fl at platform likely fully developed by 4000 BP. Mudfl ats were subsequently colonized by marsh plants, beginning with the halophytic Spartina alternifl ora. An intepreted cross section diagram of the marsh is seen in Figure 4.6.
Rates of sea level rise decreased from 2.5 mm/yr to 1 mm/yr between 4000 and 2000 BP in Boston Harbor (Warren and Niering, 1993; Wilson, 2013). At a rate of 2.5 mm/yr, marsh likely did not form until deceleration to 1 mm/yr. At this slowed rate, sediment accretion within stands of intertidal saltwater cordgrass, Spartina alternifl ora, could keep pace (Niering and Warren, 1980). Th us stands of sediment with marsh plant could perpetuate seaward over tidal fl ats and landward over upland and older marsh material. Th us the marsh colonization likely occurred between 4000 and 2000 BP, in which Peddocks Marsh stratigraphy had increasing organic content and a buildup of peat. Wilson (2013) found sea-level deceleration in Boston Harbor is likely between 3800 and 3300 BP, using data from Th ompson and Peddocks Islands. Additionally, a stillstand in sea level rise may have occurred between 3700 and 2100 BP, and sea-level rise in Boston Harbor since 2100 BP is attributed more to land subsidence (Redfi eld and Rubin, 1962). Present rates of sea level rise in Boston Harbor have been estimated at 2.65 mm/yr (Zervas, 2001).
34
Figure 4.4: Relative Sea-Level Curve (RSL) for the Massachusetts area, from Oldale et al., 1993.

35
Figure 4.5: Conceptual diagram of series of post-glacial events in Boston Harbor and how they infl uenced the formation of modern Peddocks Island and the Peddocks Marsh.

36
Figure 4.6: Th eoretical cross sectional diagram of Peddocks Marsh stratigraphy.

37
Future of the Peddocks Salt Marsh Th e Peddocks Marsh has been able to keep pace with sea level rise at present day, but could undoubtedly experience destruction by accelerated rates. Several smaller relict marshes on Peddocks Island have not been able to keep pace, ultimately leading to overwash of tidal sediments. One marsh on the southern tip of West Head on Peddocks shows sediment inundation into the marsh (Figure 4.7). Using the future global sea level predictions seen in Figure 1.9, the Peddocks Marsh could accrete 20 cm by 2040, and 30 cm by 2060. Rates of sea level rise according to the model could theoretically reach 0.75 cm/yr by 2040. In this scenario, the Peddocks Marsh would not be able to keep pace with, along with most coastal wetlands in the Northeast.
Figure 4.7: Aerial images of the smaller marsh on West Head of Peddocks Island, showing the eff ects of accelerated sea level rise on marshes. Images from Google Earth.

38
Conclusion Stratigraphy of the Peddocks Marsh collected through sediment cores shows a history of the marsh formation and its post-glacial context in Boston Harbor. Th ree main units seen in the sediment cores constitute events related to deglaciation of the last glacial maximum and its eff ects on the harbor. Th e bottom-most unit corresponding to the Boston Blue Clay shows the glaciomarine muds deposited on the shore of Massachusetts as the meltwater from the retreating ice fl ooded the area, dating to 13,500 BP. An unconformity between the clay and middle unit is known from the isostatic rebound of the land 12,000 BP, where sea level rapidly fell to 40 m below present. Th e middle unit corresponded to tidal mud fl ats that accreted as glacially-carved drumlins in the harbor were welded together, occurring between 7000 and 5000 BP during marine transgression. Th e buildup of a tombolo between the Middle and West Head drumlins provided a platform for future buildup of marshland. Eventually, as sea level rise rates decreased from 2.5 to 1 mm/yr between 4000 and 2000 BP, the tidal mud fl ats were slowly colonized by marsh plants, initially by Spartina alternifl ora and later by Spartina patens. Th is colonization is apparent in the increasing organic content and presence of roots and rhizomes in the top peat unit. Today, the marsh continues to accrete at a rate synonymous to sea level rise. Th e Peddocks Marsh is dominantly above Mean High Water level, and sediments are mainly brought in by spring tides and large storm events. Evidence of major storm events is also present in marsh stratigraphy, notably in a gravel overwash deposit 50 cm below the marsh surface, corresponding to the Great Colonial Hurricane of 1635. Other smaller storm events are obvious in smaller pulses of larger grained sediments. Th e Peddocks Marsh provides an excellent history of the post-glacial conditions of Boston Harbor, as well as the eff ects of sea level rise in the late Holocene. Th e future well-being of the marsh strongly depends on regional and global rates of sea level rise. Accelerated rates may prevent the Peddocks Marsh from keeping pace with sea level, and will ultimately lead to a loss of coastal wetland.
Future Work Future fi eld work at Peddocks Marsh would greatly improve our understanding of the correlation between the marsh stratigraphy, post-glacial processes in Boston Harbor, and regional sea level rise. A more in depth analysis of marsh sediment cores would allow a much higher resolution history of the Peddocks Marsh and its formation. Classifi cation of marsh plant roots and rhizomes throughout the core would greatly help identify the colonization of the marsh, and could also infer anthropogenic eff ects on this wetland. Dating of basal peats would be of signifi cant help to the study of Peddocks and the larger study of sea level rates in Boston Harbor. Dates of basal peats would allow refi nement of the relative sea level curve of Massachusetts. Deeper sediment cores could also show better evidence of how the marsh initially formed between the Middle and West Head drumlins, as cores for this study only reached into the Boston Blue Clay 160 cm down. Deeper cores could reveal underlying till deposits associated with glacial retreat. Dating of these till deposits and of the Boston Blue Clay would also give actual dates of marsh formation events, rather than theoretical

39
dates using regional evidence. 210Pb dating of recent marsh sediments would yield present rates of accumulation, and would be useful to compare to present rates of sea level rise.
Additional coring work on other parts of the marsh would also be helpful, including the two tidal lagoons on the north and south ends of the marsh. Th e history of these lagoons is vague, and cores may reveal when they formed and their signifi cance in the Peddocks Marsh system.
Analysis of past aerial images of Peddocks Island could also help classify the extent of the marsh shoreline in addition to analysis of the observable lineaments on beach ridges. Th is and all aforementioned analyses would allow a clearer and more confi dent interpretation of the history of the Peddocks Marsh.

40
BibliographyBalc o, G.A., Stone, J.O., Porter, S.C., and Caff ee, M.W., 2002, Cosmogenic-nuclide ages for New England coastal
moraines, Martha’s Vineyard and Cape Cod, Massachusetts, USA, Quaternary Science Reviews, no. 21, v. 20, p. 2127-2135
Barlow, N.L.M., Long, A.J., Saher, M.H., Gehrels, W.R., Garnett, M.H., and Scaife, R.G., 2014, Salt-marsh reconstructions of relative sea-level change in the North Atlantic during the last 2000 years, Quaternary Science Reviews, v. 99, p. 1-16.
Barlow, N.L.M, Shennan, I., Long, A.J., Gehrels, W.R., Saher, M.H., Woodroff e, S.A., and Hillier, C., 2013, Salt marshes as late Holocene tide gauges, Global and Planetary Change, v. 106, p. 90-110.
Bertness, M.D, and Ellison, A.M., 1987, Determinants of Pattern in a New England Salt Marsh Plant Community, Ecological Monographs, v. 57, no. 2, p. 129-147
Besonen, M.R., Bradley, R.S., Mudelsee, M., Abbott, M.B., 2008, A 1,000-year, annually-resolved record of hurricane activity from Boston, Massachusetts: Geophysical Research Letters, v. 35, no. 14, p. 1-6
Boose, E.R., Chamerlin, K.E., Foster D.R., 2001, Landscape and regional impacts of historical hurricanes in New England: Ecological Monographs, v. 71, p. 27-48
Bradley, R.S., 1999, Paleoclimatology: Reconstructing Climates of the Quaternary: San Diego, Academic Press, 613 p.
Brain, M.J., Long, A.J., Woodroff e, S.A., Petley, D.N., Milledge, D.G., Parnell, A.C., 2012, Modelling the eff ects of sediment compaction on salt marsh reconstructions of recent sea-level rise, Earth and Planetary Science Letters, v. 345-348, p. 180-193.
Buynevich, I.V., FitzGerald, D.M, van Heteren, S., 2004, Sedimentary records of intense storms in Holocene barrier sequences, Maine, USA: Marine Geology, v. 210, no. 1-4, p. 135-148
Colgan, P.M., and Rosen, P.S., 2001, Quaternary environments and history of Boston Harbor, Massachusetts. In: West, D.P., and Bailley, R.H. (eds.), Guidebook for Geological Field Trips in New England, 2001 Annual Meeting of the Geological Society of America (Boston) p. I1-I20
Chmura, G.L., Anisfeld, S.C., Cahoon, D.R., and Lynch, J.C., 2003, Global sequestration in tidal, wetland soils, Global Biogeochemical Cycles
Dearing, J.A., 1999, Environmental Magnetic Susceptibility: Using the Bartington MS2 System: British Library, no. 7, p. 1-54
Donnelly, J.P., Bryant S.S, Butler, J., Dowling, J., Fan, L., Hausmann, N., Newby, P., Shuman, B, Stern, J., Westover, K., and Webb III, T., 2001, 700 yr sedimentary record of intense hurricane landfalls in southern New England, Geological Society of America Bulletin v. 113, no. 6, p. 714-727.
FitzGerald, D.M., Hughes, Z.J., Rosen, P.S., 2011, Boat Wake Impacts and their Role in Shore Erosion Processes, Boston Harbor Islands National Recreation Area: Natural Resource Report, National Park Service, p. 1- 119
Gehrels, W.R., Belknap, D.F., Black, S, and Newnham, R.M., 2002, Rapid sea-level rise in the Gulf of Maine, USA, since AD 1800, Th e Holocene, v. 12, no. 4, p. 383-389
Gehrels, W.R., Dawson, D.A., Shaw, J., and Marshall, W.A., 2011, Using Holocene relative sea-level data to inform

41
future sea-level predictions: An example from southwest England, Global and Planetary Change, v. 78, p. 116-126.
Gontz, A.M., Maio, C.V., and Rueda, L., 2013, Th e Duxbury Sunken Forest- Constraints for Local, Late Holocene Environmental Changes Resulting from Marine Transgression, Duxbury Bay, Eastern Massachusetts, U.S.A., Journal of Coastal Research, v. 29, p. 168-176
Hall, F.R., 1998, Introduction to Sediment Magnetism: Including Discussions on Magnetic Susceptibility
Himmelstoss, E.A., Fitzgerald, D.M., Rosen, P.S., and Allen, J.R., 2006, Bluff Evolution along Coastal Drumlins: Boston Harbor Islands, Massachusetts, Journal of Coastal Research, v. 22, no. 5, p. 1230-1240.
Hughes, Z.J., FitzGerald, D.M., Howes, N.C., and Rosen, P.S., 2007, Th e impact of natural waves and ferry wakes on the erosion of bluff s, Boston Harbor, US. Journal of Coastal Research
Johnson, B.J., Moore, K.A., Lehmann, C., Bohlen, C., and Brown, T.A., 2006, Middle to late Holocene fl uctuations of C3 and C4 vegetation in a Northern New England Salt Marsh, Sprague Marsh, Phippsburg Maine, Organic Chemistry, v. 38, p. 394-403.
Kaye, C.A., 1982, Bedrock and Quaternary geology of the Boston area, Massachusetts: Reviews in Engineering Geology, v. 5, p. 25-40, doi:10.1130/REG5-p25
Kaye, C.A., and Barghoorn, E.S., 1964, Late Quaternary Sea-Level Change and Crustal Rise at Boston, Massachusetts, with Notes on the Autocompaction of Peat, Geological Society of America Bulletin, v. 75, p. 63-80
Kelley, J.T., Belknap, D.F., Jacobson, G.L., Jacobson, H.A., 1988, Th e Morphology and Origin of Salt Marshes along the Glaciated Coastline of Maine, USA: Journal of Coastal Research, v. 4, no. 4, p. 649-666
Kelley, J.T., Kelley, A.R., Belknap, D.F., Shipp, R.C., 1986, Variability in the evolution of two adjacent bedrock-framed estuaries in Maine, In: D. Wolfe (Ed.), Estuarine Variability, p. 21-42
Kirwan, M.L., & Temmerman, S., 2009, Coastal marsh response to historical and future sea-level acceleration, Quaternary Science Reviews, no. 28, v. 17, p. 1801-1808.
Knebel, H.J, Rendigs, R.R., Bothner, M.H., 1991, Modern Sedimentary Environments in Boston Harbor, Massachusetts: Journal of Sedimentary Petrology, v. 61, no. 5, p. 791-804
Knight, J.B., 1934, A Salt-Marsh Study, American Journal of Science, v. 28, no. 165, p. 161-181.
Ludlum, D.M., 1963. Early American hurricanes American Meteorological Society, Boston, Massachusetts, 198 pp.
Miller, W.R. and Egler, F.E., 1950, Vegetation of the Wequetequock-Pawcatuck Tidal-Marshes, Connecticut, Ecological Society of America, v. 20, no. 2, p. 143-172.
Newman, W.A., Berg, R.C., Rosen, P.S., Glass, H.D., 1990, Pleistocene stratigraphy of the Boston Harbor drumlins, Massachusetts, Quaternary Research v. 34, no. 2, p. 148-159.
Niering, W.A. and Warren, R.S., 1980, Vegetation patterns and processes in New England salt marshes: BioScience, v. 30, no. 5, p. 301-307
Nixon, S.W., 1982, Th e Ecology of New England High Salt Marshes, Biological Service Program, p. 1-70
Oldale, R. N., Colman, S. M., and Jones, G. A., 1993, Radiocarbon ages from two submerged strandline features in the western Gulf of Maine and a sea-level curve for the northeastern Massachusetts coastal region: Quaternary Research, v. 40, p. 38-45

42
Peltier, W.R., and Fairbanks, R.G., 2006, Global glacial ice volume and Last Glacial Maximum duration from an extended Barbados sea level record, Quaternary Science Reviews, v. 25, no. 23-24, p. 3322-3337
Redfi eld, A.C., 1972, Development of a New England Salt Marsh: Ecological Monographs, v. 42, no. 2, p. 201-237
Redfi eld, A. C., and Rubin, M., 1962, Th e age of salt marsh peat and its relation to recent changes in sea level at Barnstable, Massachusetts, Proceeding of the National Academy of Science, v. 48, p. 1728-1735
Rosen, P.S., Brenninkmeyer, B.M., Maybury, L.M., 1993, Holocene Evolution of Boston Inner Harbor, Massachusetts: Journal of Coastal Research, v. 9, no. 2, p. 363-377
Rosen, P.S. and Fitzgerald, D.M., 2004, Processes and Evolution of Boston harbor Islands: Peddocks and Lovells Islands: NEIGC Field Trip Guidebook, p. 137-153.
Schwartz, R.K., 1975, Nature and genesis of some washover deposits: U.S. Army Coastal Engineering Research Center Technical Memo 61, p. 69
Silva, M., 2003, Once Upon and Island: Boston, MA, Hothouse Press, p. 224
Snowe, Edward. “Peddock’s Island and Hingham Bay.” Th e Islands of Boston Harbor, Th eir History and Romance, 1626-1935. First ed. Andover: Andover, 1935. 253-260. Print.
Stedman, Edmund Clarence, Ellen Mackay Hutchinson, and Arthur Stedman. A Library of American Literature from the Earliest Settlement to the Present Time. New York: C.L. Webster, 1889. 167. Print.
Stocker, T.F., D. Qin, G.-K. Plattner, M. Tignor, S.K. Allen, J. Boschung, A. Nauels, Y. Xia, V. Bex and P.M. Midgley, 2013, IPCC: Climate Change 2013: Th e Physical Science Basis. Contribution of Working Group I to the Fifth Assessment Report of the Intergovernmental Panel on Climate Change, Cambridge University Press, p. 1535
Taylor, P.H., 2008, Salt Marshes in the Gulf of Maine: Human Impacts, Habitat Restoration, and Long-term Change Analysis: Gulf of Maine Council on the Marine Environment, www.gulfofmaine.org. IV+42 pages.
Warren, R.S., and Niering, W.A., 1993, Vegetation Change on a Northeast Tidal Marsh: Interaction of Sea-Level Rise and Marsh Accretion, Ecology, v. 74, no. 1, p. 96-103
Wilson, C.A., 2013, Morphodynamics in Mid-Atlantic and New England saltmarshes: Ecophysical processes and implications with sea-level rise [Ph.D. thesis]: Boston University, p. 85-106
Zervas, C., 2001, Sea Level Variations of the United States 1854-1999, National Ocean and Atmospheric Administration Technical Report. Silver Spring, Maryland: National Ocean Service, Center for Operational Oceanographic Products and Services, 201 p.