reference manual for sim common-view time and frequency
TRANSCRIPT

Reference Manual for
SIM Common-View Time and Frequency Measurement System

1
REFERENCE MANUAL for
SIM Common-View Time and Frequency Measurement System
TABLE OF CONTENTS I. Introduction 2 II. Installation 3 III. Configuring the System 4 IV. Antenna Position 6 V. Making Measurements 8 VI. Viewing Data on the Web 15 Calibration results follow page 15. The calibration was performed done by making a common-clock comparison to the master NIST system for a period of 10 days (240 hours). The CENAMEP system was calibrated using an Rx delay of 100 ns. Based on a average relative delay difference of 48.69 ns over a 10-day interval when compared to the calibrated NIST system, the Rx delay was changed to 51 ns. The resolution of the Rx delay value is 1 ns.
CENAMEP System Information SIM ID: 9 Result of Rx delay calibration: 51 nanoseconds, using supplied antenna/cable Web Link: http://gpsmonitor.timefreq.bldrdoc.gov/control/simnet.htm Web User Name: cvgps001 Web Password: SIM001

2
I. Introduction The SIM common-view time and frequency measurement system is designed to continually measure a laboratory’s primary time and frequency standard with respect to the national standards of all other participating SIM laboratories. All comparisons are made using the multi-channel common-view GPS measurement technique. Each participating laboratory is required to connect a stable 5 or 10 MHz signal to the system to serve as a time base, and to provide a 1 Hz signal from their primary standard or UTC time scale. The 1 Hz signal should preferably be on-time, since the system can display the absolute time offset between laboratories with an uncertainty of less than 50 ns. The system does not analyze or graph the data; it simply collects and stores it. The collected data is sent to a Web server located at NIST using the Internet file transfer protocol (FTP). The client can view the raw data and time difference graphs using a standard web browser. The following instructions explain how to use the system. The instructions are divided into three sections: installation, operation, and viewing data on the Web. Keep in mind that this system should perform as described here, but if not, please report all problems to NIST so that updates to the software and/or documentation can be made if necessary.
3
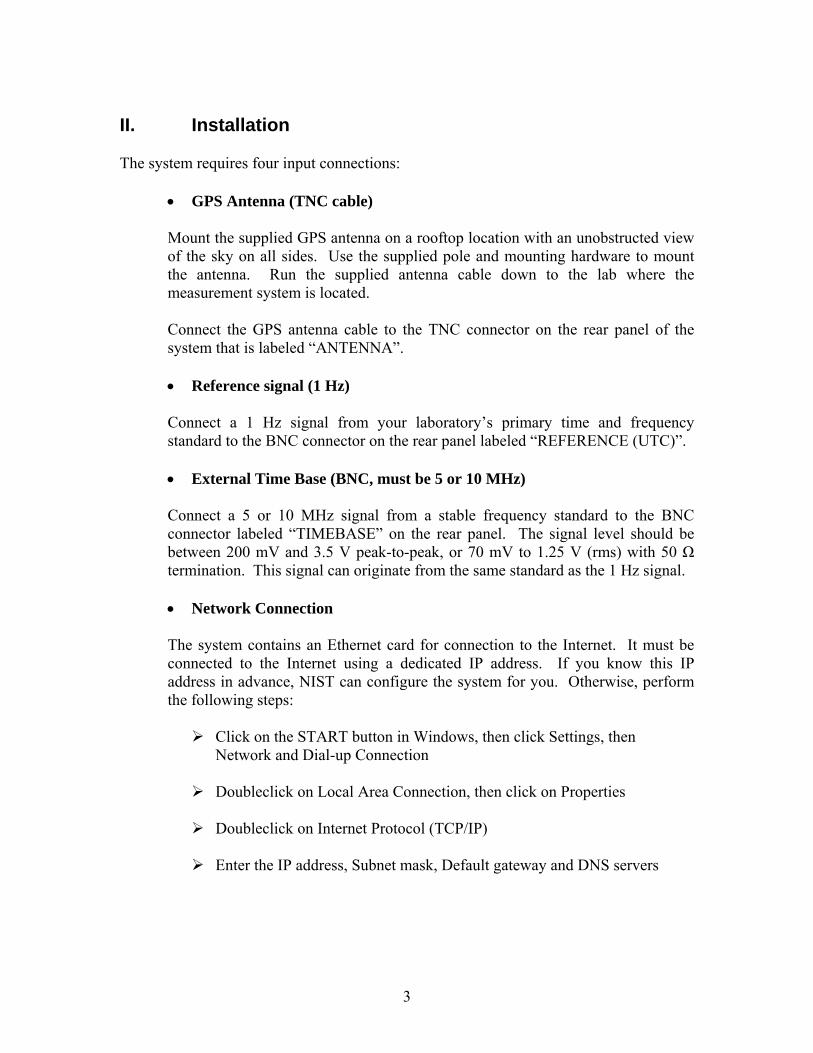
II. Installation The system requires four input connections:
• GPS Antenna (TNC cable) Mount the supplied GPS antenna on a rooftop location with an unobstructed view of the sky on all sides. Use the supplied pole and mounting hardware to mount the antenna. Run the supplied antenna cable down to the lab where the measurement system is located. Connect the GPS antenna cable to the TNC connector on the rear panel of the system that is labeled “ANTENNA”.
• Reference signal (1 Hz)
Connect a 1 Hz signal from your laboratory’s primary time and frequency standard to the BNC connector on the rear panel labeled “REFERENCE (UTC)”. • External Time Base (BNC, must be 5 or 10 MHz) Connect a 5 or 10 MHz signal from a stable frequency standard to the BNC connector labeled “TIMEBASE” on the rear panel. The signal level should be between 200 mV and 3.5 V peak-to-peak, or 70 mV to 1.25 V (rms) with 50 Ω termination. This signal can originate from the same standard as the 1 Hz signal.
• Network Connection
The system contains an Ethernet card for connection to the Internet. It must be connected to the Internet using a dedicated IP address. If you know this IP address in advance, NIST can configure the system for you. Otherwise, perform the following steps:
Click on the START button in Windows, then click Settings, then Network and Dial-up Connection
Doubleclick on Local Area Connection, then click on Properties
Doubleclick on Internet Protocol (TCP/IP)
Enter the IP address, Subnet mask, Default gateway and DNS servers

4
III. Configuring the System
After the computer is turned on and Windows 2000 has completed loading, the software should run automatically. You will then see a display similar to Figure Figure II.1 below:
Figure II.1. Initial Screen Display
Some of the fields near the bottom left corner of the SIM window might already contain information, but this information will need to be verified and changed if necessary before making measurements. To make changes, point to and click on the field that you want to edit. The fields are described below:
TIC Time Base This field allows you to select the frequency of your time
base oscillator (either 5 MHz or 10 MHz). The system requires a stable external time base oscillator in order to work properly.
SIM ID This is the unique number that identifies your laboratory. It cannot be changed without editing a system file, and should not be changed.
5
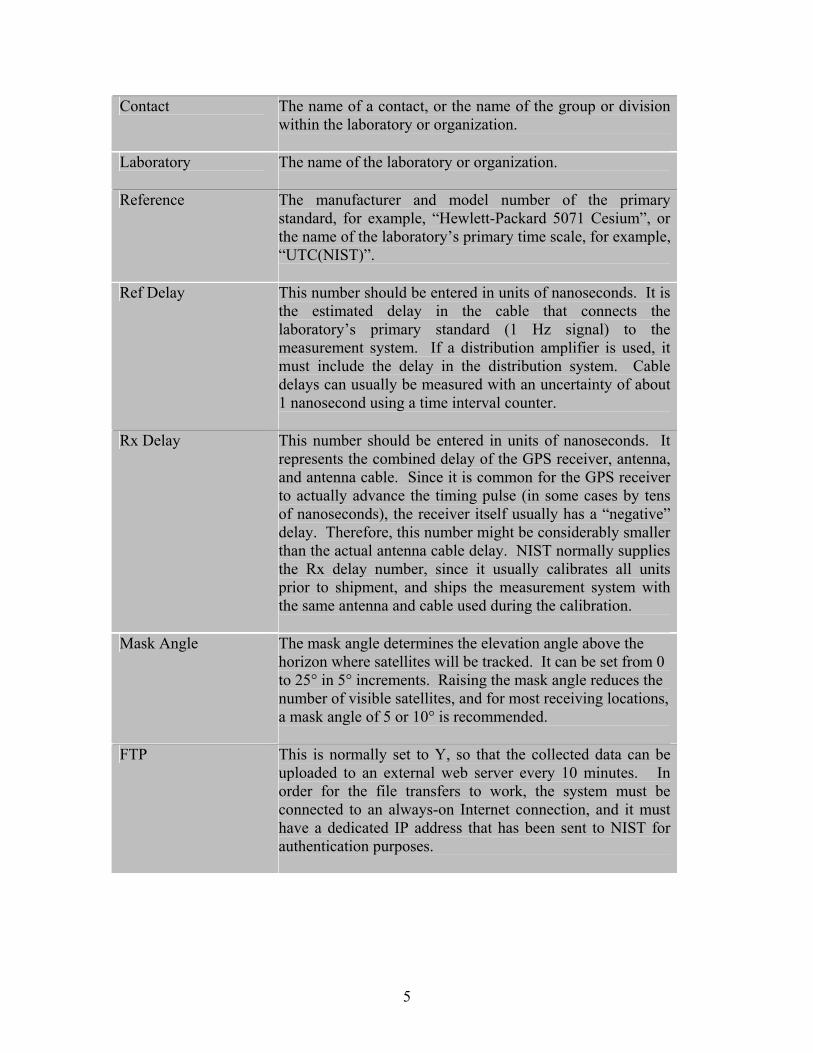
Contact The name of a contact, or the name of the group or division within the laboratory or organization.
Laboratory The name of the laboratory or organization.
Reference The manufacturer and model number of the primary standard, for example, “Hewlett-Packard 5071 Cesium”, or the name of the laboratory’s primary time scale, for example, “UTC(NIST)”.
Ref Delay This number should be entered in units of nanoseconds. It is the estimated delay in the cable that connects the laboratory’s primary standard (1 Hz signal) to the measurement system. If a distribution amplifier is used, it must include the delay in the distribution system. Cable delays can usually be measured with an uncertainty of about 1 nanosecond using a time interval counter.
Rx Delay This number should be entered in units of nanoseconds. It represents the combined delay of the GPS receiver, antenna, and antenna cable. Since it is common for the GPS receiver to actually advance the timing pulse (in some cases by tens of nanoseconds), the receiver itself usually has a “negative” delay. Therefore, this number might be considerably smaller than the actual antenna cable delay. NIST normally supplies the Rx delay number, since it usually calibrates all units prior to shipment, and ships the measurement system with the same antenna and cable used during the calibration.
Mask Angle The mask angle determines the elevation angle above the horizon where satellites will be tracked. It can be set from 0 to 25° in 5° increments. Raising the mask angle reduces the number of visible satellites, and for most receiving locations, a mask angle of 5 or 10° is recommended.
FTP This is normally set to Y, so that the collected data can be uploaded to an external web server every 10 minutes. In order for the file transfers to work, the system must be connected to an always-on Internet connection, and it must have a dedicated IP address that has been sent to NIST for authentication purposes.

6
IV. Antenna Position After the configuration information has been entered, the next step is to establish the GPS antenna coordinates. This can be done either by entering the coordinates if they are previously known, or by allowing the system to survey its own antenna position. Once the antenna position is known it is saved by the system and used for all further measurements, so this process does not need to be repeated unless the antenna is moved. The uncertainty of the antenna position directly contributes to the uncertainty of the time and frequency measurements recorded by the system, so it is important to use the best antenna coordinates that you have available. Note that if the system surveys its own position, the latitude and longitude values are often very accurate (within a few meters or less), but the altitude estimate can remain in error by as much as 20 meters, so an independent survey is often necessary for best results. To manually enter the antenna position:
• Click the Coordinates button. A window appears as shown in Figure III.1.
Figure III.1. The Enter Coordinates Window • Enter the antenna coordinates. The allowable resolution is 1 milliarcsecond
for latitude and longitude, and 1 centimeter for altitude.

7
• When finished, click the Save button.
To have the system survey its antenna position:
• Click the Antenna Survey button. • The receiver will be reset and begin to look for satellites. It might take up to
20 minutes before it produces its first position fix. Once the first position fix is obtained, coordinates are averaged for 24 hours (86,400 seconds), so the entire antenna survey takes slightly more than 24 hours to complete.
• During the antenna survey, the latitude, longitude, and altitude fields will
updated, and the samples field will show the number of position fixes that have been averaged so far.
• After 86,400 valid position fixes have been obtained, the average antenna
position is saved and the system is ready to begin measurements.

8
V. Making Measurements After the antenna position data is available, click the Go button to start the measurements. At this point, the system will calibrate the time interval counter, check the status of the GPS receiver, and then begin to collect and store measurements. When the measurements have begun, the screen display will look similar to Figure V.1. Leave the system running in this mode with the measurement screen displayed at all times. If it is ever necessary to stop the measurements, click the Stop button.
Figure V.1. The Measurement Screen The measurement screen is divided into three areas (left, middle, and right). The following tables describe what the numbers in each area mean.

9
Table V.1. Left Area of Measurement Screen Table Heading Description of Item Latitude The latitude of the GPS antenna, as determined by the antenna
survey or as entered by the user. The available resolution is 1 milliarcsecond.
Longitude The longitude of the GPS antenna, as determined by the antenna survey or as entered by the user. The available resolution is 1 milliarcsecond.
Altitude The altitude of the GPS antenna, as determined by the antenna survey or as entered by the user. The available resolution is 1 centimeter.
Samples The number of data samples recorded so far during the current day. One sample is recorded every second, so 86400 samples are recorded per day.
Last Reading The most recent reading from the time interval counter (displayed on a yellow background). The unit is nanoseconds. If the timing pulse from the GPS receiver is early with respect to the local standard, a negative number will be displayed. This is normal.
Min Reading The smallest reading recorded from the time interval counter during the current day. The unit is nanoseconds.
Max Reading The largest reading recording from the time interval counter during the current day. The unit is nanoseconds.
Range The maximum reading minus the minimum reading, in nanoseconds. This gives an indication of the worst case timing uncertainty of the system during the current day.
Mean Value The total of all readings divided by the number of samples, in nanoseconds.
Midpoint The midpoint of all readings, in nanoseconds.
Mean Diff The average difference between two successive readings, given in nanoseconds. This number will often be close to zero.
STDEV Diff The standard deviation of the difference between two successive readings, given in nanoseconds. This number provides a rough estimate of the timing stability of the system at an averaging time of 1 second.

10
TIC Cal Time The date and time when the time interval counter (TIC) was last calibrated. The TIC is calibrated immediately prior to a measurement run and at the beginning of each UTC day. During the calibration, this field will display the messages “IN PROGRESS” and “TRANSITION”. If the calibration fails, that will also be indicated in this field as “CALIBRATION FAILED”.
Start Range The counting range (min to max) of the TIC’s start interpolator during a 100 nanosecond interval, displayed only for diagnostic purposes.
Stop Range The counting range (min to max) of the TIC’s stop interpolator during a 100 nanosecond interval, displayed only for diagnostic purposes.
Start Res (ps) The resolution of the start input on the time interval counter, given in picoseconds. It is equal to the start range (max – min) divided by 100 nanoseconds. The resolution should be 30 picoseconds or less, and should be nearly equivalent to “Stop Res”.
Stop Res (ps) The resolution of the stop input on the time interval counter, given in picoseconds. It is equal to the start range (max – min) divided by 100 nanoseconds. The resolution should be 30 picoseconds or less, and should be nearly equivalent to “Start Res”.
TIC Delay (ns) The time offset due to delays in the time interval counter, given in nanoseconds. This number is used as a correction value that is applied to each reading. It is usually less than 0.5 ns.

11
Table V.2. Middle Area of Measurement Screen
Table Heading Description of Item Date The current date read from the GPS receiver.
Time The current time read from the GPS receiver. Due to the
screen updating procedure, the displayed time has an uncertainty of ±1 second.
Filename The filename currently being created by the system. The format for the name is YYYYMMDD. The file extension is the SIM ID. One file is created per day.
Sawtooth The timing pulse produced by the receiver is ambiguous to local oscillator clock cycles, due to the nature of the receiver hardware. However, the receiver firmware keeps track of the offset of the next timing pulse, and that number is displayed here and applied by the system as a “sawtooth” correction. The correction ranges from –52 to +52 ns.
Visible Sats The number of satellites currently visible to the GPS receiver. This number can be as high as 12, but the receiver is only capable of tracking 8 satellites at one time.
Sats in Use The number of satellites currently being tracked. The maximum number is 8.
Rx Temp. The temperature obtained from a sensor on the CPU board inside the computer case, near the GPS receiver. This sensor is read every second, but the resolution is 1° C, so the readings generally do not change rapidly. The temperature tends to be a few degrees higher than the laboratory temperature, and to fluctuate as the laboratory temperature fluctuates. For best results, it is important to not let the temperature change rapidly by keeping the receiver in a room where the temperature fluctuations do not exceed ±3° C.
Rx Status This field contains a text message that normally only changes during signal acquisition or an antenna survey. When the system is taking readings, the displayed message will read “Position Sent”.
Rx Code This field contains a number ranging from 1 to 255 that indicates the receiver status. If the receiver is operating

12
properly, the number should always be an 8 or a 32. Other numbers will appear during the acquisition or antenna survey process and can be ignored.
Pos. Hold ON means that the system is using a fixed antenna position, and is not trying to calculate further position fixes. OFF will only appear during signal acquisition or an antenna survey.
Box with green background
The “green” box contains information about each of the 8 channels on the GPS receiver. If one the channels is not being used, the information is printed on a light red background. The “PRN” column contains the psuedo random noise code (PRN) for each satellite being tracked. PRN codes have possible values ranging from 1 to 32. The “LO Phase” column shows the current phase (in nanoseconds) of the GPS receiver’s local oscillator (LO) with respect to the received GPS signal. These numbers change rapidly, by more than 10 microseconds per second, because the LO has an intentionally introduced frequency offset that exceeds 1 × 10⁻⁵. This offset is removed when the timing solution is produced. The numbers are displayed only for diagnostic purposes and to show that the receiver is tracking satellites. The “dBm” column shows the signal strength of each satellite being tracked. These numbers should normally be in the -115 to -135 dBm range and are generally accurate to about ±2 dB. The smallest number that can be displayed here is -163 dBm, which will often be seen when no satellite is available. Numbers smaller than -135 dBm on all channels could indicate that the antenna cable is too long or that local signal conditions are poor.

13
The right area of the screen provides data collected from all GPS satellites in view. The data is organized in row numbers labeled with the PRN numbers from the satellites. The 32 rows represent all possible slots in the GPS constellation, and it is not likely that all possible slots will contain satellites.
Table V.3. Right Area of Measurement Screen
Table Heading Description of Item Time Est. The time difference (in nanoseconds) between the last reading
recorded from the specified satellite and the average value of all satellites in view. If the background on this field is light blue, it means that the satellite is currently part of the timing solution, and this field is updating every second. If the background of this field is dark blue, it is not currently updating, and it contains the last recorded time estimate from the satellite. In some cases, the last recorded time estimate might be a fairly large number, which is why the satellite was dropped from the timing solution.
Seconds in View The number of samples collected from the specified PRN during the current UTC day. The GPS satellites have an orbital period of approximately 12 hours, and therefore pass over a given location on earth twice each day. The receive tracks each satellite down to the selected mask angle. With a 10° mask angle it is not uncommon to collect more than 400 minutes (24000 seconds) of data from a satellite each day. Since the receiver has an 8-channel capacity and more than 8 satellites are sometimes in view, not all satellites will be tracked on both of their passes. If the background on this field is light blue, it means that the satellite is currently part of the timing solution, and this field is updating every second. If the background of this field is dark blue, it is not currently updating, but this indicates the satellite was being tracked earlier in the UTC day.
Elev. Angle If the background of this field is light blue, it shows the current elevation angle of the satellite being tracked. If the background of the field is dark blue, it shows the elevation angle of the satellite at the moment when it was dropped from the timing solution. Normally, the values shown on a dark blue background will be equivalent to the mask angle, since satellites are dropped from the timing solution when their elevation angle is lower than the mask angle. However, in cases where more than 8 visible satellites are available for selection, or when a specific satellite is producing bad data, the receiver might drop a satellite from the

14
solution when it is still well above the mask angle. Therefore, you will sometimes see elevation angles high than the mask angle printed on a dark blue background.
NOTE: Once the system is operational, it will continue to take measurements unless there is a power outage, or if it is stopped by the operator. The measurement screen will reset at the end of each UTC day, erasing the old information and beginning the collection of new information. If the system is stopped for any reason, you can restart it by clicking on the SIM GPS Common-View icon, and then clicking the Go button.

15
VI. Viewing the Data on the Web When the system is running properly, it will send data every 10 minutes to a web server located at NIST. This data can then be viewed using any web browser with new data made available every 10 minutes. The web software allows up to 200 days of data to be displayed at one time. To view the data collected at all participating SIM laboratories, visit this link: http://gpsmonitor.timefreq.bldrdoc.gov/control/simnet.htm To access the page, use the following information: User name: cvgps001 Password: SIM001 The page allows you to view common-view GPS comparisons between any two participating SIM laboratories, or one-way GPS data recorded at any participating SIM laboratory.
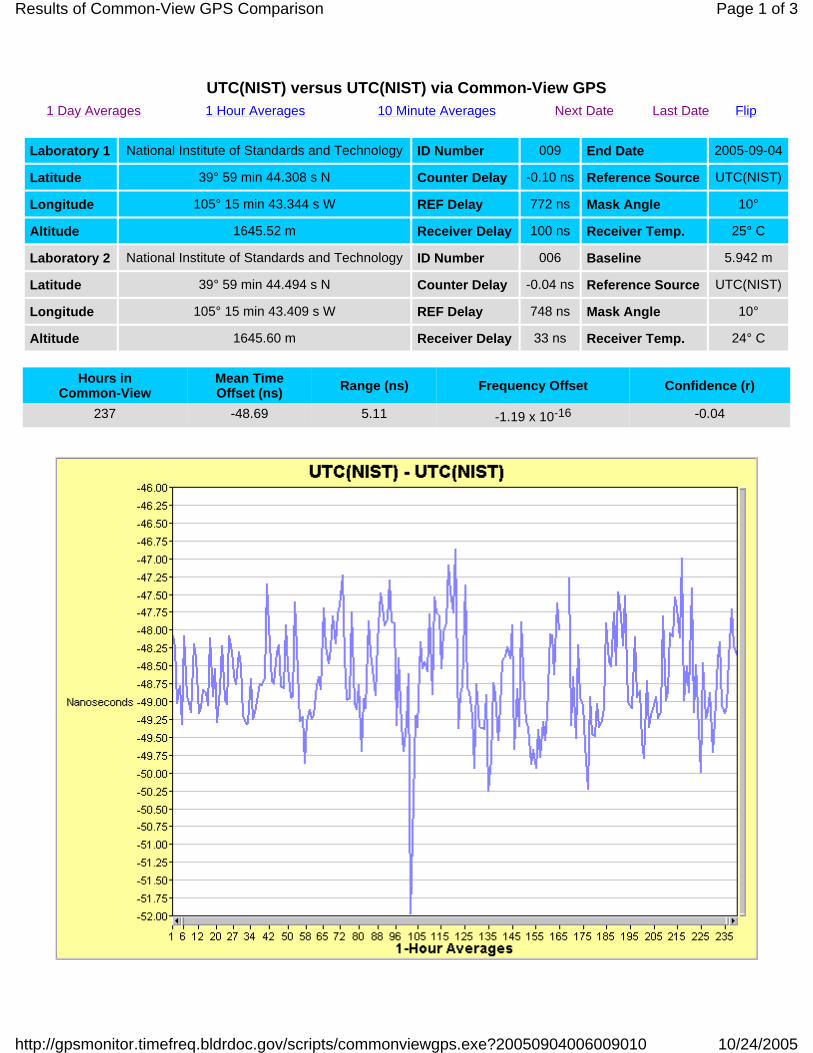
UTC(NIST) versus UTC(NIST) via Common-View GPS 1 Day Averages 1 Hour Averages 10 Minute Averages Next Date Last Date Flip
Laboratory 1 National Institute of Standards and Technology ID Number 009 End Date 2005-09-04
Latitude 39° 59 min 44.308 s N Counter Delay -0.10 ns Reference Source UTC(NIST)
Longitude 105° 15 min 43.344 s W REF Delay 772 ns Mask Angle 10°
Altitude 1645.52 m Receiver Delay 100 ns Receiver Temp. 25° C
Laboratory 2 National Institute of Standards and Technology ID Number 006 Baseline 5.942 m
Latitude 39° 59 min 44.494 s N Counter Delay -0.04 ns Reference Source UTC(NIST)
Longitude 105° 15 min 43.409 s W REF Delay 748 ns Mask Angle 10°
Altitude 1645.60 m Receiver Delay 33 ns Receiver Temp. 24° C
Hours in Common-View
Mean Time Offset (ns) Range (ns) Frequency Offset Confidence (r)
237 -48.69 5.11 -1.19 x 10⁻¹⁶ -0.04
Page 1 of 3Results of Common-View GPS Comparison
10/24/2005http://gpsmonitor.timefreq.bldrdoc.gov/scripts/commonviewgps.exe?20050904006009010
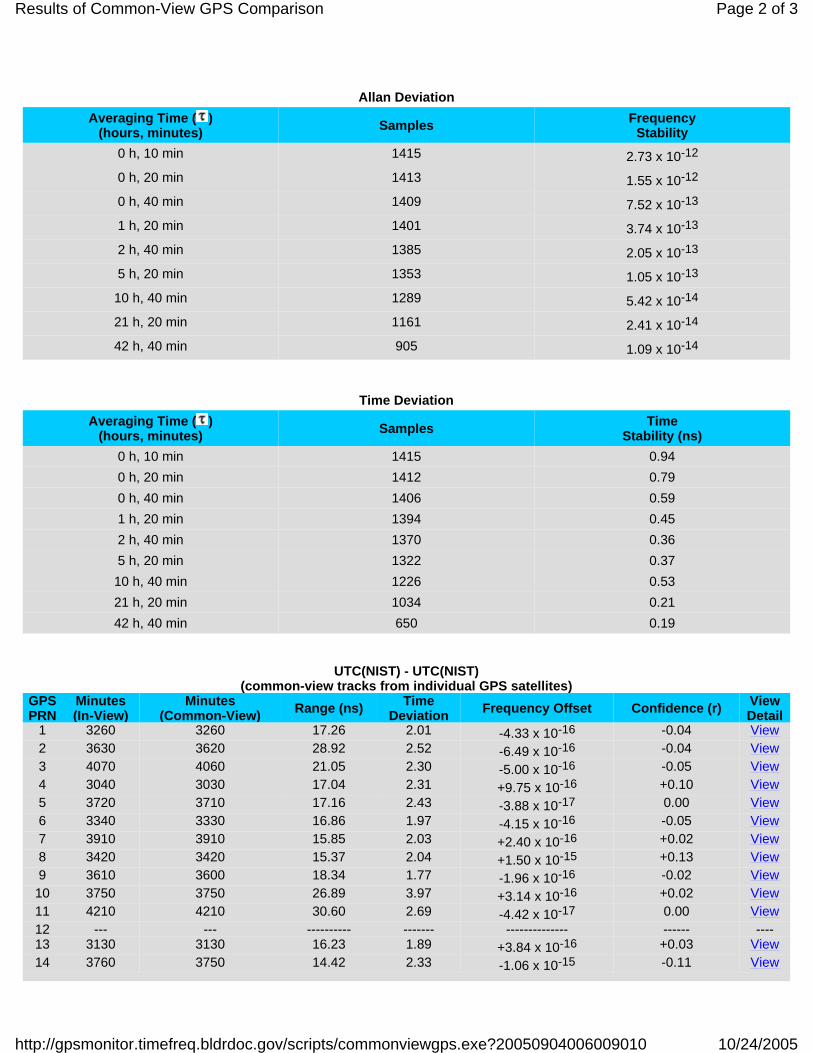
Allan DeviationAveraging Time ( )
(hours, minutes) Samples Frequency Stability
0 h, 10 min 1415 2.73 x 10⁻¹² 0 h, 20 min 1413 1.55 x 10⁻¹² 0 h, 40 min 1409 7.52 x 10⁻¹³ 1 h, 20 min 1401 3.74 x 10⁻¹³ 2 h, 40 min 1385 2.05 x 10⁻¹³ 5 h, 20 min 1353 1.05 x 10⁻¹³ 10 h, 40 min 1289 5.42 x 10⁻¹⁴ 21 h, 20 min 1161 2.41 x 10⁻¹⁴ 42 h, 40 min 905 1.09 x 10⁻¹⁴
Time DeviationAveraging Time ( )
(hours, minutes) Samples Time Stability (ns)
0 h, 10 min 1415 0.940 h, 20 min 1412 0.790 h, 40 min 1406 0.591 h, 20 min 1394 0.452 h, 40 min 1370 0.365 h, 20 min 1322 0.3710 h, 40 min 1226 0.5321 h, 20 min 1034 0.2142 h, 40 min 650 0.19
UTC(NIST) - UTC(NIST) (common-view tracks from individual GPS satellites)
GPS PRN
Minutes (In-View)
Minutes (Common-View) Range (ns) Time
Deviation Frequency Offset Confidence (r) View Detail
1 3260 3260 17.26 2.01 -4.33 x 10⁻¹⁶ -0.04 View2 3630 3620 28.92 2.52 -6.49 x 10⁻¹⁶ -0.04 View3 4070 4060 21.05 2.30 -5.00 x 10⁻¹⁶ -0.05 View4 3040 3030 17.04 2.31 +9.75 x 10⁻¹⁶ +0.10 View5 3720 3710 17.16 2.43 -3.88 x 10⁻¹⁷ 0.00 View6 3340 3330 16.86 1.97 -4.15 x 10⁻¹⁶ -0.05 View7 3910 3910 15.85 2.03 +2.40 x 10⁻¹⁶ +0.02 View8 3420 3420 15.37 2.04 +1.50 x 10⁻¹⁵ +0.13 View9 3610 3600 18.34 1.77 -1.96 x 10⁻¹⁶ -0.02 View10 3750 3750 26.89 3.97 +3.14 x 10⁻¹⁶ +0.02 View11 4210 4210 30.60 2.69 -4.42 x 10⁻¹⁷ 0.00 View12 --- --- ---------- ------- -------------- ------ ----13 3130 3130 16.23 1.89 +3.84 x 10⁻¹⁶ +0.03 View14 3760 3750 14.42 2.33 -1.06 x 10⁻¹⁵ -0.11 View
Page 2 of 3Results of Common-View GPS Comparison
10/24/2005http://gpsmonitor.timefreq.bldrdoc.gov/scripts/commonviewgps.exe?20050904006009010

15 3530 3530 18.73 2.24 -1.16 x 10⁻¹⁵ -0.11 View16 3860 3830 19.09 2.35 -3.61 x 10⁻¹⁶ -0.03 View17 --- --- ---------- ------- -------------- ------ ----18 3660 3660 13.72 1.75 -2.66 x 10⁻¹⁶ -0.03 View19 3480 3460 36.29 3.26 -1.30 x 10⁻¹⁶ -0.01 View20 3280 3280 32.34 3.53 +9.42 x 10⁻¹⁶ +0.06 View21 3880 3880 16.70 1.98 -1.07 x 10⁻¹⁵ -0.12 View22 3610 3600 12.04 1.39 -1.78 x 10⁻¹⁶ -0.02 View23 3470 3470 16.67 1.93 -1.06 x 10⁻¹⁶ -0.01 View24 4110 4100 28.83 3.24 -2.39 x 10⁻¹⁶ -0.01 View25 3280 3280 20.45 2.41 -3.83 x 10⁻¹⁷ 0.00 View26 3850 3850 21.26 1.95 -1.15 x 10⁻¹⁵ -0.10 View27 3750 3750 30.70 2.30 -7.93 x 10⁻¹⁶ -0.07 View28 3770 3770 14.12 2.16 +1.17 x 10⁻¹⁵ +0.11 View29 4300 4300 16.27 2.19 -2.47 x 10⁻¹⁷ 0.00 View30 3970 3970 18.87 2.54 -6.74 x 10⁻¹⁶ -0.05 View31 --- --- ---------- ------- -------------- ------ ----32 --- --- ---------- ------- -------------- ------ ----
Legend
GPS PRN The unique pseudo random noise (PRN) code (1 to 32) used to identify each satellite. If no satellite is assigned to a given PRN code, then no data are shown.
Minutes (In-View)
The number of minutes when the satellite was visible at laboratory 1. During this period, the time difference between the satellite clock and the laboratory reference is measured every second, and 10 minute averages are stored. Since data is recorded in 10 minute segments, the values are even multiples of 10 minutes.
Minutes (Common-View)
The number of minutes when the satellite was visible at both to both receivers involved in the common-view comparison.
Range The difference between the maximum and minimum time offset values (nanoseconds).
Time Deviation
The time deviation (TDEV) of the 10-minute averages (nanoseconds).
Frequency Offset
The estimated frequency offset of laboratory 1 relative to laboratory 2 based on a common-view observation of the satellite. This estimate is obtained by fitting a least squares line to all of the recorded data.
Confidence Level (r)
The confidence level of the estimated frequency offset. The confidence level is the correlation coefficient (r) of the least squares line fitted to the data.
View Track
Clicking on the View link displays a common-view track from the selected satellite. The number of previous days shown equals the number of previous days shown on this page, up to a maximum of 30 days.
Page 3 of 3Results of Common-View GPS Comparison
10/24/2005http://gpsmonitor.timefreq.bldrdoc.gov/scripts/commonviewgps.exe?20050904006009010

Laboratory 1 / Identification Number National Institute of Standards and Technology / 009 Reference Source UTC(NIST) Laboratory 2 / Identification Number National Institute of Standards and Technology / 006 Reference Source UTC(NIST) End Date / Length of Calibration 2005-09-04 / 10 d
Main Plot and Statistics Next Date Last Date
Mean Time Offset (ns) Range (ns) Frequency Offset Confidence (r) ADEV at 1 day TDEV at 1 day
-48.69 0.58 -1.91 x 10⁻¹⁶ -0.31 1.78 x 10⁻¹⁵ 0.09 ns
One Day Averages (LAB 1 - LAB 2)
Point Date MJD Value (ns)
1 2005-08-26 53608 -48.75
2 2005-08-27 53609 -48.64
Page 1 of 2NIST Global Positioning System (GPS) Common-View Results
10/24/2005http://gpsmonitor.timefreq.bldrdoc.gov/scripts/commonview-hourtable.exe?20050904006009010D
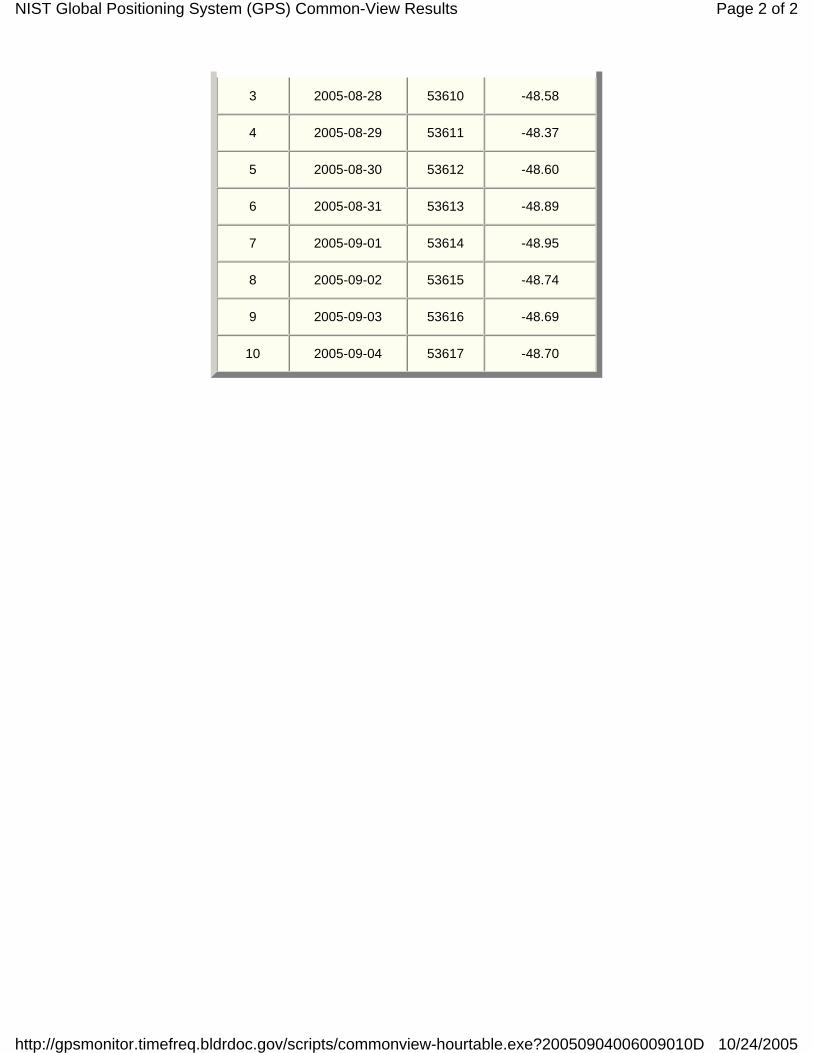
3 2005-08-28 53610 -48.58
4 2005-08-29 53611 -48.37
5 2005-08-30 53612 -48.60
6 2005-08-31 53613 -48.89
7 2005-09-01 53614 -48.95
8 2005-09-02 53615 -48.74
9 2005-09-03 53616 -48.69
10 2005-09-04 53617 -48.70
Page 2 of 2NIST Global Positioning System (GPS) Common-View Results
10/24/2005http://gpsmonitor.timefreq.bldrdoc.gov/scripts/commonview-hourtable.exe?20050904006009010D