reflections of a value investor in africa
TRANSCRIPT

REFLECTIONS OF A VALUE
INVESTOR IN AFRICA
Grant‟s Fall Conference: 19 October 2010

1
Africa Today – Attractive Investment Opportunity
• Favorable demographic trends.
• Improved public finances, structurally lower
inflation and higher savings from commodity
windfall.
• Improving rule of law, freedom of press,
independent judiciary, and business
environment.
• Africa trade with China has grown 10X from $10
billion in 2000 to over $100 billion in 2010.
• If Africa grows to reach Asia’s current GDP
discount to Europe, it will double (see figure).
In addition, the relative gap between emerging
markets and Europe should close.
Strategic Advantages
Source: Angus Maddison, The World Economy: Historical Statistics (OECD)
0%
20%
40%
60%
80%
100%
120%
1000 1500 1870 1913 1950 1973 2001 2010
Africa
Asia (ex Japan)
GDP per Capita, % of European Average
2
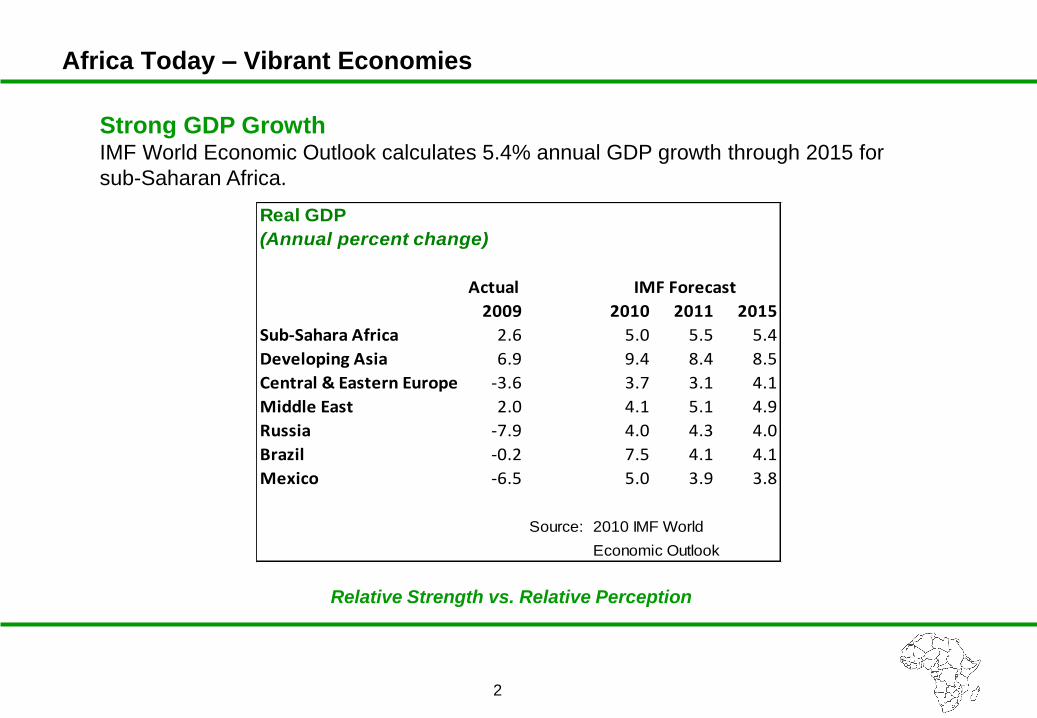
Strong GDP Growth IMF World Economic Outlook calculates 5.4% annual GDP growth through 2015 for
sub-Saharan Africa.
Relative Strength vs. Relative Perception
Africa Today – Vibrant Economies
Real GDP
(Annual percent change)
Actual
2009 2010 2011 2015
Sub-Sahara Africa 2.6 5.0 5.5 5.4
Developing Asia 6.9 9.4 8.4 8.5
Central & Eastern Europe -3.6 3.7 3.1 4.1
Middle East 2.0 4.1 5.1 4.9
Russia -7.9 4.0 4.3 4.0
Brazil -0.2 7.5 4.1 4.1
Mexico -6.5 5.0 3.9 3.8
Source: 2010 IMF World
Economic Outlook
IMF Forecast

3
Africa Today – Compelling Performance
Positive GDP Growth
• 11 of 25 fastest growing
economies in the last ten years
located in Africa.
• 12 of 25 fastest growing
economies in the next five years
forecast by IMF located in Africa.
Cumulative Economic Growth
Rank Country Historic Rank Country Forecast
1 Equatorial Guinea 324% 1 Liberia 68%
2 Azerbaijan 262% 2 Turkmenistan 59%
3 Turkmenistan 248% 3 China 58%
4 Qatar 206% 4 Mongolia 56%
5 Angola 190% 5 Ghana 52%
6 Myanmar 164% 6 Qatar 48%
7 China 157% 7 Timor-Leste 45%
8 Sierra Leone 147% 8 Ethiopia 44%
9 Bhutan 129% 9 India 43%
10 Nigeria 119% 10 Botswana 43%
11 Chad 113% 11 Mauritania 43%
12 Armenia 109% 12 Angola 41%
13 Mozambique 108% 13 Tanzania 40%
14 Ethiopia 108% 14 DRC 39%
15 Cambodia 107% 15 Uganda 38%
16 Uganda 105% 16 Niger 38%
17 Tajikistan 104% 17 Libya 38%
18 Kazakhstan 104% 18 Bhutan 37%
19 India 98% 19 Uzbekistan 37%
20 Vietnam 97% 20 Vietnam 36%
21 Rwanda 94% 21 Djibouti 35%
22 Sudan 92% 22 Bangladesh 34%
23 Tanzania 92% 23 Mozambique 34%
24 Uzbekistan 91% 24 Panama 34%
25 Belarus 90% 25 Cambodia 34%
Source: IMF

• Enormous latent demand exists for services readily available on other continents
but are in short supply in Africa. - Commercial banking, consumer finance, property and casualty insurance, life insurance, telephony, retail shopping
- Like emerging middle classes everywhere, Africans want these services and pent-up demand guarantees growth
• The increased exploitation of Africa‟s resources promises great profit for
investors willing to finance their entry into streams of global commerce.
• Investors earn high returns on capital because the continent is starved of capital.
• A continental portfolio provides an element of safety as the whole is more stable
than its parts.
Value Investing Works in Africa – Predictable Earnings & Cheap Assets
4

5
Deep Value Public Equity
• One of the most profitable property and casualty
insurance companies in Ghana, PE approximately
4X, EPS growth 40%.
• Extremely conservative accounting: positive mark-
market changes in equity portfolio carried on
balance sheet only, not in income statement (no
impact on earnings).
• Initial investment in head office building still on the
books at early 1970s historical cost.
• Great management: never incurred an underwriting
loss in 75 year history.
• Portion of earnings in US$, providing a natural
currency hedge (CEDI under extreme pressure with
all emerging market currencies in late 90s).
• Effective net interest margin 40% (effective
borrowing rate was 0%, local government bond
interest rates approximately 40%).
• Invested gradually during calendar year 1997.
• 1400% US$ return over 9 years, realized in 2005.
Enterprise Insurance – Case Study

6
Ashanti Goldfields – Case Study
Distressed Debt
• Gold price spiked from $255 to $330 in Sep-Oct 1999.
• Ashanti Goldfield’s hedge book threatened insolvency,
shares and debt collapsed in price.
• Total debt equaled = $650 million, while gold reserves =
25+ million ounces. Hedge book liability = $400+ million.
• EV/reserves = $58, peer average above $180.
• Bonds acquired Q2 2000 at average of $65, 30%+ YTM.
• Held numerous meetings with management, presented
plan for asset sale to board of directors. Robert Knapp
joins Ad Hoc creditors committee.
• Bonds paid at par + accrued interest Summer 2002.
Turnaround
• Following sale of assets, refinancing of convertible notes,
and increase in operating cash flow, shares did not
appreciate.
• Equity acquired in Autumn 2001 below $4.00.
• AngloGold announced takeover offer in August 2003,
exited investment summer 2003 above $8.00.

7
Uramin Inc – Case Study
Private Equity
• Uranium exploration and development company with
Trekkopje project in Namibia.
• Low grade, shallow deposit drilled extensively but
mothballed in 1980s.
• Lead investor in July 2005 $30 million financing
round, at $0.75 per share + warrants, pre-money
valuation = $60 million.
• Francis Daniels joined board as part of financing.
• Shares listed in April 2006 on London AIM market at
$1.20 per share. Subsequently listed in Toronto,
market capitalization exceeded $1 billion early 2007.
• Uramin acquired by Areva at $7.75 per share in
August 2007 at a valuation of $1.9 billion.
• Net return on private investment round approximately
10X in approximately two years.

8
Turnaround and Growth Equity
• Largest consumer finance company in South Africa,
EV $2.9 billion, ROE 40+%, PE 15X, P/B 6X, Dividend
Yield 6.2%.
• After early microlending optimism in late 90s, sector
collapsed and competitors, Sambou and Unifer,
became insolvent.
• ABL shares declined from over ZAR 30 in June 1998
to below ZAR 5 in February 2002.
• After noting that ABL was borrowing long (5+ years)
and lending short, initiated investment buying Senior
notes yielding 14% and equity in range of ZAR 7 to 5
throughout 2002.
• ABL bought Sambou loan book out of liquidation,
retrenched operations and improved credit
assessment.
• In ensuing four years, shares appreciated 500% and
paid out ZAR 5.50 in dividends per share.
• US$ Return over 900% during the period.
• Still a compelling opportunity in 2010: 14X PE, 2X
book, 15% ROE, 5X dividend yield.
African Bank Investments – Case Study

“Politics is rough in West Africa. Every party attracts its fringe of hooligans,
unimportant numerically, but highly important tactically. They become bodyguards;
they rough up party opponents and intimidate waverers. In areas where chiefs are
still powerful, their police do the same. To launch a new party in somebody else’s area
is a formidable exercise.”
- W. Arthur Lewis, Politics in West Africa, p.17 (George Allen & Unwin, 1965).
Acid Test of Predictability – Zimbabwe Politics and Economics 2000 – 2009
“…they gullibly imagined that to summon the people to political life was enough to attach
them to their cause; and that, if they gave the people rights but no advantages, it was
enough to make the Republic popular. They forgot that their predecessors at the
same time that they gave every peasant a vote did away with tithes, abolished the
corvee and other seigniorial privileges, and divided the nobles‟ land among their
former serfs….to commit acts of violent injustice, it is not enough for a government to
desire them, or even to have the ability to do them; it is essential that the mores,
ideas, and passions of the time lend themselves to the enterprise.”
- Alexis de Tocqueville, Recollections, p.122,123 (Anchor Books, 1971).
9

• Destruction of the
economic base - Collapse of agriculture and
manufacturing.
- Decline in forex earnings.
- Tax revenue decimated.
• Continued rise in inflation - Central bank purchase of govt debt
to increase.
- Hyperinflation possible.
• There would be limits to
state power - Govt could not seize forex earned
outside its borders.
• Monetary constraints had to come to bear. - Current account deficit since 1980 funded by foreign aid.
- Reliance on on treasury bill and medium term note financing.
- Reliance on the reserve bank buying those bonds.
• Land reform had to occur. - Mugabe faced stiff opposition in 2000 and Zimbabweans wanted
change .
- Land a source of historical conflict.
- Mugabe had to nullify the threat of the MDC support in the rural
areas.
• The goverment would go to any lengths to get
forex. - State-controlled sector would need access to forex at priviledged
rates.
- The private sector was held in contempt and could be fleeced.
Politics & Economic Logic Provided Framework for Investment
Anticipated
10

11
Collapsing Zimbabwe – Could You Make Money?
Source: IMF Source: IMF
556 Billion % !

12
Zimbabwe – Unsustainable Monetary Environment
Source: IMF Source: IMF

Crystallized Investment Thesis
$$
$$
TA Mkt Cap „00 –‟09:
US$9M to US$96M
13

14
Changing Property and Casualty Asset Allocation in Zimbabwe and Botswana
Source: Zimnat Lion and BIC annual reports
0%10%20%30%40%50%60%70%80%90%
100%
2000 2001 2002 2003 2004 2005 2006 2007 2008
Financial Assets held in "Hard" Assets
Zimnat Lion BIC

15
Companies With Least Taxed Forex Performed Best
Source: Zimbabwe Stock Exchange, BARDNET , Anibok
“Free” Forex
was king
Company Industry
CAGR
'00 - '08
CAGR
'00 - '09
CAGR
'00 - Current
Ex-Zim Diversified
Seedco Agriculture -71.4% 31.0% 28.3%
TA Holdings Hotels and Insurance -15.0% 34.2% 19.8%
Banc ABC Banking -44.8% 6.9% 8.8%
Innscor Africa Diversified Conglomerate -21.3% 21.2% 16.7%
Average -38.1% 23.3% 18.4%
"Free" Exporters
Zimplats Platinum Mining 40.4% 42.4% 40.6%
"Controlled" Exporters
Hippo Valley Sugar -78.0% 17.3% 17.6%
Aico Agriculture -46.1% 17.3% 17.6%
Riozim Gold Mining % Nickel -71.0% 18.7% 13.7%
Colcom Meat Processor -43.4% 20.9% 23.5%
Average -59.6% 18.5% 18.1%
Financial Services
Banc ABC Banking -44.8% 6.9% 8.8%
Barclays Banking -60.8% -8.5% -9.3%
CBZ Bank Banking -49.5% 14.0% 10.1%
Zimre Holdings Insurance -48.4% -2.1% -2.5%
Average -50.9% 2.6% 1.8%
100% Zim assets
DELTA Beverages Beverages -36.5% 12.1% 11.9%
OK Zimbabwe FMCG Retail -50.2% 38.1% 37.3%
AFDIS Distillery -64.0% 20.9% 15.5%
EDGARS Clothing Retail -71.6% -1.0% -1.4%
National Foods Food Processor -24.0% 47.9% 37.7%
Kingdom Meikles Hotels and Banking -78.7% -4.3% -4.4%
PG Industries Hardware Retail -59.9% 35.2% 19.5%
British-American Tobacco Tobacco -65.5% 2.7% 1.4%
Econet Wireless Telecom -36.9% 12.4% 11.2%
Average -54.1% 18.2% 14.3%

Public Equity
• Zimplats is a PGM producer on the Great Dyke in
Zimbabwe with a listing on the ASX(symbol : ZIM AU).
JSE listed Impala Platinum (IMP SJ) has an 87% interest
in Zimplats. The company has a market cap of US$1.2
billion.
• At US$11.32 per share, Zimplats trades at an EV/4E
Reserve oz of US$57/oz against the weighted average of
US$193/oz for the platinum industry.
• The EV/4E Resource oz is US$6/oz against US$33/oz
for the platinum industry.
• Cash costs per 4E oz are US$325/oz versus the industry
average of US$948/oz.
• Zimbabwean PGM mines have depths of 25meters to
30meters from surface. The shallowest mines in South
Africa have depths of 100meters whilst the deepest
mines can be up to 2,200meters.
• Annual revenues to June10 was US$404 million and net
income was US$122 million.
• Compelling investment opportunity that is cheaper than
SA based PGM developers.
Zimplats – Investment Idea
16
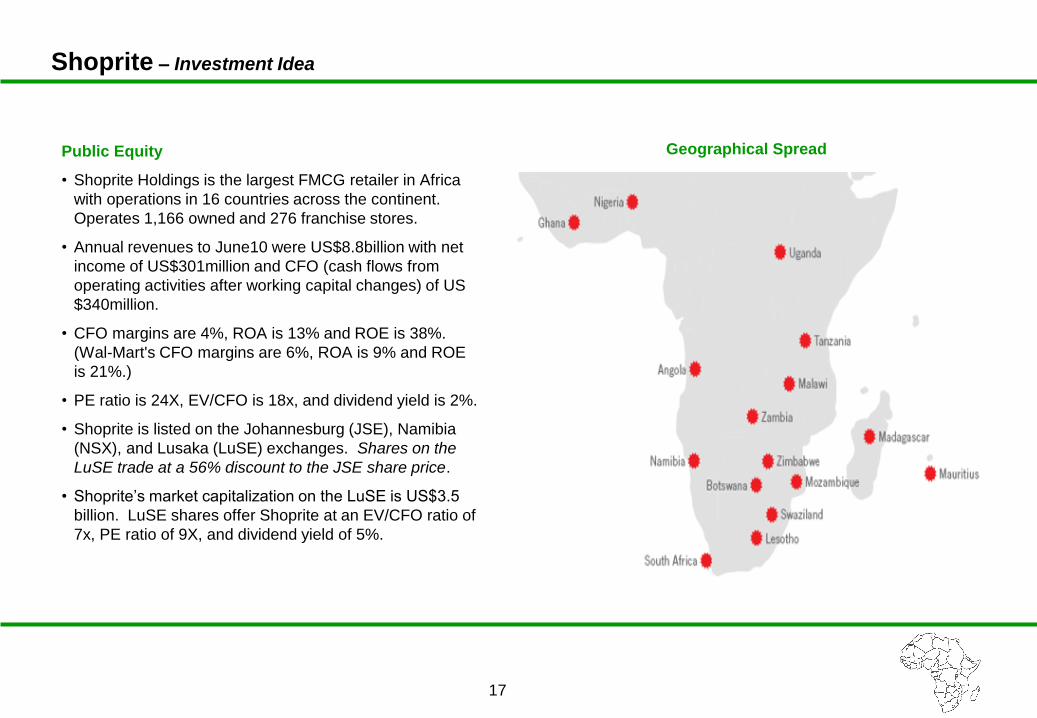
Shoprite – Investment Idea
Geographical Spread
17
Public Equity
• Shoprite Holdings is the largest FMCG retailer in Africa
with operations in 16 countries across the continent.
Operates 1,166 owned and 276 franchise stores.
• Annual revenues to June10 were US$8.8billion with net
income of US$301million and CFO (cash flows from
operating activities after working capital changes) of US
$340million.
• CFO margins are 4%, ROA is 13% and ROE is 38%.
(Wal-Mart's CFO margins are 6%, ROA is 9% and ROE
is 21%.)
• PE ratio is 24X, EV/CFO is 18x, and dividend yield is 2%.
• Shoprite is listed on the Johannesburg (JSE), Namibia
(NSX), and Lusaka (LuSE) exchanges. Shares on the
LuSE trade at a 56% discount to the JSE share price.
• Shoprite’s market capitalization on the LuSE is US$3.5
billion. LuSE shares offer Shoprite at an EV/CFO ratio of
7x, PE ratio of 9X, and dividend yield of 5%.

18
Sonatel – Investment Idea
Public Equity
• 2nd most profitable telecom company in Africa. EBITDA
margin of 56%, Net Margin of 31% and ROE of 38%.
• Current market cap is US$2.9 billion: P/E is 8.3x, 8.8%
dividend yield, and estimated 2010 P/E 7.8X.
• EBITDA expected to reach US$700 million in 2010, an
67% increase from 2005 and a 309% increase from
2000.
• Strong balance sheet with low debt level.
• Total subscribers reached 10.1 million in June 2010, a
645% increase from 2004 and a 2258% increase from
2000.
• 42% France Telecom ownership, high dividend payout
ratio.

• Africa is a legitimate theater of predictable and profitable investment.
- There are rapidly growing companies in modernizing parts of Africa available at classic value criteria.
• Government paper is riskier than private paper. - African equities have proved more reliable than government promises.
- Zimbabwean foreign exchange earning equities differentially preserved wealth.
• The withdrawal of African states from commerce has created value. - When state-owned enterprises get into the hands of capable private operators they are often very profitable.
• Macro-time is much slower than micro-time. - Our timing on Zimbabwe’s hyper-inflation logic to play out was off by a few years.
- Eventually it happened and the market rewarded TA for the foresight.
Lessons
19


21
CONTACT INFORMATION
Francis Daniels
Anibok Investment Research Ltd
1 Melrose Arch, Suite 3
Melrose Boulevard
Johannesburg 2196
South Africa
+27-11-684-1528
Robert Knapp
Ironsides Partners LLC
100 Summer Street, Suite 2705
Boston, MA 02110
USA
+1-617-449-3127

22
DISCLAIMER
The information contained in these slides has been prepared by Africa Opportunity Partners Limited ("the Company"). The information in these slides is subject to updating, completion, revision, further verification and amendment without notice.
These slides do not constitute an offer or a solicitation of an offer to buy a security. These slides are being supplied to you solely for your information and may not be reproduced, re-distributed or passed to any other person or published in whole or in part for any purpose. By accepting receipt of this document, you agree to be bound by the limitations and restrictions set out above.
The examples of specific investments described herein should not be considered a recommendation to buy or sell any specific securities. There can be no assurance that such investments will remain in the portfolio of the Africa Opportunity Fund (the Fund) managed by the Company. The investments identified in this presentation do not represent the Fund’s entire portfolio. It should not be assumed that any of the investments identified in this presentation will be profitable in the future or will equal the performance of the investments identified in these slides.
While all of the facts and observations described herein are believed to be accurate, the Company makes no express warranty as to the completeness or accuracy, nor can it accept responsibility for errors, appearing herein.
Any projections, market outlooks or estimates in this presentation are forward-looking statements and are based upon assumptions. Outlooks or assumptions should not be construed to be indicative of the actual events which occur.