reflections what has been achieved? - consumer … · reflections what has been achieved? ......
TRANSCRIPT
Reflections
What has been achieved?
Diane McCrea
Wales Committee Meeting in Public
22 September 2015

Why CCWater?
• Set up by Water Act 2003
• Inaugurated 1st October 2005
• Jointly sponsored by Defra and WG
• Monopoly industry
What was different?
• Consistent approach to our work across
England and Wales
• Root cause analysis of complaints
• Evidence based policy
• Added value – comparisons across
companies to drive best practice

In Wales
• Emerging policy and strategy
statements from Welsh Government
• Early emphasis on sewer flooding
problems
• Spotlight on affordability
• Work in partnership, ‘critical friend’

0
100
200
300
000s of
written complaints
Robust on complaints
2007 2000
Year
2014

0
20
000s of
written complaints
CCWater pressure/negotiations
Robust on complaints in Wales
2007 2002
Year
2014

Written complaints 2014-15

Written Complaints
2014-15
• Dŵr Cymru Welsh Water fell by nearly 19% –
compared to an overall reduction of 13.4 per cent
across England and Wales.
• Dee Valley Water plunged for the fourth successive
year, this time by over 28%.
• Severn Trent Water – serving a small number of
customers in Wales - reported a reduction of more
than 22%.

Rebates to customers
• Over the past 10 years more than
£2.2m returned to customers in Wales
through rebates as a result of
complaints
• £1.4m of this consists of surface water
rebates
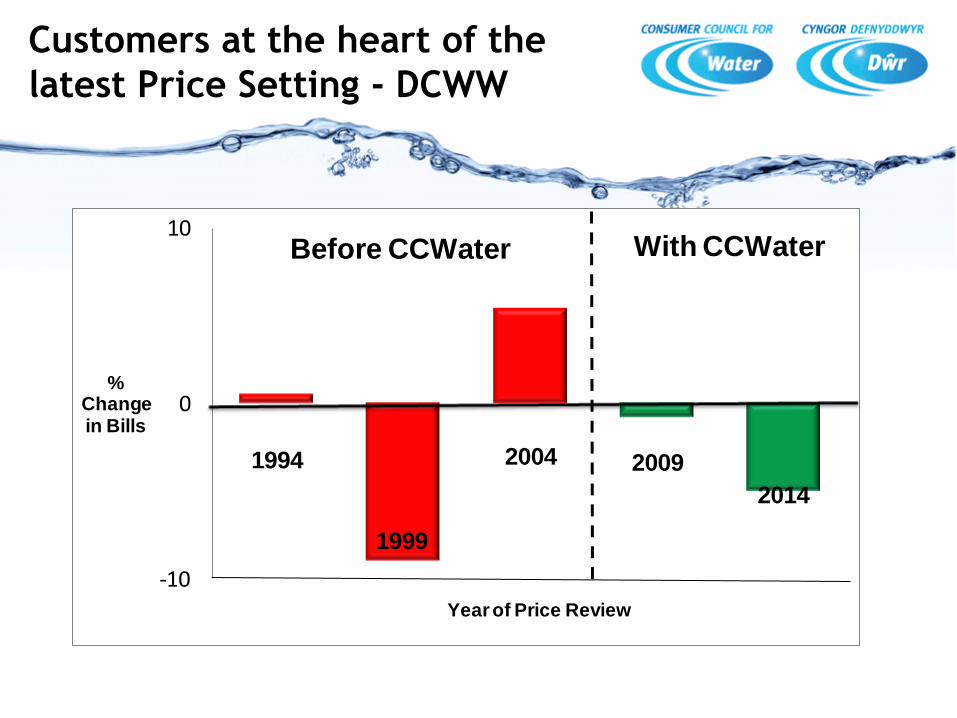
Customers at the heart of the
latest Price Setting - DCWW
-10
0
10With CCWater
1994 2009
1999
2004
2014
% Change in Bills
Year of Price Review
Before CCWater

Top ten reflections
• Recognised as the effective water
consumer representative body
• Secured a seat for customers at the
negotiating table
• Reductions in customers’ bills
• £2.2m returned in rebates
• More offerings on affordability and
assistance schemes

Top ten reflections
• Improved customer services
• Focussed on local issues
• Improved industry governance,
transparency and accountability
• Mixed use property disconnections
stopped
• Improvement in environmental
performance

Future challenges in Wales
• Continue to ensure companies deliver on
performance targets and specified ODIs
• Focus on affordability – delivering help to
those in most need through social tariffs
• To reduce the number of complaints about
water quality
• Monitoring the implementation of Silk
Commission Recommendations

Future challenges in Wales
• Monitor market reform in England for
business customers
• Ensure that non-eligible customers in Wales
get benefits from their supplier – better
customer service, value for money, ‘extra
attention’ to compare with any benefits in
England
Continue to work for consumers –
still more to do
© Dee Valley Water - 2015
Meeting the needs of our customers C.E.O. - Ian Plenderleith Head of Customer Services Wendy Jones Customer Accounts Mgr. Sue Jones
© Dee Valley Water - 2015
Company Performance 2010-2015
• Successfully delivered the capital programme approved by Ofwat for the
five year period to March 2015. • This was accomplished with a total spend of £34.1m – compared to a
capital programme allowance of £34m. Performance highlights: • CC Water Report recognition reduction in complaints and customer
service overall • Interruptions to supply – 0.17hrs per property served, top half in the
industry • Vulnerable customers -third highest penetration of WaterSure tariff in the
industry Performance lowlights: • Number of bursts up in 2014/15 post a continuous downward trend • Water Quality dominated by manganese and discolouration 2010-2013,
improving trend 2014 continuing into current Amp.

© Dee Valley Water - 2015
2015-2020 Meeting the needs of our customers
We are committed to: Provide excellent water quality
Minimise our environmental impact
Provide reliable & high quality customer
service
Provide a value for money service
© Dee Valley Water - 2015
2015-2020 Meeting the needs of our customers
• Ofwat approved 97% of the Business Plan submitted for the period 2015-2020.
• Ambitious plans to improve our supply network, systems and processes during the next five years.

© Dee Valley Water - 2015
Provide excellent water quality
• YTD Mean zonal compliance 99.95 • YTD Discolouration contacts reduction 413 to 267
year on year • Cleaning network exceeding our ODI target for
2015, 290km vs target 250km • Re evaluating capital investment agility in
changing priorities • Interruptions to supply YTD 0.098 on target for
ODI
© Dee Valley Water - 2015
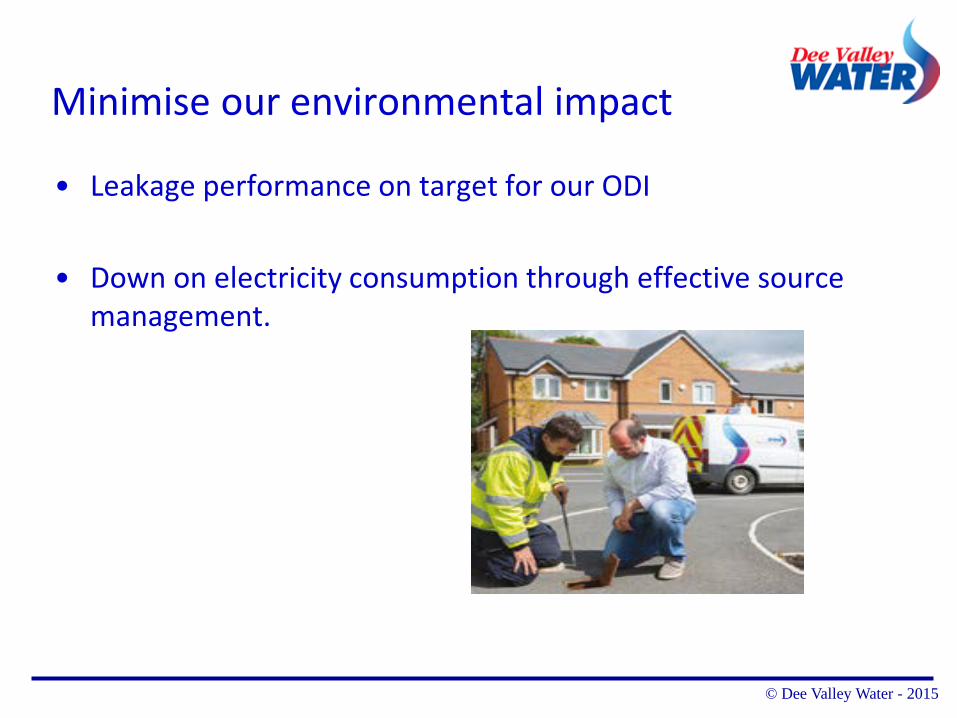
Minimise our environmental impact
• Leakage performance on target for our ODI
• Down on electricity consumption through effective source management.

© Dee Valley Water - 2015
Provide reliable & high quality customer service • SIM YTD ranked 3rd • SIM Qtr 2 scores 4th overall, 1st for billing, 10th for clean
water • Operational impact of repeated bursts in one area affecting scores.
This vulnerable area has been brought forward on our capital improvement plan to be improved no later than April 2016.
• New internal SIM improvement group set up to focus on unwanted contacts, CC Water and other research, direct customer feedback, develop internal measures of tracking to ensure alleviation of customer frustration.
© Dee Valley Water - 2015
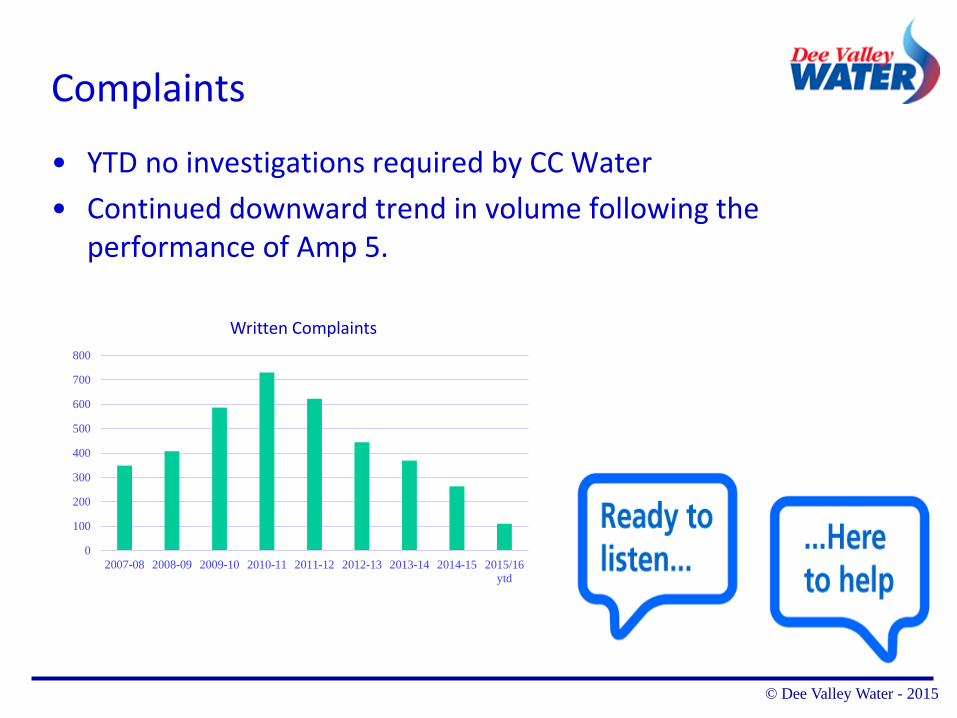
Complaints
• YTD no investigations required by CC Water • Continued downward trend in volume following the
performance of Amp 5.
0
100
200
300
400
500
600
700
800
2007-08 2008-09 2009-10 2010-11 2011-12 2012-13 2013-14 2014-15 2015/16ytd
Written Complaints

© Dee Valley Water - 2015
Provide a value for money service • Working closely with CC Water and our Customer Challenge Panel to ensure we represent the interests of our customers
• Maintaining 4th lowest bills in England & Wales • New project to introduce twice yearly billing to alleviate
estimated bills frustrations • Continue to offer payment plans, home visits & personal
advice • Social Tariff being introduced for 2016 pending support
from our customers • New web site in progress • Online Self service aspirations for Qtr 1 2016 • Staff training & development

© Dee Valley Water - 2015
Listening to the ‘voice’ of our customers
• Introduction of Rant & Rave • Currently scoring 4.5 or above.
… they helped me by reducing my money so that I
can afford to pay. Thank you
Excellent telephone manners and very helpful in solving my problem. Many thanks!
Very efficient friendly service…

© Dee Valley Water - 2015
FY14/15 Financial Highlights Underlying financial performance broadly consistent with the prior year:
Revenue:
£24.6m (+3.4%)
Adjusted profit from operations1:
£7.5m (+2.0%)
Adjusted earnings per ordinary share1:
75.3p
Full year dividend:
62.5p 0% inc Y o n Y
Net capital investment:
£5.6m AMP5: £34.1m
RCV:
£71.2m

© Dee Valley Water - 2015
Thankyou… Dee Valley – Your local friendly water company!
Performance Update
Chris Jones
Chief Executive

Water Services: 2010 - 2015
Measures 2010-’11 ‘11-’12 ‘12-’13 ‘13-’14 ‘14-’15
Safety of drinking water 99.97% 99.98% 99.98% 99.98% 99.99%
Customer contacts (per 1,000 population)
2.22 1.96 2.14 2.02 2.34
Water supply interruptions n/a 43 mins 53 mins 51 mins 23 mins
Leakage 199 ml/d 185 ml/d 184 ml/d 183 ml/d
179 ml/d
Service reservoir compliance 99.97% 99.97% 99.98% 99.95% 99.98%
✔
✔
✔
✘
✔
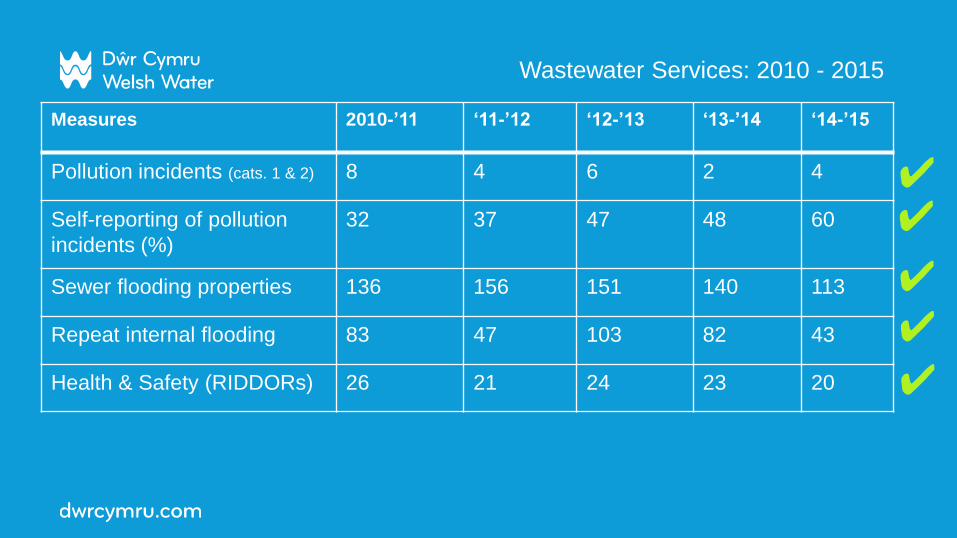
Wastewater Services: 2010 - 2015
Measures 2010-’11 ‘11-’12 ‘12-’13 ‘13-’14 ‘14-’15
Pollution incidents (cats. 1 & 2) 8 4 6 2 4
Self-reporting of pollution
incidents (%)
32 37 47 48 60
Sewer flooding properties 136 156 151 140 113
Repeat internal flooding 83 47 103 82 43
Health & Safety (RIDDORs) 26 21 24 23 20
✔ ✔
✔
✔
✔

Customer satisfaction (SIM): 2010 - 2015
60
65
70
75
80
85
2010 2011 2012 2013 2014
Methodology
changed
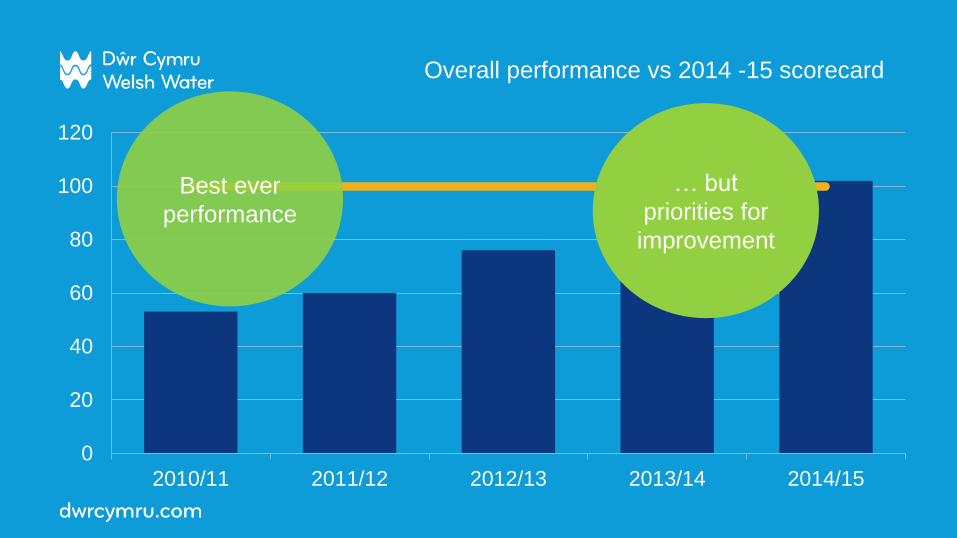
Overall performance vs 2014 -15 scorecard
0
20
40
60
80
100
120
2010/11 2011/12 2012/13 2013/14 2014/15
Best ever
performance
… but
priorities for
improvement
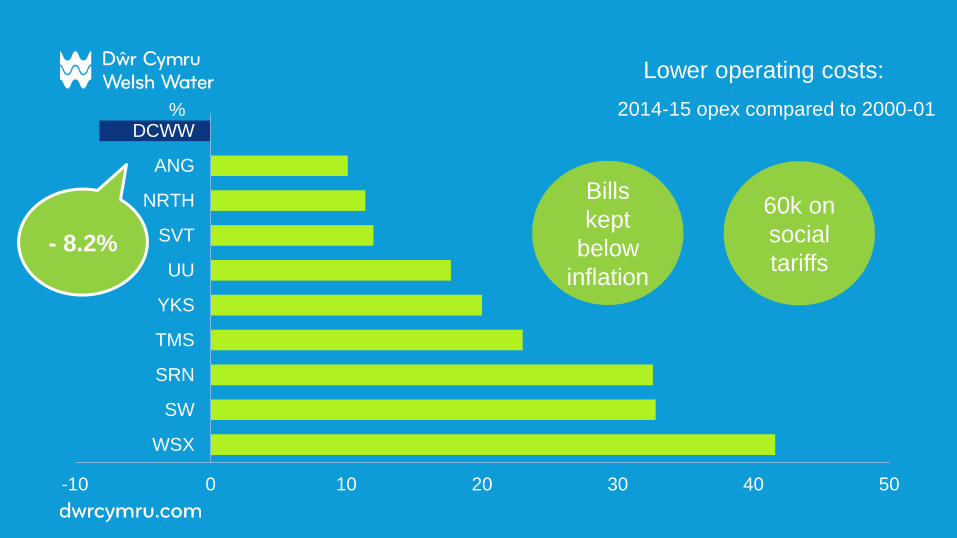
Lower operating costs:
-10 0 10 20 30 40 50
WSX
SW
SRN
TMS
YKS
UU
SVT
NRTH
ANG
DCWW%
- 8.2%
2014-15 opex compared to 2000-01
Bills
kept
below
inflation
60k on
social
tariffs

Water Services – 2014-15
Bacti
Compliance
at WTW
Service
Reservoirs
Treatment
Performance (disinfection index)
Leakage
Customer
minutes lost
More
compliments
than complaints
791 vs 682
100% 2013-14: 99.99%
99.98%
100%
179.5ml/d
23
2013-14: 99.95%
2013-14: 99.99%
2013-14: 183.7ml/d
2013-14: 51

Water Services – 2014-15: Challenges
Iron
compliance
99.41%
Taste,
appearance, odour
per 1,000
3.53
DWI
Mean zonal
compliance
99.94% 2013-14: 99.54% 2013-14: 3.36 2013-14: 99.97%

Wastewater Services – 2014-15
Pollution
incidents
Number WwTWs
failing numeric
consent
Internal sewer
flooding
112 5 43
More
compliments
than complaints
986 vs 587
Best ever
environmental
performance
2013-14: 12 2013-14: 124 2013-14: 82
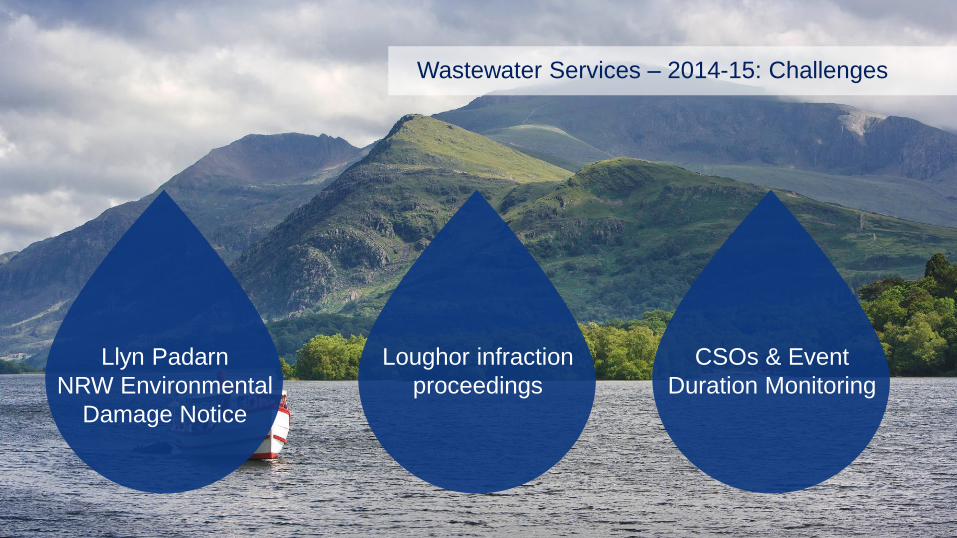
Wastewater Services – 2014-15: Challenges
Llyn Padarn
NRW Environmental
Damage Notice
Loughor infraction
proceedings
CSOs & Event
Duration Monitoring
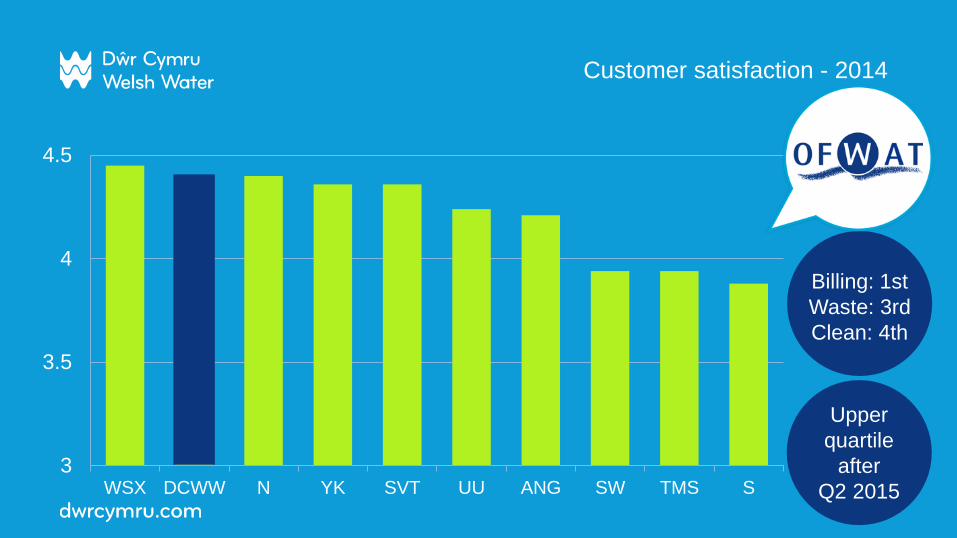
Customer satisfaction - 2014
3
3.5
4
4.5
WSX DCWW N YK SVT UU ANG SW TMS S
Billing: 1st
Waste: 3rd
Clean: 4th
Upper
quartile
after
Q2 2015

Business Plan (2015 – 2020)
Customer Price increase below inflation
Expand social tariffs
Cut water acceptability contacts
by 60%
Reduce sewer flooding by 25%
Compliance Reduce leakage by 8%
Cut pollution by 33%
Cut supply interruptions by 75%
Increase RainScape &
reduce spills
Cost £1.7 billion investment
Cut energy use on sites by 5%
Cut Opex by 18%
Cut Capital costs by 15%
Cut Retail cost by 32%

Business Plan (at 2014 - 2015 prices)
380
390
400
410
420
430
440
450
460
470
480
10/11 11/12 12/13 13/14 14/15 15/16 16/17 17/18 18/19 19/20
Average household bills 2010-2020
Water
Waste
Energy efficiency
£1.7bn investment

Delivery Plan for 2015 - 2020
Most trusted
provider of
essential services
by 2020…
… by increasing
customer trust
and
colleague pride

Measuring Customer Service - 2015
Rant & Rave
- Pilot launched in September 2015
- Over 2,000 customers targeted so far
- Average score from customer is 8.3 (from 0 to 10)
- 72% - ‘Good’ Sentiment
- 52% - Net Promoter Score
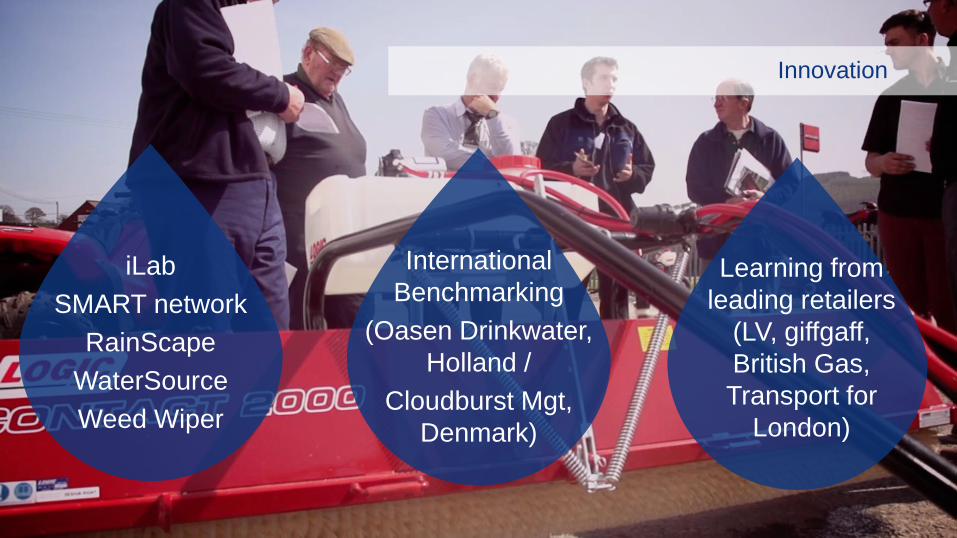
iLab
SMART network
RainScape
WaterSource
Weed Wiper
Innovation
Learning from
leading retailers
(LV, giffgaff,
British Gas,
Transport for
London)
International
Benchmarking
(Oasen Drinkwater,
Holland /
Cloudburst Mgt,
Denmark)

Drinking Water Quality in Wales
an overview
Frank White
Liaison Inspector for Wales
How does Wales compare to England?
• Public supplies
• Private supplies
• Ongoing challenges

The position today
• Public supplies
– Both Wales and England at 99.95
• as expected due to stricter lead standard becoming law.
– 0.05% of tests not meeting standards in 2014 compared to 1.6% in 1991.
• Private supplies – ongoing concern about quality and safety but some early signs of improvement.
– 7.0% of tests not meeting standards in 2014 compared to 9.6% in 2010.

The position today
Public supplies by regions England 99.95% Wales 99.95%
Declined
Declined
Declined

Overview of compliance 1990 = 99.00% : 2014 = 99.95%

Significant challenges remain
Wales public supplies still have issues, although investment e.gs, DCWW Go to Green, DVW new works at Llwyn Onn help

Dŵr Cymru Welsh Water – AMP6
Company Business plan in Dec 2013 set some challenging targets to 2020 - 99.99 % compliance for Drinking Water Quality and 2.9 per 1000 contacts for Customer Acceptability. During the price review process Ofwat challenged all companies against a number of comparative measures.
DCWW has accepted Ofwat’s Final
Determination with performance commitments set at 100%
compliance for drinking water quality and 1.23 per 1000
contacts for customer acceptability.

Investment is working (England and Wales)
Number of brown, black or orange discoloured water contacts
0
10,000
20,000
30,000
40,000
50,000
60,000
70,000
80,000
90,000
100,000
2006 2007 2008 2009 2010 2011 2012 2013 2014
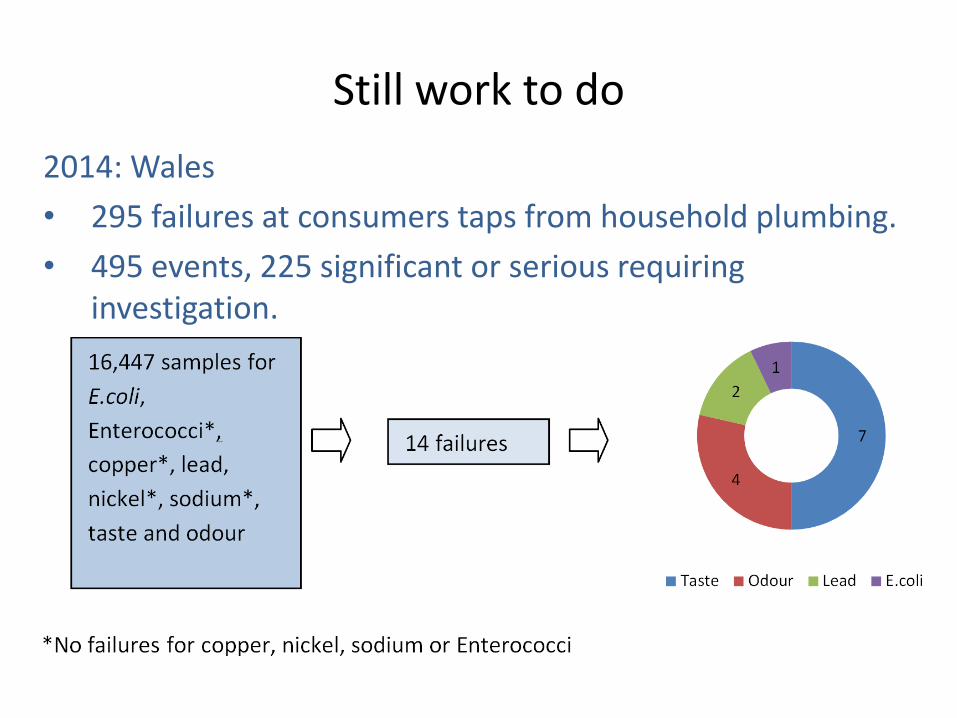
Still work to do
2014: Wales
• 295 failures at consumers taps from household plumbing.
• 495 events, 225 significant or serious requiring investigation.

DWI Audit performance !
Conclusions
• Companies have successfully invested in and modernised treatment works e.g., Cwellyn, Llwyn Onn “go to green programme” (DCWW)
• Companies have renovated or replaced over 2500km of mains in Wales
• Innovation is being used, e.g., Ice pigging, new conditioning regimes – Its not always a capital solution
• Significant challenges remain