regression analysis for business (stat 613) - mba inside · pdf fileregression analysis for...
TRANSCRIPT
Regression Analysis for Business (STAT 613) SAMPLE EXAM
Regression Analysis for Business (STAT 613) SAMPLE EXAM
� InstructionsRead these instructions carefully.
Questions 1-20 of this exam are used to place into STAT 621.Questions 1-43 are used to waive STAT completely.
This is a closed-book exam. You are allowed to use a calculator and one page (8.5 by 11 inches or A4,both sides) of handwritten notes. No use of cellular telephones or other portable electronics is permitted.
You have two hours for the exam. There are 43 questions. The computer output associated with one ormore questions should be considered an essential part of the questions. The multiple-choice questions areequally weighted; the number of correct answers determines your grade.
Throughout this exam, the word “significant” implies “statistically significant” and by “sample” we mean a simple random sample. Use 95% confidence intervals and a p-value threshold of 0.05 to determine statistical significance unless otherwise instructed. All logarithms are natural logs (that is, ln or loge)unless otherwise noted.
All categorical predictor variables have been coded according to a dummy variable coding scheme withthe reference category being the level of the variable that is last, using an alphanumeric sort.
Please note the following when filling in the answer form:
� Mark the answer form only using a pencil. Erase changes completely.
� Fill in your name and student id number on the answer form.
� Mark the “bubbles” under your name and student id number.
� Choose the one best answer by marking the item on the answer form.
When you have completed the exam, turn in the answer form and your exam with your name on it. Solutions will be posted in Canvas.
� STOPDo NOT turn the page until you are instructed to proceed.
Regression Analysis for Business (STAT 613) SAMPLE EXAM
1. The amount spent by a customer is normally distributed with mean μ = $300 and σ = $50. Theprobability that a randomly selected customer spends less than $200 is approximately
a. 0.167
b. 0.334
c. 0.050
d. 0.025
e. 0.010
2. You toss a fair coin repeatedly. Of the following, which has the highest probability of getting exactly50% heads.
a. Toss it once
b. Toss it 10 times
c. Toss it 100 times
d. Toss it 1000 times.
e. Toss it 1,000,000 times.
3. The IQs of a large population is Normally distributed with a mean of 100 and an SD of 15 points.Suppose you randomly choose 40 people from the population. What is the approximate chance thatyou get at least one person with an IQ of 130 or higher?
a. .025
b. .33
c. .36
d. .5
e. .64
4. The standard deviation in a population of incomes is σ = $20,000. To obtain a 95% confidenceinterval for μ with total width (width = upper endpoint – lower endpoint) less than $500 requires asample size of about
a. 5,000
b. 100
c. 50
d. 2,000
e. More than 25,000
Regression Analysis for Business (STAT 613) SAMPLE EXAM
5. The standard error of the mean
a. Estimates the SD of the population.
b. Increases with the size of a sample.
c. Measures the sample-to-sample standard deviation of sample means.
d. Determines the sample size needed in order to apply the central limit theorem.
e. Is the expected size of the deviation of x-bar from μ.
QUESTIONS 6–7
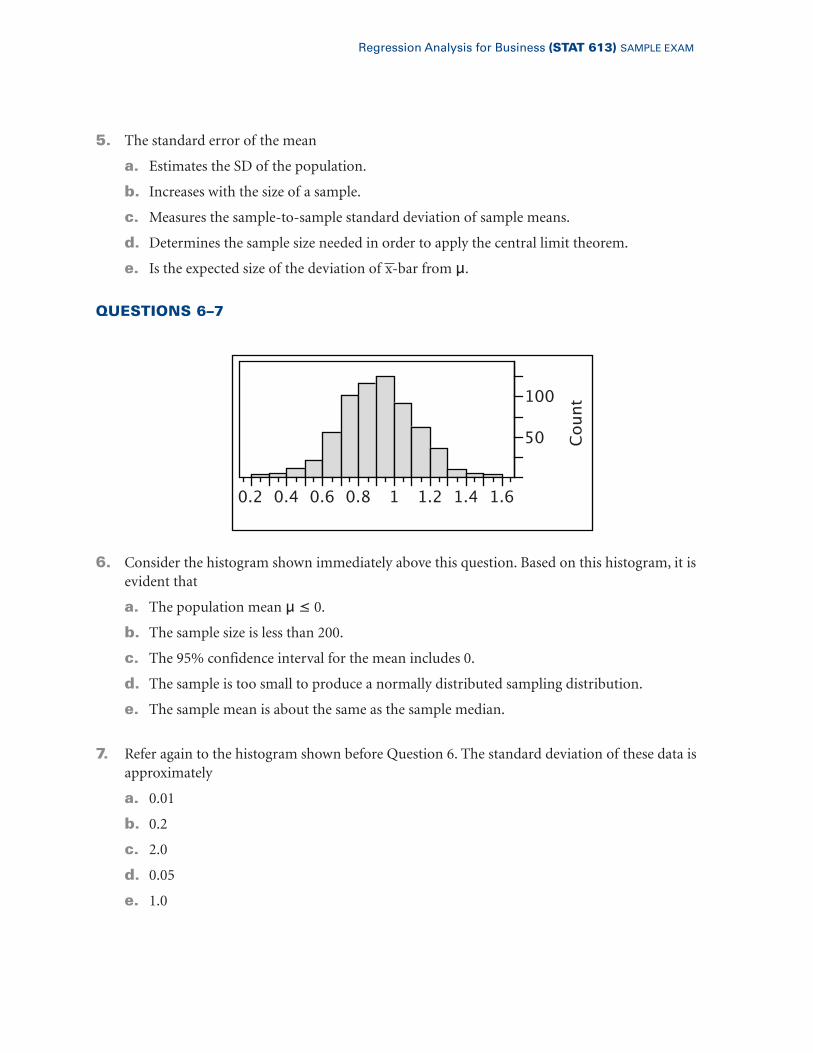
6. Consider the histogram shown immediately above this question. Based on this histogram, it isevident that
a. The population mean μ ≤ 0.b. The sample size is less than 200.
c. The 95% confidence interval for the mean includes 0.
d. The sample is too small to produce a normally distributed sampling distribution.
e. The sample mean is about the same as the sample median.
7. Refer again to the histogram shown before Question 6. The standard deviation of these data isapproximately
a. 0.01
b. 0.2
c. 2.0
d. 0.05
e. 1.0
50
100
Count
0.2 0.4 0.6 0.8 1 1.2 1.4 1.6
Regression Analysis for Business (STAT 613) SAMPLE EXAM
QUESTIONS 8–10
A retail web site gathered data about customers who bought either a camera or a phone (but notboth). Within this population, 40% of the customers bought a camera. Of those customers whobought cameras, 25% reported incomes less than $50,000. Among those who bought a mobilephone, 50% reported incomes less than $50,000.
8. These results show that the proportion of this population of customers who have incomes of atleast $50,000 is
a. 0.50
b. 0.40
c. 0.25
d. 0.60
e. 0.35
9. The web site profits $10 for each camera and $5 for each mobile phone sold. The expected value ofthe profit produced by the purchase choice of a randomly selected customer from this population is
a. $5
b. $8
c. $6
d. $7
e. $9
10. The probability that a randomly chosen customer from this population who has income above$50,000 buys a phone is
a. 0.25
b. 0.40
c. 0.50
d. 0.60
e. 0.35
Regression Analysis for Business (STAT 613) SAMPLE EXAM
QUESTIONS 11–16
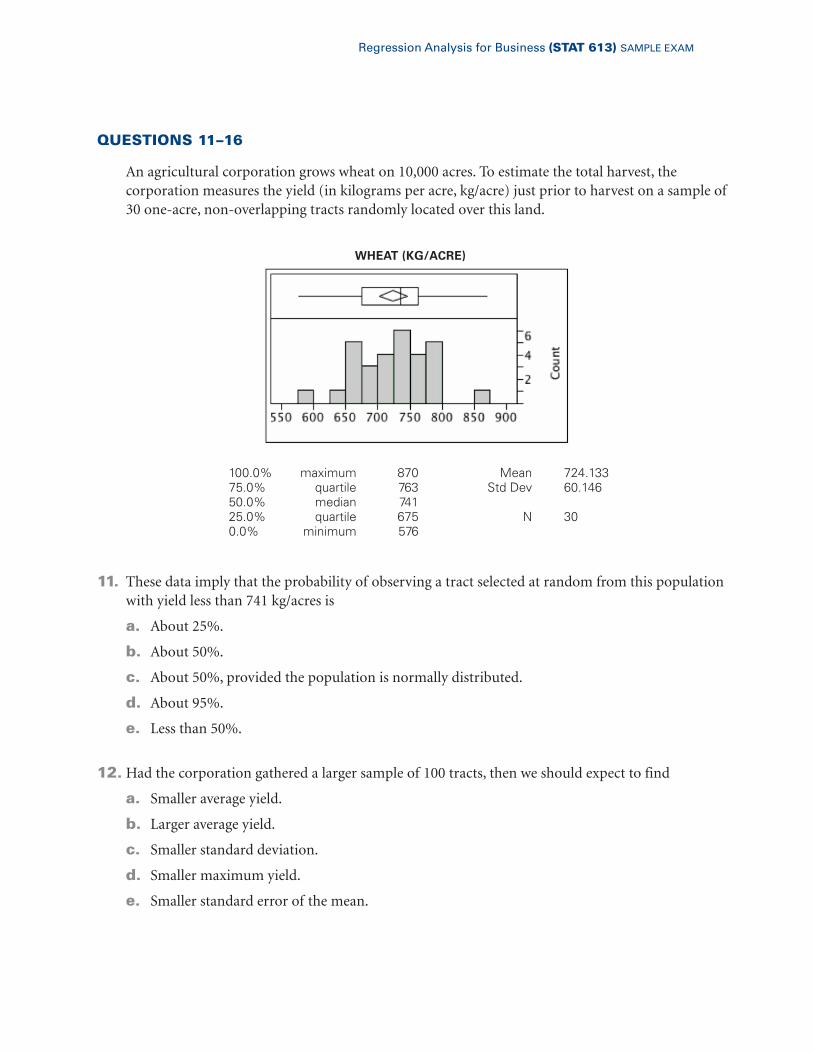
An agricultural corporation grows wheat on 10,000 acres. To estimate the total harvest, the corporation measures the yield (in kilograms per acre, kg/acre) just prior to harvest on a sample of30 one-acre, non-overlapping tracts randomly located over this land.
11. These data imply that the probability of observing a tract selected at random from this populationwith yield less than 741 kg/acres is
a. About 25%.
b. About 50%.
c. About 50%, provided the population is normally distributed.
d. About 95%.
e. Less than 50%.
12. Had the corporation gathered a larger sample of 100 tracts, then we should expect to find
a. Smaller average yield.
b. Larger average yield.
c. Smaller standard deviation.
d. Smaller maximum yield.
e. Smaller standard error of the mean.
WHEAT (KG/ACRE)
100.0% maximum 870 Mean 724.13375.0% quartile 763 Std Dev 60.14650.0% median 74125.0% quartile 675 N 300.0% minimum 576
Regression Analysis for Business (STAT 613) SAMPLE EXAM
13. Sales agreements were designed under the expectation that the average yield this corporation wouldproduce is 750 kg/acre when fully harvested. Assuming the appropriate conditions are met, thisanalysis indicates that the average yield will be
a. Statistically significantly less than expected.
b. Less than expected, but not significantly.
c. More than expected, but not significantly.
d. Statistically significantly more than expected.
e. Within 1% of the amount planners expected.
14. Do these data satisfy the conditions of a one-sample confidence interval for the mean?
a. Yes.
b. No, the sample size n = 30 is too small.
c. No, the data are not normally distributed.
d. No, the data were not sampled with replacement.
e. No, outlying yields have produced an unreliable estimated standard deviation.
15.When the full 10,000 acres is harvested, this analysis (assuming the usual conditions are met and with95% confidence) can be expected to provide
a. Between 7,020,000 to 7,460,000 kg wheat.
b. The sample does not produce an estimate of the total yield.
c. Between 5,760,000 to 8,700,000 kg wheat
d. Between 6,750,000 to 7,630,000 kg wheat
e. Between 6,040,000 to 8,440,000 kg wheat
16. Prior to this season, the firm from which the corporation purchased seeds promised that this varietywould produce on average more than 700 kg wheat per acre. Assuming the necessary conditions aremet, a statistical test of the null hypothesis H0: μ ≤ 700 kg/acre has p-valuea. About 1/6
b. About 1/3
c. Less than 0.05
d. About 1/2
e. Larger than 1/2
Regression Analysis for Business (STAT 613) SAMPLE EXAM
QUESTIONS 17–20
The Transportation Department (TDP) is concerned about over-weight trucks damaging highways.TDP maintains that no more than 10% of trucks on the roads are over-weight and has publicallyindicated that the percentage is less. As a precaution, TDP plans to weigh a sample of trucks operating on major routes. Unless the data reject its beliefs, TDP will continue normal operations. If the data reject its beliefs, TDP will institute reforms. Let p denote the population proportion ofoverweight trucks operating on roads.
17. The appropriate null hypothesis for TDP to test is
a. H0: p≤ 0.10b. H0: sample proportion≤ 0.10c. H0: p = 0.10
d. H0: p = 0.50
e. H0: p ≥ 0.10
18. TDP plans to estimate p by the sample proportion of overweight trucks from a random sample ofsize n = 100. If in the population, p = 0.10 then the probability that more than 20% of the trucks in asample are overweight
a. Is about 0.13.
b. Is less than 0.05.
c. Is about 0.37.
d. Cannot be determined without further information.
e. Is more than 0.84.
19. A critic of TDP gathered a sample of n = 400 trucks and used these to test H0: p≤ 0.09 with n = 400.In her random sample, the sample proportion of overweight trucks was 0.10 (10%). She shouldconclude that
a. She needs a larger sample to test H0.
b. She should reject H0.
c. She cannot reject H0.
d. She should change H0 to match the data, revising it to H0: p≤ 0.10.e. The data do not meet the conditions for using a one-sample t-test.

Regression Analysis for Business (STAT 613) SAMPLE EXAM
20. An analyst dislikes hypothesis testing and produced a 95% confidence interval from an independentsample of data, with the interval found to be 0.093 to 0.157. Based on this confidence interval(assuming the usual conditions), the analyst should
a. Reject H0: p = 0.10.
b. Reject H0: p≠ 0.10.c. Use a 90% confidence interval instead.
d. Gather more data until the confidence interval omits 0.10.
e. Not reject H0: p = 0.10.
Only answer the rest of the questions if you wish to waive STAT completely.
21. Which of the following summaries from a fitted regression best measures the degree of collinearityassociated with an estimated coefficient?
a. R2.
b. RMSE.
c. The VIF for the coefficient.
d. The standard error of the slope.
e. The 95% confidence band for the true regression line.
22. If the variances of the error terms in a simple regression increase with increasing values of theexplanatory variable X and one incorrectly assumes the SRM, then the
a. Estimated slope will be too steep.
b. Estimated intercept will be too close to zero.
c. Explanatory variable should be re-expressed on a log scale.
d. Residuals from the fit will appear to be autocorrelated.
e. Prediction intervals for small values of X will be too wide.
23.When building a regression model with a categorical explanatory variable, a common diagnostic plotshows side-by-side comparison boxplots of the model residuals grouped by the levels of the categori-cal variable. This plot is most useful to
a. Check the assumption of independence.
b. Check assumption of equal variance.
c. Check the assumption of normality.
d. Identify the presence of leveraged outliers.
e. Determine the statistical significance of the categorical variable.
Regression Analysis for Business (STAT 613) SAMPLE EXAM
24. Regression models assume that some of the variability in the response is due to random sources notidentified in the model’s equation. The estimated standard deviation of this unexplained variation isknown as
a. RMSE.
b. Standard error of Y.
c. Standard error of X.
d. R2.
e. F - ratio.
25. If the variable X2 is added to a simple regression that includes X1, then which of the following musthappen in the multiple regression if X1 and X2 are uncorrelated?
a. RMSE must get smaller.
b. The partial regression coefficient for X2 will be smaller than that for X1.
c. The overall ANOVA F-statistic will have a larger p-value.
d. The partial regression coefficient for X1 will be the same as the marginal coefficient.
e. The overall ANOVA F-statistic will have a smaller p-value.
QUESTIONS 26–31
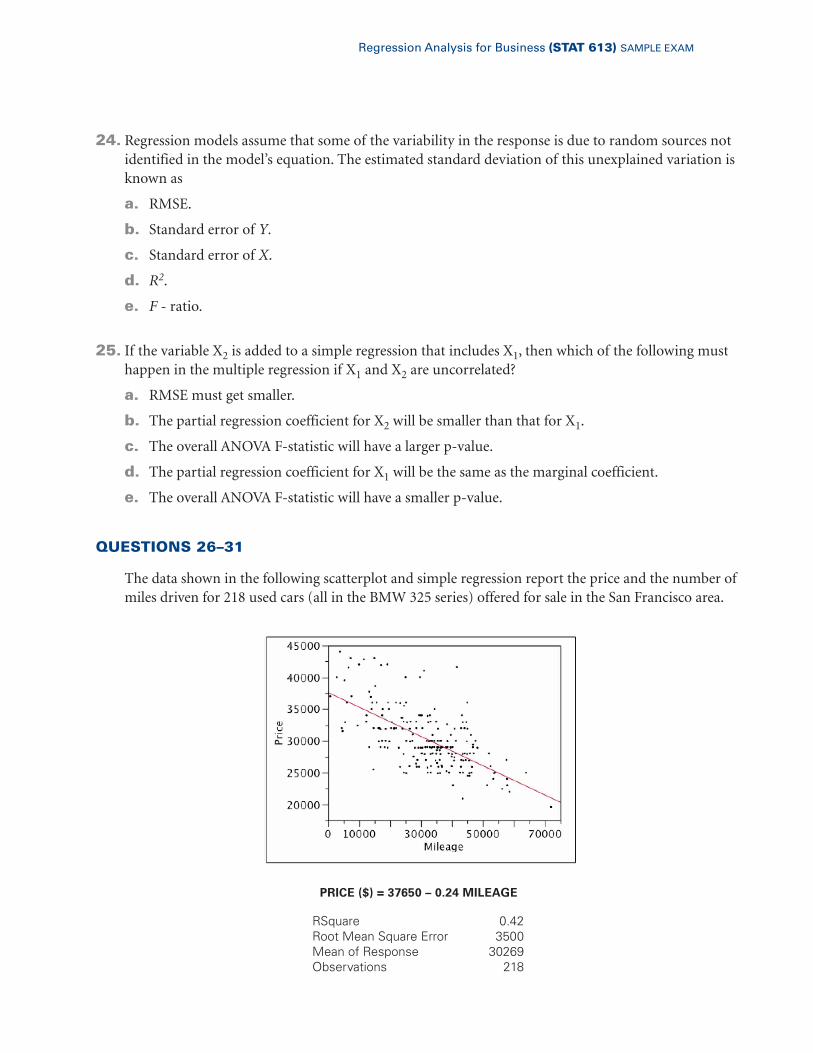
The data shown in the following scatterplot and simple regression report the price and the number ofmiles driven for 218 used cars (all in the BMW 325 series) offered for sale in the San Francisco area.
PRICE ($) = 37650 – 0.24 MILEAGE
RSquare 0.42Root Mean Square Error 3500Mean of Response 30269Observations 218

Regression Analysis for Business (STAT 613) SAMPLE EXAM
26. According to the fitted equation, a car like these with 40,000 miles would be expected to cost onaverage
a. $37,650.
b. $30,450.
c. $28,050.
d. $36,690.
e. $25, 050.
27. A used car with 40,000 miles is offered for sale at a price that is $3,500 above the prediction from thismodel. Given that the assumptions of the SRM hold, then this car’s price is
a. Larger than about 50% of cars with 40,000 miles.
b. Larger than about 95% of cars with 40,000 miles.
c. Larger than about 5% of cars with 40,000 miles.
d. Larger than about 84% of cars with 40,000 miles.
e. Larger than about 67% of cars with 40,000 miles.
28. The equation of the fitted model implies that on average for cars such as these, an additional 1,000miles of driving
a. Has no effect on the expected price of the used car.
b. Increases the expected price by about $240.
c. Decreases the expected price by about $240.
d. Increases the expected price by about 24 percent.
e. Decreases the expected price by about 240 percent.
29. An economist claims that the elasticity of price with respect to mileage driven is constant.How would you adapt this model to estimate the elasticity?
a. The model does not need to be changed.
b. Take the log of price but not mileage.
c. Take the log of mileage but not price.
d. Add a quadratic term to the model to create a power function.
e. Regress the log of price against the log of mileage.

Regression Analysis for Business (STAT 613) SAMPLE EXAM
30. To obtain a more precise estimate of the slope in this model, we should (assuming the assumptionsof the SRM hold)
a. Remove the outlying expensive cars with prices above $40,000.
b. Remove all of the cars with mileage above 50,000.
c. Add prices for 10 more cars which have the average mileage x = 32,000 miles.
d. Add prices for 10 low-mileage cars.
e. Add prices for 5 low-mileage cars and 5 cars with 50,000 to 60,000 miles.
31. If an additional variable, the age of the car, were added to the regression, then which of the followingwould you expect to happen.
a. Severe autocorrelation would be introduced.
b. Collinearity would be eliminated.
c. R-squared would decrease.
d. The estimated regression coefficient for mileage would be closer to zero.
e. The standard deviation of the residuals would increase.
Regression Analysis for Business (STAT 613) SAMPLE EXAM
QUESTIONS 32–43
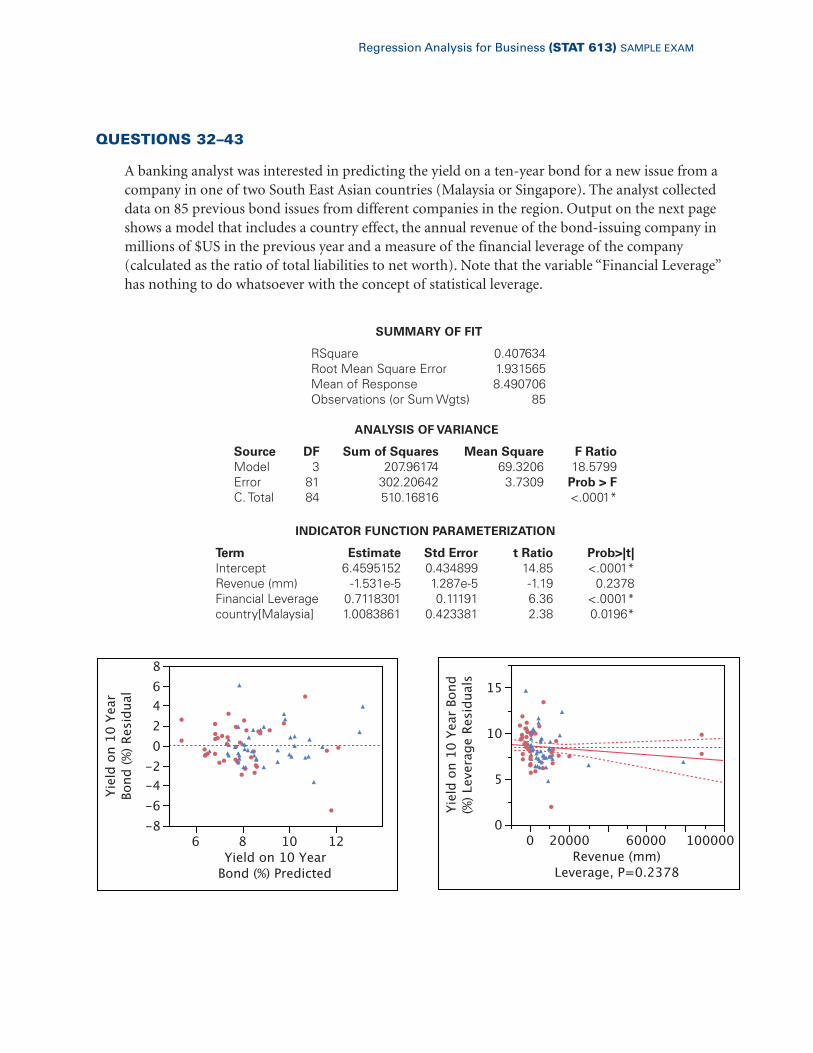
A banking analyst was interested in predicting the yield on a ten-year bond for a new issue from acompany in one of two South East Asian countries (Malaysia or Singapore). The analyst collecteddata on 85 previous bond issues from different companies in the region. Output on the next pageshows a model that includes a country effect, the annual revenue of the bond-issuing company inmillions of $US in the previous year and a measure of the financial leverage of the company (calculated as the ratio of total liabilities to net worth). Note that the variable “Financial Leverage”has nothing to do whatsoever with the concept of statistical leverage.
-8-6-4-202468
Yield
on 10
Year
Bond
(%) R
esidu
al
6 8 10 12Yield on 10 Year
Bond (%) Predicted
0
5
10
15
Yield
on 10
Year
Bond
(%) L
ever
age R
esidu
als
0 20000 60000 100000Revenue (mm)
Leverage, P=0.2378
ANALYSIS OF VARIANCE
Source DF Sum of Squares Mean Square F RatioModel 3 207.96174 69.3206 18.5799Error 81 302.20642 3.7309 Prob > FC. Total 84 510.16816 <.0001*
INDICATOR FUNCTION PARAMETERIZATION
Term Estimate Std Error t Ratio Prob>|t|Intercept 6.4595152 0.434899 14.85 <.0001*Revenue (mm) -1.531e-5 1.287e-5 -1.19 0.2378Financial Leverage 0.7118301 0.11191 6.36 <.0001*country[Malaysia] 1.0083861 0.423381 2.38 0.0196*
SUMMARY OF FIT
RSquare 0.407634Root Mean Square Error 1.931565Mean of Response 8.490706Observations (or Sum Wgts) 85

Regression Analysis for Business (STAT 613) SAMPLE EXAM
32. The estimated yield on a bond based on the fitted model for a Singaporean company with revenuesof $25 (mm) and a Financial Leverage of 2 is approximately
a. 15.4
b. 40.6
c. 7.9
d. 7.5
e. 8.5
33. If we remove the variable Financial Leverage from this multiple regression, then (given theassumptions of the Multiple Regression Model [MRM] hold)
a. The value of R2 would increase by a significant amount.
b. The value of R2 would increase.
c. The value of R2 would decrease.
d. The value of R2 would decrease by a significant amount.
e. The change in the value of R2 cannot be determined.
34. A bond from a company with $20 (mm) revenue and Financial Leverage of 3 is issued. In whichcountry would it be expected to have the lower yield?
a. Singapore.
b. Malaysia.
c. The model predicts the same yield in both countries.
d. There is no information available in the model to answer this question.
e. This question cannot be answered without an interaction in the model.
35. If a company in Singapore were to increase its Financial Leverage by 1, keeping revenues constant,this model implies that the yield would be expected to
a. Decrease on average by between (0.488, 0.936) with 95% confidence
b. Decrease on average by between (-3.15, 4.58) with 95% confidence.
c. Increase on average by between (0.488, 0.936) with 95% confidence.
d. Increase on average by between (-3.15, 4.58) with 95% confidence
e. Decrease on average by between (0.598, 0.825) with 95% confidence
Regression Analysis for Business (STAT 613) SAMPLE EXAM
36. The fitted regression model includes a positive estimated coefficient for Financial Leverage. The bestinterpretation of this coefficient is that
a. If this variable were removed from the model, then R-squared would increase but not by asignificant amount.
b. Within a specific country and for those with identical Financial Leverages but different Revenues,companies are expected to have identical yields.
c. Within a specific country and for those with identical Revenues, companies with greaterFinancial Leverage are expected to have higher yields, but the difference is not significant.
d. Within a specific country and for those with identical Revenues, companies with greaterFinancial Leverage are expected to have higher yields and the difference is significant.
e. Companies with more leverage have higher yields.
37. If the analysts had measured Revenues in Japanese Yen rather than dollars and rerun the abovemodel then which of the following regression summaries would change in value?
a. R2.
b. Standard error of the estimated Revenue slope.
c. t-statistic for the Revenue slope.
d. RMSE.
e. Overall Anova F-ratio.
38.With reference to the leverage plot for Revenue, which of the following is a reasonable conclusion?
a. There is severe collinearity in this dataset.
b. Autocorrelation is likely.
c. There are no leveraged outliers in the dataset.
d. Leveraged observations produce a significant effect for Revenue in the model.
e. Leveraged observations reduce the standard error of Revenue in the model.

Regression Analysis for Business (STAT 613) SAMPLE EXAM
Output below on this page comes from a model that drops three outliers in Revenue and adds aninteraction between Financial Leverage and the variable Country.
39. Which of the following features is the new model (that excludes the three leveraged points and addsan interaction) able to address that the original model (shown on page 171) could not?
a. That the slope for Revenue depends on the county.
b. That yields in Singapore are lower than in Malaysia.
c. A differential impact of Financial Leverage on yields across countries.
d. Autocorrelation of the residuals due to the time series nature of the data.
e. Collinearity between Revenue and Financial Leverage.
-6-4-20246
Yield
on 10
Year
Bond
(%) R
esidu
al
4 6 8 10 12 14Yield on 10 Year
Bond (%) Predicted
ANALYSIS OF VARIANCE
Source DF Sum of Squares Mean Square F RatioModel 4 231.37523 57.8438 16.7911Error 77 265.25812 3.4449 Prob > FC. Total 81 496.63335 <.0001*
INDICATOR FUNCTION PARAMETERIZATION
Term Estimate Std Error t Ratio Prob>|t|Intercept 7.3640367 0.545934 13.49 <.0001*Revenue (mm) -0.000115 3.748e-5 -3.08 0.0029*Financial Leverage 0.469127 0.161105 2.91 0.0047*Country[Malaysia] 0.3603138 0.640399 0.56 0.5753Financial Leverage*country[Malaysia] 0.2875725 0.210909 1.36 0.1767
SUMMARY OF FIT
RSquare 0.465887Root Mean Square Error 1.856047Mean of Response 8.558659Observations (or Sum Wgts) 82

Regression Analysis for Business (STAT 613) SAMPLE EXAM
40. Comparing the new model (that excludes the three leveraged points and adds an interaction) to theoriginal model, a fair interpretation of the results is that
a. The interaction term adds significant explanatory power to the model.
b. The interaction term removes collinearity from the model.
c. The Country term should be removed from the model since not significant.
d. The removal of the three outliers reveals the importance of Revenue.
e. The removal of the three outliers improperly inflates R2.
41. Assuming the MRM holds, what does the p-value for Revenue in the interaction model tell you?
a. The Revenue variable should be removed from the model.
b. The probability that the true Revenue partial slope is one is less than 0.0001.
c. If the true Revenue partial slope were equal to zero, then it is extremely unlikely that we wouldhave observed an estimate so far from zero.
d. That the confidence interval for the partial slope of Revenue contains zero.
e. The addition of Revenue to a model containing the others adds little to R2.
42. Based on the new fitted model above with the interaction term, the estimated yield on a bond for aSingaporean company with revenues of $25 (mm) and a Financial Leverage of 2 is approximately
a. 8.3
b. 8.9
c. 8.6
d. 9.2
e. 0.93
43. If a company with the characteristics presented in the prior question (#42) issued a bond and itsyield was less than 0.5 below the predicted yield, then based on the fitted interaction model wouldyou be surprised?
a. No, as this event is almost certain to happen.
b. No, as this event lies within the statistical uncertainty of the model.
c. No, as the high value of R2 makes this likely with 95% confidence.
d. Yes, because the large sample size makes this unlikely.
e. Yes, as this yield is more than twice the RMSE from the fitted value.

Regression Analysis for Business (STAT 613) SAMPLE EXAM ANSWERS
Sample Exam Answers STAT 613-
1. d.
2. b.
3. e.
4. e.
5. c.
6. e.
7. b.
8. d.
9. d.
10. c.
11. b.
12. e.
13. a.
14. a.
15. a.
16. c.
17. a.
18. b.
19. c.
20. e.
21. c.
22. e.
23. b.
24. a.
25. d.
26. c.
27. d.
28. c.
29. e.
30. e.
31. d.
32. c.
33. d.
34. a.
35. c.
36. d.
37. b.
38. e.
39. c.
40. d.
41. c.
42. a.
43. b.