relarm: a rating model based on relative pca attributes and k-means clustering · pdf...
TRANSCRIPT

RELARM: A rating model based on relative PCA attributes
and k-means clustering
Elnura Irmatova 1 2
Abstract
Following widely used in visual recognition concept of relative attributes, the article establishes
definition of the relative PCA attributes for a class of objects defined by vectors of their
parameters. A new rating model (RELARM) is built using relative PCA attribute ranking
functions for rating object description and k-means clustering algorithm. Rating assignment of
each rating object to a rating category is derived as a result of cluster centers projection on the
specially selected rating vector. Empirical study has shown a high level of approximation to the
existing S & P, Moody's and Fitch ratings.
Key words: rating model, relative PCA attribute, credit rating, principal component analysis, k-
means clustering.
1 Russian Presidential Academy of National Economy and Public Administration (RANEPA), Faculty of
Finance and Banking, Interdepartmental laboratory of financial and economic research. Prospect
Vernadskogo, 82, Moscow, Russian Federation 119571. E-mail: [email protected]
2 This research was conducted within Interdepartmental laboratory of financial and economic research
(RANEPA, Faculty of Finance and Banking)

2
I. Introduction
Credit rating agencies play an important role in providing financial markets with indicative and
prognostic information leading to increase of market efficiency. One of the key factors when
choosing the rating agency is the creditor’s confidence in its estimates, so that each agency is
struggling to improve their assessments transparency for the rating end-users. It should be noted
that the mentioned problem is often referred to the newly created agencies while they are
building the agency reputation. Companies, investors and stakeholders thoroughly examine the
evaluation principles of their rating methodologies at that time. In this regard, when establishing
the rating methodology you might face a problem of the result objectivity. In this context, a
rating methodology objectivity means a minimum presence of model factors evaluated solely by
expert judgment.
It is important to mention that one of the rating agency’s priority is to choose the type of model
that describes a rating object with a minimum use of subjective expert factors.
Usually credit rating models are scoring type models. A scoring model involves obtaining the
integral numerical index based on quantitative and qualitative parameters where each of them
has a certain influence on the creditworthiness of a rating object expressed by a specific
weighting factor. Such models can be built using econometric tools (ranging from simple linear
regression to logit and probit models), multiplicative discriminant analysis, neural networks,
support vector machine techniques or on the basis of expert judgment [1], [2], [3], [4].
The difference between the rating model types is in various approaches to rating object data
base processing, diversity in tools for model establishment and variation in obtaining of weight
coefficients.
For example, factor weights in a model based on expert judgment are determined by an expert
community, however the other model types often involve special model training to find the right
weights. It should be noted that model factors are always an expert community matter of choice
3
and their selection is carried out in accordance with a concept of inclusion the majority of
relevant to analyzed rating object characteristics.
Problem formulation
Credit rating agencies commonly use evaluation models with a high degree of expert component
and some of them incorporate models based on econometric tools. Here the expert part is to
identify the degree of factors’ influence on the final rating as well as to determine intervals of
model parameters for the following point assignment.
The main difficulty of such rating methodologies is that expert methods are not always
transparent to the rating end users as there might exist plenty opinions about a specific weight of
an indicator or a model part as well as options for their numerical values interpretation. In
addition, a model construction and calibration based solely on expert judgment practically can
lead to bias in the final rating. For example, the expert selection of factor weights may cause
significant inaccuracy in resulting rating assignment due to a possible high level of
interdependence between the analyzed indicators.
On the other hand, the choice of an econometric method for model construction or simulation of
a neural network system requires a broad rating history database for model training and
adjustment, otherwise, there might occur substantial errors in rating prediction and assignment.
Thus, the lack of access to a full rating history database is the second major difficulty in
building an accurate automated rating model.
Furthermore, it should be noted, that existing in practice and described in scientific literature
rating models, in fact, are built regardless of a rating object’s interdependencies, although
practically such kind of difficulties can be coped with an expert rating committee decisions.
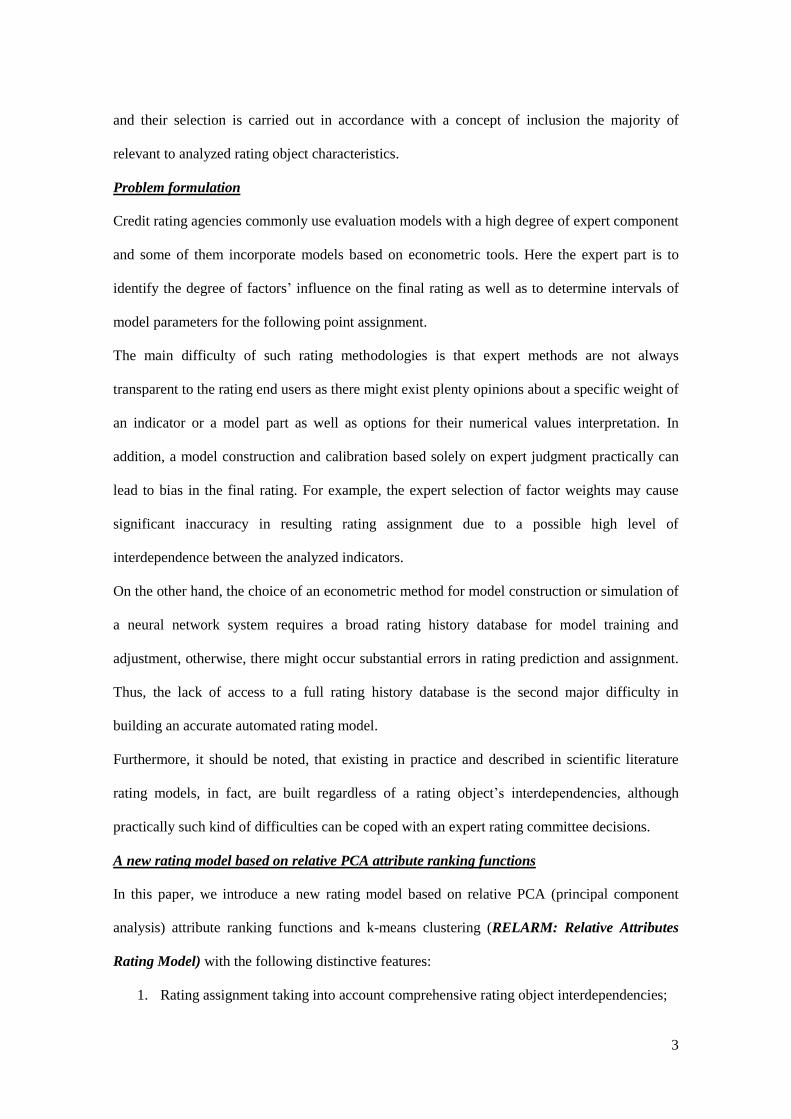
A new rating model based on relative PCA attribute ranking functions
In this paper, we introduce a new rating model based on relative PCA (principal component
analysis) attribute ranking functions and k-means clustering (RELARM: Relative Attributes
Rating Model) with the following distinctive features:
1. Rating assignment taking into account comprehensive rating object interdependencies;

4
2. Simplicity of model training and calculation on small but relevant data array.
The proposed model aims to determine a rating object creditworthiness (financial strength/
stability) based on the principle of "living organism" where each element change (even very
small) causes certain reflection on the state of other analyzed system objects. Incorporation of a
new for rating models definition of the relative PCA attributes provides the most
comprehensive description of analyzed rating object characteristics. It should be emphasized
that obtained by RELARM rating results are robust if model parameters are properly chosen.
The described above the second model’s feature signifies a possibility to train RELARM on the
1-2 years relevant to rating object data, so that it is becoming unnecessary to use large training
samples (e.g. 10, 20, 30 years etc.). It should be noted that model adjustment is going to be
more accurate with an increase of data horizon. However, adequate model results might be
obtained with a minimum years of relevant data.
Therefore, proposed in the article new rating model (RELARM) is aimed to provide credit
rating agencies with a rating methodology based on the principles of rating objectivity and
transparency even when they experience limitations on training data sample.
In Section II, we describe related to the paper works. In Section III, we present the theoretical
concept of RELARM. In Section IV we show an empirical study and section V concludes.
II. Related works
Nowadays the credit rating topic is very popular in scientific literature. There exist a large
amount of works on such topics as rating modeling, credit scoring and determination of credit
quality.
The current section contains a small part of the research works on actual rating modeling
however these papers clearly reflect the relevance of the chosen theme as well as they show a
variety of tools possible to apply.
We conditionally divide the existing papers on rating modeling into 3 types (by the type of tools
they suggest to apply):
models using expert judgment,

5
models using econometric tools,
models using machine learning techniques.
Models using expert judgment
In practice, credit rating agencies often use models based on expert judgment.
One of the most frequent methods used to determine influence of rating model factors with the
use of expert opinion is called Analytic Hierarchy Process (AHP). In [5] AHP is incorporated in
conjunction with the grey hierarchy evaluation model. Another approach is presented in [6]
where the credit quality is explored with the improved grey relation analysis (GRA), AHP and
TOPSIS (the Technique for Order Performance by Similarity to Ideal Solution). Paper [7]
proposes credit default risk evaluation based on Dynamic Multiple Criteria Decision Making
Model, AHP and UTADIS (UTilites Additives DIScriminantes) method for the final scores
computation and ranking.
Models using econometric tools
Regression models are the second most popular models type applied by rating agencies in
practical field. It should be noted that the most commonly used form of regression in credit
ratings is a logistic regression. For example, the general principles can be found in [8] where the
model is built and tested with inclusion of quality parameters. In [9] a credit scoring model
based on fuzzy logistic regression is constructed. Another variant is presented in [10] where
authors used an ordinal regression approach to construct a rating model for sovereign
creditworthiness assessment.
Models using machine-learning techniques
In the last decade machine-learning techniques such as neural networks and support vector
machines were intensively developed. They have been widely used in image recognition
systems as well as in theoretical credit rating modeling, determination of credit risk and quality.
Papers [11], [12], [13] propose methods using support vector machine (SVM) technique and its
modifications. A neural network rating model is presented in [14].

6
One can also find implementation of principal component analysis (PCA) in credit rating
modeling [15], [16], [17], [18].
III. RELARM theoretical description
Current section reveals the theoretical concept of a new rating model based on relative PCA
attribute ranking functions and k-means clustering. Here is presented in detail a step by step
description of RELARM construction.
RELARM is based on 4 phases:
I. Normalization of input data – unification of initial model parameters for their
comparison using linear scaling method.
II. Relative PCA attribute ranking functions calculation, normalized parameter vectors
mapping in the space of relative PCA attribute ranking function values and formation of
the rating vector.
III. k-means clustering of the relative PCA attribute ranking function space vector values
with cluster centers obtaining.
IV. Rating assignment of analyzed rating objects by projection on the rating vector.
In 3.1 we describe normalization of factors procedure. Then in 3.2 we give a definition of
relative PCA attributes and their ranking functions for rating object description. The mapping in
the space of relative PCA attribute ranking functions values is defined. In 3.3 we show k-means
clustering application to the proposed model.
3.1 Normalization of RELARM input parameters
Suppose that a rating model consists of N factors and M rating objects. We apply a linear
scaling method in order to standardize rating model parameters for their comparability.
Let 𝑝𝑖𝑗 , 𝑖 ∈ [𝑀], 𝑗 ∈ [𝑁] denote the initial value of the j-th parameter of the i-th rating object.
We define a normalized value 𝑏𝑖𝑗 of 𝑝𝑖𝑗 , where 𝑖 ∈ [𝑀], 𝑗 ∈ [𝑁], depending on the j-th factor’s
influence on the model property studied.

7
If an increase of 𝑝𝑖𝑗 index value has a positive impact on the final analyzed property, the
formula becomes:
𝑏𝑖𝑗 =𝑝𝑖𝑗−min
𝑖𝑝𝑖𝑗
max𝑖
𝑝𝑖𝑗−min𝑖
𝑝𝑖𝑗 , 𝑖 ∈ [𝑀], j ∈ [N]. (3.1)
If a model parameter increase has a negative effect on the final rating, then normalized value
𝑏𝑖𝑗 is calculated as:
𝑏𝑖𝑗 =max
𝑖𝑝𝑖𝑗−𝑝𝑖𝑗
max𝑖
𝑝𝑖𝑗−min𝑖
𝑝𝑖𝑗, 𝑖 ∈ [𝑀], j ∈ [N]. (3.2)
As a result of (3.1) and (3.2) each rating object is described by a (1 x n) dimension row vector
of normalized parameters:
𝑏𝑖𝑇 = (𝑏𝑖1, … , 𝑏𝑖𝑁) ∈ [0,1]𝑁 , 𝑖 ∈ [𝑀]. (3.3)
Let
𝐵 ≔ {𝑏𝑖}, 𝑖 ∈ [𝑀]. (3.4)
denote a set of normalized parameters.
3.2 Rating object characteristic using relative PCA attribute ranking function values
Current paragraph reveals the second phase of RELARM construction, namely the mapping of
normalized vectors 𝑏𝑖 , 𝑖 ∈ [𝑀] to the space of relative PCA attribute ranking function values.
The concept of attributes is widely used in image recognition algorithms. It is most often
presented in recognition using binary properties, which predicts a presence or an absence of a
specific attribute (e.g. smiles on photos, determination of a landscape type etc.). However, the
use of such algorithms has certain restrictions and often leads to ambiguous recognition or total
disregard of a characteristic. Later in paper [19] it is proposed an application of relative
attributes providing semantically more rich method for object description, which uses objects
features comparison in relation to each other. The concept of relative attributes provides a
relative strength of specified features presence of an object compared to other objects.

8
Definition of a relative PCA attribute and its ranking function
Let
𝑤𝑘 = (
𝑤1𝑘
⋮𝑤𝑁𝑘
) (3.5)
denote 𝑙1-normalized PCA components of the set B (3.4) with principal component variances
𝜆𝑘 , 𝜆1 ≥ 𝜆2 ≥ ⋯ ≥ 𝜆𝑁.
Definition. Let p-th relative PCA attribute of vector 𝑏𝑖 ∈ 𝐵 𝑖 = 1,2, … 𝑀 be a vector ipA :
NpiNpipiip wbwbwbA ,,, 2211 , p = 1....,N. (3.6)
Further we can also name the p-th relative PCA attribute of a vector as the p-th main attribute
vector. In accordance with the concept presented in [19] we say that the p-th main attribute has
a stronger presence in vector 𝑏𝑖 than in vector 𝑏𝑗, if 𝑙1-norm of vector ipA is greater than 𝑙1-
norm of vector jpA :
∑ 𝑏𝑖𝑘|𝑤𝑘𝑝|𝑁𝑘=1 ≥ ∑ 𝑏𝑗𝑘
𝑁𝑘=1 |𝑤𝑘𝑝| (3.7)
Therefore, the ranking vector for p-th main attribute is the vectorT
pw~ :
Npp
T
p www ,~1 , (3.8)
and the ranking function is defined by formula:
i
T
pip bwbr ~)( (3.9)
([19]).
We define 𝑁 × 𝑑 matrix 𝑊 as:
𝑊 = (|𝑤11| ⋯ |𝑤1𝑑|
⋮ ⋱ ⋮|𝑤𝑁1| ⋯ |𝑤𝑁𝑑|
), (3.10)
where the number of principal components 𝑑 is determined to avoid the influence of «data
noise». We recommend to take the number of principal components 𝑑 providing approximately
95% of data information.
9
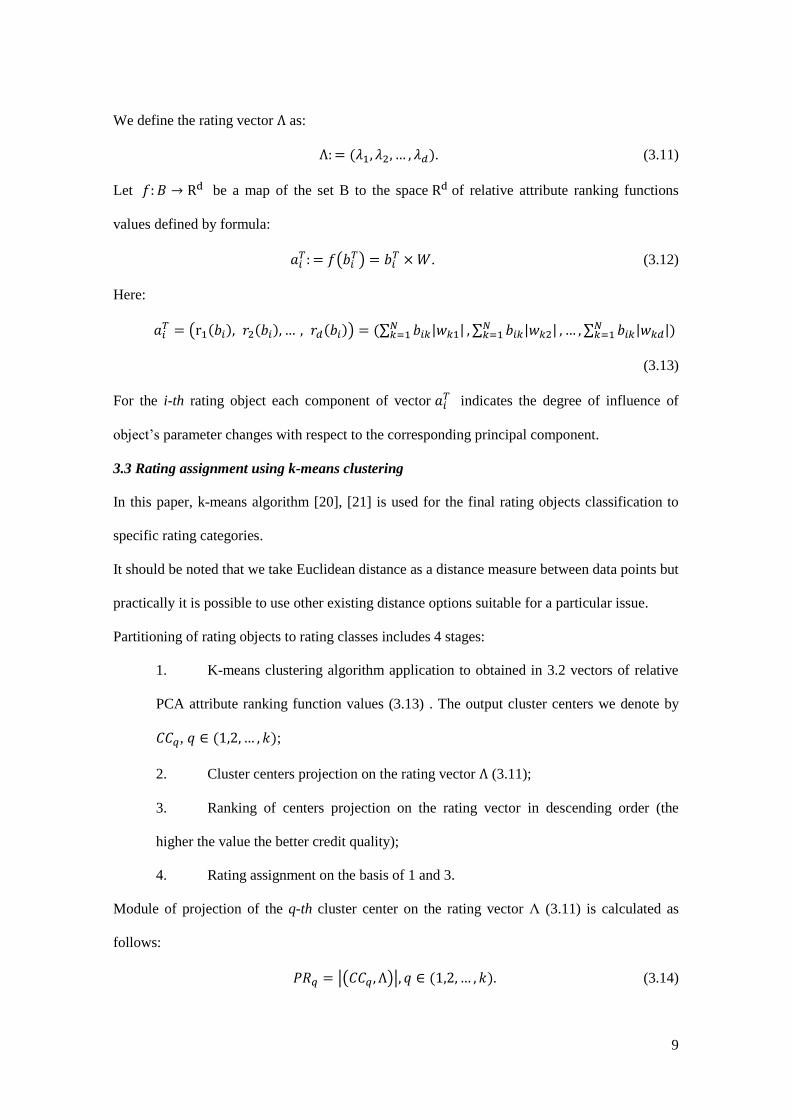
We define the rating vector Λ as:
Λ: = (𝜆1, 𝜆2, … , 𝜆𝑑). (3.11)
Let 𝑓: 𝐵 → Rd be a map of the set B to the space Rd of relative attribute ranking functions
values defined by formula:
𝑎𝑖𝑇: = 𝑓(𝑏𝑖
𝑇) = 𝑏𝑖𝑇 × 𝑊. (3.12)
Here:
𝑎𝑖𝑇 = (r1(𝑏𝑖), 𝑟2(𝑏𝑖), … , 𝑟𝑑(𝑏𝑖)) = (∑ 𝑏𝑖𝑘|𝑤𝑘1|𝑁
𝑘=1 , ∑ 𝑏𝑖𝑘|𝑤𝑘2|𝑁𝑘=1 , … , ∑ 𝑏𝑖𝑘|𝑤𝑘𝑑|)𝑁
𝑘=1
(3.13)
For the i-th rating object each component of vector 𝑎𝑖𝑇 indicates the degree of influence of
object’s parameter changes with respect to the corresponding principal component.
3.3 Rating assignment using k-means clustering
In this paper, k-means algorithm [20], [21] is used for the final rating objects classification to
specific rating categories.
It should be noted that we take Euclidean distance as a distance measure between data points but
practically it is possible to use other existing distance options suitable for a particular issue.
Partitioning of rating objects to rating classes includes 4 stages:
1. K-means clustering algorithm application to obtained in 3.2 vectors of relative
PCA attribute ranking function values (3.13) . The output cluster centers we denote by
𝐶𝐶𝑞, 𝑞 ∈ (1,2, … , 𝑘);
2. Cluster centers projection on the rating vector Λ (3.11);
3. Ranking of centers projection on the rating vector in descending order (the
higher the value the better credit quality);
4. Rating assignment on the basis of 1 and 3.
Module of projection of the q-th cluster center on the rating vector Λ (3.11) is calculated as
follows:
𝑃𝑅𝑞 = |(𝐶𝐶𝑞 , Λ)|, 𝑞 ∈ (1,2, … , 𝑘). (3.14)

10
Note. We can assume intuitively that the l-th value of the rating vector Λ is proportional to
probability that comparison by the l-th main attribute ranking function is correct. Thus, 𝑃𝑅𝑞 can
be considered as analogue of module of a rating object’s expected value.
Finally, we rank obtained values 𝑃𝑅𝑞 , 𝑞 ∈ (1,2, … , 𝑘) in descending order and form a rating list
containing analyzed rating objects with respect to assigned rating classes.
IV. RELARM empirical study
In current section, we present an empirical example of RELARM application based on the
theoretical concept proposed in the previous section.
For the purpose of our experiment, it was decided to build a test sovereign credit rating
assessment model using RELARM approach. The main reasons for the choice of countries data
for model construction were:
firstly, it is possible to collect a large number of county relevant indicators in public
databases;
secondly, sovereign credit rating can be obtained with a greater emphasis on the
economic and financial indicators and a smaller part containing expert based variables.
However, for example, an enterprise or financial institution credit rating always comprises a
significant number of qualitative indicators.
The second part is especially important for an experiment model because in this case
minimization of expert opinion is necessary for a greater result neutralization, which makes
possible to compare the final test model rating with the real sovereign credit ratings.
Finally, section concludes the adequacy of the results obtained in comparison with the assigned
Standard & Poor’s3, Moody’s4 и Fitch5 rating agencies sovereign credit ratings.
4.1 Data and model parameters
3 https://www.standardandpoors.com/ 4 https://www.moodys.com/ 5 https://www.fitchratings.com/

11
The initial and fundamental phase of a rating model construction is the selection of the most
relevant parameters characterizing a rating object as full as possible within evaluation of a
certain property (e.g. creditworthiness, reliability, efficiency, quality, etc.). Criteria choice
largely influences the final model result providing minimum outliers if they were picked
correctly.
Consequently, for realization of an experiment we selected a part of indicators for sovereign
credit rating assessment used by Standard & Poor’s, Moody’s и Fitch rating agencies. It is also
important to mention that our criteria choice was based on the possibility to collect the latest
data.6
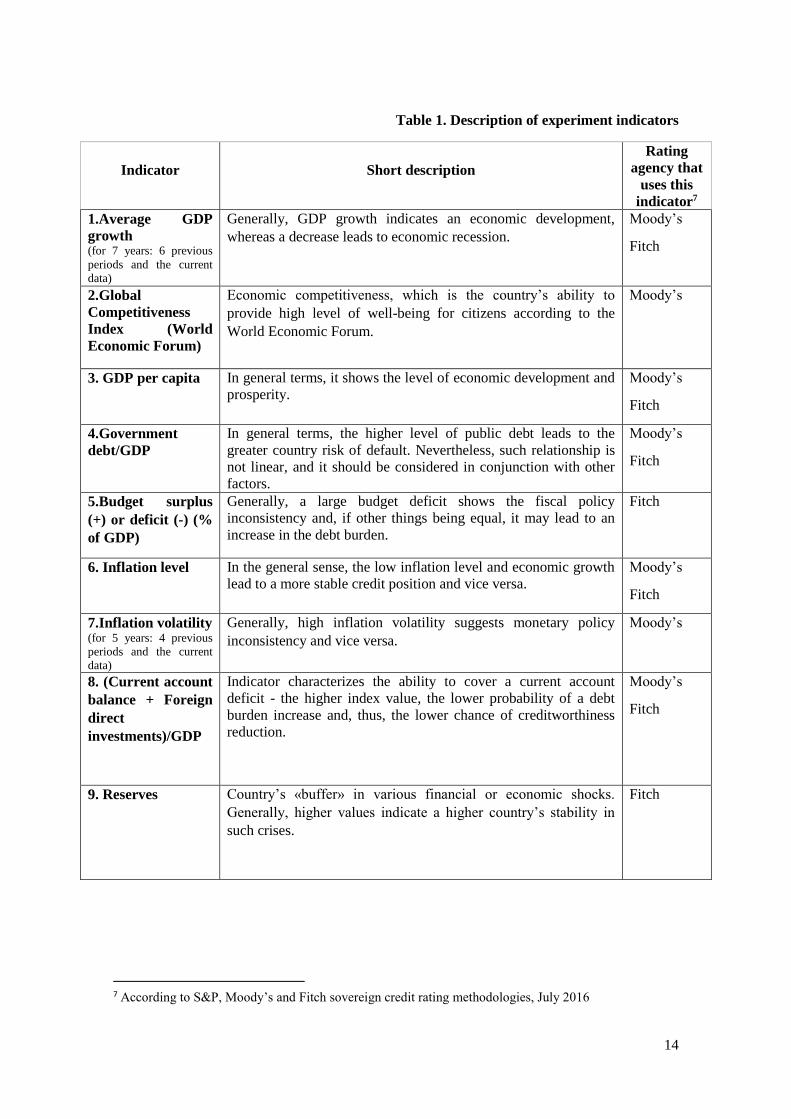
Thus, 9 financial and economic parameters, fundamental for economy description, were
selected. The description is presented in Table 1.
In addition to financial and economic indicators there also included an expert factor with a
distribution [0,1] (likewise the other normalized parameters). It is supposed to reflect an expert
opinion on the country’s economy strength, a possibility to gain financial support from other
countries, «soft power» as well as prediction of economy’s power. In order to conduct an
experiment 30 countries were selected.
Data for the selected criteria were taken from public statistical databases: the World Bank, data
from country’s statistical agencies, central banks and other sources.
4.2 Calculations
Once the evaluation criteria were selected, a country list was compiled and all the relevant data
was collected, normalization of the input data should be made. However, before that step to be
done, it is necessary to determine the influence of each factor on the final property studied,
namely creditworthiness (Table 2).
Next, normalized values for each factor are calculated according to formulae (3.1) and (3.2) for
factors with positive and negative influence respectively. Table 3 shows an example of
6 We took mostly 2016 year data but if there was no current date on a factor in open access and we
suggest the indicator is important for the model, we included data from previous years.

12
normalized values calculation. Matrix of normalized countries’ indicators values is presented in
Table 5. As it was mentioned above, we also inserted a specific expert factor (with [0,1]
distribution) in addition to selected economic and financial indicators.
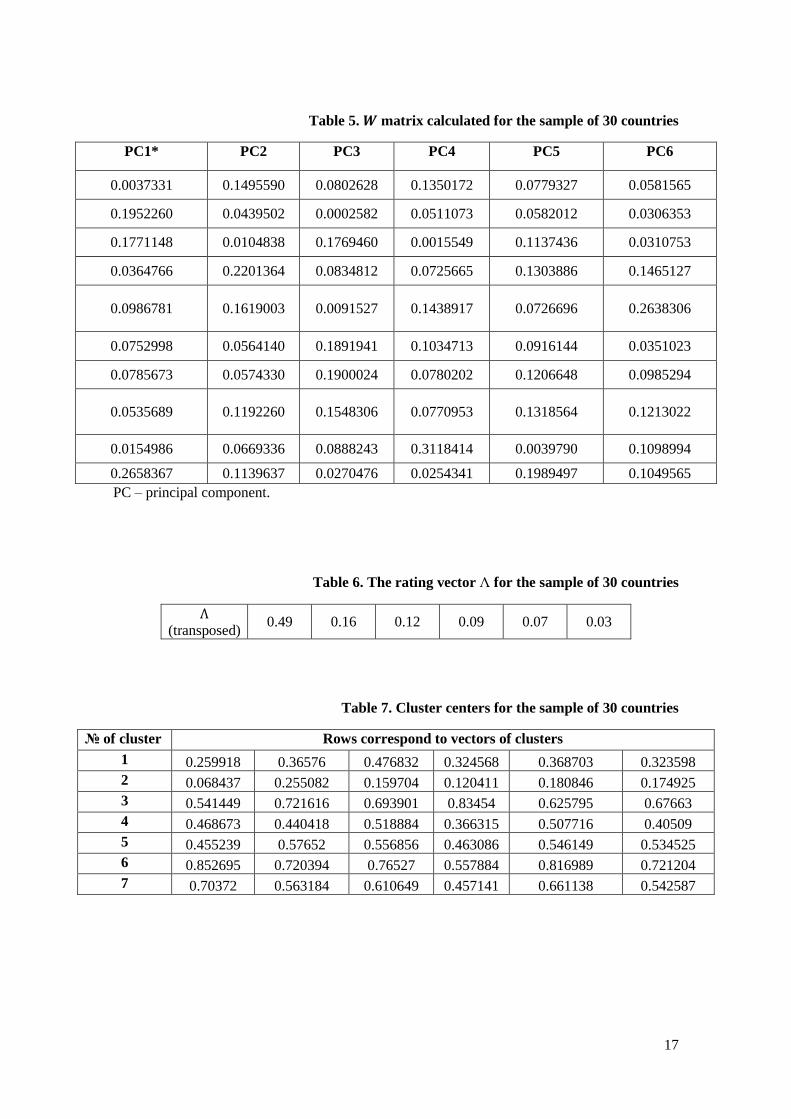
Based on the matrix of normalized country indicators values (Table 4) with an added expert
factor, the number of principal components d and matrix 𝑊 (3.10) are determined. The
calculated matrix 𝑊 is presented in Table 5.
Next, the mapping in the space Rd of relative attribute ranking functions values (3.12) is
performed. It should be noted, that in this particular case we selected 6 principal components
which ensure preservation of 96% data information. Also the rating vector Λ (3.11) was
obtained (Table 6).
Therefore, we have 30 vectors in the R6 space corresponding to each country of a sample and
then the algorithm described in 3.3 is performed. As we consider a small sample for the
experiment, it was decided to take k=7 for k-means clustering which means that we exclude
rating subcategories and consider the following classes: AAA, AA, A, BBB, BB, B, CCC. It
should be mentioned that Euclidean distance was selected for the clustering algorithm. K-
clustering allowed to make homogenous groupings as well as to compute cluster centers
presented in Table 7.
Next, according to algorithm from 3.3, modules of projections 𝑃𝑅𝑞 were found, then ranking of
obtained cluster projections was made and, finally, rating assignment to each country was
performed.
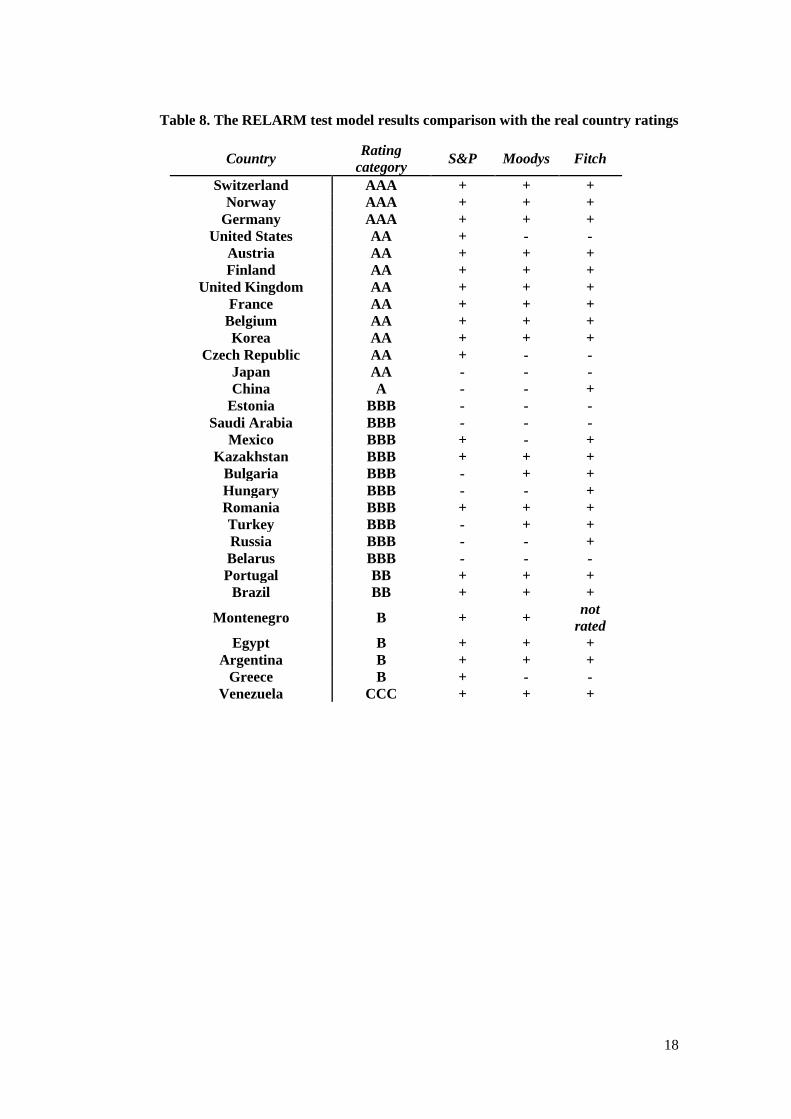
The resulting RELARM rating was compared with existing country ratings on 31.07.2016
(source: Thomson Reuters Eikon) assigned by S & P, Moody's and Fitch rating agencies. We
consider a country’s RELARM rating to be a success result, if it matches one of the real ratings
of the above-mentioned rating agencies. Since we divided the test sample into 7 rating
categories, excluding subcategories, the test model country's result is identical to an existing

13
country rating if it complies with the general rating category (Ex .: the country's rating of the
test model is AA and this country has Fitch AA + : RELARM rating matches the real one).
Thus, an experiment model based on RELARM method showed results presented in Table 8. It
can be seen from the Table 8 that RELAM method provided 86% approximation to real ratings.
Moreover, such an effective result was gained using only 10 model factors. In addition,
thorough indicators selection in conjunction with a correct model and k-means clustering
adjusting can provide an opportunity to refine the results. It should be noted, the resulting
country distribution to rating categories is a recommendation to a rating agency’s rating
committee for a rating assignment, however the final decision on the rating level is always made
by experts.
The result obtained using RELARM approach is adequate and appropriate for implementation
in rating agencies practical activities.
IV. Conclusion
A new rating model based on the relative PCA attributes ranking functions and k-means
clustering was proposed.
RELARM provides the most comprehensive rating objects description by introducing the
relative PCA attributes concept for object’s parameters vector.
An empirical study showed high approximation level to actual countries credit ratings, which
proved the RELARM approach to be adequate. A wise model factors selection and correct
clustering mechanism adjusting can ensure results accuracy. Simplicity of model training and
results computation at the same time are the basis for RELARM implementation in the practical
field of rating agencies.
Acknowledgement
Author expresses deep gratitude to A.A. Irmatov for valuable comments and attention
for this paper.
14
Table 1. Description of experiment indicators
Indicator Short description
Rating
agency that
uses this
indicator7
1.Average GDP
growth (for 7 years: 6 previous
periods and the current
data)
Generally, GDP growth indicates an economic development,
whereas a decrease leads to economic recession.
Moody’s
Fitch
2.Global
Competitiveness
Index (World
Economic Forum)
Economic competitiveness, which is the country’s ability to
provide high level of well-being for citizens according to the
World Economic Forum.
Moody’s
3. GDP per capita In general terms, it shows the level of economic development and
prosperity.
Moody’s
Fitch
4.Government
debt/GDP
In general terms, the higher level of public debt leads to the
greater country risk of default. Nevertheless, such relationship is
not linear, and it should be considered in conjunction with other
factors.
Moody’s
Fitch
5.Budget surplus
(+) or deficit (-) (%
of GDP)
Generally, a large budget deficit shows the fiscal policy
inconsistency and, if other things being equal, it may lead to an
increase in the debt burden.
Fitch
6. Inflation level In the general sense, the low inflation level and economic growth
lead to a more stable credit position and vice versa.
Moody’s
Fitch
7.Inflation volatility (for 5 years: 4 previous
periods and the current
data)
Generally, high inflation volatility suggests monetary policy
inconsistency and vice versa.
Moody’s
8. (Current account
balance + Foreign
direct
investments)/GDP
Indicator characterizes the ability to cover a current account
deficit - the higher index value, the lower probability of a debt
burden increase and, thus, the lower chance of creditworthiness
reduction.
Moody’s
Fitch
9. Reserves Country’s «buffer» in various financial or economic shocks.
Generally, higher values indicate a higher country’s stability in
such crises.
Fitch
7 According to S&P, Moody’s and Fitch sovereign credit rating methodologies, July 2016

15
Table 2. Indicator influence on countries’ creditworthiness.
Indicator Influence
1. Average GDP growth Positive
2. Global Competitiveness Index (World Economic Forum) Positive
3. GDP per capita Positive
4. Government debt/GDP Negative
5. Budget surplus (+) or deficit (-) (% of GDP) Positive
6. Inflation level Negative
7. Inflation volatility Negative
8. (Current account balance + Foreign direct investments)/GDP Positive
9. Reserves Positive
Table 3. Example of normalized values calculation
Country: Russia
Indicator Input value
The minimum
value for the
sample of 30
countries
The maximum
value for the
sample of 30
countries
Normalized value
Global
Competitiveness
Index (World
Economic Forum)
4.44 3.3 5.76 0.4634
Inflation level 7.5% -1.3 180.9 0.9517

16
Table 4. Matrix of normalized indicator values for the sample of 30 countries
Country GDP
growth
WEF
Competiti
veness
GDP
per
Capita
Gov
debt/GD
P
Budget
balance/G
DP
Inflation
level
Inflatio
n
Volatili
ty
(CAB
+FDI
)/GD
P
Reserv
es
Switzerland 0.45 1.00 1.00 0.86 0.67 1.00 1.00 1.00 0.17
Norway 0.43 0.86 0.93 0.87 1.00 0.97 0.99 0.57 0.02
United
States
0.49 0.94 0.68 0.55 0.52 0.99 1.00 0.20 0.03
Germany 0.47 0.91 0.49 0.69 0.71 0.99 0.99 0.48 0.02
Austria 0.42 0.74 0.52 0.63 0.60 0.99 0.99 0.31 0.00
Finland 0.37 0.87 0.50 0.73 0.51 0.99 0.99 0.40 0.00
United
Kingdom
0.49 0.87 0.52 0.62 0.41 0.99 0.99 0.08 0.04
France 0.41 0.74 0.43 0.58 0.46 0.99 1.00 0.22 0.02
Belgium 0.42 0.77 0.48 0.54 0.52 0.98 0.99 0.05 0.00
Korea 0.61 0.69 0.31 0.85 0.49 0.99 1.00 0.39 0.11
China 1.00 0.65 0.06 0.81 0.53 0.98 1.00 0.34 1.00
Czech
Republic
0.46 0.57 0.18 0.83 0.65 0.99 0.99 0.24 0.02
Japan 0.41 0.88 0.38 0.00 0.32 1.00 0.99 0.22 0.36
Estonia 0.59 0.59 0.18 0.96 0.69 1.00 0.97 0.21 0.00
Saudi
Arabia
0.70 0.72 0.22 1.00 0.53 0.97 1.00 0.57 0.18
Mexico 0.58 0.40 0.07 0.82 0.47 0.98 1.00 0.21 0.05
Kazakhstan 0.68 0.48 0.09 0.90 0.60 0.90 0.92 0.34 0.01
Bulgaria 0.44 0.41 0.04 0.88 0.55 1.00 0.98 0.35 0.01
Hungary 0.44 0.39 0.11 0.68 0.56 0.99 0.97 0.33 0.01
Romania 0.50 0.41 0.07 0.84 0.63 1.00 0.97 0.25 0.01
Portugal 0.29 0.50 0.20 0.44 0.41 0.99 0.99 0.18 0.00
Turkey 0.75 0.43 0.07 0.86 0.60 0.95 1.00 0.09 0.03
Russia 0.43 0.46 0.07 0.93 0.52 0.95 0.94 0.34 0.10
Brazil 0.40 0.32 0.06 0.72 0.07 0.94 0.98 0.15 0.11
Montenegr
o
0.47 0.37 0.04 0.74 0.26 1.00 0.97 0.20 0.00
Belarus 0.44 0.35 0.03 0.90 0.77 0.93 0.70 0.00 0.00
Egypt 0.59 0.15 0.00 0.61 0.00 0.92 0.97 0.21 0.00
Argentina 0.59 0.20 0.12 0.79 0.35 0.77 0.74 0.22 0.01
Greece 0.00 0.29 0.19 0.23 0.25 1.00 0.99 0.12 0.00
Venezuela 0.28 0.00 0.12 0.79 0.00 0.00 0.00 0.32 0.00
17
Table 5. 𝑾 matrix calculated for the sample of 30 countries
PC1* PC2 PC3 PC4 PC5 PC6
0.0037331 0.1495590 0.0802628 0.1350172 0.0779327 0.0581565
0.1952260 0.0439502 0.0002582 0.0511073 0.0582012 0.0306353
0.1771148 0.0104838 0.1769460 0.0015549 0.1137436 0.0310753
0.0364766 0.2201364 0.0834812 0.0725665 0.1303886 0.1465127
0.0986781 0.1619003 0.0091527 0.1438917 0.0726696 0.2638306
0.0752998 0.0564140 0.1891941 0.1034713 0.0916144 0.0351023
0.0785673 0.0574330 0.1900024 0.0780202 0.1206648 0.0985294
0.0535689 0.1192260 0.1548306 0.0770953 0.1318564 0.1213022
0.0154986 0.0669336 0.0888243 0.3118414 0.0039790 0.1098994
0.2658367 0.1139637 0.0270476 0.0254341 0.1989497 0.1049565
PC – principal component.
Table 6. The rating vector Λ for the sample of 30 countries
Λ (transposed)
0.49 0.16 0.12 0.09 0.07 0.03
Table 7. Cluster centers for the sample of 30 countries
№ of cluster Rows correspond to vectors of clusters
1 0.259918 0.36576 0.476832 0.324568 0.368703 0.323598
2 0.068437 0.255082 0.159704 0.120411 0.180846 0.174925
3 0.541449 0.721616 0.693901 0.83454 0.625795 0.67663
4 0.468673 0.440418 0.518884 0.366315 0.507716 0.40509
5 0.455239 0.57652 0.556856 0.463086 0.546149 0.534525
6 0.852695 0.720394 0.76527 0.557884 0.816989 0.721204
7 0.70372 0.563184 0.610649 0.457141 0.661138 0.542587
18
Table 8. The RELARM test model results comparison with the real country ratings
Country Rating
category S&P Moodys Fitch
Switzerland AAA + + +
Norway AAA + + +
Germany AAA + + +
United States AA + - -
Austria AA + + +
Finland AA + + +
United Kingdom AA + + +
France AA + + +
Belgium AA + + +
Korea AA + + +
Czech Republic AA + - -
Japan AA - - -
China A - - +
Estonia BBB - - -
Saudi Arabia BBB - - -
Mexico BBB + - +
Kazakhstan BBB + + +
Bulgaria BBB - + +
Hungary BBB - - +
Romania BBB + + +
Turkey BBB - + +
Russia BBB - - +
Belarus BBB - - -
Portugal BB + + +
Brazil BB + + +
Montenegro B + + not
rated
Egypt B + + +
Argentina B + + +
Greece B + - -
Venezuela CCC + + +

19
References
[1] Novotná M. 2012. The use of different approaches for credit rating prediction and their
comparison. 6th International Scientific Conference Managing and Modelling of Financial
Risk. VŠB-TU Ostrava.
[2] Chen H, Chen Y. 2010. A comparative study of discrimination methods for credit scoring.
Computers and Industrial Engineering (CIE), 2010 40th International Conference on: 1-5. DOI: 10.1109/ICCIE.2010.5668170
[3] Huang SC, Day MY. 2013. A Comparative Study of Data Mining Techniques for Credit
Scoring in Banking. Information Reuse and Integration (IRI), 2013 IEEE 14th International
Conference on: 684-691. DOI: 10.1109/IRI.2013.6642534
[4] Hsu C.F, Hung H.F. 2009. Classification methods of Credit Rating – A Comparative
Analysis on SVM, MDA and RST. Computational Intelligence and Software Engineering,
2009. CiSE 2009. International Conference on: 1-4. DOI: 10.1109/CISE.2009.5366068
[5] Hongli, Junchen. 2010. The Credit Rating of Small and Medium-sized Enterprises Based on
the Grey Hierarchy Evaluation Model. The 2nd International Conference on Information
Science and Engineering: 3247-3250. DOI: 10.1109/ICISE.2010.5689927
[6] Wang H. 2011. Rating of Credit Risk Utilizing Improved GRA with Compound Weight.
Artificial Intelligence, Management Science and Electronic Commerce (AIMSEC), 2011 2nd
International Conference on: 3196-3200. DOI: 10.1109/AIMSEC.2011.6011178
[7] Lou C, Peng Y, Kou G, Ge X. 2010. DMCDM: A dynamic multi criteria decision making
model for sovereign credit default risk evaluation. Software Engineering and Data Mining
(SEDM), 2010 2nd International Conference on: 489 – 494.
[8] Wei Y, Xu S, Meng F. 2010. The Listed Company's Credit Rating Based on Logistic
Regression Model Add non-financial Factors. Modeling, Simulation and Visualization Methods
(WMSVM), 2010 Second International Conference on: 172-175. DOI: 10.1109/WMSVM.2010.69
[9] Sohn S.Y, Kim D.H, Yoon J.H. 2016. Technology credit scoring model with fuzzy logistic
regression. Applied Soft Computing 43: 150-158. DOI: 10.1016/j.asoc.2016.02.025
[10] Fernandez-Navarro F, Campoy-Munoz P, Paz-Marin M, Hervas-Martinez C, Yao X. 2013.
Addressing the EU Sovereign Ratings Using an Ordinal Regression Approach. IEEE
Transactions on Cybernetics 43, Issue 6: 2228-2240. DOI: 10.1109/TSMCC.2013.2247595
[11] Chen W, Li JM. 2009. A model based on factor analysis and support vector machine for
credit risk identification in small-and-medium enterprises. 2009 International Conference on
Machine Learning and Cybernetics: 913-918. DOI: 10.1109/ICMLC.2009.5212433
[12] Jilani T.A., Burney S.M.A. 2008. Multiclass Bilateral-Weighted Fuzzy Support Vector
Machine to Evaluate Financial Strength Credit Rating. Computer Science and Information
Technology, 2008. ICCSIT '08. International Conference on: 342-348. DOI: 10.1109/ICCSIT.2008.191
[13] Gangolf C, Dochow R, Schmidt G, Tamisier T. 2014. SVDD: A proposal for automated
credit rating prediction. Control, Decision and Information Technologies (CoDIT), 2014
International Conference on: 048-053. DOI: 10.1109/CoDIT.2014.6996866
[14] Liu C, Xia X. 2010. The credit rating of small and medium enterprises based on neural
network. Information Engineering and Electronic Commerce (IEEC), 2010 2nd International
Symposium on: 1-4. DOI: 10.1109/IEEC.2010.5533285
[15] Xiang D. 2010. The Listed Company's Financial Evaluation Based on PCA-Logistic
Regression Model. Multimedia and Information Technology (MMIT), 2010 Second
International Conference on: 168-171. DOI: 10.1109/MMIT.2010.148
[16] Xue X-h, Xue X-f. 2010. Research of electronic commercial credit rating based on Neural
Network with Principal Component Analysis. Internet Technology and Applications, 2010
International Conference on: 1-4. DOI: 10.1109/ITAPP.2010.5566121
[17] Jianfeng L, Tianshan M. 2010. An Comprehensive Rating Model of Manufacturing
Enterprise's Credit Risk Based on Logistics Finance. 2010 International Conference on

20
Computer Application and System Modeling (ICCASM 2010): V15-290 -V15-293. DOI:
10.1109/ICCASM.2010.5622102
[18] Zhang M, Zhou Z. 2010. A Credit Rating Model for Enterprises Based on Principal
Component Analysis and Optimal Partition. Emergency Management and Management
Sciences (ICEMMS), 2010 IEEE International Conference on: 379-382. DOI:
10.1109/ICEMMS.2010.5563423
[19] Parikh D, Grauman K. 2011. Relative Attributes. Proceedings of the International
Conference on Computer Vision (ICCV): 503-510.
[20] Lloyd S.P. 1982. Least Squares Quantization in PCM. IEEE Transactions on Information
Theory. Vol. 28: 129–137.
[21] Arthur D, Vassilvitskii S. 2007. K-means++: The Advantages of Careful Seeding. SODA
‘07: Proceedings of the Eighteenth Annual ACM-SIAM Symposium on Discrete Algorithms:
1027–1035.