relationship between the number of iso 9001 certifications ... · relationship between the number...
TRANSCRIPT
Relationship between the number of ISO 9001 certifications and the national economic performance in transitional economies
LÁSZLÓ BERÉNYI
Institute of Management Science University of Miskolc
3515 Miskolc-Egyetemváros HUNGARY
[email protected] Abstract: - The development of the quality approach and toolset has followed the economic challenges in the recent decades. The most popular management system standard, ISO 9001 has been continuously adjusted to the recent business challenges, so it has an important role in supporting the acceleration of corporate performance. Since some leading industries require the certification of the corporate quality management system, the number of certifications may be an important indicator. Comparing the trends of ISO 9001 applications and macroeconomic indicators demonstrates the applicability of this concept. The paper focuses on some selected transitional economies (Bulgaria, Czech Republic, Hungary, Poland, Romania and Slovakia) those have an important role in European trade. There is a strong and significant correlation between the number of ISO 9001 certifications and GDP per capita, export, gross fixed capital formation indicators as well as HDI index. Nevertheless, development of the countries shows different patterns based on the export-orientation. Although the number of certifications alone cannot describe a comprehensive state of the economy, it can be a useful supplementary element of the measuring system. Key-Words: - ISO 9001, quality management, certification, GDP, HDI, transitional economy 1 Introduction Integrating the concept of quality management into the general management approach and toolbar allows a comprehensive development and utilization of the management systems. The quality approach can be interpreted as proactive management of activities related to internal and external customers. The quality approach can support CSR efforts (Frolova & Lapina, 2014), project management (Görög, 2013), development of working processes and environment (Berényi, 2017) as well as strategic problem-solving through professionally selected tools. However, a systematic approach is essential for coordinating the efforts. Although, large corporations may have enough resources and knowledge for establishing a self-developed management system, an internationally accepted framework may give support for a wide range of organizations. Certified management systems allow a ‘common language’ for supply chains worldwide. Moreover, Borial (2011) points out that ISO 9001 (and ISO 14001) give the passport to international trade.
The attention to quality management has been decreasing in the recent years based on the number
of ISO 9001 certifications. Notwithstanding, a remarkable expansion of other management system standards in not to experienced that may fill the gap. I found the main reasons as follows:
- The appreciation of sustainable development and corporate social responsibility (CSR) has brought a new focus point, so corporations require more comprehensive solutions than before, considering also strategic issues (Deutsch et al., 2013).
- Besides environmental and social issues, there is an increasing interest in occupational safety, information security, food safety etc.
- Integrated management systems are attractive but providing the corporate commitment, knowledge, and resources may be difficult.
- There are new keywords of management research in search of success, e.g. competencies, coaching, strategic capabilities, lean management.
- Establishing a certified management system is usually required by business partners. Through the related expenditures may make products and services more expensive what
WSEAS TRANSACTIONS on BUSINESS and ECONOMICS László Berényi
E-ISSN: 2224-2899 99 Volume 15, 2018
goes beyond the possibilities of many corporations.
- Barriers and limitations for small- and medium-sized enterprises (Holátová et al., 2015) hinder the wider spread of complex quality management systems or methods.
The recent revision of the ISO 9001 standard offers a solution for the challenges above but success is a great question of the future. 2 Possibilities of quality management by ISO 9001 2.1 Development of quality concept In the early decades of the 20th century, the quality control, especially the statistical process control (Shewhart, 1931) could contribute to improving corporate performance and competitiveness. The bottleneck has moved from corporate effectiveness to market possibilities in the 1960s. Strategic planning and management became more and more important. However, methods and tools for controlling the operative processes still in use nowadays (see Evans 1991; Kear, 1998; Montgomery, 2012) and even those are essential. Development has been boosted many times:
- The teachings of Deming (2000) shook up the management thinking in Japan and later worldwide. Extension of statistical tools and controlling approach to business processes opened up new opportunities, the concept has contributed to the spectacular development of the Japan industrial production (Tenner & DeToro, 1995).
- There was a remarkable development of data processing by industrial application of computers for production control and measurement technology: time need of analysis, depth, and possibilities of analysis or punctuality has radically changed.
- Improving the availability of IT solutions fosters remote data access, faster decision making and establishing new organizational solutions as well (Tóth, 1999).
Sustaining corporate success requires a renewal
in corporate management approach. Garvin (1988) deals with the development of quality as a strategic factor. Quality assurance and later quality management supplemented quality inspection and control. The development progress moved the focus from the follow-up of products or production to the
conditions of production as well as the enhancing of competitiveness.
Of course, the quality-related activities mentioned above cannot replace each other: recognizing the customer needs does not guarantee the ability to satisfy it, and precise manufacturing does not necessarily lead to customer satisfaction. This complexity is easy to observe in case of services. Production and consumption of services are intertwined, so correction of nonconformities and achieving customer satisfaction needs a complex approach; see Heidrich et al. (2006), Szolnoki (2015).
The 1980s brought a new economic situation for the U.S. corporations. Leading industries (automotive industry, electronic industry) disadvantaged compared with Japanese and German industries (Peters & Waterman, 1984; Tenner & DeToro, 1995). Deming’s principles appreciated again (Deming, 2000) and searching national excellence has been launched. The Baldridge-model (Hakes, 2007) in the USA and the EFQM-model in Europe boosted the management system development by multi-criteria evaluation frameworks. Total quality management (TQM) focuses on process development (Weckenmann et al., 2015) but did not give one ‘best’ model for the corporate application.
The awakening attention to environmental issues and global problems can be dated to 1960s and the research activity and international attention was very intensive in the 1970s. A broadly accepted sustainable development definition can be traced back to the Report of the Brundtland Commission, which defined sustainable development as a development which meets the needs of current generations without considering the ability of future generations to meet their own needs (WCED, 1987). This concept integrates environmental, social and economic aspects. From the viewpoint of corporate management, CSR (Kotler & Lee, 2004) and the standardization (particularly ISO 14001) should be highlighted. Integration also appears in quality management. 2.2 Milestones of developing the standard The United Kingdom had an important role in developing management system standards. Internalization of BS 5750 and BS 7750 standards to ISO 9001 and ISO 14001 lead to a common concept and definitions worldwide (Rothery, 1995). The management approach for the ISO 9001 standard gives the basis both of standardizing of new scopes (occupational safety, information security, food
WSEAS TRANSACTIONS on BUSINESS and ECONOMICS László Berényi
E-ISSN: 2224-2899 100 Volume 15, 2018
safety etc.) and industry-specific quality management systems (e.g. ISO/TS16949, TL 9000). Due to the diversified development of the latter group, Koczor (2001) calls them “X9000”. Globalization is a key factor in the diffusion:
- globalization can support the diffusion of the standards (and nationalization procedure promoted the better acceptance on the local level),
- the increasing number of certified management systems intensifies the globalization by unifying the supply chains.
ISO management system standards give more
benefits than using for certification or other contractual purposes:
a) “the ability to consistently provide products and services that meet customer and applicable statutory and regulatory requirements,
b) facilitating opportunities to enhance customer satisfaction,
c) addressing risks and opportunities associated with its context and objectives,
d) the ability to demonstrate conformity to specified quality management system requirements” (ISO 9001:2015).
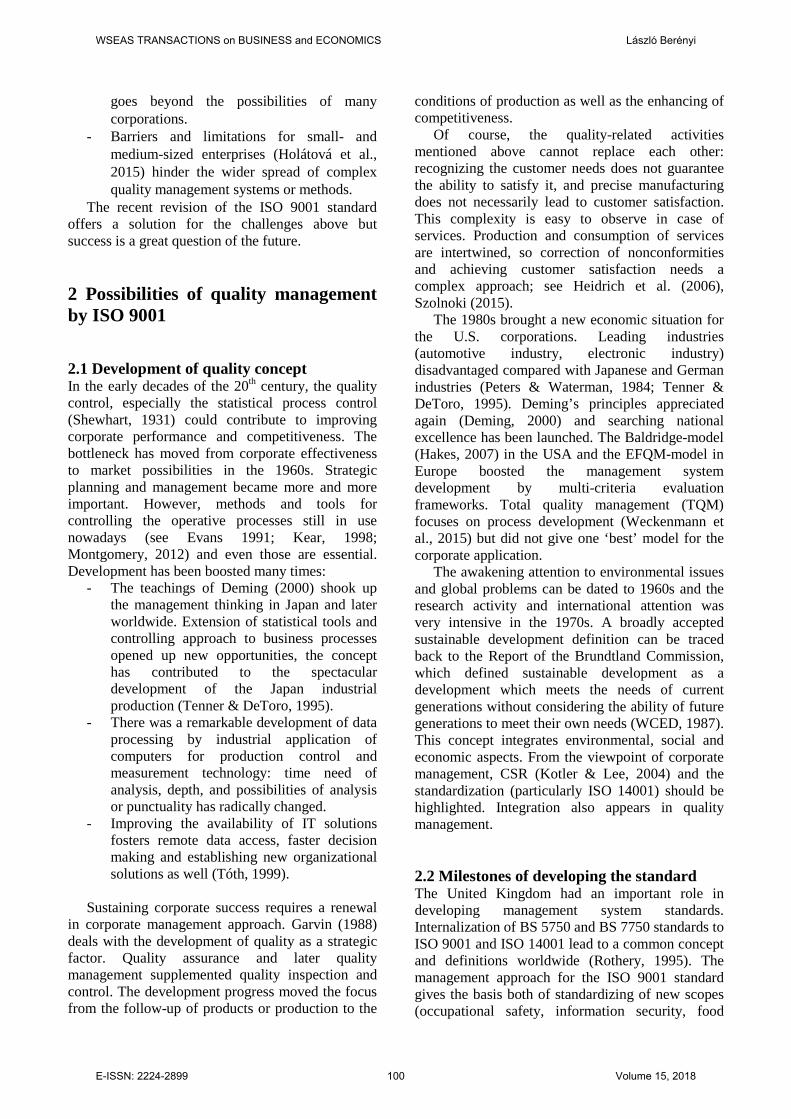
The focus points of the evolution of ISO 9001 can be summarized as Table 1. and Figure 1 show.
Table 1: Focus points of developing ISO 9001
Year Novelty
1987 The first international set of requirements in the field; focus on quality inspection and control.
1994
The comprehensive quality assurance standard for producers. Requirements for service-oriented organizations in a separated standard. Introduction of the requirements for preventive actions.
2000
The standard for quality management. A new approach based on system- and process orientation. Unified requirements independently corporate size and activity.
2008
Refinement of the terminology related to managing organizations in a supply chain and other practical expectations. More focus on harmonization with other management system standards.
2015
Establishing a risk-based thinking instead of preventive actions. The focus of the management system is spread from customer to the needs and expectations of interested parties.
Source: own compilation
Fig.1: Brief history of ISO 9001
Source: own compilation
2.3 Results of the recent revision Croft (2012) stated that the 2015 editions of the ISO 9001 and ISO 14001 standards prepare the future of various management standards for the next 25 years. This requires a comprehensive structure, considering the pursuit of becoming more sustainable. The long-run thinking foreshadows both the renewal of management toolset rather than patching the existing solutions and the benefits of implementing an integrated management system especially when other standards will follow the new concept. Others call into question the novelty of the standards. Hunt (2014) highlights that an existing management system based on ISO 9001:2008 mostly fulfills the new requirements. She does not believe the new approach, only a terminology refinement again.
WSEAS TRANSACTIONS on BUSINESS and ECONOMICS László Berényi
E-ISSN: 2224-2899 101 Volume 15, 2018
The main changes of the concept and the standards are the followings:
- It is emphasized that the scope of the management system shall be derived from understood external and internal context, with regard to the needs and expectations of interested parties, strategic direction and the products and services of the organization.
- The risk-based approach allows a management thinking that fits all type and size of organizations. It replaces the former requirements for preventive actions, moreover, the consideration of risks and opportunities may cover the whole business process (see e.g. Gołaś, 2014).
- Instead of mandating a management representative, top management shall ensure that the responsibilities and authorities for relevant roles are assigned and understood.
- Documentation systems are revised and simplified in terminology. The expression ‘documented information’ covers all data, procedure, records etc.
- Requirements for resource management is more detailed than before and it includes a great emphasis on knowledge management.
- The new standards give a special attention to external issues beyond the requirements of understanding the organizational context. Based on practical expectations about the development of supply chain-oriented thinking and the supporting organizational structures the standards manage also outsourced processes and their performance.
- Performance evaluation session organizes the assessment, evaluation, audit and review procedures on product/service, process, and organizational level.
The historical review shows that quality
management achievements follow both the recession and prosperity of the economy. Since a certification grants a certain level of development, the representation of the certified corporations may refer to the maturity of the economy. 2.4 Changes in the number of certified management systems based on ISO 9001 The paper analysis the diffusion of the ISO 9001 standard based on the number of valid certifications per year. It should be noted that the impact of the management system standards is much wider but an objective and overall assessment is difficult to implement. The source of the analysis is the annual
ISO Survey database, available at https://www.iso.org/the-iso-survey.html. The 2015 data set includes the distribution by industries where it could be stated, so conclusions based on it are limited.
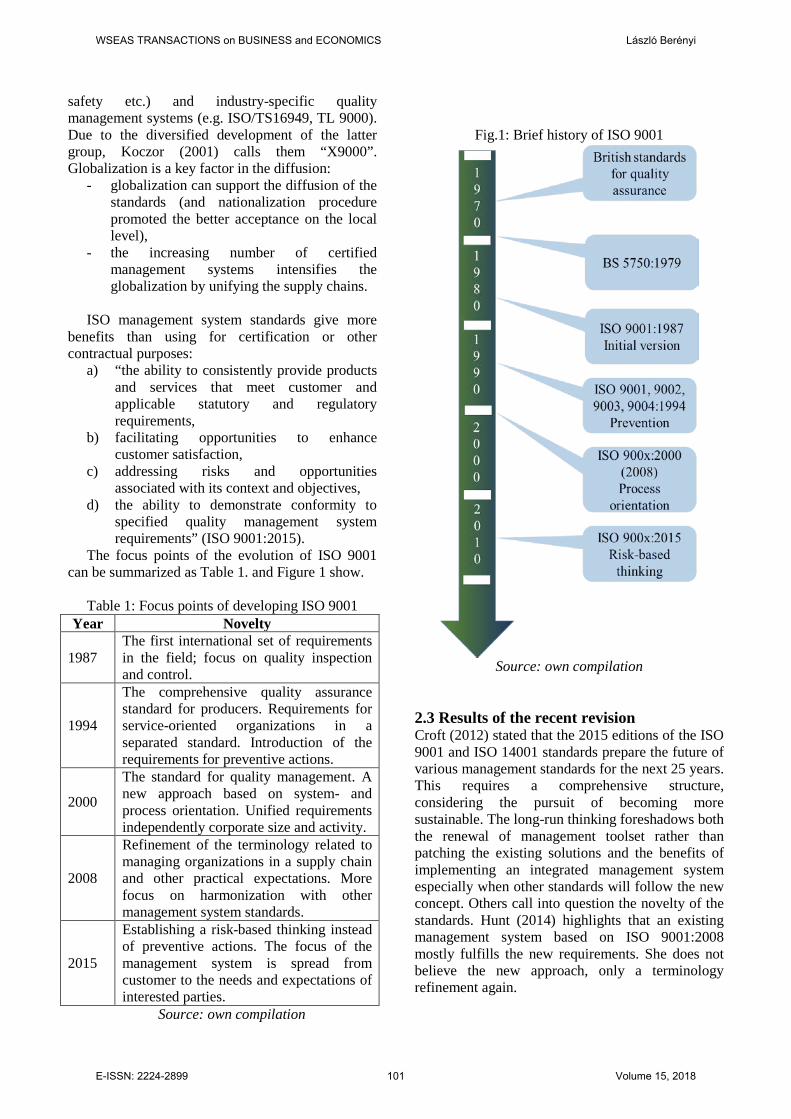
ISO 9001 is the most popular management system standard in the world. There were 1,034,180 ISO 9001 certifications in 2015 worldwide, it is followed by ISO 14001 (319,486). Europe and East Asia and Pacific area are the leaders with 83.4% of ISO 9001certifications.
Fig.2: Distribution of ISO 9001 certifications
Source: based on ISO Survey data
Figure 2 shows the change of distribution in
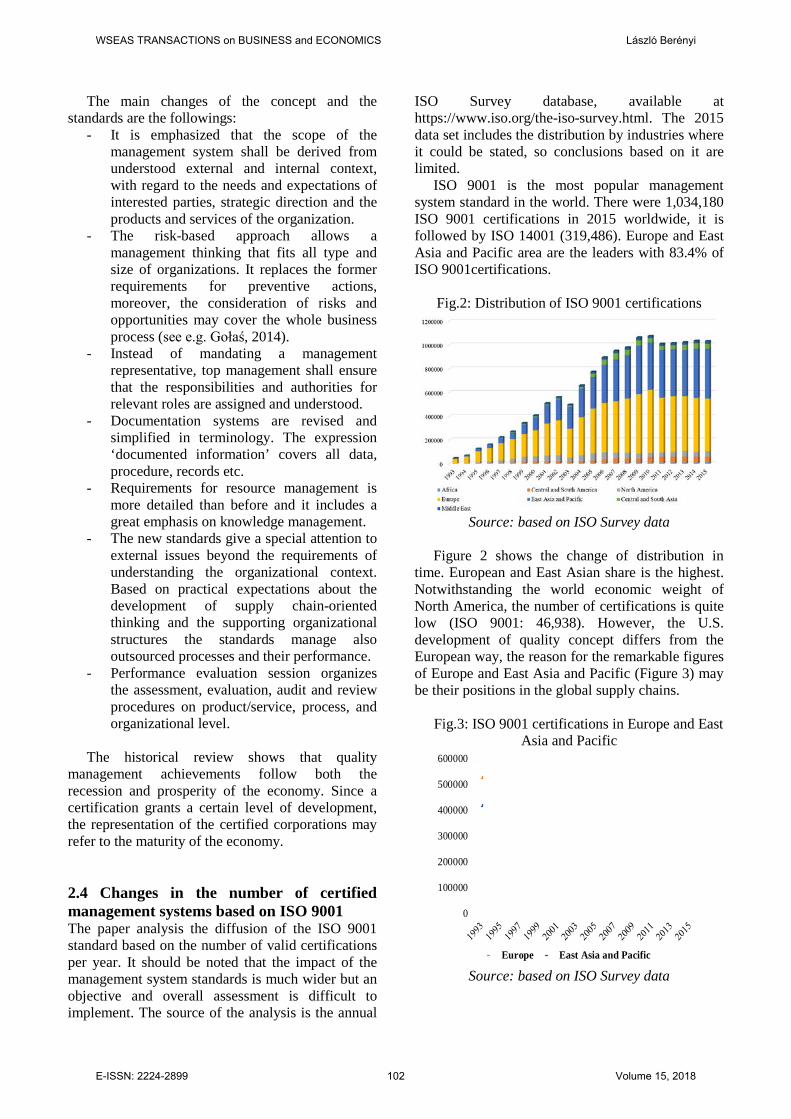
time. European and East Asian share is the highest. Notwithstanding the world economic weight of North America, the number of certifications is quite low (ISO 9001: 46,938). However, the U.S. development of quality concept differs from the European way, the reason for the remarkable figures of Europe and East Asia and Pacific (Figure 3) may be their positions in the global supply chains.
Fig.3: ISO 9001 certifications in Europe and East
Asia and Pacific
Source: based on ISO Survey data
0
100000
200000
300000
400000
500000
600000
Europe East Asia and Pacific
WSEAS TRANSACTIONS on BUSINESS and ECONOMICS László Berényi
E-ISSN: 2224-2899 102 Volume 15, 2018
The growth of certifications is gradually decreasing. Switching to the ISO 9001:2000 standard was a serious challenge for European organizations in the early 2000s (because of the 3-year certification period the impact is delayed). Such deceleration is not to observe in East Asia and Pacific. Beyond that, probably the economic crisis in 2008 had a visible impact on the number of certifications, although the strength of this impact is different by countries. The number of ISO 9001 certifications in Europe apparently decrease, East Asia and Pacific are on a new development path.
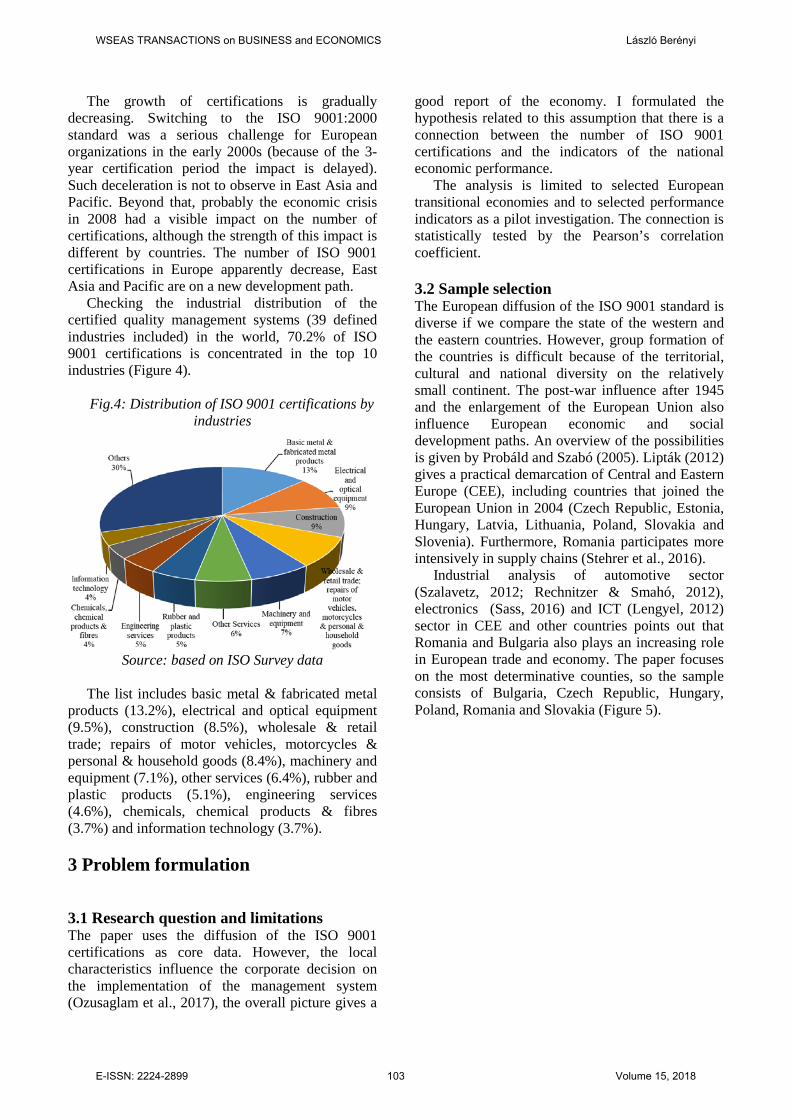
Checking the industrial distribution of the certified quality management systems (39 defined industries included) in the world, 70.2% of ISO 9001 certifications is concentrated in the top 10 industries (Figure 4).
Fig.4: Distribution of ISO 9001 certifications by
industries
Source: based on ISO Survey data
The list includes basic metal & fabricated metal
products (13.2%), electrical and optical equipment (9.5%), construction (8.5%), wholesale & retail trade; repairs of motor vehicles, motorcycles & personal & household goods (8.4%), machinery and equipment (7.1%), other services (6.4%), rubber and plastic products (5.1%), engineering services (4.6%), chemicals, chemical products & fibres (3.7%) and information technology (3.7%). 3 Problem formulation 3.1 Research question and limitations The paper uses the diffusion of the ISO 9001 certifications as core data. However, the local characteristics influence the corporate decision on the implementation of the management system (Ozusaglam et al., 2017), the overall picture gives a
good report of the economy. I formulated the hypothesis related to this assumption that there is a connection between the number of ISO 9001 certifications and the indicators of the national economic performance.
The analysis is limited to selected European transitional economies and to selected performance indicators as a pilot investigation. The connection is statistically tested by the Pearson’s correlation coefficient. 3.2 Sample selection The European diffusion of the ISO 9001 standard is diverse if we compare the state of the western and the eastern countries. However, group formation of the countries is difficult because of the territorial, cultural and national diversity on the relatively small continent. The post-war influence after 1945 and the enlargement of the European Union also influence European economic and social development paths. An overview of the possibilities is given by Probáld and Szabó (2005). Lipták (2012) gives a practical demarcation of Central and Eastern Europe (CEE), including countries that joined the European Union in 2004 (Czech Republic, Estonia, Hungary, Latvia, Lithuania, Poland, Slovakia and Slovenia). Furthermore, Romania participates more intensively in supply chains (Stehrer et al., 2016).
Industrial analysis of automotive sector (Szalavetz, 2012; Rechnitzer & Smahó, 2012), electronics (Sass, 2016) and ICT (Lengyel, 2012) sector in CEE and other countries points out that Romania and Bulgaria also plays an increasing role in European trade and economy. The paper focuses on the most determinative counties, so the sample consists of Bulgaria, Czech Republic, Hungary, Poland, Romania and Slovakia (Figure 5).
WSEAS TRANSACTIONS on BUSINESS and ECONOMICS László Berényi
E-ISSN: 2224-2899 103 Volume 15, 2018
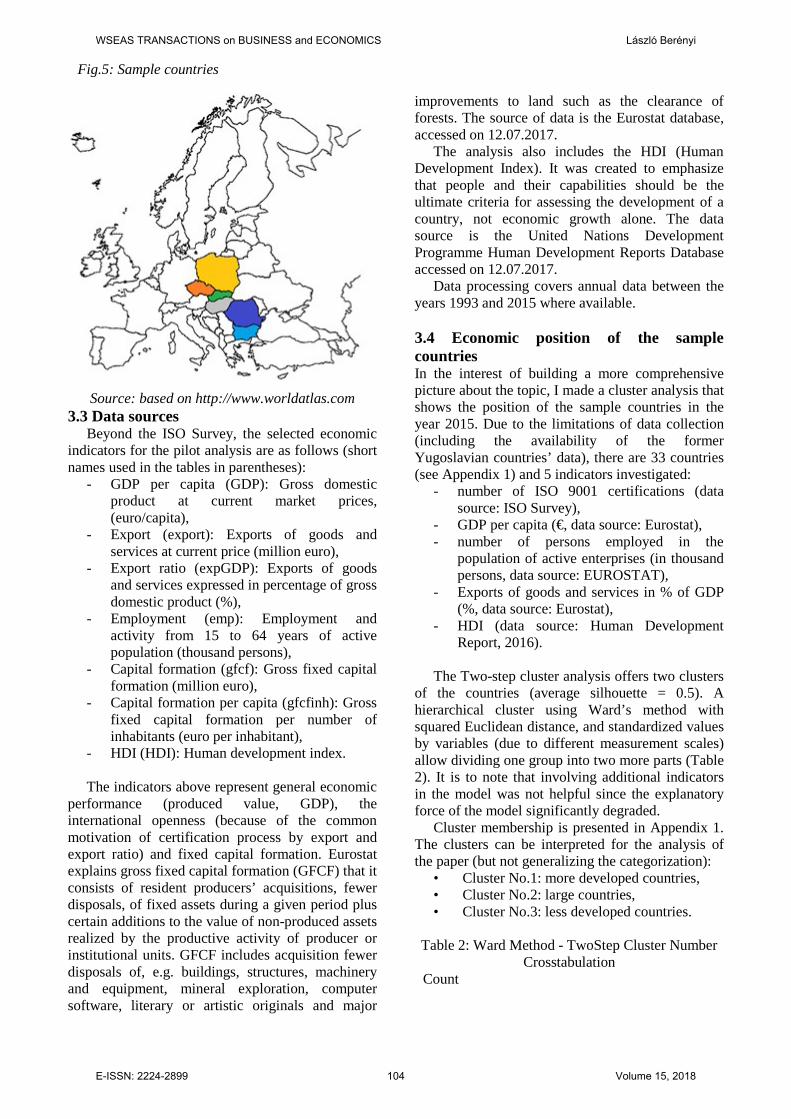
Source: based on http://www.worldatlas.com
3.3 Data sources Beyond the ISO Survey, the selected economic
indicators for the pilot analysis are as follows (short names used in the tables in parentheses):
- GDP per capita (GDP): Gross domestic product at current market prices, (euro/capita),
- Export (export): Exports of goods and services at current price (million euro),
- Export ratio (expGDP): Exports of goods and services expressed in percentage of gross domestic product (%),
- Employment (emp): Employment and activity from 15 to 64 years of active population (thousand persons),
- Capital formation (gfcf): Gross fixed capital formation (million euro),
- Capital formation per capita (gfcfinh): Gross fixed capital formation per number of inhabitants (euro per inhabitant),
- HDI (HDI): Human development index. The indicators above represent general economic
performance (produced value, GDP), the international openness (because of the common motivation of certification process by export and export ratio) and fixed capital formation. Eurostat explains gross fixed capital formation (GFCF) that it consists of resident producers’ acquisitions, fewer disposals, of fixed assets during a given period plus certain additions to the value of non-produced assets realized by the productive activity of producer or institutional units. GFCF includes acquisition fewer disposals of, e.g. buildings, structures, machinery and equipment, mineral exploration, computer software, literary or artistic originals and major
improvements to land such as the clearance of forests. The source of data is the Eurostat database, accessed on 12.07.2017.
The analysis also includes the HDI (Human Development Index). It was created to emphasize that people and their capabilities should be the ultimate criteria for assessing the development of a country, not economic growth alone. The data source is the United Nations Development Programme Human Development Reports Database accessed on 12.07.2017.
Data processing covers annual data between the years 1993 and 2015 where available.
3.4 Economic position of the sample countries In the interest of building a more comprehensive picture about the topic, I made a cluster analysis that shows the position of the sample countries in the year 2015. Due to the limitations of data collection (including the availability of the former Yugoslavian countries’ data), there are 33 countries (see Appendix 1) and 5 indicators investigated:
- number of ISO 9001 certifications (data source: ISO Survey),
- GDP per capita (€, data source: Eurostat), - number of persons employed in the
population of active enterprises (in thousand persons, data source: EUROSTAT),
- Exports of goods and services in % of GDP (%, data source: Eurostat),
- HDI (data source: Human Development Report, 2016).
The Two-step cluster analysis offers two clusters
of the countries (average silhouette = 0.5). A hierarchical cluster using Ward’s method with squared Euclidean distance, and standardized values by variables (due to different measurement scales) allow dividing one group into two more parts (Table 2). It is to note that involving additional indicators in the model was not helpful since the explanatory force of the model significantly degraded.
Cluster membership is presented in Appendix 1. The clusters can be interpreted for the analysis of the paper (but not generalizing the categorization):
• Cluster No.1: more developed countries, • Cluster No.2: large countries, • Cluster No.3: less developed countries.
Table 2: Ward Method - TwoStep Cluster Number
Crosstabulation Count
Fig.5: Sample countries
WSEAS TRANSACTIONS on BUSINESS and ECONOMICS László Berényi
E-ISSN: 2224-2899 104 Volume 15, 2018
TwoStep Cluster Number
Total 1 2 Ward Method 1 11 0 11
2 17 0 17 3 0 5 5
Total 28 5 33 Source: SPSS output
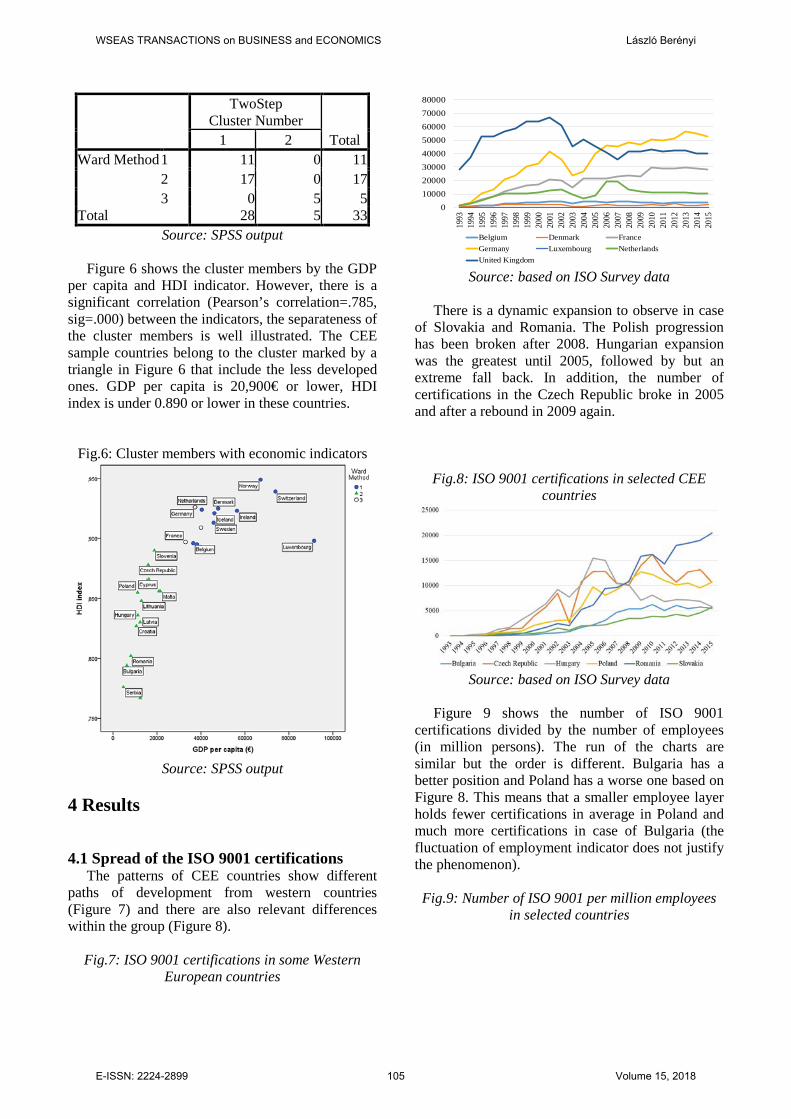
Figure 6 shows the cluster members by the GDP
per capita and HDI indicator. However, there is a significant correlation (Pearson’s correlation=.785, sig=.000) between the indicators, the separateness of the cluster members is well illustrated. The CEE sample countries belong to the cluster marked by a triangle in Figure 6 that include the less developed ones. GDP per capita is 20,900€ or lower, HDI index is under 0.890 or lower in these countries.
Fig.6: Cluster members with economic indicators
Source: SPSS output
4 Results 4.1 Spread of the ISO 9001 certifications
The patterns of CEE countries show different paths of development from western countries (Figure 7) and there are also relevant differences within the group (Figure 8).
Fig.7: ISO 9001 certifications in some Western
European countries
Source: based on ISO Survey data
There is a dynamic expansion to observe in case
of Slovakia and Romania. The Polish progression has been broken after 2008. Hungarian expansion was the greatest until 2005, followed by but an extreme fall back. In addition, the number of certifications in the Czech Republic broke in 2005 and after a rebound in 2009 again.
Fig.8: ISO 9001 certifications in selected CEE countries
Source: based on ISO Survey data
Figure 9 shows the number of ISO 9001
certifications divided by the number of employees (in million persons). The run of the charts are similar but the order is different. Bulgaria has a better position and Poland has a worse one based on Figure 8. This means that a smaller employee layer holds fewer certifications in average in Poland and much more certifications in case of Bulgaria (the fluctuation of employment indicator does not justify the phenomenon). Fig.9: Number of ISO 9001 per million employees
in selected countries
01000020000300004000050000600007000080000
1993
1994
1995
1996
1997
1998
1999
2000
2001
2002
2003
2004
2005
2006
2007
2008
2009
2010
2011
2012
2013
2014
2015
Belgium Denmark FranceGermany Luxembourg NetherlandsUnited Kingdom
WSEAS TRANSACTIONS on BUSINESS and ECONOMICS László Berényi
E-ISSN: 2224-2899 105 Volume 15, 2018
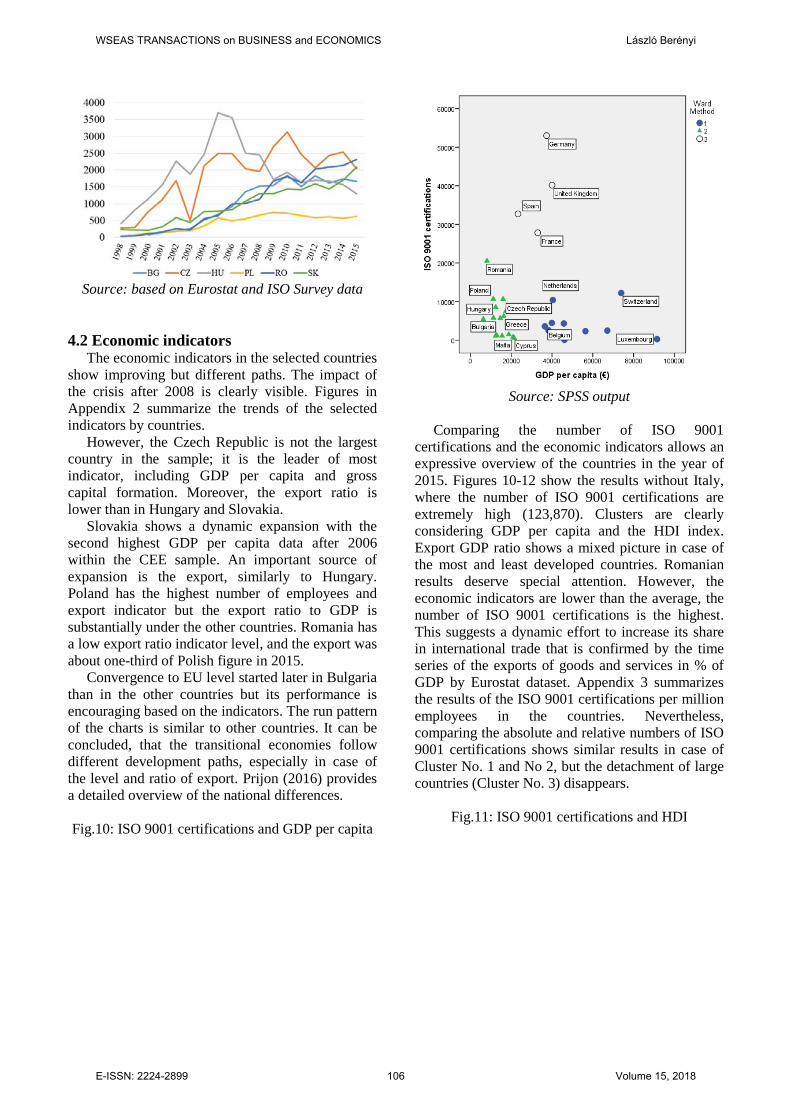
Source: based on Eurostat and ISO Survey data
4.2 Economic indicators
The economic indicators in the selected countries show improving but different paths. The impact of the crisis after 2008 is clearly visible. Figures in Appendix 2 summarize the trends of the selected indicators by countries.
However, the Czech Republic is not the largest country in the sample; it is the leader of most indicator, including GDP per capita and gross capital formation. Moreover, the export ratio is lower than in Hungary and Slovakia.
Slovakia shows a dynamic expansion with the second highest GDP per capita data after 2006 within the CEE sample. An important source of expansion is the export, similarly to Hungary. Poland has the highest number of employees and export indicator but the export ratio to GDP is substantially under the other countries. Romania has a low export ratio indicator level, and the export was about one-third of Polish figure in 2015.
Convergence to EU level started later in Bulgaria than in the other countries but its performance is encouraging based on the indicators. The run pattern of the charts is similar to other countries. It can be concluded, that the transitional economies follow different development paths, especially in case of the level and ratio of export. Prijon (2016) provides a detailed overview of the national differences. Fig.10: ISO 9001 certifications and GDP per capita
Source: SPSS output
Comparing the number of ISO 9001
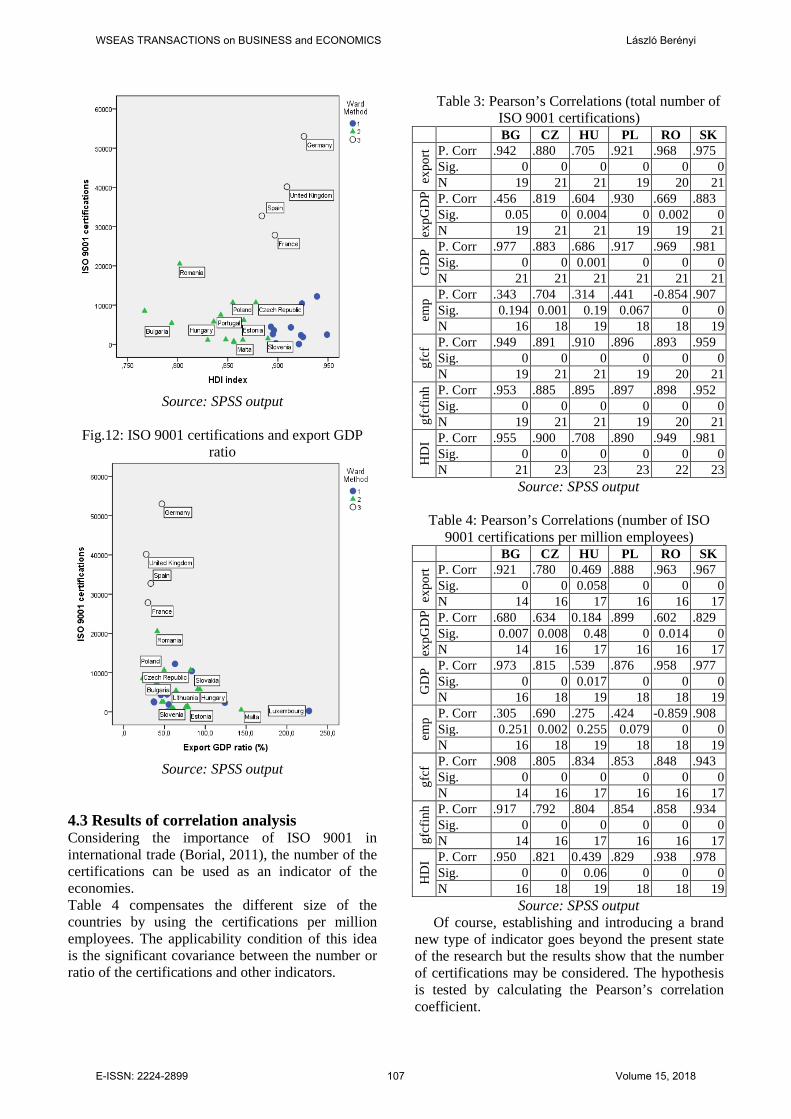
certifications and the economic indicators allows an expressive overview of the countries in the year of 2015. Figures 10-12 show the results without Italy, where the number of ISO 9001 certifications are extremely high (123,870). Clusters are clearly considering GDP per capita and the HDI index. Export GDP ratio shows a mixed picture in case of the most and least developed countries. Romanian results deserve special attention. However, the economic indicators are lower than the average, the number of ISO 9001 certifications is the highest. This suggests a dynamic effort to increase its share in international trade that is confirmed by the time series of the exports of goods and services in % of GDP by Eurostat dataset. Appendix 3 summarizes the results of the ISO 9001 certifications per million employees in the countries. Nevertheless, comparing the absolute and relative numbers of ISO 9001 certifications shows similar results in case of Cluster No. 1 and No 2, but the detachment of large countries (Cluster No. 3) disappears.
Fig.11: ISO 9001 certifications and HDI
WSEAS TRANSACTIONS on BUSINESS and ECONOMICS László Berényi
E-ISSN: 2224-2899 106 Volume 15, 2018
Source: SPSS output
Fig.12: ISO 9001 certifications and export GDP
ratio
Source: SPSS output
4.3 Results of correlation analysis Considering the importance of ISO 9001 in international trade (Borial, 2011), the number of the certifications can be used as an indicator of the economies. Table 4 compensates the different size of the countries by using the certifications per million employees. The applicability condition of this idea is the significant covariance between the number or ratio of the certifications and other indicators.
Table 3: Pearson’s Correlations (total number of ISO 9001 certifications)
BG CZ HU PL RO SK
expo
rt P. Corr .942 .880 .705 .921 .968 .975 Sig. 0 0 0 0 0 0 N 19 21 21 19 20 21
expG
DP P. Corr .456 .819 .604 .930 .669 .883
Sig. 0.05 0 0.004 0 0.002 0 N 19 21 21 19 19 21
GD
P P. Corr .977 .883 .686 .917 .969 .981 Sig. 0 0 0.001 0 0 0 N 21 21 21 21 21 21
emp P. Corr .343 .704 .314 .441 -0.854 .907
Sig. 0.194 0.001 0.19 0.067 0 0 N 16 18 19 18 18 19
gfcf
P. Corr .949 .891 .910 .896 .893 .959 Sig. 0 0 0 0 0 0 N 19 21 21 19 20 21
gfcf
inh P. Corr .953 .885 .895 .897 .898 .952
Sig. 0 0 0 0 0 0 N 19 21 21 19 20 21
HD
I P. Corr .955 .900 .708 .890 .949 .981 Sig. 0 0 0 0 0 0 N 21 23 23 23 22 23
Source: SPSS output
Table 4: Pearson’s Correlations (number of ISO 9001 certifications per million employees)
BG CZ HU PL RO SK
expo
rt P. Corr .921 .780 0.469 .888 .963 .967 Sig. 0 0 0.058 0 0 0 N 14 16 17 16 16 17
expG
DP P. Corr .680 .634 0.184 .899 .602 .829
Sig. 0.007 0.008 0.48 0 0.014 0 N 14 16 17 16 16 17
GD
P P. Corr .973 .815 .539 .876 .958 .977 Sig. 0 0 0.017 0 0 0 N 16 18 19 18 18 19
emp P. Corr .305 .690 .275 .424 -0.859 .908
Sig. 0.251 0.002 0.255 0.079 0 0 N 16 18 19 18 18 19
gfcf
P. Corr .908 .805 .834 .853 .848 .943 Sig. 0 0 0 0 0 0 N 14 16 17 16 16 17
gfcf
inh P. Corr .917 .792 .804 .854 .858 .934
Sig. 0 0 0 0 0 0 N 14 16 17 16 16 17
HD
I P. Corr .950 .821 0.439 .829 .938 .978 Sig. 0 0 0.06 0 0 0 N 16 18 19 18 18 19
Source: SPSS output Of course, establishing and introducing a brand
new type of indicator goes beyond the present state of the research but the results show that the number of certifications may be considered. The hypothesis is tested by calculating the Pearson’s correlation coefficient.
WSEAS TRANSACTIONS on BUSINESS and ECONOMICS László Berényi
E-ISSN: 2224-2899 107 Volume 15, 2018
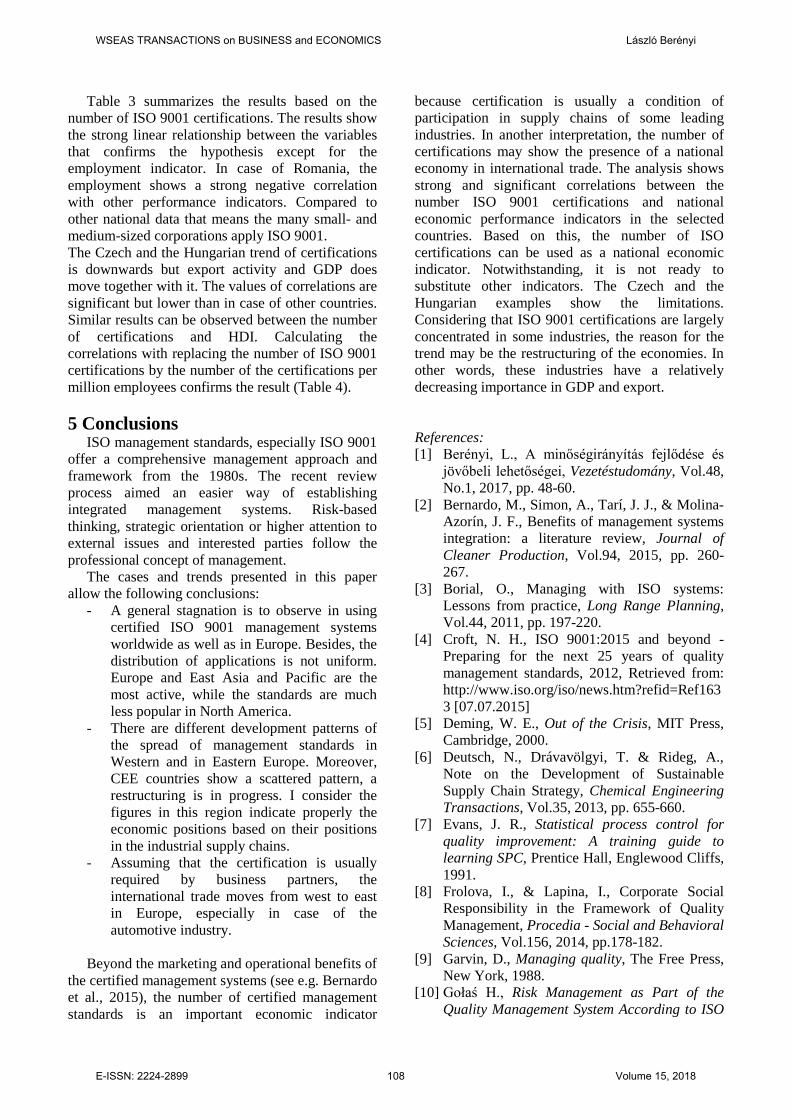
Table 3 summarizes the results based on the number of ISO 9001 certifications. The results show the strong linear relationship between the variables that confirms the hypothesis except for the employment indicator. In case of Romania, the employment shows a strong negative correlation with other performance indicators. Compared to other national data that means the many small- and medium-sized corporations apply ISO 9001. The Czech and the Hungarian trend of certifications is downwards but export activity and GDP does move together with it. The values of correlations are significant but lower than in case of other countries. Similar results can be observed between the number of certifications and HDI. Calculating the correlations with replacing the number of ISO 9001 certifications by the number of the certifications per million employees confirms the result (Table 4). 5 Conclusions
ISO management standards, especially ISO 9001 offer a comprehensive management approach and framework from the 1980s. The recent review process aimed an easier way of establishing integrated management systems. Risk-based thinking, strategic orientation or higher attention to external issues and interested parties follow the professional concept of management.
The cases and trends presented in this paper allow the following conclusions:
- A general stagnation is to observe in using certified ISO 9001 management systems worldwide as well as in Europe. Besides, the distribution of applications is not uniform. Europe and East Asia and Pacific are the most active, while the standards are much less popular in North America.
- There are different development patterns of the spread of management standards in Western and in Eastern Europe. Moreover, CEE countries show a scattered pattern, a restructuring is in progress. I consider the figures in this region indicate properly the economic positions based on their positions in the industrial supply chains.
- Assuming that the certification is usually required by business partners, the international trade moves from west to east in Europe, especially in case of the automotive industry.
Beyond the marketing and operational benefits of
the certified management systems (see e.g. Bernardo et al., 2015), the number of certified management standards is an important economic indicator
because certification is usually a condition of participation in supply chains of some leading industries. In another interpretation, the number of certifications may show the presence of a national economy in international trade. The analysis shows strong and significant correlations between the number ISO 9001 certifications and national economic performance indicators in the selected countries. Based on this, the number of ISO certifications can be used as a national economic indicator. Notwithstanding, it is not ready to substitute other indicators. The Czech and the Hungarian examples show the limitations. Considering that ISO 9001 certifications are largely concentrated in some industries, the reason for the trend may be the restructuring of the economies. In other words, these industries have a relatively decreasing importance in GDP and export. References: [1] Berényi, L., A minőségirányítás fejlődése és
jövőbeli lehetőségei, Vezetéstudomány, Vol.48, No.1, 2017, pp. 48-60.
[2] Bernardo, M., Simon, A., Tarí, J. J., & Molina-Azorín, J. F., Benefits of management systems integration: a literature review, Journal of Cleaner Production, Vol.94, 2015, pp. 260-267.
[3] Borial, O., Managing with ISO systems: Lessons from practice, Long Range Planning, Vol.44, 2011, pp. 197-220.
[4] Croft, N. H., ISO 9001:2015 and beyond - Preparing for the next 25 years of quality management standards, 2012, Retrieved from: http://www.iso.org/iso/news.htm?refid=Ref1633 [07.07.2015]
[5] Deming, W. E., Out of the Crisis, MIT Press, Cambridge, 2000.
[6] Deutsch, N., Drávavölgyi, T. & Rideg, A., Note on the Development of Sustainable Supply Chain Strategy, Chemical Engineering Transactions, Vol.35, 2013, pp. 655-660.
[7] Evans, J. R., Statistical process control for quality improvement: A training guide to learning SPC, Prentice Hall, Englewood Cliffs, 1991.
[8] Frolova, I., & Lapina, I., Corporate Social Responsibility in the Framework of Quality Management, Procedia - Social and Behavioral Sciences, Vol.156, 2014, pp.178-182.
[9] Garvin, D., Managing quality, The Free Press, New York, 1988.
[10] Gołaś H., Risk Management as Part of the Quality Management System According to ISO
WSEAS TRANSACTIONS on BUSINESS and ECONOMICS László Berényi
E-ISSN: 2224-2899 108 Volume 15, 2018
9001. In: Stephanidis C. (ed.) HCI International 2014 - Posters’ Extended Abstracts. HCI 2014. Communications in Computer and Information Science, Vol.435, Springer, Cham, 2014.
[11] Görög, M., A strategic-oriented implementation of projects, Project Management Institute, Newton Square, 2013.
[12] Hakes, C., The EFQM Excellence Model for Assessing Organizational Performance: A Management Guide, Van Haren, Zaltbommel, 2007.
[13] Heidrich, B., Nádor, É., Somogyi, A. & Mester, Cs., Szolgáltatás menedzsment, Human Telex Consulting, Budapest, 2006.
[14] Holátová, D., Březinová, M. & Kantnerová, L., Strategic management of small and medium-sized enterprises, WSEAS Transactions on Business and Economics, Vol.12, 2015., pp. 65-73.
[15] Hunt, L., ISO 9001:2015 – New Terminology, Not a Change in Requirements, 2014, Retrieved from: http://asq.org/blog/2014/11/ iso-9001terminology/ [07.10. 2015]
[16] Kear, F. W., Statistical process control in manufacturing practice, Marcel Dekker, New York, 1998.
[17] Koczor, Z., Minőségirányítási rendszerek fejlesztése, TÜV Rehiland Intercert, Budapest, 2001.
[18] Kotler, P. & Lee, N., Corporate Social Responsibility: Doing the Most Good for Your Company and Your Cause, Wiley, Hoboken, 2005.
[19] Lengyel, B., The Hungarian ICT Sector: A Comparative CEE Perspective with Special Emphasis on Structural Change. In: Welfens P. J. J. (ed.), Clusters in automotive and information & communication technology: innovation, multinationalization and networking dynamics, Springer, Heidelberg, 2012, pp. 61-88.
[20] Lipták, K., Analyzing the Labour Market Situation in the Central and Eastern European Countries – Improvement or Decline?, Theory, Methodology, Practice – Club of Economics in Miskolc, Vol.8, No.1, 2012, pp. 33-40.
[21] Human Development Report 2016: Human Development for Everyone, UNDP, 2016.
[22] Montgomery, D. C., Statistical Quality Control, 7th edition, John Wiley & Sons, Hoboken, 2012.
[23] Our common future, WCED, Geneva, 1987. [24] Ozusaglam, S., Robin, S. & Wong, C. Y., Early
and late adopters of ISO 14001-type standards: revisiting the role of firm characteristics and
capabilities, The Journal of Technology Transfer, 2017, DOI 10.1007/s10961-017-9560-5
[25] Peters, T. J. & Waterman, R. H., In search of Excellence, Warner Books, New York, 1984.
[26] Prijon, L., Macroeconomic indicators within economic transition in CEE countries, WSEAS Transactions on Business and Economics, Vol.13, 2016, pp. 355-371.
[27] Probáld F. & Szabó P., Európa térszerkezetének modelljei. In: Dövényi Z. & Schweitzer, F. (eds.), A földrajz dimenziói, MTA Földrajztudományi Kutatóintézet, Budapest, 2005, pp. 159-170.
[28] Rechnitzer, J. & Smahó, M. (eds.), Vehicle Industry and Competitiveness of Regions in Central and Eastern Europe, Széchenyi István University, Győr, 2012.
[29] Rothery, B., ISO 14000 and ISO 9000, Gower, England, 1995.
[30] Sass, M., Emerging CEE Multinationals in the Electronics Industry. In: Trąpczyński, P. et al. (eds.), Competitiveness of CEE Economies and Businesses, 2016, DOI 10.1007/978-3-319-39654-5_8.
[31] Shewhart, W., Economic control of quality of manufactured product, D. Van Nostrand Company, New York, 1931.
[32] Stehrer, R., Leinter, S., Marcias, M., Mirza, D. & Stöllinger, R., The Future Development of EU Industry in a Global Context, Vienna Institute for International Economic, Vienna, 2016.
[33] Szalavetz, A., The Hungarian Automotive Sector: A Comparative CEE Perspective with Special Emphasis on Structural Change. In: Welfens P. J. J. (ed.), Clusters in automotive and information & communication technology: innovation, multinationalization and networking dynamics, Springer, Heidelberg, 2012, pp. 241-270.
[34] Szolnoki, B.: Mennyire elégedett a vendég? Egy hazai szálloda szolgáltatásai minőségének vizsgálata, Minőség és Megbízhatóság, Vol.48, No.1-2, 2015, pp. 48-56.
[35] Tenner, A. R. & DeToro, I. J., Total quality management: three steps to continuous improvement, Addison-Wesley, Reading Mass, 1995.
[36] Tóth, T., Minőségmenedzsment és informatika, Műszaki Könyvkiadó, Budapest, 1999.
[37] Weckenmann, A., Akkasoglu, G. & Werner, T., Quality management- history and trends, The TQM Journal, Vol.27, No.3, 2015, pp. 281-293.
WSEAS TRANSACTIONS on BUSINESS and ECONOMICS László Berényi
E-ISSN: 2224-2899 109 Volume 15, 2018
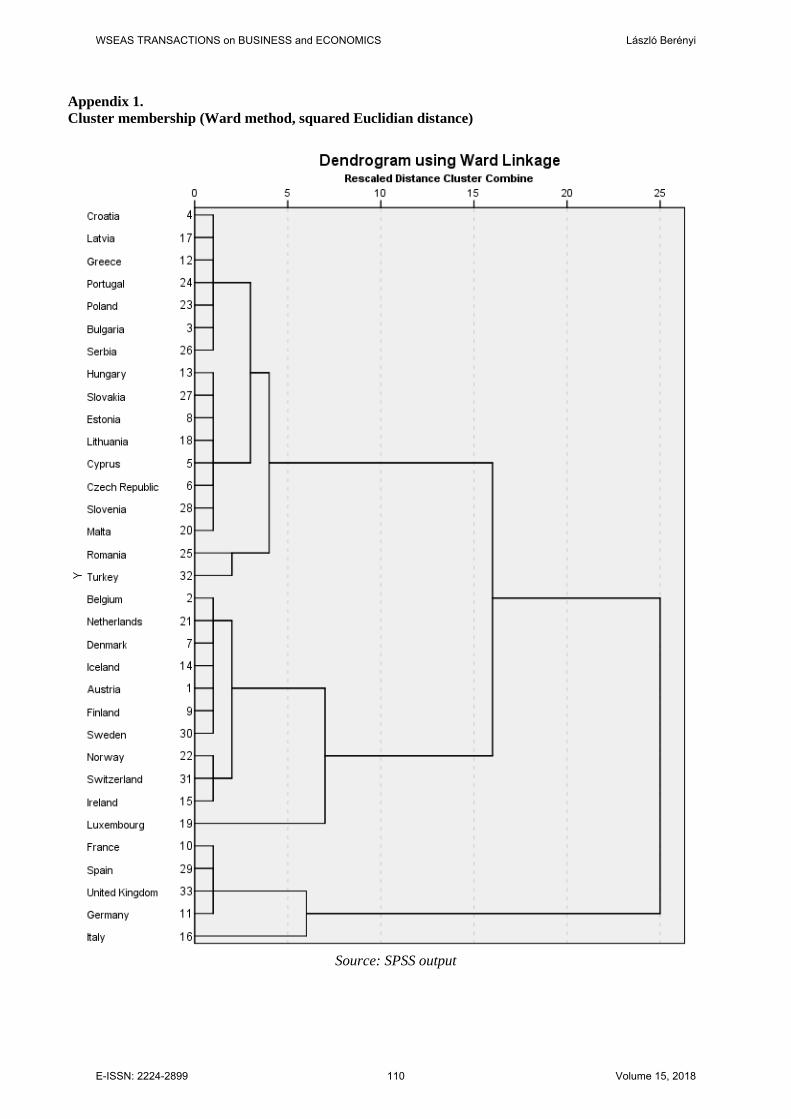
Appendix 1. Cluster membership (Ward method, squared Euclidian distance)
Source: SPSS output
WSEAS TRANSACTIONS on BUSINESS and ECONOMICS László Berényi
E-ISSN: 2224-2899 110 Volume 15, 2018
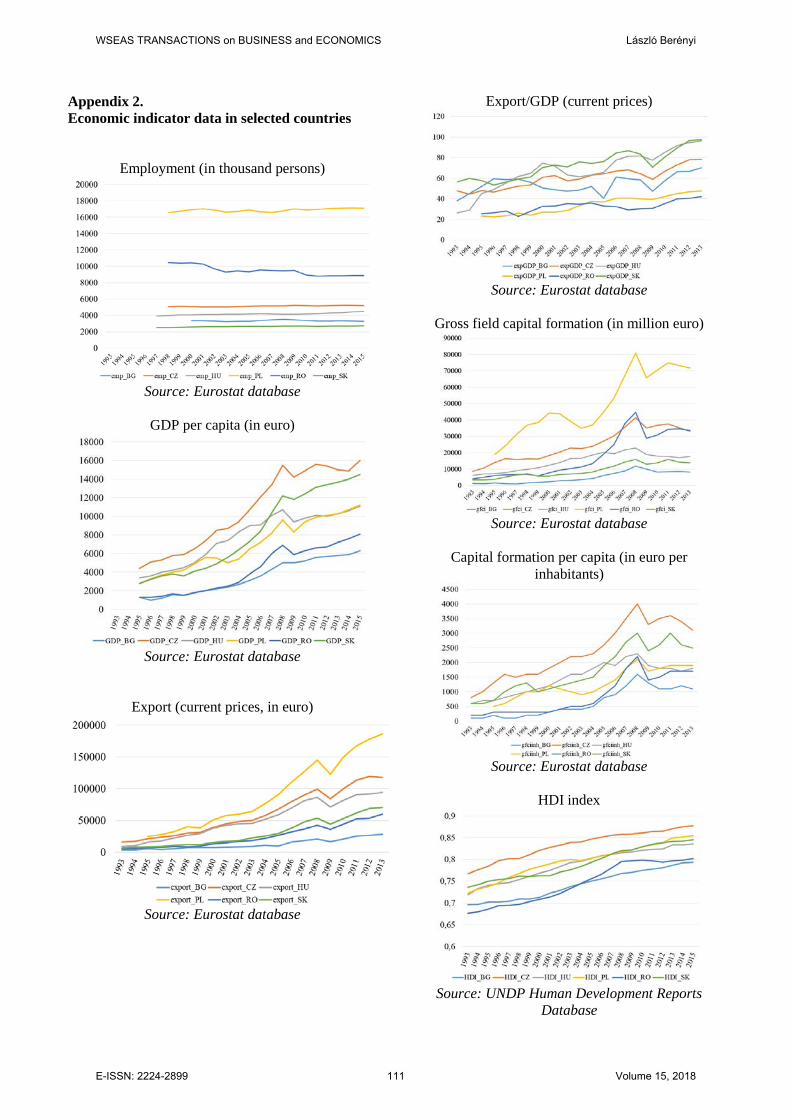
Appendix 2. Economic indicator data in selected countries
Employment (in thousand persons)
Source: Eurostat database
GDP per capita (in euro)
Source: Eurostat database
Export (current prices, in euro)
Source: Eurostat database
Export/GDP (current prices)
Source: Eurostat database
Gross field capital formation (in million euro)
Source: Eurostat database
Capital formation per capita (in euro per
inhabitants)
Source: Eurostat database
HDI index
Source: UNDP Human Development Reports
Database
WSEAS TRANSACTIONS on BUSINESS and ECONOMICS László Berényi
E-ISSN: 2224-2899 111 Volume 15, 2018
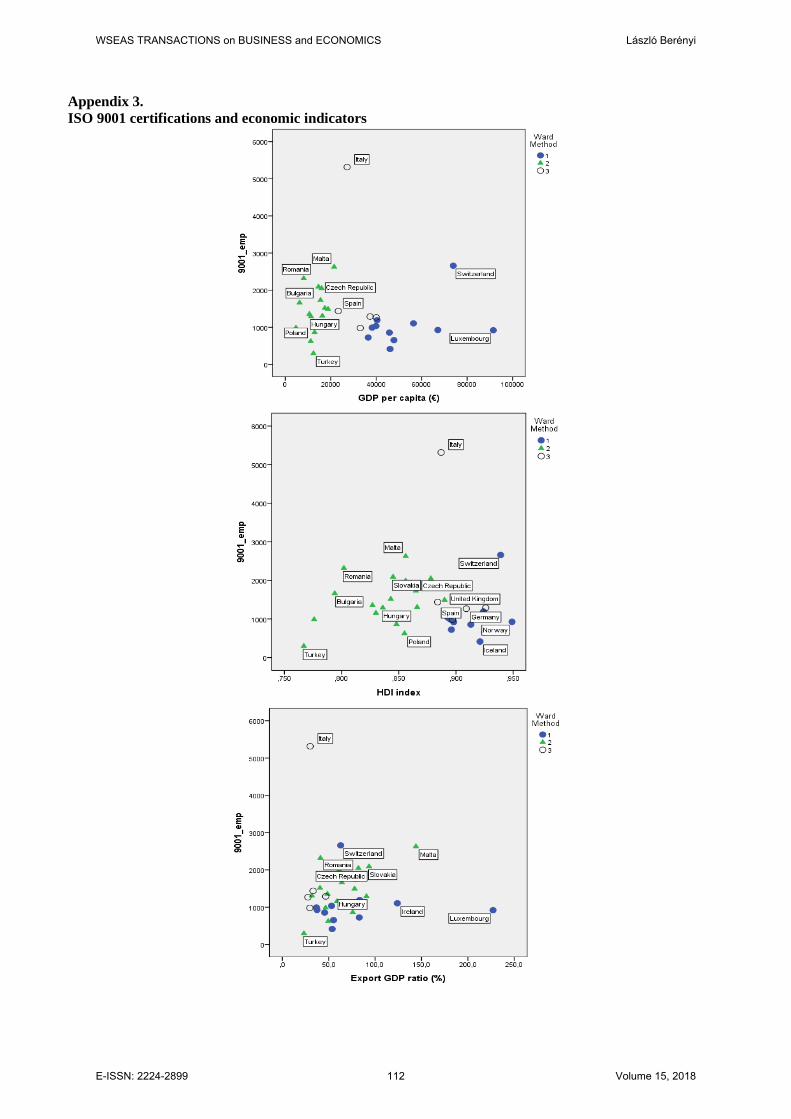
Appendix 3. ISO 9001 certifications and economic indicators
WSEAS TRANSACTIONS on BUSINESS and ECONOMICS László Berényi
E-ISSN: 2224-2899 112 Volume 15, 2018