relationships between hr and v˙o2 in the obese
TRANSCRIPT

Clinically Relevant
Relationships between HR and V̇O2 inthe obese
NUALA M. BYRNE and ANDREW P. HILLS
School of Human Movement Studies, Faculty of Health, Queensland University of Technology, Brisbane, QLD,AUSTRALIA; and Division of Metabolism and Physiology, Department of Nutrition Sciences, University of Alabama atBirmingham, Birmingham, AL
ABSTRACT
BYRNE, N. M., and A. P. HILLS. Relationships between HR and V̇O2 in the obese. Med. Sci. Sports Exerc., Vol. 34, No. 9, pp.1419–1427, 2002. Purpose: To enable more targeted exercise prescription for the obese, the purpose of this study was to considerrelationships between relative indices of V̇O2peak, V̇O2R, HRpeak, and HRR in a sample of obese adults. In particular, the study aimedto determine whether %HRR was equivalent to %V̇O2peak or %V̇O2R. A further aim was to evaluate whether the %V̇O2peak-%HRpeak
relationship defined by the ACSM holds in the obese population, or whether there is a deviation in this relationship as is noted inindividuals with low functional capacity. Finally, the study aimed to determine the degree of variability in relative workload relatingto lactate threshold (LT). Methods: Thirty-two sedentary obese adults, 17 women and 15 men (42.1 � 9.6 yr; 37.4 � 5.7kg·m�2)attended a testing session each week for 3 wk. The three sessions involved 1) familiarization with testing protocols; 2) graded treadmilltests to evaluate submaximal and peak cardiorespiratory capacity; and 3) assessment of body composition via deuterium dilution, andresting HR (HRrest) and oxygen consumption (V̇O2rest) collected during assessment of resting metabolic rate (RMR) via a ventilatedhood system. Results: The primary findings were that in the obese: 1) the %HRpeak-%V̇O2peak relationship was significantly greaterthan the ACSM recommendations, 2) the %HRR was equivalent with %V̇O2R not %V̇O2peak, and 3) exercise prescription at fixedpercentages of V̇O2peak or HRpeak corresponded with wide ranges of exercise intensities in relation to LT. Conclusions: Therelationships between cardiorespiratory parameters defined in normal weight populations differ to some degree in the obese, and thishas implications both for optimizing exercise intensity for weight loss and exercise adherence in obese adults. Key Words: EXERCISEPRESCRIPTION, OBESITY, SUBMAXIMAL MARKERS, LACTATE THRESHOLD, EXERCISE INTENSITY
Cardiorespiratory capacity is recognized as an impor-tant component of health-related fitness and a rele-vant parameter against which exercise prescription
can be referenced (1). In the main, cardiovascular responsesto exercise are directly proportional to oxygen demands ofskeletal musculature, with oxygen uptake (V̇O2) and heartrate (HR) increasing linearly with work rate. Given thisrelationship, HR is commonly used as a practical way ofprescribing and monitoring exercise at specific intensities.
The 1991 ACSM Position Statement recommended thatapparently healthy adults exercise at intensities within 40–85% of maximal oxygen consumption (V̇O2max), with 40,50, 70, 80, and 85% V̇O2max proposed to correspond with55, 62, 70, 85, and 90% of maximal HR (HRmax), respec-tively. The scientific bases for these recommendationsstemmed from a number of studies that utilized regression
equations to determine %V̇O2max from %HRmax
(8,9,12,13,19,20). Swain and colleagues (23) proposed thatthe methods by which the values for %HRmax were derivedare flawed. In particular, projecting target %HRmax valuesfor a given %V̇O2max requires that the equation be trans-posed. Transposition of the relationship in this way is notmathematically sound. Further, it was noted that in thefoundation studies, the data from all subjects was collec-tively analyzed to produce a single regression for the group.Swain and Leutholtz (24) suggested that it is more appro-priate to perform a linear regression for each subject andwith the resulting data (slopes and intercepts), calculatetarget %HRmax values for each individual, from which meangroup values can be determined. In undertaking such anal-yses on data collected from 162 apparently healthy men andwomen aged between 18 and 34 yr, Swain and Leutholtz(24) found the values obtained for %HRmax were signifi-cantly greater than the ACSM recommendations at all pro-portions of V̇O2max. Similar inconsistencies have been notedin untrained individuals suffering from chronic obstructivepulmonary disease (COPD) where percentages of peak HR(HRpeak) at 50, 60, and 80% (but not 85%) peak aerobiccapacity (V̇O2peak) were significantly higher than ACSMrecommendations (21).
0195-9131/02/3409-1419/$3.00/0MEDICINE & SCIENCE IN SPORTS & EXERCISE®
Copyright © 2002 by the American College of Sports Medicine
Submitted for publication July 2001.Accepted for publication May 2002.
DOI: 10.1249/01.MSS.0000027629.94800.17
1419
Alternative approaches have been employed in the utili-zation of HR for prescriptive purposes. Work undertaken byKarvonen and colleagues (11) examined the HR responsesof six young men to exercise training and expressed theexercise HR as a percentage of the difference between restand maximum, since referred to as the HR reserve (HRR).Although no measures of oxygen consumption were made,the equivalency of %HRR to %V̇O2max has since beenwidely assumed and accepted despite inconsistent findings(17,27,28). Swain and Leutholtz (24) demonstrated in agroup of 63 apparently healthy young men and women agedbetween 18 and 40 yr that %HRR was not equivalent to%V̇O2max, finding the %HRR values were significantlylower than the %V̇O2peak at the same workload. In contrast,when aerobic capacity expressed as a percentage of thedifference between rest and maximal values (V̇O2 reserve,V̇O2R) was compared with proportional HRR, no differ-ences existed. Subsequently, the ACSM published the up-dated Position Statement in 1998 cognisant of thesefindings.
The latest Position Statement from the ACSM regardingexercise prescription to develop and maintain cardiorespi-ratory fitness, muscular fitness, and flexibility in healthyadults identified the following guidelines for the intensity oftraining: 50/65%–90% of maximum heart rate (HRmax), or40/50%–85% of maximum oxygen uptake reserve (V̇O2R)or HRmax reserve (HRR). Aside from work undertaken withindividuals suffering from COPD, there is little evidence forthe relationship between parameters of cardiovascular andaerobic capacity in populations who commonly display alow functional capacity. The current ACSM guidelines sim-ply suggest that the lower-intensity values, that is, 40–49%of V̇O2R or HRR and 55–64% of HRmax, are most appli-cable to individuals who are quite unfit. The limited workcompleted with clinical populations means that a reevalua-tion of these relationships in populations such as the obeseis warranted.
In the two studies to date that have examined the rela-tionship between percentages of peak HRR and V̇O2R,resting data were collected during 5 min of seated restimmediately before a maximal incremental cycle ergometrytest (18,24), and resting HR (HRrest) measured after 30 minof seated rest (18). Given that two of the intensity prescrip-tion approaches employ percentages of HR or V̇O2 reserveto investigate the relationships between these HR and V̇O2
parameters accurately, inclusion of true resting values isrequired. Ideally, the resting data used in the calculation ofHRR and V̇O2R should be obtained during measurement ofRMR.
Although the underlying mechanisms of the lactatethreshold (LT) have been the focus of considerable aca-demic debate, it is considered a valid physiological break-point or phase that reflects the workload at which the rate oflactate synthesis exceeds the rate of clearance, resulting inlactate and H� accumulation (15,26). Consequently, it maycorrespond with the optimal exercise intensity for the obeseas it may reflect the intensity of maximum energy expen-diture while still being tolerable for extended periods of time
(10). In a group of cyclists and triathletes, Meyer andcolleagues (14) demonstrated that workload described bycommonly employed training thresholds reflected wideranges of exercise intensity as defined by LT. As a result, areliance on certain intensities described by specific percent-ages of V̇O2max or HRmax meant some athletes were work-ing well below, and others well above, the LT. Whether thissame degree of variability is characteristic of the obese hasnot been reported.
To enable more targeted exercise prescription for theobese, the purpose of this study was to consider relation-ships between relative indices of V̇O2peak, V̇O2R, HRpeak,and HRR in a sample of obese adult men and women. Inparticular, the study aimed to determine whether %HRRwas equivalent to %V̇O2peak or %V̇O2R. A further aim wasto evaluate whether the %V̇O2peak-%HRpeak relationshipdefined by the ACSM holds in the obese population, orwhether there is a deviation in this relationship as was foundin chronic obstructive pulmonary disease patients. Finally,the study aimed to determine the degree of variability inrelative proportions of maximal cardiorespiratory capacityat the LT.
METHODS
Subjects. Thirty-two sedentary obese adults, 17 womenand 15 men (42.1 � 9.6 yr; 37.4 � 5.7 kg·m�2) wererecruited for the study and gave informed written consent toparticipate in accordance with the University Ethics Com-mittee guidelines. The subjects volunteered after respondingto press releases on local radio and in local newspapers, andattending information evenings at the Human MovementStudies Clinic, Queensland University of Technology. Re-spondents were ineligible for inclusion if they were preg-nant or lactating, nonambulatory, or taking medicationknown to affect heart rate, body composition, or electrolytebalance. Eligibility was also dependent upon being euthy-roid, nondiabetic, a nonsmoker, having BMI � 30 kg·m�2,and having been weight stable (� 2 kg) and sedentary for atleast 6 months before recruitment. Sedentary was defined asno regular physical activity (�2 times per week) in the past12 months, including work-related physical activity. De-scriptive data of the subjects are presented in Table 1.
Study design. Subjects were required to attend a testingsession each week for 3 wk. For each subject, the sessionswere scheduled for the same time of day and day of theweek to remove any influence of diurnal variations andcarry-over effects of the previous testing session. The threesessions involved: 1) a treadmill test to assist in subjectfamiliarization; the test enabled researchers to gauge work-ing capacity and enable subjects to become accustomed withthe treadmill and gas analysis apparatus; 2) a discontinuousgraded treadmill test to assess cardiorespiratory function;and 3) assessment of body composition and RMR.
Study methods. Subjects reported to the Universitylaboratory a minimum of 3 h after their last food or fluidintake, wearing light-weight, comfortable clothing, havingabstained from strenuous exercise and consumption of caf-
1420 Official Journal of the American College of Sports Medicine http://www.acsm-msse.org

feine, alcohol, or salty foods in the previous 12 h, andhaving voided a maximum of 10 min prior. Before thebeginning of each treadmill test, subjects were familiarizedwith the Borg 6–20 scale for the rating of perceived exertion(RPE) (4) and fitted with a Hans-Rudolf headset (withtwo-way breathing valve and pneumotach), a nose clip, anda Polar Coded TransmitterTM (Polar Electro, Kempele, Fin-land). The discontinuous treadmill protocol (4-min workstages and 2-min rest periods) provided sufficient opportu-nities to address any subject concerns and minimize dis-comfort throughout the test. The mean difference betweenthe speed indicated by the treadmill and the speed calculatedby the testers was derived using the equation (cycles·min�1)� length of mat � m·min�1 and was found to be 0.04 �0.01 km·h�1 (0.0275 � 0.009 miles·h�1).
The age range of the subjects recruited for the study was21–65 yr. Thus, the predicted heart rate range of 55%HRmax
to HRmax equated with approximately 70–90 beats for thecurrent study population. The treadmill protocol was de-signed to gather data on both peak HR and V̇O2 values, andsteady state submaximal values. A protocol that employedbetween five and seven stages was considered optimal toachieve these requirements. Consequently, a discontinuousprotocol was deemed to be appropriate given the need tocollect lactate samples and the potential for low cardiore-spiratory capacity in the study population. Pilot work wasundertaken to identify an appropriate combination of tread-mill speed and grade to elicit the heart rate increase of10–15 beats·min�1 that was needed to achieve work span-ning the 55–100% of HRmax in five to seven stages. Nosingle treadmill speed achieved the protocol goals withconstant 2.5% increases in grade for all subjects. This ispartly due to the difference in stride length of the subjectstested, whose heights ranged from 1.54 to 1.89 m, and to thedifferences in functional mobility. Consequently, before thefamiliarization test, subjects were introduced to walking onthe treadmill, and at 0% grade a speed between 2 and 3.5miles·h�1 that elicited a heart rate of approximately55%·(220 � age) was identified for each subject.
In the familiarization session, the individually definedtreadmill speed remained constant throughout the test, andworkload was modified by gradient increases of 2.5% for
each stage, starting at 0%. On average, the workload in-creased by 0.5–0.875 METs (mechanical calculation) perstage. To ensure that the peak values obtained were repre-sentative of maximal capacity, the second testing sessionutilized the same protocol but started at a point two stagesbefore the predicted lactate threshold for each individual.The test data were accepted provided RER equalled orexceeded 1.10 and HR was greater than 85% of predictedmaximum. Three subjects were required to repeat the test asin each case one of these criteria was not met. HR wasrecorded every 5 s throughout the test by using a PolarVantageTM monitor (Polar Electro), and data were trans-ferred to a computer at the completion of each test. Respi-ratory gases were collected throughout the test using aQ-PLEX Gas Analysis System (Quinton Instrument Co.,Seattle, WA). The O2 and CO2 analyzers were calibratedbefore each test against known gas concentrations and theflowmeter calibrated against a 3.0-L syringe. Heart rate andrespiratory gases were averaged for the last 60 s of eachstage, and the highest average value for 30 s in the last stage(provided RER � 1.10) was recorded as the peak value.
Duplicate 0.5-mL samples of capillary blood obtained viathe finger-prick method were collected immediately at theend of each work stage. Samples were collected in a capil-lary tube after the finger had been cleansed with an alcoholswab and punctured with a lancet, and immediately depro-teinized in chilled perchloric acid and refrigerated. Bloodlactate concentrations were subsequently analyzed via anultraviolet endpoint method using the spectrophotometricassay procedure (7); 40 �L of clear supernatant was addedto 2 mL of reagent, vortexed and incubated for 45 min at37°C. The absorbance of NADH for the sample was read offa spectrophotometer using a UV lamp set at a wavelength of340 nm. The coefficient of variation for the repeated mea-sures was 4.3%. The LT was determined as described byBeaver et al. (2). Each blood lactate curve was divided intotwo data segments determined by visually identifying wherethe steep portion of the curve originated. The data pointbetween the two segments (the division point) was includedin both data sets. A straight line using linear regressionanalysis fit each data segment, and LT was identified as theintersection between these two lines. Identification of thedata segments, with subject status blinded, was undertakenindependently by three exercise physiologists and by theprimary investigator twice. Determinations by the primaryinvestigator were correlated with those made by the otherphysiologists, and the mean of these correlation coefficientswas calculated for inter-investigator reliability (r � 0.92).Intra-investigator reliability was determined from a corre-lation analysis performed on the two determinations by theprimary investigator (r � 0.99). Additionally, ANOVA re-vealed no significant differences among any of the testers inLT determination (P � 0.95). For each subject HR, V̇O2,and RPE were plotted against workload and linear regres-sion analyses conducted. The linear formulae were used todetermine the cardiorespiratory and perceived exertion val-ues corresponding with LT.
TABLE 1. Subject characteristics.a
All Subjects(N � 32)
Men(N � 15)
Women(N � 17)
Age (yr) 42.1 � 1.7 42.5 � 2.0 41.8 � 2.8Weight (kg) 108.8 � 3.5 117.1 � 5.3 101.4 � 4.7*BMI (kg�m�2) 37.4 � 1.0 37.6 � 1.5 37.2 � 1.3%MRW 170.8 � 4.5 171.7 � 6.7 170.0 � 6.4Body fat (%) 44.7 � 1.5 38.6 � 1.7 50.2 � 1.3***Fat mass (kg) 48.6 � 2.5 46.1 � 3.5 50.7 � 3.5FFM (kg) 59.4 � 1.3 70.6 � 1.4 49.5 � 2.1***HRrest (beats�min�1) 63.4 � 2.0 65.5 � 2.6 62.2 � 2.9HRpeak (beats�min�1) 170.4 � 3.9 169.0 � 4.3 172.6 � 4.1V̇O2rest (mL�kg�1�min�1) 2.61 � 0.06 2.78 � 0.10 2.46 � 0.07**V̇O2rest (mL�kg�1 FFM�min�1) 4.81 � 0.10 4.58 � 0.12 5.01 � 0.15V̇O2peak (mL�kg�1�min�1) 26.71 � 0.91 30.28 � 1.47 21.68 � 1.13***V̇O2peak (mL�kg�1 FFM�min�1) 49.09 � 1.90 50.17 � 2.86 48.13 � 2.53
a Values are means � SEM; t-test, analyses between men and women; FFM, fat-freemass.* P � 0.05; ** P � 0.01; *** P � 0.001.
SUBMAXIMAL MARKERS OF EXERCISE INTENSITY Medicine & Science in Sports & Exercise� 1421

Measurements of body height (stretch stature) to thenearest 0.1 cm using a Harpenden stadiometer, and bodyweight to the nearest 5 g recorded on a digital scale, weretaken. Body composition was determined from measure-ments of total body water (TBW) by using stable, nonra-dioactive, nontoxic isotope deuterium (2H2O). Subjectsorally consumed a dose equating 0.05 g·kg�1 body weightof 2H2O. A single urine sample was obtained before the doseand subsequently 4–6 h postdose. The enrichment of 2H2Oin the predose and postdose samples was assessed usingisotope ratio mass spectrometry to determine TBW (30). Allassays were performed in triplicate with repeat assays in ourlaboratory demonstrating CV of �2.0% at low enrichmentlevels and �1% for higher values. TBW values were usedto calculate FFM assuming a 73% hydration factor.
Resting O2 consumption (V̇O2rest) values were recordedduring RMR assessment by using a ventilated hood system(Deltatrac II, Datex, Helsinki, Finland), which included aparamagnetic O2 sensor and an infrared CO2 analyzer, anda mass flow meter that allows for a variable flow of airthrough the system. Measurement of RMR with this devicefor the between-day testing in our laboratory is reproduciblewith an interindividual coefficient of variation of 2.7 �0.6%. Before RMR measurement, subjects rested for 45 minduring a whole-body DXA scan (data not presented here).The analyzer was calibrated before each measurement withstandardized gases. Directly after the DXA scan, subjects
were fitted with a Polar Coded TransmitterTM (Polar Elec-tro), and a transparent hood connected to the device wasplaced over the head of the subjects. After 10-min adapta-tion to the hood, the RMR was measured from oxygenconsumption, and carbon dioxide production was analyzedcontinuously for 30 min. Data for the last 10 min of themeasurement period was used for analyses.
Data analysis. There has been an increased recognitionof the need to calculate relationships based on individualdata rather than on pooled group data. Hence, analyses wereundertaken for each subject, with relationships between HR,V̇O2, and blood lactate investigated independently thenpooled to obtain mean group values. For each individual,HR and V̇O2 values for the end of each stage were expressedas a percentage of peak values. Linear regressions wereperformed for each of the 32 subjects by using the paired%HRpeak and %V̇O2peak data points at each workload, with%V̇O2peak as the independent variable. Using the slope andintercept from each individual’s regression equation, per-centages of HRpeak corresponding to 40, 50, 60, 80, and 85%of V̇O2peak were determined for each subject. Similarly, foreach individual, HR and V̇O2 values for the end of eachstage were expressed as a percentage of HRR and V̇O2R,respectively.
The regression for the lactate-workload plot was under-taken using polynomial of third order (f � y0 � a·x � b·x2
� c·x3), and the resulting regression coefficients for indi-vidual subjects ranged between 0.97 and 0.99. The averagepredicted residual error sum of squares (PRESS statistic �2.4 � 0.4) demonstrated an acceptable level of the predic-tive ability of the model. The resulting formula individuallyserved as the basis for determining the lactate concentra-tions corresponding to the workloads for the tested propor-tions of V̇O2peak, HRpeak, V̇O2R, and HRR.
FIGURE 1—Regression lines illustratingthe relationship between %HRpeak and%V̇ O2peak as defined by ACSM and obesesubject data. Significant difference be-tween obese and ACSM %HRpeak-%V̇ O2peak relationship; * P < 0.01; **P <0.001.
TABLE 2. Percentages of HRpeak corresponding with designated percentages ofV̇O2peak.
Male Female
40% V̇O2max 58.8 � 1.3 58.5 � 1.150% V̇O2max 65.5 � 1.3 65.3 � 1.060% V̇O2max 72.2 � 1.3 72.1 � 1.080% V̇O2max 85.5 � 1.5 85.6 � 1.085% V̇O2max 88.9 � 1.5 89.0 � 1.0
1422 Official Journal of the American College of Sports Medicine http://www.acsm-msse.org

Statistical analysis. Given the differences in numbersof men and women in the total sample, all values are shownas means and standard error (SEM). Independent t-testswere used to identify gender differences in performance andbody composition variables. Three linear regressions wereperformed for each subject: 1) %HRpeak predicted from%V̇O2peak; 2) %HRR predicted from %V̇O2peak; and (3)%HRR predicted from %V̇O2R, with %V̇O2max or %V̇O2Ras the independent variable. By using the slope and interceptfrom each individual’s regression equation, percentages ofHRpeak or HRR corresponding to 40, 50, 60, 80, and 85% ofV̇O2peak or V̇O2R were determined for each subject. For thegroup, these values were compared with those used by theACSM using paired t-tests. Additionally, paired t-tests wereemployed to determine whether the mean (� SE) values forintercepts and slopes of the linear regressions of %HRR-%V̇O2R and %HRR-%V̇O2peak differed from 0 and 1, re-spectively (reflecting a difference from the line of identity).Further, by using independent samples t-tests, gender dif-ferences at derived %HRpeak and %HRR at each respective%V̇O2peak and %V̇O2R intensity, and mean (� SEM) valuesof the slopes and intercepts were assessed.
To determine any relationship between fitness level andthe determinations of %HRpeak and %HRR correspondingwith %V̇O2max or %V̇O2R, the regression intercepts wereindependently regressed against maximal aerobic capacityexpressed both as mL·kg�1·min�1 and mL·kgFFM�1·min�1. Further, the subjects were subdivided into
high, medium, and low fitness groups (11, 10, and 11subjects, respectively) in two separate analyses, first accord-ing to peak aerobic capacity V̇O2peak expressed asmL·kg�1·min�1, and then as mL·kg FFM�1·min�1. Valuesof %HRpeak and %HRR achieved by each subject at the fivedefined percentages of peak aerobic capacity and oxygenuptake reserve were compared in two separate one-wayrepeated measures ANOVAs followed by Bonferroni posthoc testing. Ranges are provided for the percentages ofV̇O2peak, HRpeak, V̇O2R, and HRR corresponding to indi-vidual LT, as well as the for the percentage of workload atupper (85%V̇O2peak and 90%HRpeak) and lower(50%V̇O2peak and 60%HRpeak) limits of the exercise inten-sity thresholds recommended by the ACSM correspondingto the workload at LT. For all statistical analyses, signifi-cance was judged at an alpha of 0.05.
RESULTS
A summary of the physiological characteristics of thesubject population as a group, and for each gender sepa-rately, is presented in Table 1.
%HRpeak predicted from %V̇O2peak. The mean(�SEM) of the 15 linear regressions from the men was:%HRmax � (0.643 � 0.010)%V̇O2max � (36.8 � 1.0), withr � 0.988 � 0.001; and for the 17 women: %HRmax �(0.628 � 0.014)%V̇O2max � (39.0 � 1.3), with r � 0.977� 0.010. The percentages of HRpeak that were obtained bythe subjects at designated percentages of V̇O2peak are shownin Table 2. Student t-tests demonstrated no gender differ-ences between the mean slopes (P � 0.75), intercepts (P �0.77), regression constants (P � 0.19), and %HRpeak valuesat 40% (P � 0.86), 50% (P � 0.90), 60% (P � 0.95), 80%(P � 0.95), and 85% (P � 0.93) V̇O2peak derived from theindividual regression equations. Consequently, the male and
FIGURE 2—Scatter plot and regressionlines for the %HRR predicted from%V̇O2peak for the highest fitness tertile (N� 11) and the lowest fitness tertile (N �11).
TABLE 3. Intercepts, slopes, and correlation coefficient of linear regression analysesfor %HRR predicted from %V̇O2peak and %HRR predictedfrom %V̇O2R.
Intercept SlopeCorrelationCoefficient
%HRR vs %V̇O2peak �10.0 � 0.9* 1.11 � 0.02** 0.991 � 0.002%HRR vs %V̇O2R �0.2 � 0.6 1.01 � 0.04 0.992 � 0.001
* Differs significantly from 0 (P � 0.01); ** differs significantly from 1 (P � 0.01).
SUBMAXIMAL MARKERS OF EXERCISE INTENSITY Medicine & Science in Sports & Exercise� 1423
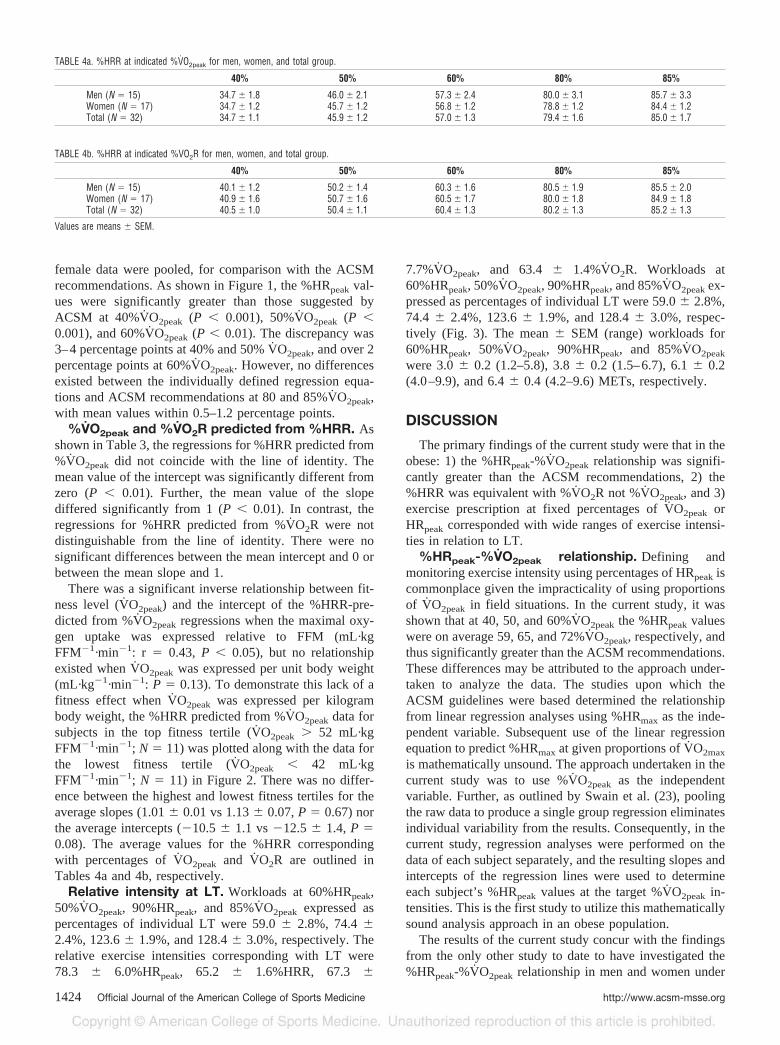
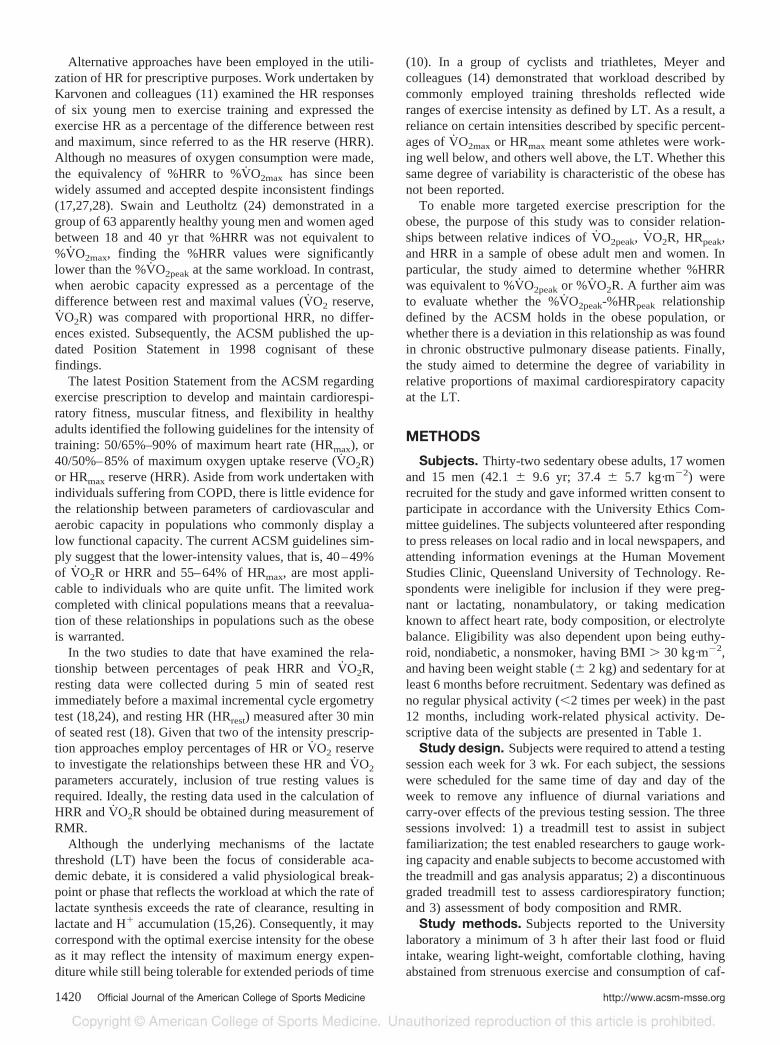
female data were pooled, for comparison with the ACSMrecommendations. As shown in Figure 1, the %HRpeak val-ues were significantly greater than those suggested byACSM at 40%V̇O2peak (P � 0.001), 50%V̇O2peak (P �0.001), and 60%V̇O2peak (P � 0.01). The discrepancy was3–4 percentage points at 40% and 50% V̇O2peak, and over 2percentage points at 60%V̇O2peak. However, no differencesexisted between the individually defined regression equa-tions and ACSM recommendations at 80 and 85%V̇O2peak,with mean values within 0.5–1.2 percentage points.
%V̇O2peak and %V̇O2R predicted from %HRR. Asshown in Table 3, the regressions for %HRR predicted from%V̇O2peak did not coincide with the line of identity. Themean value of the intercept was significantly different fromzero (P � 0.01). Further, the mean value of the slopediffered significantly from 1 (P � 0.01). In contrast, theregressions for %HRR predicted from %V̇O2R were notdistinguishable from the line of identity. There were nosignificant differences between the mean intercept and 0 orbetween the mean slope and 1.
There was a significant inverse relationship between fit-ness level (V̇O2peak) and the intercept of the %HRR-pre-dicted from %V̇O2peak regressions when the maximal oxy-gen uptake was expressed relative to FFM (mL·kgFFM�1·min�1: r � 0.43, P � 0.05), but no relationshipexisted when V̇O2peak was expressed per unit body weight(mL·kg�1·min�1: P � 0.13). To demonstrate this lack of afitness effect when V̇O2peak was expressed per kilogrambody weight, the %HRR predicted from %V̇O2peak data forsubjects in the top fitness tertile (V̇O2peak � 52 mL·kgFFM�1·min�1; N � 11) was plotted along with the data forthe lowest fitness tertile (V̇O2peak � 42 mL·kgFFM�1·min�1; N � 11) in Figure 2. There was no differ-ence between the highest and lowest fitness tertiles for theaverage slopes (1.01 � 0.01 vs 1.13 � 0.07, P � 0.67) northe average intercepts (�10.5 � 1.1 vs �12.5 � 1.4, P �0.08). The average values for the %HRR correspondingwith percentages of V̇O2peak and V̇O2R are outlined inTables 4a and 4b, respectively.
Relative intensity at LT. Workloads at 60%HRpeak,50%V̇O2peak, 90%HRpeak, and 85%V̇O2peak expressed aspercentages of individual LT were 59.0 � 2.8%, 74.4 �2.4%, 123.6 � 1.9%, and 128.4 � 3.0%, respectively. Therelative exercise intensities corresponding with LT were78.3 � 6.0%HRpeak, 65.2 � 1.6%HRR, 67.3 �
7.7%V̇O2peak, and 63.4 � 1.4%V̇O2R. Workloads at60%HRpeak, 50%V̇O2peak, 90%HRpeak, and 85%V̇O2peak ex-pressed as percentages of individual LT were 59.0 � 2.8%,74.4 � 2.4%, 123.6 � 1.9%, and 128.4 � 3.0%, respec-tively (Fig. 3). The mean � SEM (range) workloads for60%HRpeak, 50%V̇O2peak, 90%HRpeak, and 85%V̇O2peak
were 3.0 � 0.2 (1.2–5.8), 3.8 � 0.2 (1.5–6.7), 6.1 � 0.2(4.0–9.9), and 6.4 � 0.4 (4.2–9.6) METs, respectively.
DISCUSSION
The primary findings of the current study were that in theobese: 1) the %HRpeak-%V̇O2peak relationship was signifi-cantly greater than the ACSM recommendations, 2) the%HRR was equivalent with %V̇O2R not %V̇O2peak, and 3)exercise prescription at fixed percentages of V̇O2peak orHRpeak corresponded with wide ranges of exercise intensi-ties in relation to LT.
%HRpeak-%V̇O2peak relationship. Defining andmonitoring exercise intensity using percentages of HRpeak iscommonplace given the impracticality of using proportionsof V̇O2peak in field situations. In the current study, it wasshown that at 40, 50, and 60%V̇O2peak the %HRpeak valueswere on average 59, 65, and 72%V̇O2peak, respectively, andthus significantly greater than the ACSM recommendations.These differences may be attributed to the approach under-taken to analyze the data. The studies upon which theACSM guidelines were based determined the relationshipfrom linear regression analyses using %HRmax as the inde-pendent variable. Subsequent use of the linear regressionequation to predict %HRmax at given proportions of V̇O2max
is mathematically unsound. The approach undertaken in thecurrent study was to use %V̇O2peak as the independentvariable. Further, as outlined by Swain et al. (23), poolingthe raw data to produce a single group regression eliminatesindividual variability from the results. Consequently, in thecurrent study, regression analyses were performed on thedata of each subject separately, and the resulting slopes andintercepts of the regression lines were used to determineeach subject’s %HRpeak values at the target %V̇O2peak in-tensities. This is the first study to utilize this mathematicallysound analysis approach in an obese population.
The results of the current study concur with the findingsfrom the only other study to date to have investigated the%HRpeak-%V̇O2peak relationship in men and women under
TABLE 4a. %HRR at indicated %V̇O2peak for men, women, and total group.
40% 50% 60% 80% 85%
Men (N � 15) 34.7 � 1.8 46.0 � 2.1 57.3 � 2.4 80.0 � 3.1 85.7 � 3.3Women (N � 17) 34.7 � 1.2 45.7 � 1.2 56.8 � 1.2 78.8 � 1.2 84.4 � 1.2Total (N � 32) 34.7 � 1.1 45.9 � 1.2 57.0 � 1.3 79.4 � 1.6 85.0 � 1.7
TABLE 4b. %HRR at indicated %VO2R for men, women, and total group.
40% 50% 60% 80% 85%
Men (N � 15) 40.1 � 1.2 50.2 � 1.4 60.3 � 1.6 80.5 � 1.9 85.5 � 2.0Women (N � 17) 40.9 � 1.6 50.7 � 1.6 60.5 � 1.7 80.0 � 1.8 84.9 � 1.8Total (N � 32) 40.5 � 1.0 50.4 � 1.1 60.4 � 1.3 80.2 � 1.3 85.2 � 1.3
Values are means � SEM.
1424 Official Journal of the American College of Sports Medicine http://www.acsm-msse.org

the same laboratory conditions. Swain et al. (23) investi-gated 162 healthy 18- to 34-yr-old men and women, andfound the %HRpeak-%V̇O2peak relationship to be signifi-cantly higher than ACSM guidelines at 40, 60, 80, and85%V̇O2max. However, there were a number of notabledifferences between Swain et al. (23) and the current study.In the obese population, the magnitude of discrepancy in%HRpeak at 40%V̇O2peak was 9%, notably lower than the15% identified by Swain et al. (23). Further, the differencesbetween the obese and the ACSM %HRpeak-%V̇O2peak re-lationship at 80 and 85%V̇O2peak was not significant. Swainet al. (23) recommended that in the apparently healthy the%HRmax values corresponding with 40, 60, 80, and 85%V̇O2max are 63, 76, 89, and 92%. With reference to theobese, these proportions of maximal oxygen uptake are toohigh. Finally, Swain et al. (23) suggested a gender differ-ence might exist in determination of target heart rates. Nodifferences between the %HRpeak-%V̇O2peak relationship ofmen and women was noted in the population of obese adultstested.
%V̇O2peak and %V̇O2R predicted from %HRR. Verylittle comparative data are available on exercise intensitydescribed as a proportion of V̇O2R. However, as demon-strated by numerous studies of different populations in thepast, %HRmax is not equivalent to %V̇O2max. Further, Frank-lin et al. (8) showed in a group of sedentary women thatcardiovascular conditioning caused a shift in the %HRmax-%V̇O2max regression, which resulted in a higher %HRmax ata given %V̇O2max. One adaptive response to cardiorespira-tory conditioning is a decrease in resting heart rate (29).Consequently, an approach undertaken to account for boththe proportion of HRmax not being equal to the proportion ofV̇O2max and the influence of fitness status on this relation-ship is the %HRR method proposed by Karvonen and col-leagues (11). Although not tested or proposed by Karvonen,the %HRR has been assumed by many to provide an equiv-alent exercise intensity as the same proportion of V̇O2max. Areview of the literature by Swain and Leutholtz (24) re-vealed that no studies after 1957 established equivalencebetween %HRR and %V̇O2max. Although two studies pro-vided an indirect comparison of %HRR and %V̇O2max withmixed results (27,28), two others reported a lack of equiv-alence (3,17).
In a study of nine highly trained young men duringtreadmill running, Davis and Convertino (5) determined that%HRR was equivalent to the same percentage of the netV̇O2 (referred to here as %V̇O2R). In a study of exerciseintensity of treadmill running necessary to elicit LT, Welt-man et al. (28) reported that the majority of male subjectsattained LT at 85%HRR and 90%V̇O2max, confirming theunequal relationship between %HRR and %V̇O2max. Astudy of women undertaken in the same laboratory (27)produced conflicting results with the women on averageattaining LT at 55% of either HRR or V̇O2max. However, thepurpose of these studies was not to compare the %HRR-%V̇O2max relationship across a range of exercise intensities,nor to investigate the %HRR-%V̇O2R relationship. Conse-quently, meaningful comparisons with the data of the cur-
rent study are limited. In contrast, research on the %HRR-%V̇O2max relationship in elderly subjects has showndefinitively that at any exercise intensity the values obtainedfor %HRR are lower than %V̇O2max (3,17).
Studies by Swain and colleagues (24,25) have demon-strated, on both cycle ergometry and treadmill exercise inhealthy untrained men and women, that %HRR is not equiv-alent to %V̇O2max but rather %V̇O2R. The findings of thecurrent study with obese subjects concur, as the slope of the%HRR predicted from %V̇O2peak regression was signifi-cantly greater than 1, and the intercept was significantly lessthan 0. Swain and Leutholtz (24) purport that the magnitudeof the error in the assumed equivalence between %HRR and%V̇O2max is influenced by both the fitness level of theindividual and the intensity of the exercise but not gender.Similarly, in the obese population studied, the magnitude ofthe discrepancy was not influenced by gender, was smalleras exercise intensity increased, and was inversely related toV̇O2peak expressed as mL·kg FFM�1·min�1. It was noted inthe current study, however, that the influence of fitness levelon the magnitude of the discrepancy between %HRR and%V̇O2peak was not evident when peak aerobic capacitywas expressed relative to the total body weight(mL·kg�1·min�1).
The findings of the current study with obese adults concurwith previous research demonstrating equivalence between%HRR and %V̇O2R. The slope of the %HRR-%V̇O2Rregression line was not significantly different from 1, andthe intercept compared significantly with zero. However, incomparison with the few studies that have investigated the%HRR-%V̇O2R relationship (5,18,24,25), this is the firststudy to have utilized true resting values in the calculationof both HRR and V̇O2R. The resting V̇O2 and HR data in thestudy by Swain and Leutholtz (24) were collected 5 minbefore the cycle ergometry test with subjects seated on thebike, and thus cannot be considered to represent true restingconditions. In the current study, resting values for V̇O2 andHR were obtained from a 45-min RMR test, and thus negateany expected elevations associated with pretesting anxiety.
FIGURE 3—Mean (� SD) and ranges of relative intensities as apercentage of LT.
SUBMAXIMAL MARKERS OF EXERCISE INTENSITY Medicine & Science in Sports & Exercise� 1425

Relative exercise intensity at LT. This study dem-onstrated that exercise prescription at fixed percentages ofV̇O2peak and HRpeak corresponded with wide ranges of ex-ercise intensity as defined in relation to LT. Consequently,relying on certain intensities described by specific percent-ages of V̇O2max or HRmax, some obese individuals will beworking well below and others well above the LT. Therelevance of this finding is dependent upon the importanceplaced in the LT as a submaximal marker. The LT as definedin this study reflects a breakpoint in metabolic and hormonalregulation. Although there is debate about both the approachin determining the LT and the LT concept itself, it has beenthoroughly validated using endurance tests of 45- to 50-minduration (22,26). A lactate steady state was only reached inthese and other studies when intensities were held at orbelow this threshold. Intensities 5–10% higher resulted inthe accumulation of lactic acid and premature exhaustion(16). The LT can be interpreted as an individually definedmaximum lactate steady state, and the intensity precedingunbalanced increases in blood lactate and H� as the rate ofsynthesis exceeds the body’s capacity buffer or oxidize thesubstrate (15,22). The physiologic alterations associatedwith lactate accumulation (metabolic acidosis, impairedmuscle contractility, hyperventilation, and altered oxygenkinetics) contribute to impairment of work capacity (15).Working at intensities above this threshold also results inunbalanced increases in adrenalin and noradrenalin, reflect-ing elevated sympathetic nervous system activity (26), aprecursor to neuromuscular fatigue.
In the current study of obese adults, exercise intensitiesdefined by 50%V̇O2peak, 60%HRpeak, 90%HRpeak, and85%V̇O2peak equated with LT-related intensity ranges of 55,50, 44, and 38%, respectively. Presented another way, pre-scribing exercise intensity for the obese at 50%V̇O2peak
would result in subjects working at between 38 and 88% of
their individually defined optimal exercise intensity for en-ergy expenditure at a tolerable workload (LT). Similarly,exercise prescribed at 90%HRpeak would require the obesesubjects to be working from optimal (100%, that is LT) to44% above optimal (144% LT). Exercise at an intensityequating LT is on average 78 � 6%HRpeak, 65 � 2%HRR,67 � 8%V̇O2peak, and 63 � 1%V̇O2R. Thus, the degree ofvariability in defining the exercise intensity equating withLT is greater when defined relative to peak values (HRpeak
and V̇O2peak) rather than reserve values (HRR and V̇O2R).Further, as evidenced by the range of exercise intensitiesdefined by %HRmax and %V̇O2max, the degree of variabilityis greater at lower intensities, the level commonly pre-scribed for the obese. It could be argued from these findingsthat many studies designed to determine the influence ofexercise, defined as a proportion of peak or maximal car-diorespiratory capacity, on health and performance havebeen limited by the inherent degree of variance in the actualrelative exercise intensity that has been prescribed.
These findings are in agreement with other studies of bothtrained and untrained individuals (6,14,27,28). Meyer et al.(14) reported a variability of over 30% at 75%V̇O2max intrained cyclists and triathletes. Thus, in the obese, as for allother populations tested, percentages of peak oxygen uptakeand HR correspond with wide ranges of exercise intensity asdefined by individual LT and should not be used as the soledeterminants to define exercise intensities for training andresearch purposes. Individual determination of exercise in-tensity will ensure a more targeted and thus effective ap-proach for exercise prescription.
Address for correspondence: Nuala M. Byrne, Ph.D., Universityof Alabama at Birmingham, Department of Nutrition Sciences,Division of Physiology and Metabolism, Webb Nutrition SciencesBuilding, Room 441, Birmingham, AL 35294-3360; E-mail:[email protected] or [email protected].
REFERENCES
1. AMERICAN COLLEGE OF SPORTS MEDICINE. The recommended quan-tity and quality of exercise for developing and maintaining car-diorespiratory and muscular fitness, and flexibility in healthyadults. Med. Sci. Sports Exerc. 30:975–991, 1998.
2. BEAVER, W. L., K. WASSERMAN, and B. J. WHIPP. Improved detec-tion of the lactate threshold during exercise using a log-log trans-formation. J. App. Physiol. 59:1936–1940, 1985.
3. BELMAN, M. J., and G. A. GAESSER. Exercise training below andabove the lactate threshold in the elderly. Med. Sci. Sports Exerc.23:562–568, 1991.
4. BORG, G. A. Psychophysical bases of perceived exertion. Med. Sci.Sports Exerc. 14:377–381, 1982.
5. DAVIS, J. A., and V. A. CONVERTINO. A comparison of heart ratemethods for predicting endurance training intensity. Med. Sci.Sports 7:295–298, 1975.
6. DWYER, J., and R. BYBEE. Heart rate indices of the anaerobicthreshold. Med. Sci. Sports Exerc. 15:72–76, 1983.
7. FINK, W. J., and D. L. COSTILL. Analytical Methods for the Mea-surement of Human Performance: Human Performance Labora-tory. Muncie, IN: Ball State University, 1990, pp. 38–43.
8. FRANKLIN, B. A., J. HODGSON, and E. R. BUSKIRK. Relationshipbetween percent maximal O2 uptake and percent maximal heartrate in women. Res. Q. 51:616–624, 1980.
9. HELLERSTEIN, H. K., E. Z. HIRSCH, N. ADER, N. GREENBLOTT, and M.SIGEL. Principles of exercise prescription. Exercise Testing and
Exercise Training in Coronary Heart Disease. Orlando, FL: Ac-ademic Press, 1973, pp. 129–167.
10. HILLS, A. P., and N. M. BYRNE. Exercise prescription for weightmanagement. Proc. Nutr. Soc. 57:93–103, 1998.
11. KARVONEN, M., K. KENTALA, and O. MUSTALA. The effects oftraining heart rate: a longitudinal study. Ann. Med. Exp. Biol.Fenn. 35:307–315, 1957.
12. KATCH, V., A. WELTMAN, S. SADY, and P. FREEDSON. Validity of therelative percent concept for equating training intensity. Eur.J. Appl. Physiol. 39:219–227, 1978.
13. LONDEREE, B. R., and S. A. AMES. Trend analysis of the % V̇O2max-HR regression. Med. Sci. Sports 8:123–125, 1976.
14. MEYER, T., H. H. GABRIEL, and W. KINDERMANN. Is determinationof exercise intensities as percentages of V̇O2max or HRmax ade-quate? Med. Sci. Sports Exerc. 31:1342–1345, 1999.
15. MYERS, J., and E. ASHLEY. Dangerous curves: a perspective on exer-cise, lactate, and the anaerobic threshold. Chest 111:787–795, 1997.
16. MCLELLAN, T. M., K. S. CHEUNG, and I. JACOBS. Incremental testprotocol, recovery mode and the individual anaerobic threshold.Int. J. Sports Med. 12:190–195, 1991.
17. PANTON, L. B., J. E. GRAVES, L. GARZARELLA, et al. Relative heartrate, heart rate reserve, and oxygen uptake during exercise in theelderly (Abstract). Med. Sci. Sports Exerc. 24(Suppl):S185, 1992.
18. ROTSTEIN, A., and Y. MECKEL. Estimation of %V̇O2 reserve fromheart rate during arm exercise and running. Eur. J. Appl. Physiol.83:545–550, 2000.
1426 Official Journal of the American College of Sports Medicine http://www.acsm-msse.org

19. SALTIN, B., G. BLOMQVIST, J. H. MITCHELL, R. L. JOHNSON, Jr., K.WILDENTHAL, and C. B. CHAPMAN. Response to exercise afterbed rest and after training. Circulation 38(Suppl. 5):VII1–78,1968.
20. SKINNER, J. S., and L. W. JANKOWSKI. Individual variability in therelationship between heart rate and oxygen intake. Med. Sci.Sports 6:68, 1974.
21. SIMMONS, D. N., M. J. BERRY, S. I. HAYES, and S. A. WALSCHLAGER.The relationship between %HRpeak and %V̇O2peak in patientswith chronic obstructive pulmonary disease. Med. Sci. SportsExerc. 32:881–886, 2000.
22. STEGMANN, H., W. KINDERMANN, and A. SCHNABEL. Lactate kineticsand individual anaerobic threshold. Int. J. Sports Med. 2:160–165,1981.
23. SWAIN, D. P., K. S. ABERNATHY, C. S. SMITH, S. J. LEE, and S. A.BUNN. Target heart rates for the development of cardiorespiratoryfitness. Med. Sci. Sports Exerc. 26:112–116, 1994.
24. SWAIN, D. P., and B. C. LEUTHOLTZ. Heart rate reserve is equivalentto %V̇O2 reserve, not to %V̇O2max. Med. Sci. Sports Exerc. 29:837–843, 1997.
25. SWAIN, D. P., B. C. LEUTHOLTZ, M. E. KING, L. A. HAAS, and J. D.BRANCH. Relationship between % heart rate reserve and % V̇O2
reserve in treadmill exercise. Med. Sci. Sports Exerc. 30:318–321,1998.
26. URHAUSEN, A., B. WEILER, B. COEN, and W. KINDERMANN. Plasmacatecholamines during endurance exercise of different intensitiesas related to the individual anaerobic threshold. Eur. J. Appl.Physiol. 69:16–20, 1994.
27. WELTMAN A., J. WELTMAN, R. RUTT, et al. Percentages of maximalheart rate, heart rate reserve, and V̇O2peak for determining en-durance training intensity in sedentary women. Int. J. Sports Med.10:212–216, 1989.
28. WELTMAN A., D. SNEAD, R. SEIP, et al. Percentages of maximalheart rate, heart rate reserve and V̇O2max for determining endur-ance training intensity in male runners. Int. J. Sports Med. 11:218–222, 1990.
29. WILMORE, J. H., and COSTILL, D. L. Physiology of Sport andExercise. Champaign, IL: Human Kinetics Publishers, 1994, pp.504–505.
30. WONG, W. W., W. J. COCHRANE, W. J. KLISH, E. O. SMITH, L. S.LEE, and P. D. KLEIN. In vivo isotope-fractionation factors and themeasurement of 2H2O- and oxygen-18-dilution spaces for plasma,urine, saliva, respiratory water vapor, and carbon dioxide. Am. J.Clin. Nutr. 47:1–6, 1988.
SUBMAXIMAL MARKERS OF EXERCISE INTENSITY Medicine & Science in Sports & Exercise� 1427