reliable power, wind variability, and offshore grids in europe brian hurley, and paul hughes,...
Post on 22-Dec-2015
214 views
TRANSCRIPT

Reliable Power, Wind Variability, and Offshore Grids in Europe
Brian Hurley, and Paul Hughes, Airtricity Dr. Gregor Giebel, Risø National Laboratory

Company Overview
• Founded in 1997
• 250 Employees
• 45,000+ Customers
• ~200MW’s Generation capacity – 10 Windfarms by December 2004
• Under development and in pipeline 4000GW
• Operations in Republic of Ireland, Northern Ireland, U.K., USA,
North Sea, and Irish Sea.

Wind patterns over Europe

CONTEXT
1. Different mix of conventional plant as new conventional plant is added.
2. Older conventional plant can be refurbished with a
view to be used as a cheap form of "storage”.
3. Additional interconnection will be coming available inter country and inter regional.
4. Specific interconnection of regions to capture of the geographical dispersion effect for wind.
5. ”Intelligent " grid

Geographical Dispersion Effect

Wind has Capacity Credit
Source: G. Giebel, On the Benefits of Distributed Generation in Europe, VDI-Verlag 2001

European average wind power generation between 1965 and 1998,
as an average over 60 well-distributed sites
Ref: G.Giebel


Scenarios
6 Thames Est.
7 Thames Est. + Baltic Sea
8 Thames Est. + Baltic Sea + Orkney
9 Thames Est. + Baltic Sea + Orkney + Celtic Sea
10 Thames Est. + Baltic Sea + Orkney + Celtic Sea + Trafalgar
11 Thames Est. + Baltic Sea + Orkney + Celtic Sea + Trafalgar + Mediterranean
7 Thames Est. + Baltic Sea + Orkney + Celtic Sea + Trafalgar + Mediterranean + Irish Sea

Change in Power
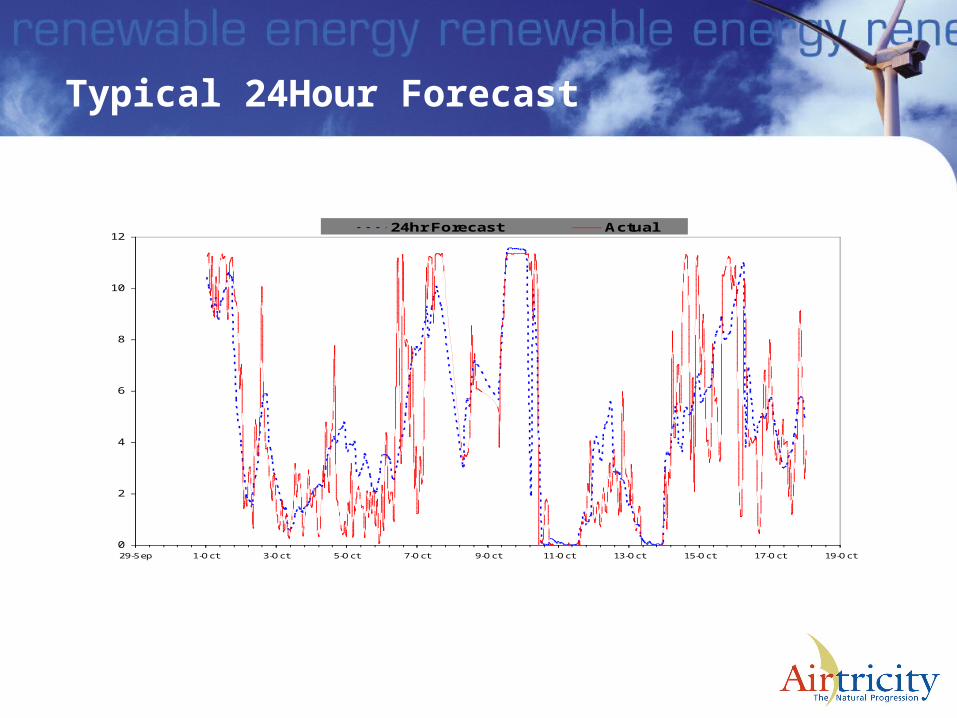
Typical 24Hour Forecast
0
2
4
6
8
10
12
29-Sep 1-Oct 3-Oct 5-Oct 7-Oct 9-Oct 11-Oct 13-Oct 15-Oct 17-Oct 19-Oct
Power [MW]
24hr Forecast Actual

Case Wind speed m/s
Capital cost generation per MWh
Capital cost transmission per MWh
Total Capital cost at load centres per MWh
High Wind Area (Onshore) 7.07m/s at 60m*
379 0 379
Medium wind area (Onshore) 6.45m/s at 60m*
450 0 450
Low wind area (Onshore) 5.53 m/s at 60m*
633 0 633
South Irish Sea to French coast 8.5m/s at 100m
512 237 749
South Irish Sea to French coast 10m/s at 100m
414 192 606
North Sea South to Germany 8.5m/s at 100m
510 206 716
North Sea South to Germany 10m/s at 100m
413 167 580
North Sea North to Mid Germany >10m/s at 100m
<413 <167 <580
Baltic to Mid Germany 8.5m/s at 100m
510 185 695
Baltic to Mid Germany 10m/s at 100m
419 210 629
Thames Estuary ~9m/s at 100m
467 160 627
Total capital costs at load centres per MWh

10GW Investigation
Locations Latitude Longitude Capacity (MW) UK (Scotland) 56.2 -2 1,097 NL (The Netherlands) 52.2 5.7 1,186 DE (Northern Germany) 52.2 9.5 17,500 NS (North Sea) 56.2 3.8 10,000

10GW Investigation
0%
10%
20%
30%
40%
50%
60%
70%
80%
90%
-1100-1000-900-800-700-600-500-400-300-200-1000
100 200300 400500 600700 8009001000
Power [MW]
Frequency
UK
UK+NS

10GW Investigation
0%
10%
20%
30%
40%
50%
60%
70%
80%
-1200-1100-1000-900-800-700-600-500-400-300-200-1000
100 200300 400500 600700 80090010001100
Power [MW]
Frequency
NL
NL+NS

10GW Investigation
0%
5%
10%
15%
20%
25%
30%
35%
-17000-15000-13000-11000-9000-7000-5000-3000-10001000300050007000900011000130001500017000
Power [MW]
Frequency
DE
DE+NS

10GW Investigation Conclusion
The addition of the North Sea 10GW power to both the UK and Netherlands could almost eliminate the variability entirely. The proportion of the counts in the 0-100MW bin where there was no change in power over the 6-hour interval:
UK77%
NL69%
