religion and child healthftp.iza.org/dp5215.pdf · 5 tobacco consumption). on the other hand, some...
TRANSCRIPT
DI
SC
US
SI
ON
P
AP
ER
S
ER
IE
S
Forschungsinstitut zur Zukunft der ArbeitInstitute for the Study of Labor
Religion and Child Health
IZA DP No. 5215
September 2010
Barry R. ChiswickDonka M. Mirtcheva
Religion and Child Health
Barry R. Chiswick University of Illinois at Chicago
and IZA
Donka M. Mirtcheva The College of New Jersey
Discussion Paper No. 5215 September 2010
IZA
P.O. Box 7240 53072 Bonn
Germany
Phone: +49-228-3894-0 Fax: +49-228-3894-180
E-mail: [email protected]
Any opinions expressed here are those of the author(s) and not those of IZA. Research published in this series may include views on policy, but the institute itself takes no institutional policy positions. The Institute for the Study of Labor (IZA) in Bonn is a local and virtual international research center and a place of communication between science, politics and business. IZA is an independent nonprofit organization supported by Deutsche Post Foundation. The center is associated with the University of Bonn and offers a stimulating research environment through its international network, workshops and conferences, data service, project support, research visits and doctoral program. IZA engages in (i) original and internationally competitive research in all fields of labor economics, (ii) development of policy concepts, and (iii) dissemination of research results and concepts to the interested public. IZA Discussion Papers often represent preliminary work and are circulated to encourage discussion. Citation of such a paper should account for its provisional character. A revised version may be available directly from the author.
IZA Discussion Paper No. 5215 September 2010
ABSTRACT
Religion and Child Health This paper examines the determinants of the health of children ages 6 to 19, as reported in the Child Development Supplements (CDS) to the Panel Study of Income Dynamics (PSID). The primary focus is on the effect of religion on the reported overall health and psychological health of the child. Three measures of religion/religiosity of the child are employed: whether there is a religious affiliation (and what kind), the importance of religion, and the frequency of church attendance. Other variables the same, the analysis reveals that there appears to be a positive association between both measures of health and the three measures of religion/religiosity. Those children (self-report or primary caregiver report) who have identified a religious affiliation, who view religion as very important, compared to those who view it as unimportant, and who attend church at least weekly compared to those who do not or seldom attend have higher levels of overall health and psychological health. When the analysis of affiliation is done by denomination, the primary difference is between those who report a religious affiliation and those who do not. JEL Classification: I1, I18, I12, Z12 Keywords: health, religion, religiosity, children, adolescents Corresponding author: Donka M. Mirtcheva Department of Economics The College of New Jersey Business Building, 114 P.O. Box 7718 2000 Pennington Road Ewing, NJ 08628 USA E-mail: [email protected]
3
I. Introduction
Americans tend to have a strong attachment to religion. According to recent surveys,
about 92 percent of Americans have professed belief in the existence of God or a universal spirit,
82 percent report religion to be very important or somewhat important in their lives, 88 percent
attend church, and 42 percent attended church in the previous seven days (Gallup, 2009; The
Pew Forum, 2008).1 High levels of religious belief and participation are also characteristic for
children and adolescents, perhaps because they accompany parents. Among American teenagers,
95 percent believe in God, and 45 percent belong to a religion-sponsored youth group or attend
worship services weekly (Gallup and Bezilla, 1992). Fifty-four percent of middle and high
school students report that religion or spirituality is quite or extremely important to them,
whereas 27 percent of American teens consider religious faith more important to them than it is
to their parents and report being slightly more likely to attend worship services than adults
(Benson et al., 2003; Gallup and Bezilla, 1992).
A body of literature has developed that relates religion (denomination) and religiosity
(religious beliefs and practices) to the physical, mental, and emotional health of adults. Studies
suggest that religious involvement among adults is associated with lower mortality rates, less
frequent unhealthy behavior (eg., drug and alcohol use and abuse), and a lower prevalence of
anxiety, depression and suicide, among other health outcomes (eg., Johnson et al., 2002; Koenig
et al., 2001; Lee and Newberg, 2005; McCullough and Smith, 2003; Regnerus, 2003).
There is much less literature on whether religion and religiosity appear to have
protective or beneficial effects on the health status of children and adolescents. Several studies of
youth found that involvement in religion is associated with low rates of suicide, attempted
1 In this paper, “church” is the term used to refer to any house of worship, regardless of religion or denomination.
4
suicide, and contemplation of suicide (eg., Borowsky et al., 2001; Donahue and Benson, 1995;
Kandel et al., 1991; Stein et al., 1989, 1992; Watt and Sharp, 2001). Involvement in religious
activities among youth is also associated with a lower engagement in unhealthy behavior, such as
alcohol and drug use and unsafe sexual behavior (eg., Donahue and Benson, 1995; Miller and
Gur, 2002).
The purpose of this paper is to expand the literature on the relation between religion
and religiosity to the overall health and psychological health of children and adolescents in the
United States. The general finding is that religious beliefs and participation among youth are
associated with better health status.
Section II develops the theoretical model and the methodology employed in this
study. In Section III, the data to be studied, the Child Development Supplements (CDS) and the
Panel Study of Income Dynamics (PSID), are discussed. The empirical analysis is reported in
Section IV for youths ages 6-19, both overall and separately by age group. Section V
summarizes the findings and suggests policy implications for families, religious institutions, and
the government.
II. Theoretical Model
Religion can have positive effects on youth health status directly through influencing
the children and indirectly through influencing their parents’ behavior by means of regulative,
social, and psychological mechanisms. On the one hand, religion in general tends to discourage
unhealthy behavior and excessive behavior that in moderate form may not be unhealthy or in
some cases may even be beneficial (eg., alcohol consumption). Some religious denominations
prohibit consumption of potentially harmful substances (eg., Mormons prohibit alcohol and
5
tobacco consumption). On the other hand, some religions or religious denominations prohibit
their members from using some services of doctors and hospitals (eg., Christian Scientists).
While this may not have had negative health consequences in the past, it may do so today. Some
religions discourage blood transfusions, vaccinations, contraception, and abortions, the
avoidance of which may have adverse health consequences.
Religious participation is usually done in a group context and thus involves social
relationships and the formation of networks. Such groups may moderate unhealthy behavior,
enhance one’s business and marital prospects, and provide friendship and social support in time
of emotional or medical need. Family participation is typical in religious activities, as distinct
from other groups (eg., junior soccer leagues, bowling leagues, book clubs) that tend to separate
or segregate people by age. Thus, if the whole family practices the same religion, religious
activities can serve to strengthen ties among family members (Pearce and Axinn, 1998).
Moreover, religious participation can have beneficial psychological effects. Religion
can improve psychological health through increased self-esteem, deliverance from anxiety about
after life, and finding meaning in life, although religion can also increase feelings of guilt and
fear (eg., Azzi and Ehrenberg, 1975; Ellison et al., 2001).
Thus, family out-of-pocket expenditures and time investments in religion and
religious human capital –“familiarity with a religion’s doctrines, rituals, traditions, and
members” that enhances the appreciation/satisfaction from participation in religious activities
(Iannaccone, 1990)–may have the effect of increasing child health status, even if this was not the
intent of these activities, or it may worsen children’s psychological health outcomes if the child
feels peer-rejection or embarrassment (Abbots et al., 2004).
6
The theoretical model in this paper extends the health production model of Grossman
(1972). In Grossman’s framework, individuals inherit an initial stock of health, which
depreciates over time, and can be increased by investment. Consumers produce gross
investments in health capital using as inputs market goods (eg., medical care) and their own time.
The health production function also depends on “environmental factors,” the most important of
which is the level of education of the producer which affects the efficiency of health production.
Leibowitz (2005) extended the Grossman model by applying it to children, including among
other factors in the analysis parental time, as well as child’s time, and household consumption
(commodities) that affect child development.
In both the Grossman and Leibowitz models, health is a function of initial health
status, investments in health, and efficiency in the use of health inputs. The extension made here
is that in addition to age, education, and income that enter Grossman’s health production
function, religion and religiosity are also built in the health production function.
A child’s religious denomination and age-appropriate level of religious participation
are most likely determined primarily by the parent for very young children. As the youth matures
from childhood through the teenage years, one can expect opportunities to emerge for the child
to diverge religiously from the parents. This divergence is more likely to start with the extent of
religious practice, such as church attendance, and could continue with divergent patterns in
denomination (Iannaccone, 1990, referencing Clark, 1929 and Pressey and Kuhlen, 1957).
In the analyses of child health, age serves a different role than in Grossman’s model
of adult health, where it reflects the atrophy of the human body with age. Here, it reflects the
maturation of the child, both physically and mentally. With age, otherwise undetected health
conditions may be revealed. Age and education (years of schooling) are essentially collinear
7
among children, and presumably parents’ knowledge of health production (their education) is
more relevant than that of the child.
Several control variables are considered below in the analysis of overall physical
health and psychological health of children. Initial child health is measured by two dichotomous
variables, whether the child was breastfed as a baby and whether the child’s birthweight was
normal or high. Better initial health is expected to enhance health during childhood. The
hypothesized positive family effects on child health are measured by whether the household head
is married (two-parent households) and family income. The mother’s years of schooling is a
measure of the family’s efficiency in converting resources into child health and is expected to
positively affect the health of the child. Controlling for family income, marital status, and
education, a working mother implies less time available for child care. This would tend to have a
negative effect on child health.
III. Data
This study uses data on child and family demographic characteristics, including
measures of religion and religiosity, from the 1997 and 2002 Child Development Supplements
(CDS) and the 2003 Panel Study of Income Dynamics (PSID). The PSID is a nationally
representative longitudinal dataset collected since 1968 on various socio-economic and income
variables.
The CDS interviewed PSID families with children ages 0-12 in 1997 and followed up
in 2002/2003 when the children were ages 5-19. Some child characteristics (birthweight and
breastfeeding as a baby) were drawn from the first wave (CDS-I) as there was lower probability
of recollection response error. Child health and religion in the second wave (CDS-II) are of
8
interest in this study, as only limited health variables and no religion variables for the child were
available in the first wave. Additional data were obtained when the CDS data were linked to the
PSID 2003 data file (family income, household head’s marital status, mother’s education, and
mother’s hours worked). After appropriate sample selection and data cleaning, the sample
consisted of 2,604 children ages 6 to 19, who were biological, step, adoptive or foster children or
grandchildren of the household head. 2 Most of the responses were given by the child’s primary
caregiver (PCG), who in 90.5% of the cases was the child’s mother.3
Child health: outcome variables
To obtain a better understanding of the complex relationship between religion and
health, two health outcomes are analyzed. Child overall (presumably physical) health was
classified as healthy (=1) if the PCG reported excellent or very good health for the child, and
unhealthy (=0) if the PCG reported good, fair, or poor health. Few children were in fair or poor
health (2.8 percent), so the comparison is really between children in good health versus very
good or excellent health. Using a rich array of questions from the PCG survey dichotomous
variables were created for each child’s psychological health, which was defined as unhealthy
(=0) if the child’s last hospitalization was for mental health or suicide attempt reasons, last
doctor visit was for a mental health reason, if a doctor has diagnosed the child with serious
emotional disturbance or emotional/mental/behavioral problems, or if the child was often
2 The children age 5 were deleted from the sample because of a high rate of missing values for some of the religion questions. Four percent (102) of the children were grandchildren of the household head. 3 Another 5% of PCGs were biological fathers, 3% grandmothers, and the remaining 1.5% other. Appendix A contains detailed information on the construction of the health, religion, and control variables.
9
unhappy, sad, or depressed. If none of these conditions apply, the psychological health variable
was coded as psychologically healthy (=1).
Explanatory variables
Religion. Three dimensions of religion are examined: religious affiliation, frequency of
attending religious services, and importance of religion. For children younger than 12 years of
age, affiliation was proxied by the religious affiliation of the child’s mother, or father if the
mother’s information is missing, whereas for children ages 12 and older, the child’s self-reported
religious affiliation was used. Attendance is that reported by the PCG for children ages 6-11 and
self-reported for children ages 12 and older, or if missing replaced by the PCG report. Religious
importance was that of the PCG for children ages 6-11, and self-reported for children ages 12
and older.
Child’s initial health stock. The child’s initial health stock was measured using two
variables. One is whether the child was breastfed as a baby (breastfed=1). The other is the child’s
birthweight, which is set equal to 1 if it was more than 5.5 pounds and set equal to zero for low
birthweight babies (at most 5.5 pounds) (WHO 2004). There may be measurement (reporting) error
in child’s birthweight. Birthweight was based on a CDS 1997 survey question, where the PCG
recalled the weight at birth of children ages 0-12. If there are systematic reporting errors, the
coefficient estimates are inconsistent; if purely random, reporting errors in the independent variable
bias the coefficient toward zero (Wooldridge, 2000, pp. 294-298), which seems to be the case here.
It is expected that poorer initial health at birth is associated with poorer child health.
Child and family controls. Since health outcomes vary significantly across demographic
groups, a number of individual-level demographic variables were used as controls in the empirical
models. These included: gender, race/ethnicity (White, Black, Hispanic, Other), and child’s age
10
(ages 6-11, 12-15, 16-19). Other control variables with their hypothesized signs include: marital
status of the family head (married “+”), mother’s education (years of education “+”, years of
education squared “–”, education missing), mother’s work hours (number of hours worked per week
“–”), and family income (family income as a percentage of the poverty level “+”, family income as a
percentage of the poverty level squared “–”).
IV. Empirical Analysis
Descriptive statistics
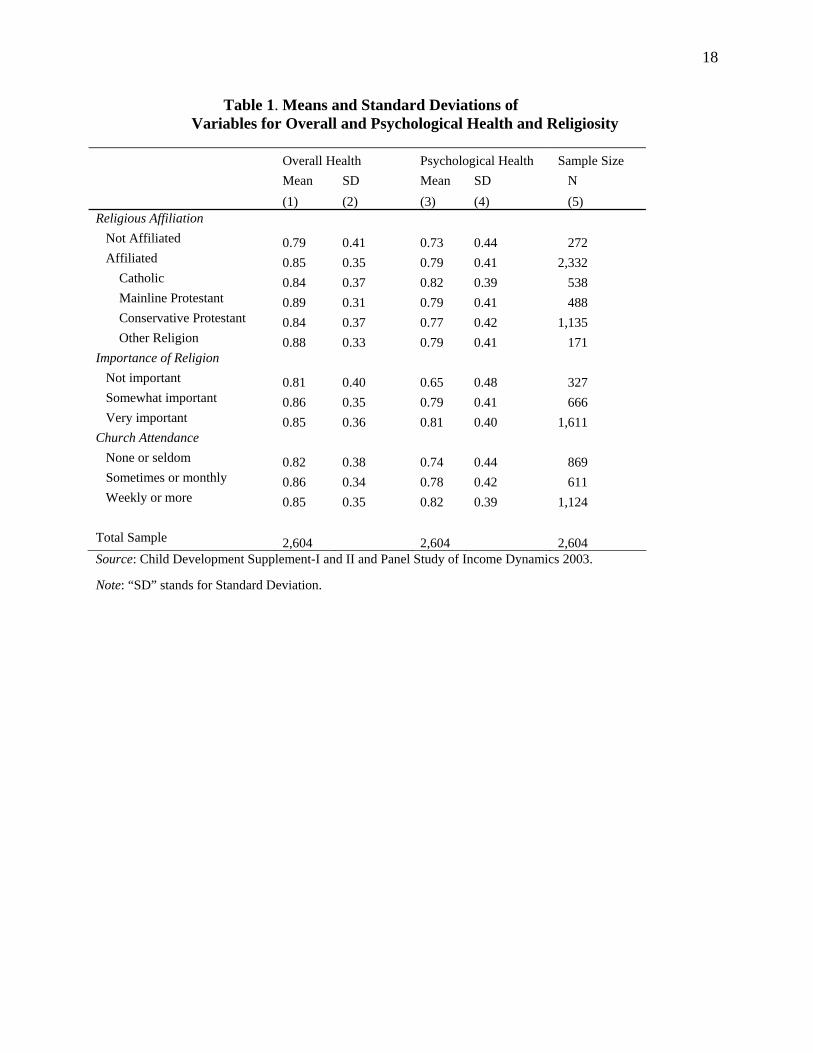
Table 1 reports the overall health and psychological health of the children ages 6 to 19 in
the sample by whether they have a religious affiliation (a religion or denomination as distinct
from reporting no religion, atheist or agnostic), by the importance of religion to them, and by the
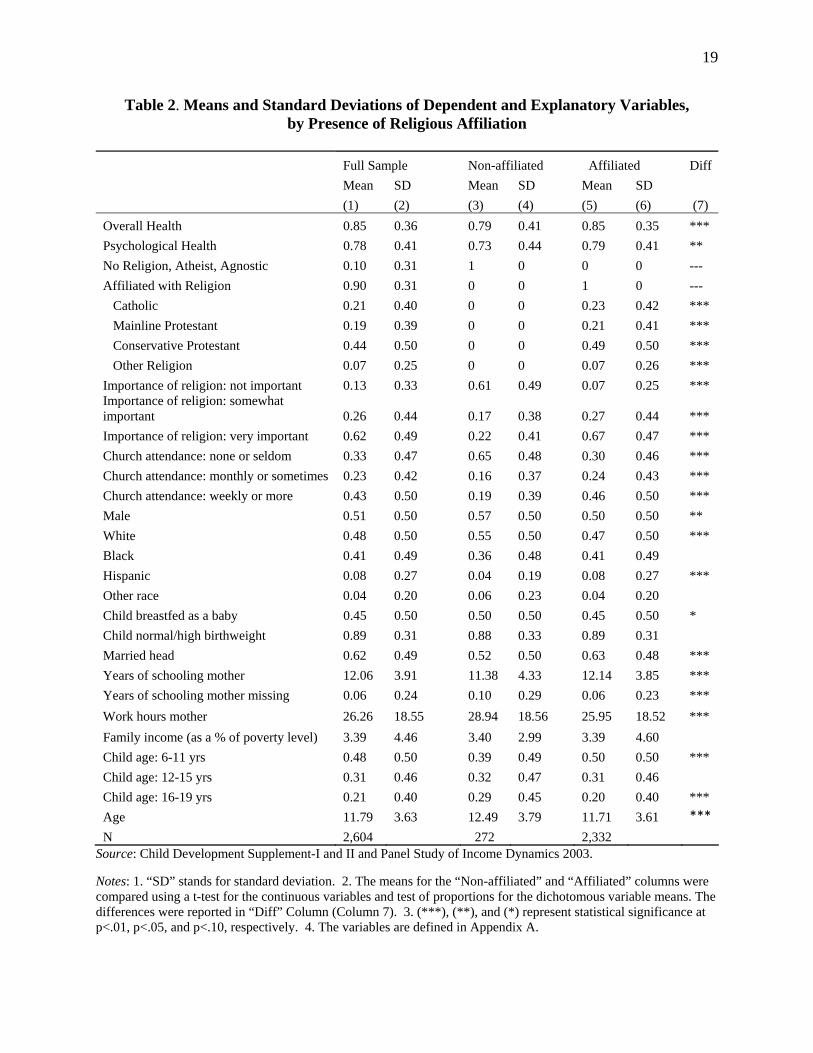
frequency of church attendance. Table 2 reports the means and standard deviations of the
dependent and explanatory variables used in the analysis.
It is useful to study separately these three dimensions of religion/religiosity. There is not
a perfect relation among these variables. While one might expect the affiliated to attend church
often and to view religion as very important, this is not always the case. As Table 2 shows,
among those reporting an affiliation, for example, 30 percent never or very seldom attend church
and for 7 percent religion is not important. On the other hand, the absence of an affiliation does
not necessarily mean that the person does not attend church or that religion is not important.
Among those with no affiliation, 35 percent attend church sometimes or weekly or more, and for
22 percent religion is very important.
11
Given the definitions of being healthy used in this study, 85 percent of the children are
reported as healthy overall, and 78 percent are psychologically healthy. There are, however,
sharp differences in health status by religion and religiosity.
Nearly 90 percent of the children are affiliated with a religion, with only about 10 percent
reporting as having no religion or are atheists or agnostics. Those who are affiliated with a
religion are healthier overall by 6 percentage points than those who are not affiliated (85 percent
compared to 79 percent, respectively). For psychological health, there is also a 6 percentage
point spread with those affiliated reporting better psychological health (79 percent and 73
percent, respectively).
The regularity of church attendance is also related to overall and psychological health.
Similar to the rates of adult church attendance in the United States, about one-third (33 percent)
of the sample do not attend or attend only a few days a year, close to a quarter (23 percent)
attend sometimes and nearly half (43 percent) attend at least weekly (Table 2). In general, both
overall health and psychological health are higher for those who attend more frequently (Table
1). For example, in terms of overall health, 85 percent are healthy among those attending at least
weekly, in contrast to 82 percent for those who never attend or hardly ever attend. The gap is
even greater for psychological health, 82 percent compared to 74 percent, respectively.
In spite of patterns of affiliation and frequency of church attendance, for nearly two-
thirds of children (62 percent) religion is reported to be very important (Table 2). For about a
quarter (26 percent) religion is only somewhat important, and for about one-in-eight (13 percent)
religion is not important. Yet, religion is important for their health status (Table 1). For those for
whom religion is very important, 85 percent are healthy overall, whereas this is so for only 81
percent if it is not important. The gap is even greater for psychological health. About 81 percent
12
of those for whom religion is very important are psychologically healthy, in contrast to only 65
percent among those for whom it is not important.
Probit analyses
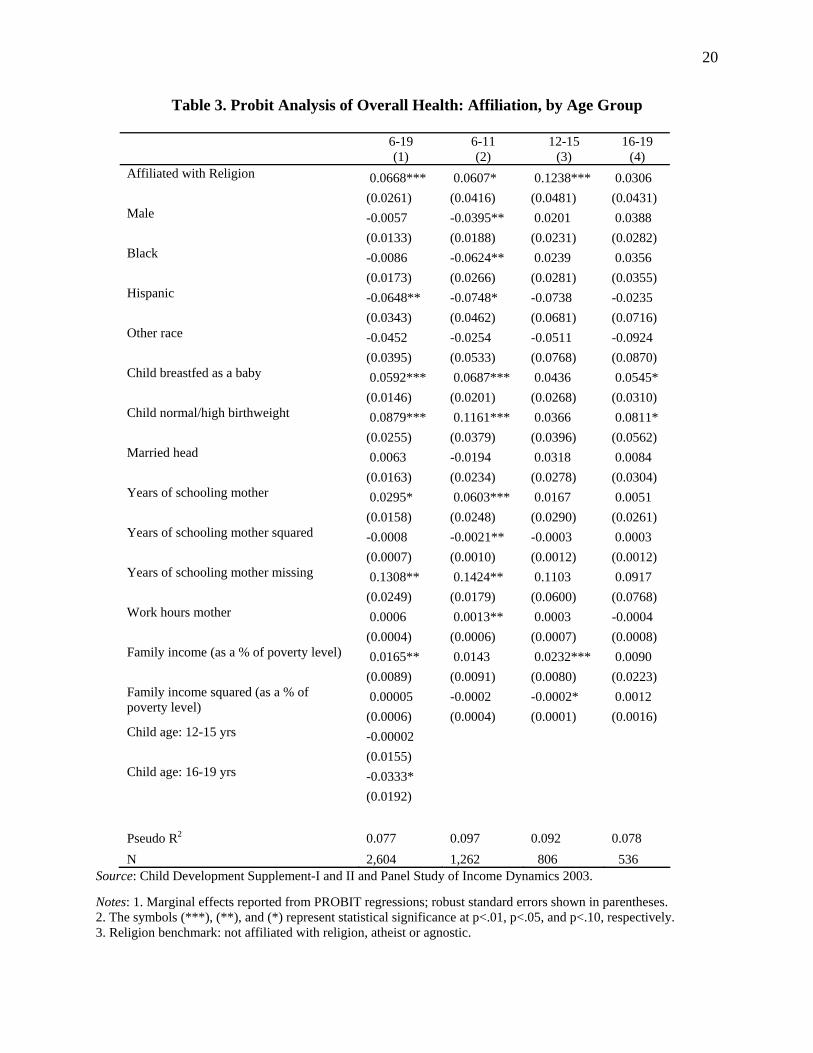
Table 3 reports the marginal effects from the probit regression analysis for the
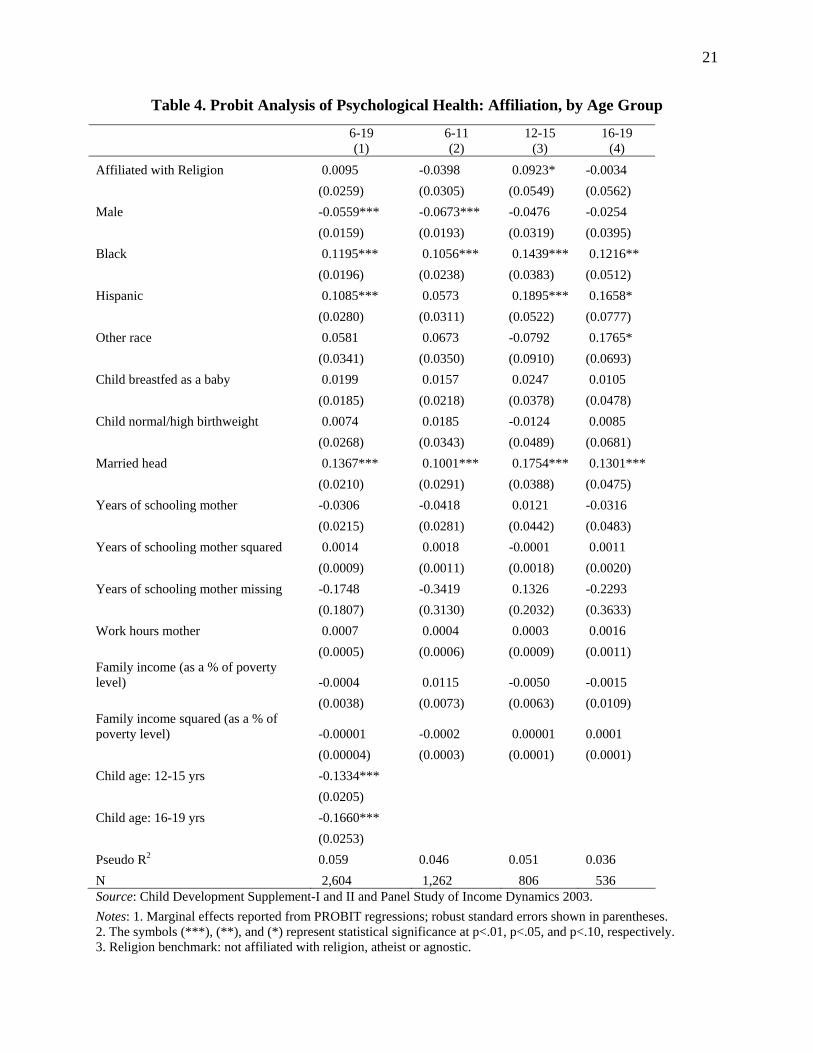
determinants of overall health, while Table 4 does the same for psychological health. Both tables
report the analyses for the sample ages 6 to 19, and separately by age group (6-11, 12-15, 16-19).
The sample sizes are, of course, reduced when the analyses are done within age groups. Overall
health is better when the child has better initial health (breastfed as a baby and normal or high
birthweight), when the mother has more schooling, and when family income is higher. Especially
for those 6 to 11 years old, overall health is lower for males, and Blacks and Hispanics as
compared to Whites. Psychological health appears unrelated to initial health status, to mother’s
education, and to family income, but is better in a two parent household (married family head).
Psychological health is less frequent among males, but greater for Blacks and Hispanics in
reference to Whites. Less favorable access to medical care among Blacks and Hispanics as
compared to Whites might result in less reporting to the parents of psychological problems that
might otherwise be reported by physicians.
Affiliation with a religion as distinct from having no religion, has a strong positive effect
on the overall health, both for the full sample and for children ages 6 to 15 (Table 3). Among
older teens (age 16-19), the effect is positive, but not statistically significant, possibly partly due
to small sample size (N=536). Affiliation with a religion for youths 6-19 years old makes them
6.7 percentage points more likely to be in better overall health than if unaffiliated or has
approximately the same positive health effect as having been breastfed as a baby or having a
mother with 2.2 additional years of schooling. For children ages 12-15, the marginal effect of
13
affiliation is double the size of that for children ages 6-11 (12.4 vs. 6.1 percentage points,
respectively). For psychological health, the effect of religious affiliation is statistically
significant and positive only for youths ages 12 to 15 (Table 4). The magnitude of the marginal
effect is about half that of the favorable effect of living with both parents (married household
head).
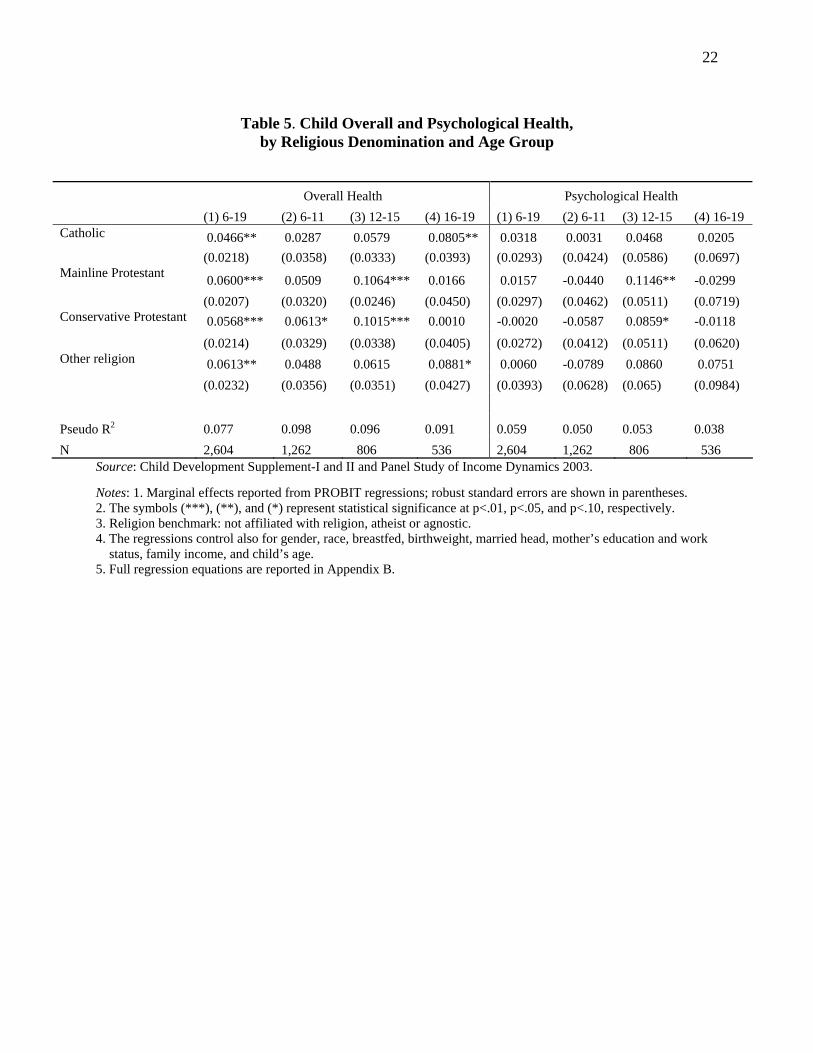
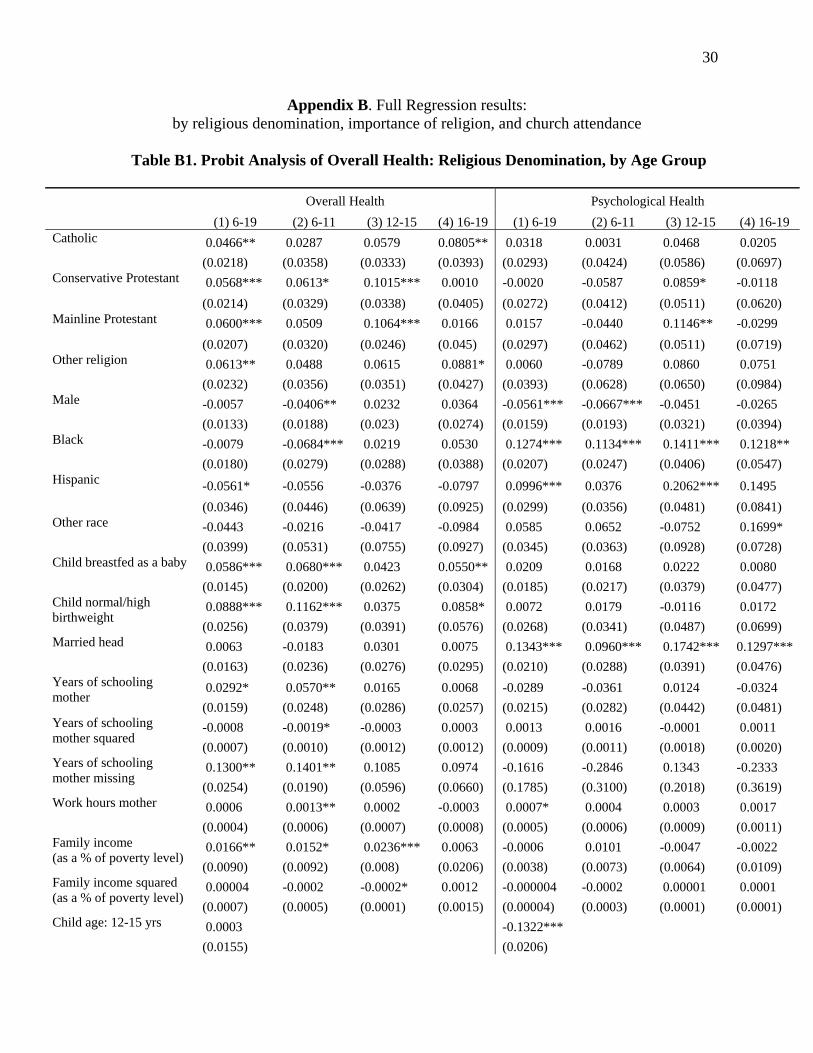
Among those with an affiliation, the detailed information on denomination are combined into
four religious groups: Catholic, Mainline Protestant, Conservative Protestant, and Other Religion
(see Appendix A). The full probit equations as in Tables 3 and 4 were computed, but only the
marginal effects of denomination are reported in Table 5, with the unaffiliated group (no
religion, atheist or agnostic) serving as the benchmark.4 The effect on overall health of all
denominational groups, as compared to the unaffiliated, is not only positive, but also significant
for the full sample, ages 6-19. By separate age groups, where sample sizes are smaller, the effect
of religion is not only always positive, but in a number of cases also significant. In the case of
psychological health, compared to the unaffiliated, the coefficients on the separate religion
groups are in most cases positive (except in the 6-11 age group), but generally not statistically
significant.
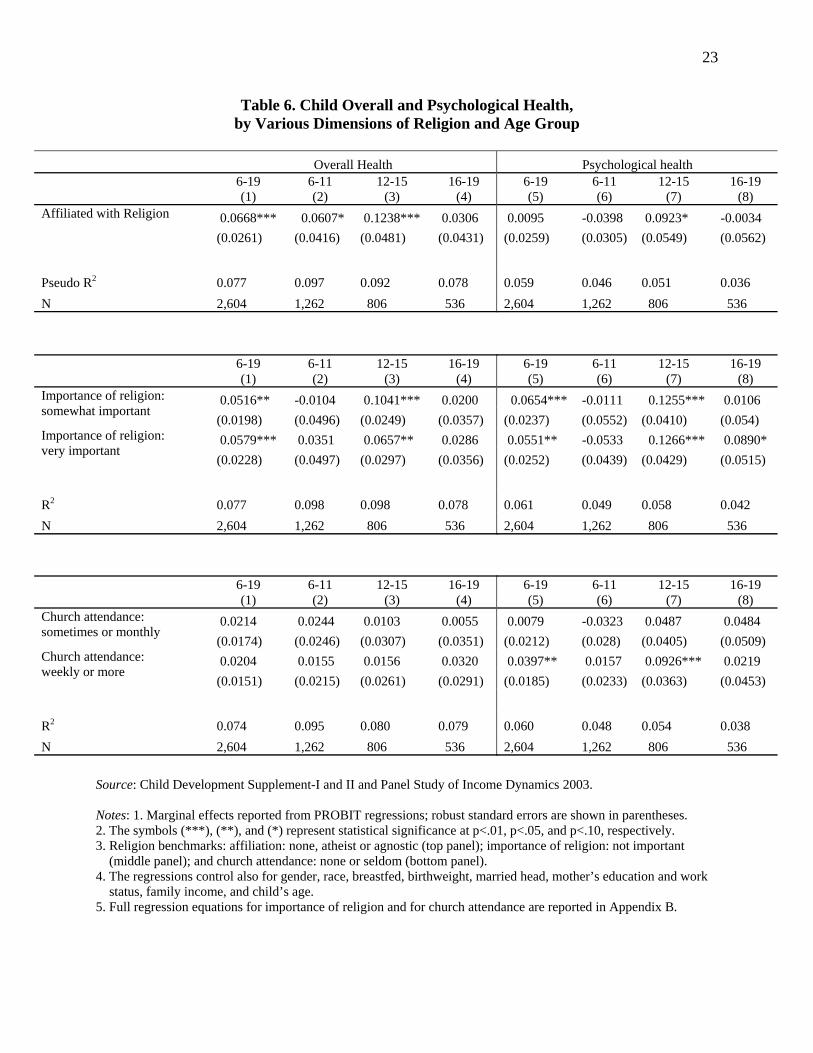
Rather than repeating the full regression equations for the other two religion variables,
church attendance and importance of religion, their marginal effects on overall and psychological
health are reported in Table 6.4 For comparative purposes, the marginal effects for the religious
affiliation variable are also included in Table 6.
4 The full regression equations are reported in Appendix B.
14
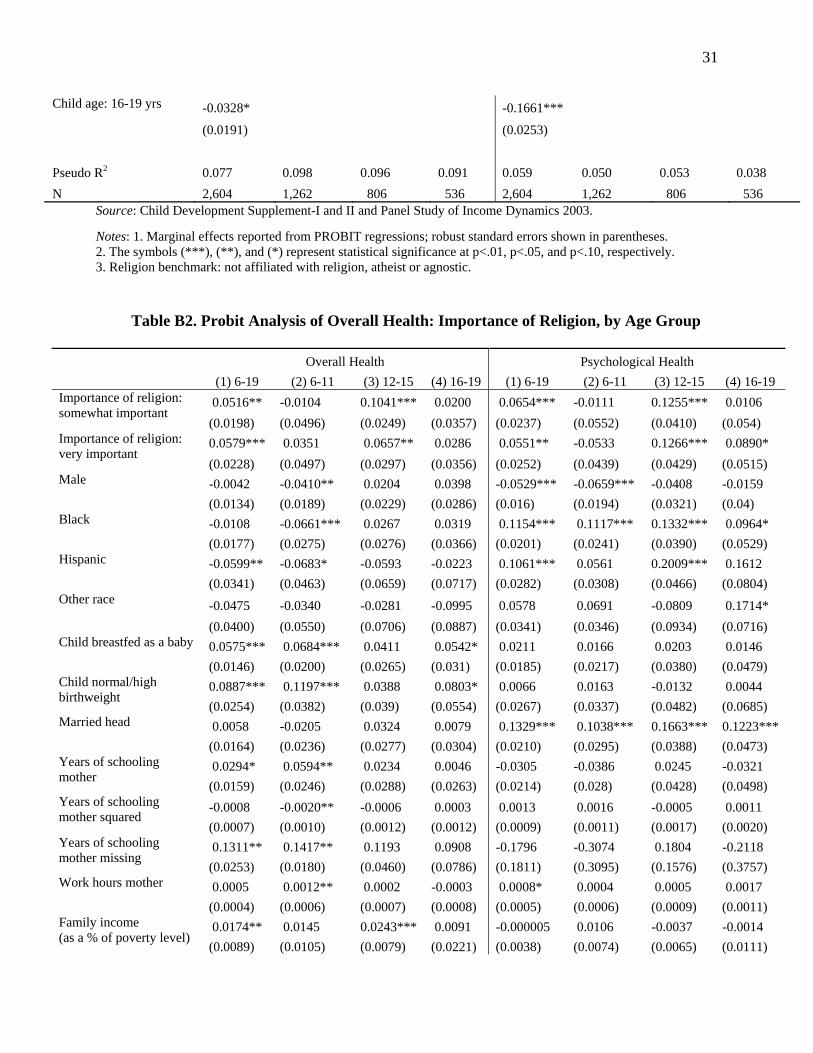
The importance of religion variable, where the benchmark is that it is not important, is
positive and highly significant for overall health for ages 6 to 19 and ages 12 to 15. The same
pattern holds for psychological health.
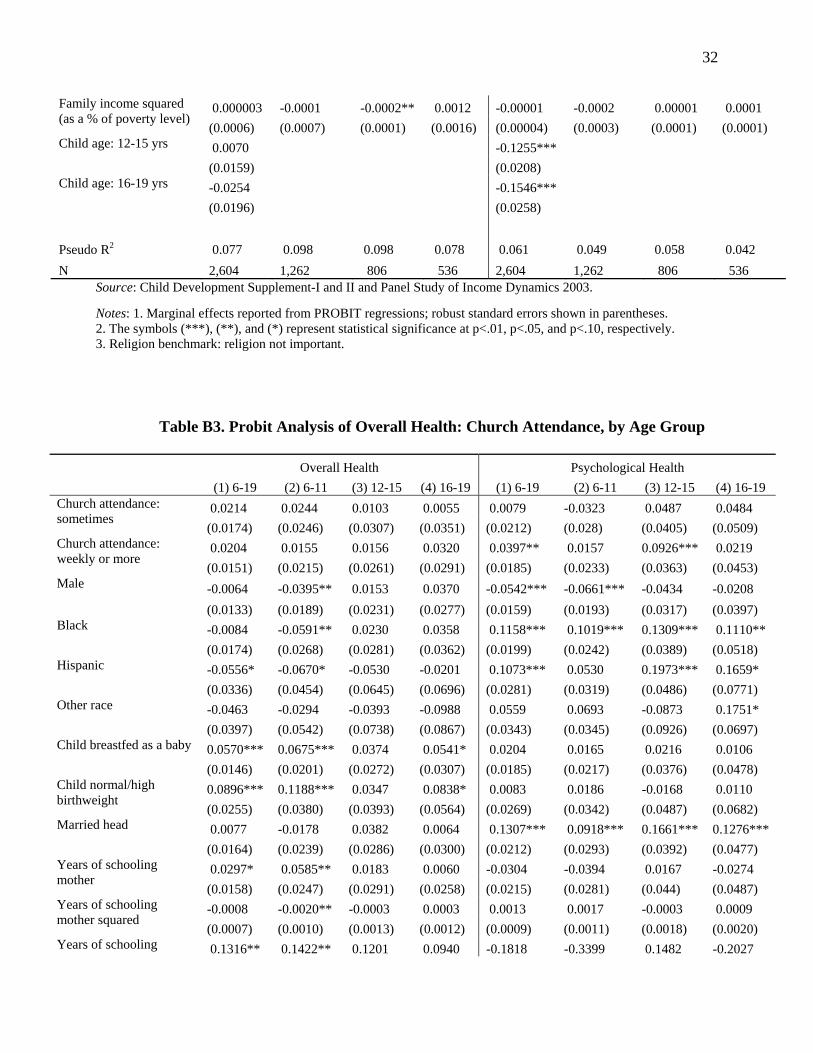
The benchmark for the church attendance variable is never or seldom attend church.
Church attendance apparently consistently has a positive effect on overall health, but it is not
statistically significant even at a 15 percent level of significance. Church attendance generally
has a positive effect on psychological health and is highly statistically significant for those who
attend weekly or more frequently compared to those who never or seldom attend for all age
groups combined and those ages 16-19.
V. Discussion and Conclusion
This paper is concerned with the effects of religious affiliation and religiosity (measured
by frequency of church attendance and importance of religion) on the overall health and
psychological health of children ages 6 to 19, as reported in the 1997 and 2002 Child
Development Supplements and the 2003 Panel Study of Income Dynamics. The hypothesis that
religious affiliation and religiosity have a beneficial effect on health status is generally supported
by the data. The paper develops a model of child health which includes the effect of religion and
estimates the health production equation using Probit analysis. The descriptive statistics indicate
that health status (overall or psychological) increases with having a religious affiliation and with
the degree of religiosity. Other variables the same, overall health is greater if the child had better
initial health (breastfed as a baby, had a normal or high birthweight), has a more favorable family
environment (more educated mother, higher family income) and has a religious affiliation.
Reported psychological health is greater for girls, Blacks and Hispanics (as compared to Whites),
15
if the child is living in a two-parent household, and particularly for 12 to 15 year olds, if the child
has a religious affiliation.
While religious affiliation matters, compared to having no religion, there does not appear
to be a consistent significant effect of any particular denomination among the affiliated.
Children and adolescents who view religion as very important among those ages 6 to 19,
and the subset ages 12 to 15, have better overall and psychological health than those who view it
as not important. Frequency of church attendance does not seem to matter for overall health, but
does matter for 6-19 year olds and the sub-group of 12-15 year olds for psychological health.
Those who attend church weekly or more frequently appear to have better psychological health
than less frequent attendees.
Curiously, by age group, the strongest effect of religion and religiosity is found among
those ages 12 to 15. The years of transitioning from childhood to adolescence and into adulthood
may be associated with peer pressure and teenage angst. Further research is warranted to
determine whether this is a characteristic of young teens in general, or is related to issues of
measuring health and religion among youths.
The statistical control variables also revealed interesting patterns. Initial health (breastfed
and birthweight) was more important for the younger group (ages 6 to 11) than for the older
group (16-19), suggesting a dissipation in these initial health effects as children get older. Blacks
and Hispanic youth were in better psychological health than Whites, perhaps because limited
access to health care resulted in less reporting of such problems to care-givers. Favorable family
characteristics, such as mother’s education, family income, and two-parent households are
associated with better child health.
16
This study suggests that the findings in the literature of a positive health effect of
religious affiliation and practice for adults may also apply to children. The literature also
indicates that better child health results in better adult health. Thus, starting a child on the path of
religious belief and involvement can have beneficial health effects in the short-run and in the
long-run. This has favorable implications for personal well-being and health care costs.
These findings have implications for religious communities and denominations. The
involvement of children in religious practices, and providing them with the opportunity to obtain
religious human capital, will not only increase their religious involvement as they become adults,
but will also have beneficial spill-over effects, even if not intended, on the health of the
congregation.
Finally, there are implications for public policy. A religion-friendly public policy, even
without favoring any one religion, can have positive effects on the population’s health status,
even among children, and thereby reduce public expenditures on health care. Health care costs
have been rising rapidly in the past several decades, from 5% of GDP in 1960 to 16% in 2005,
i.e., $6,697 per person per year, and are expected to reach 20% by 2015 (Catlin et al., 2007;
Sood et al., 2007). In addition, healthier adults generate greater productivity and higher life
satisfaction.
Some of these beneficial effects of religion on child health may arise from discouraging
unhealthy behavior on the part of children and their parents. Decreasing smoking, alcohol and
drug use, crime, teenage pregnancies, and unsafe sexual practices may be responsible factors.
Further research is warranted to tease out the mechanisms through which religion and religiosity
have beneficial health effects on youths.

17
Finding a positive relationship between measures of religion and health cannot establish
causality but raise the possibility that something about religion is protective. People who are
religious are almost certainly different from non-believing people in ways that go beyond their
religiosity and beyond the basic educational and demographic controls used here.
18
Table 1. Means and Standard Deviations of Variables for Overall and Psychological Health and Religiosity Overall Health Psychological Health Sample Size Mean SD Mean SD N (1) (2) (3) (4) (5) Religious Affiliation Not Affiliated 0.79 0.41 0.73 0.44 272 Affiliated 0.85 0.35 0.79 0.41 2,332 Catholic 0.84 0.37 0.82 0.39 538 Mainline Protestant 0.89 0.31 0.79 0.41 488 Conservative Protestant 0.84 0.37 0.77 0.42 1,135 Other Religion 0.88 0.33 0.79 0.41 171 Importance of Religion Not important 0.81 0.40 0.65 0.48 327 Somewhat important 0.86 0.35 0.79 0.41 666 Very important 0.85 0.36 0.81 0.40 1,611 Church Attendance None or seldom 0.82 0.38 0.74 0.44 869 Sometimes or monthly 0.86 0.34 0.78 0.42 611 Weekly or more 0.85 0.35 0.82 0.39 1,124 Total Sample 2,604 2,604 2,604 Source: Child Development Supplement-I and II and Panel Study of Income Dynamics 2003. Note: “SD” stands for Standard Deviation.
19
Table 2. Means and Standard Deviations of Dependent and Explanatory Variables, by Presence of Religious Affiliation
Full Sample Non-affiliated Affiliated Diff Mean SD Mean SD Mean SD (1) (2) (3) (4) (5) (6) (7) Overall Health 0.85 0.36 0.79 0.41 0.85 0.35 *** Psychological Health 0.78 0.41 0.73 0.44 0.79 0.41 ** No Religion, Atheist, Agnostic 0.10 0.31 1 0 0 0 --- Affiliated with Religion 0.90 0.31 0 0 1 0 --- Catholic 0.21 0.40 0 0 0.23 0.42 *** Mainline Protestant 0.19 0.39 0 0 0.21 0.41 *** Conservative Protestant 0.44 0.50 0 0 0.49 0.50 *** Other Religion 0.07 0.25 0 0 0.07 0.26 *** Importance of religion: not important 0.13 0.33 0.61 0.49 0.07 0.25 *** Importance of religion: somewhat important 0.26 0.44 0.17 0.38 0.27 0.44 *** Importance of religion: very important 0.62 0.49 0.22 0.41 0.67 0.47 *** Church attendance: none or seldom 0.33 0.47 0.65 0.48 0.30 0.46 *** Church attendance: monthly or sometimes 0.23 0.42 0.16 0.37 0.24 0.43 *** Church attendance: weekly or more 0.43 0.50 0.19 0.39 0.46 0.50 *** Male 0.51 0.50 0.57 0.50 0.50 0.50 ** White 0.48 0.50 0.55 0.50 0.47 0.50 *** Black 0.41 0.49 0.36 0.48 0.41 0.49 Hispanic 0.08 0.27 0.04 0.19 0.08 0.27 *** Other race 0.04 0.20 0.06 0.23 0.04 0.20 Child breastfed as a baby 0.45 0.50 0.50 0.50 0.45 0.50 * Child normal/high birthweight 0.89 0.31 0.88 0.33 0.89 0.31 Married head 0.62 0.49 0.52 0.50 0.63 0.48 *** Years of schooling mother 12.06 3.91 11.38 4.33 12.14 3.85 *** Years of schooling mother missing 0.06 0.24 0.10 0.29 0.06 0.23 *** Work hours mother 26.26 18.55 28.94 18.56 25.95 18.52 *** Family income (as a % of poverty level) 3.39 4.46 3.40 2.99 3.39 4.60 Child age: 6-11 yrs 0.48 0.50 0.39 0.49 0.50 0.50 *** Child age: 12-15 yrs 0.31 0.46 0.32 0.47 0.31 0.46 Child age: 16-19 yrs 0.21 0.40 0.29 0.45 0.20 0.40 *** Age 11.79 3.63 12.49 3.79 11.71 3.61 *** N 2,604 272 2,332
Source: Child Development Supplement-I and II and Panel Study of Income Dynamics 2003.
Notes: 1. “SD” stands for standard deviation. 2. The means for the “Non-affiliated” and “Affiliated” columns were compared using a t-test for the continuous variables and test of proportions for the dichotomous variable means. The differences were reported in “Diff” Column (Column 7). 3. (***), (**), and (*) represent statistical significance at p<.01, p<.05, and p<.10, respectively. 4. The variables are defined in Appendix A.
20
Table 3. Probit Analysis of Overall Health: Affiliation, by Age Group
6-19 (1)
6-11 (2)
12-15 (3)
16-19 (4)
0.0668*** 0.0607* 0.1238*** 0.0306 Affiliated with Religion
(0.0261) (0.0416) (0.0481) (0.0431) -0.0057 -0.0395** 0.0201 0.0388 Male
(0.0133) (0.0188) (0.0231) (0.0282) -0.0086 -0.0624** 0.0239 0.0356 Black
(0.0173) (0.0266) (0.0281) (0.0355) -0.0648** -0.0748* -0.0738 -0.0235 Hispanic
(0.0343) (0.0462) (0.0681) (0.0716) -0.0452 -0.0254 -0.0511 -0.0924 Other race
(0.0395) (0.0533) (0.0768) (0.0870) 0.0592*** 0.0687*** 0.0436 0.0545* Child breastfed as a baby
(0.0146) (0.0201) (0.0268) (0.0310) 0.0879*** 0.1161*** 0.0366 0.0811* Child normal/high birthweight
(0.0255) (0.0379) (0.0396) (0.0562) 0.0063 -0.0194 0.0318 0.0084 Married head
(0.0163) (0.0234) (0.0278) (0.0304) 0.0295* 0.0603*** 0.0167 0.0051 Years of schooling mother
(0.0158) (0.0248) (0.0290) (0.0261) -0.0008 -0.0021** -0.0003 0.0003 Years of schooling mother squared
(0.0007) (0.0010) (0.0012) (0.0012) 0.1308** 0.1424** 0.1103 0.0917 Years of schooling mother missing
(0.0249) (0.0179) (0.0600) (0.0768) 0.0006 0.0013** 0.0003 -0.0004 Work hours mother
(0.0004) (0.0006) (0.0007) (0.0008) 0.0165** 0.0143 0.0232*** 0.0090 Family income (as a % of poverty level)
(0.0089) (0.0091) (0.0080) (0.0223) 0.00005 -0.0002 -0.0002* 0.0012 Family income squared (as a % of
poverty level) (0.0006) (0.0004) (0.0001) (0.0016) -0.00002 Child age: 12-15 yrs
(0.0155) -0.0333* Child age: 16-19 yrs
(0.0192)
Pseudo R2 0.077 0.097 0.092 0.078 N 2,604 1,262 806 536
Source: Child Development Supplement-I and II and Panel Study of Income Dynamics 2003. Notes: 1. Marginal effects reported from PROBIT regressions; robust standard errors shown in parentheses. 2. The symbols (***), (**), and (*) represent statistical significance at p<.01, p<.05, and p<.10, respectively. 3. Religion benchmark: not affiliated with religion, atheist or agnostic.
21
Table 4. Probit Analysis of Psychological Health: Affiliation, by Age Group
6-19 (1)
6-11 (2)
12-15 (3)
16-19 (4)
Affiliated with Religion 0.0095 -0.0398 0.0923* -0.0034 (0.0259) (0.0305) (0.0549) (0.0562) Male -0.0559*** -0.0673*** -0.0476 -0.0254 (0.0159) (0.0193) (0.0319) (0.0395) Black 0.1195*** 0.1056*** 0.1439*** 0.1216** (0.0196) (0.0238) (0.0383) (0.0512) Hispanic 0.1085*** 0.0573 0.1895*** 0.1658* (0.0280) (0.0311) (0.0522) (0.0777) Other race 0.0581 0.0673 -0.0792 0.1765* (0.0341) (0.0350) (0.0910) (0.0693) Child breastfed as a baby 0.0199 0.0157 0.0247 0.0105 (0.0185) (0.0218) (0.0378) (0.0478) Child normal/high birthweight 0.0074 0.0185 -0.0124 0.0085 (0.0268) (0.0343) (0.0489) (0.0681) Married head 0.1367*** 0.1001*** 0.1754*** 0.1301*** (0.0210) (0.0291) (0.0388) (0.0475) Years of schooling mother -0.0306 -0.0418 0.0121 -0.0316 (0.0215) (0.0281) (0.0442) (0.0483) Years of schooling mother squared 0.0014 0.0018 -0.0001 0.0011 (0.0009) (0.0011) (0.0018) (0.0020) Years of schooling mother missing -0.1748 -0.3419 0.1326 -0.2293 (0.1807) (0.3130) (0.2032) (0.3633) Work hours mother 0.0007 0.0004 0.0003 0.0016 (0.0005) (0.0006) (0.0009) (0.0011) Family income (as a % of poverty level) -0.0004 0.0115 -0.0050 -0.0015 (0.0038) (0.0073) (0.0063) (0.0109) Family income squared (as a % of poverty level) -0.00001 -0.0002 0.00001 0.0001 (0.00004) (0.0003) (0.0001) (0.0001) Child age: 12-15 yrs -0.1334*** (0.0205) Child age: 16-19 yrs -0.1660*** (0.0253) Pseudo R2 0.059 0.046 0.051 0.036 N 2,604 1,262 806 536 Source: Child Development Supplement-I and II and Panel Study of Income Dynamics 2003.
Notes: 1. Marginal effects reported from PROBIT regressions; robust standard errors shown in parentheses. 2. The symbols (***), (**), and (*) represent statistical significance at p<.01, p<.05, and p<.10, respectively. 3. Religion benchmark: not affiliated with religion, atheist or agnostic.
22
Table 5. Child Overall and Psychological Health,
by Religious Denomination and Age Group
Overall Health Psychological Health (1) 6-19 (2) 6-11 (3) 12-15 (4) 16-19 (1) 6-19 (2) 6-11 (3) 12-15 (4) 16-19
0.0466** 0.0287 0.0579 0.0805** 0.0318 0.0031 0.0468 0.0205 Catholic
(0.0218) (0.0358) (0.0333) (0.0393) (0.0293) (0.0424) (0.0586) (0.0697)
0.0600*** 0.0509 0.1064*** 0.0166 0.0157 -0.0440 0.1146** -0.0299 Mainline Protestant
(0.0207) (0.0320) (0.0246) (0.0450) (0.0297) (0.0462) (0.0511) (0.0719) 0.0568*** 0.0613* 0.1015*** 0.0010 -0.0020 -0.0587 0.0859* -0.0118 Conservative Protestant
(0.0214) (0.0329) (0.0338) (0.0405) (0.0272) (0.0412) (0.0511) (0.0620) 0.0613** 0.0488 0.0615 0.0881* 0.0060 -0.0789 0.0860 0.0751 Other religion
(0.0232) (0.0356) (0.0351) (0.0427) (0.0393) (0.0628) (0.065) (0.0984)
Pseudo R2 0.077 0.098 0.096 0.091 0.059 0.050 0.053 0.038 N 2,604 1,262 806 536 2,604 1,262 806 536
Source: Child Development Supplement-I and II and Panel Study of Income Dynamics 2003. Notes: 1. Marginal effects reported from PROBIT regressions; robust standard errors are shown in parentheses. 2. The symbols (***), (**), and (*) represent statistical significance at p<.01, p<.05, and p<.10, respectively. 3. Religion benchmark: not affiliated with religion, atheist or agnostic. 4. The regressions control also for gender, race, breastfed, birthweight, married head, mother’s education and work status, family income, and child’s age. 5. Full regression equations are reported in Appendix B.
23
Table 6. Child Overall and Psychological Health, by Various Dimensions of Religion and Age Group
Overall Health Psychological health
6-19 (1)
6-11 (2)
12-15 (3)
16-19 (4)
6-19 (5)
6-11 (6)
12-15 (7)
16-19 (8)
0.0668*** 0.0607* 0.1238*** 0.0306 0.0095 -0.0398 0.0923* -0.0034 Affiliated with Religion
(0.0261) (0.0416) (0.0481) (0.0431) (0.0259) (0.0305) (0.0549) (0.0562)
Pseudo R2 0.077 0.097 0.092 0.078 0.059 0.046 0.051 0.036 N 2,604 1,262 806 536 2,604 1,262 806 536
6-19 (1)
6-11 (2)
12-15 (3)
16-19 (4)
6-19 (5)
6-11 (6)
12-15 (7)
16-19 (8)
0.0516** -0.0104 0.1041*** 0.0200 0.0654*** -0.0111 0.1255*** 0.0106 Importance of religion: somewhat important
(0.0198) (0.0496) (0.0249) (0.0357) (0.0237) (0.0552) (0.0410) (0.054) 0.0579*** 0.0351 0.0657** 0.0286 0.0551** -0.0533 0.1266*** 0.0890* Importance of religion:
very important (0.0228) (0.0497) (0.0297) (0.0356) (0.0252) (0.0439) (0.0429) (0.0515)
R2 0.077 0.098 0.098 0.078 0.061 0.049 0.058 0.042 N 2,604 1,262 806 536 2,604 1,262 806 536
6-19 (1)
6-11 (2)
12-15 (3)
16-19 (4)
6-19 (5)
6-11 (6)
12-15 (7)
16-19 (8)
0.0214 0.0244 0.0103 0.0055 0.0079 -0.0323 0.0487 0.0484 Church attendance: sometimes or monthly
(0.0174) (0.0246) (0.0307) (0.0351) (0.0212) (0.028) (0.0405) (0.0509) 0.0204 0.0155 0.0156 0.0320 0.0397** 0.0157 0.0926*** 0.0219 Church attendance:
weekly or more (0.0151) (0.0215) (0.0261) (0.0291) (0.0185) (0.0233) (0.0363) (0.0453)
R2 0.074 0.095 0.080 0.079 0.060 0.048 0.054 0.038 N 2,604 1,262 806 536 2,604 1,262 806 536
Source: Child Development Supplement-I and II and Panel Study of Income Dynamics 2003.
Notes: 1. Marginal effects reported from PROBIT regressions; robust standard errors are shown in parentheses. 2. The symbols (***), (**), and (*) represent statistical significance at p<.01, p<.05, and p<.10, respectively. 3. Religion benchmarks: affiliation: none, atheist or agnostic (top panel); importance of religion: not important (middle panel); and church attendance: none or seldom (bottom panel). 4. The regressions control also for gender, race, breastfed, birthweight, married head, mother’s education and work status, family income, and child’s age. 5. Full regression equations for importance of religion and for church attendance are reported in Appendix B.
24
References Abbotts, J. A., Williams, R. G. A., Sweeting, H.N., and West, P.B. (2004). Is going to church good or bad for you? Denomination, attendance and mental health of children in West Scotland. Social Science & Medicine, 58, 645-56. Azzi, C., Ehrenberg, R.G. (1975) Household allocation of time and church attendance. Journal of Political Economy, 83, 27–56. Benson, P. L., Roehlkepartain, E. C., and Rude, S. P. (2003) Spiritual development in childhood and adolescence: Toward a field of inquiry. Applied Developmental Science, 7, 205–13. Borowsky, I.W., Ireland, M., and Resnick, M.D. (2001) Adolescent suicide attempts: risks and protectors. Pediatrics, 107, 485-93. Catlin, A., Cowan C., Heffler, S., Washington, B., and the National Health Expenditure Accounts Team. (2007) National health spending in 2005: The slowdown continues. Health Affairs, 26, 142-53. Donahue, M.J. and Benson, P.L. (1995) Religion and the well–being of adolescents. Journal of Social Issues, 51, 145–60. Ellison, C.G., Boardman, J.D., Williams, D.R., and Jackson, J.S. (2001) Religious involvement, stress, and mental health: Findings from the 1995 Detroit Area Study, Social Forces, 80, 215-49. Gallup, G. and Bezilla, R. (1992) The Religious Life of Young Americans: A Compendium of Surveys on the Spiritual Beliefs and Practices of Teenagers and Young Adults, G. H. Gallup International Institute, Princeton. Gallup. (2009) Religion. Available at http://www.gallup.com/poll/1690/religion.aspx (accessed on 9 August 2010). Grossman, M. (1972) On the concept of health capital and the demand for health. Journal of Political Economy, 82, 223–55. Iannaccone, L.R. (1990) Religious practice: A human capital approach. Journal for the Scientific Study of Religion, 29, 297–314. Johnson, B.R., Tompkins, R.B., and Webb, D. (2002) Objective hope: Assessing the effectiveness of faith-based organizations: A review of the literature. A report from the Center for Research on Religion and Urban Civil Society, University of Pennsylvania. Kandel, D.B., Raveis, V.H., and Davies, M. (1991) Suicidal ideation in adolescence: Depression substance use, and other risk factors. Journal of Youth and Adolescence, 20, 289-301. Koenig, H.G., McCollough, M.E., and Larson, D.B. (2001), Handbook on Religion and Health, Oxford University Press, New York.
25
Lee, B.Y. and Newberg, A.B. (2005) Religion and health: A review and critical analysis. Zygon, 40, 443-68. Leibowitz, A.A. (2005) An economic perspective on work, family and well-being in Work, Family, Health and Well-Being, (Eds.) S.M. Bianchi, L.M. Casper and R.B. King, Routledge. McCullough, M.E. and Smith, T.B. (2003) Religion and health: depressive symptoms of mortality as case studies, in Handbook of the sociology of religion, (Ed) M. Dillon,Cambridge University Press, Cambridge, pp. 190-206. Miller, L. and Gur, M. (2002) Religiousness and sexual responsibility in adolescent girls, Journal of Adolescent Health, 31, 401-6. Pearce, L.D. and Axinn, W.G. (1998) The impact of family religious life on the quality of mother–child relations, American Sociological Review, 63, 810–28. Regnerus, M.D. (2003) Religion and positive adolescent outcomes: A review of research and theory, Review of Religious Research, 44, 394-413. Sood, N., Ghosh, A., and Escarse, J.J. (2007) The effect of health care cost growth on the U.S. Economy: Final report. Office of the Assistant Secretary for Planning and Evaluation (ASPE), U.S. Department of Health and Human Services (HHS). Available at http://aspe.hhs.gov/health/reports/08/healthcarecost/report.html (accessed on 30 August 2010). Stein, D., Witztum, E., and DeNour, A.K. (1989) Adolescent attitudes toward suicide, Israel Journal f Psychiatry and Related Sciences, 26, 1-2. Stein, D., Witztum, E., Brom, D., and DeNour, A.K. (1992) The association between adolescent attitudes towards suicide and their psychosocial background and suicidal tendencies, Adolescence, 27, 949-59. The Pew Forum on Religion & Public Life (2008) U.S. religious landscape survey. Religious affiliation: Diverse and dynamic. Available at http://religions.pewforum.org/pdf/report-religious-landscape-study-full.pdf (accessed on 9 August 2010). Watt, T.T. and Sharp, S.F. (2001) Gender differences in strains associated with suicidal behavior among adolescents, Journal of Youth and Adolescence, 30, 333-48. Wooldridge, J.M. (2000) Introductory Econometrics: A Modern Approach, South–Western College Publishing, Thomson Learning. World Health Organization (WHO). (2004) Low Birthweight: Country, regional and global Estimates. New York, Statistics and Monitoring, United Nations Children’s Fund, and Geneva, Department of Reproductive Health and Research, World Health Organization. Available at http://www.who.int/reproductive_indicators/indicator.asp?indicator=LBW (accessed on 1 June 2008).
26
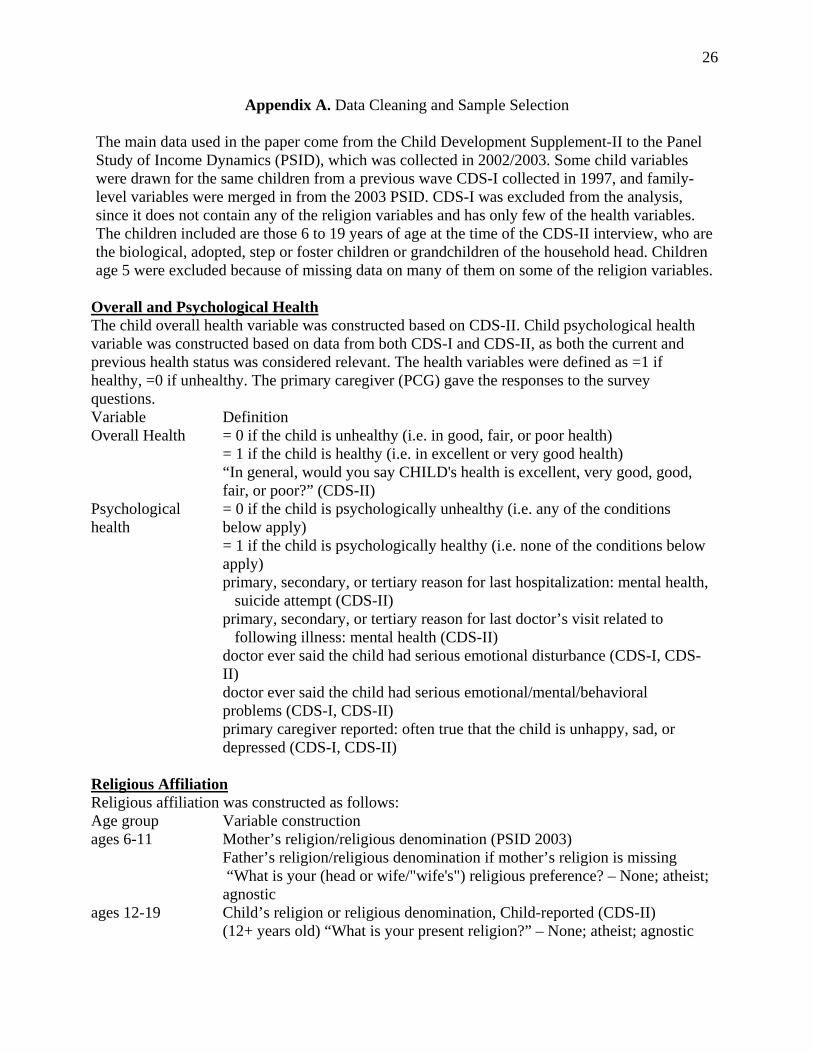
Appendix A. Data Cleaning and Sample Selection The main data used in the paper come from the Child Development Supplement-II to the Panel Study of Income Dynamics (PSID), which was collected in 2002/2003. Some child variables were drawn for the same children from a previous wave CDS-I collected in 1997, and family-level variables were merged in from the 2003 PSID. CDS-I was excluded from the analysis, since it does not contain any of the religion variables and has only few of the health variables. The children included are those 6 to 19 years of age at the time of the CDS-II interview, who are the biological, adopted, step or foster children or grandchildren of the household head. Children age 5 were excluded because of missing data on many of them on some of the religion variables.
Overall and Psychological Health The child overall health variable was constructed based on CDS-II. Child psychological health variable was constructed based on data from both CDS-I and CDS-II, as both the current and previous health status was considered relevant. The health variables were defined as =1 if healthy, =0 if unhealthy. The primary caregiver (PCG) gave the responses to the survey questions. Variable Definition Overall Health = 0 if the child is unhealthy (i.e. in good, fair, or poor health)
= 1 if the child is healthy (i.e. in excellent or very good health) “In general, would you say CHILD's health is excellent, very good, good,
fair, or poor?” (CDS-II) Psychological health
= 0 if the child is psychologically unhealthy (i.e. any of the conditions below apply) = 1 if the child is psychologically healthy (i.e. none of the conditions below apply)
primary, secondary, or tertiary reason for last hospitalization: mental health, suicide attempt (CDS-II) primary, secondary, or tertiary reason for last doctor’s visit related to following illness: mental health (CDS-II) doctor ever said the child had serious emotional disturbance (CDS-I, CDS-II) doctor ever said the child had serious emotional/mental/behavioral problems (CDS-I, CDS-II) primary caregiver reported: often true that the child is unhappy, sad, or depressed (CDS-I, CDS-II)
Religious Affiliation Religious affiliation was constructed as follows: Age group Variable construction ages 6-11 Mother’s religion/religious denomination (PSID 2003)
Father’s religion/religious denomination if mother’s religion is missing “What is your (head or wife/"wife's") religious preference? – None; atheist; agnostic
ages 12-19 Child’s religion or religious denomination, Child-reported (CDS-II) (12+ years old) “What is your present religion?” – None; atheist; agnostic
27
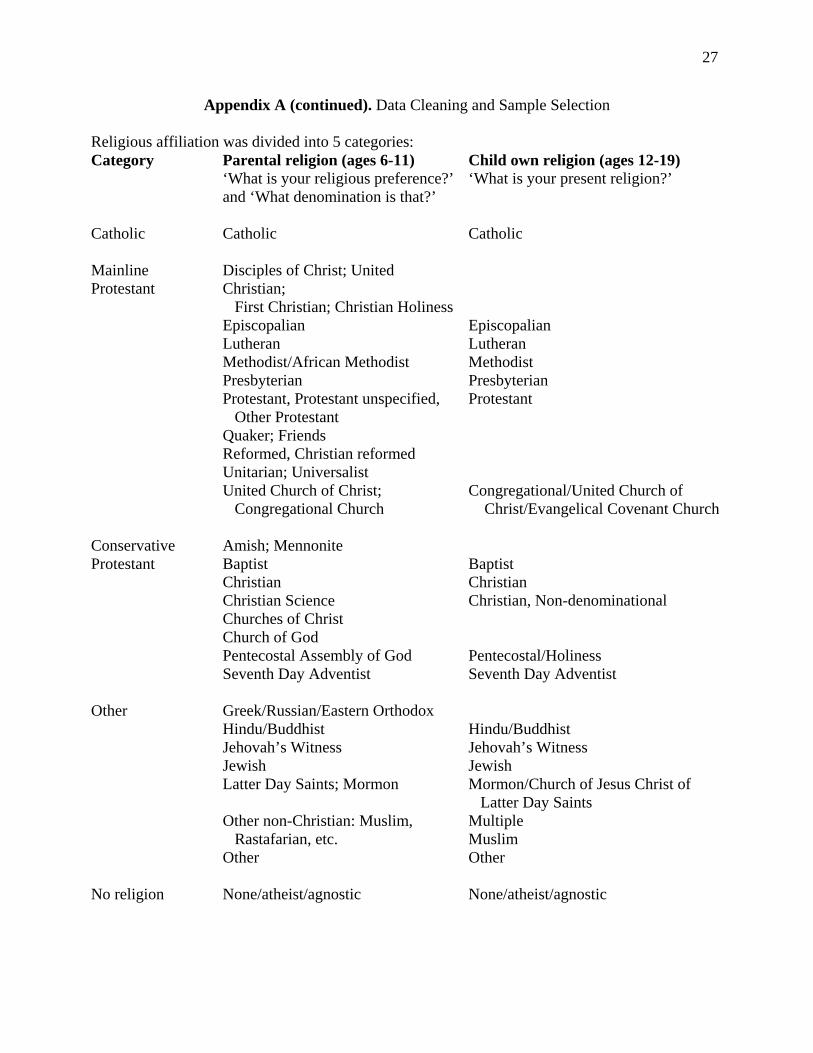
Appendix A (continued). Data Cleaning and Sample Selection
Religious affiliation was divided into 5 categories: Category Parental religion (ages 6-11)
‘What is your religious preference?’ and ‘What denomination is that?’
Child own religion (ages 12-19) ‘What is your present religion?’
Catholic
Catholic
Catholic
Mainline Protestant
Disciples of Christ; United Christian; First Christian; Christian Holiness Episcopalian Lutheran Methodist/African Methodist Presbyterian Protestant, Protestant unspecified, Other Protestant Quaker; Friends Reformed, Christian reformed Unitarian; Universalist United Church of Christ; Congregational Church
Episcopalian Lutheran Methodist Presbyterian Protestant Congregational/United Church of Christ/Evangelical Covenant Church
Conservative Protestant
Amish; Mennonite Baptist Christian Christian Science Churches of Christ Church of God Pentecostal Assembly of God Seventh Day Adventist
Baptist Christian Christian, Non-denominational Pentecostal/Holiness Seventh Day Adventist
Other
Greek/Russian/Eastern Orthodox Hindu/Buddhist Jehovah’s Witness Jewish Latter Day Saints; Mormon Other non-Christian: Muslim, Rastafarian, etc. Other
Hindu/Buddhist Jehovah’s Witness Jewish Mormon/Church of Jesus Christ of Latter Day Saints Multiple Muslim Other
No religion
None/atheist/agnostic
None/atheist/agnostic
28
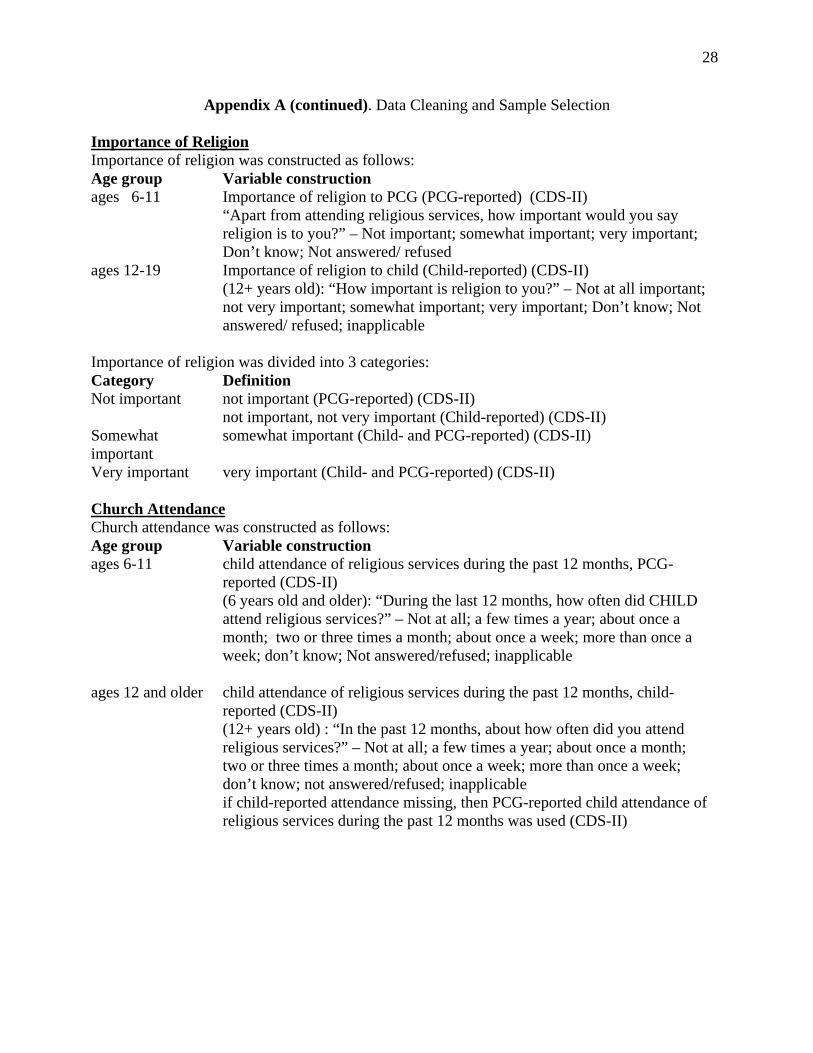
Appendix A (continued). Data Cleaning and Sample Selection
Importance of Religion Importance of religion was constructed as follows: Age group Variable construction ages 6-11 Importance of religion to PCG (PCG-reported) (CDS-II)
“Apart from attending religious services, how important would you say religion is to you?” – Not important; somewhat important; very important; Don’t know; Not answered/ refused
ages 12-19 Importance of religion to child (Child-reported) (CDS-II) (12+ years old): “How important is religion to you?” – Not at all important; not very important; somewhat important; very important; Don’t know; Not answered/ refused; inapplicable
Importance of religion was divided into 3 categories: Category Definition Not important not important (PCG-reported) (CDS-II)
not important, not very important (Child-reported) (CDS-II) Somewhat important
somewhat important (Child- and PCG-reported) (CDS-II)
Very important very important (Child- and PCG-reported) (CDS-II)
Church Attendance Church attendance was constructed as follows: Age group Variable construction ages 6-11 child attendance of religious services during the past 12 months, PCG-
reported (CDS-II) (6 years old and older): “During the last 12 months, how often did CHILD attend religious services?” – Not at all; a few times a year; about once a month; two or three times a month; about once a week; more than once a week; don’t know; Not answered/refused; inapplicable
ages 12 and older child attendance of religious services during the past 12 months, child-reported (CDS-II) (12+ years old) : “In the past 12 months, about how often did you attend religious services?” – Not at all; a few times a year; about once a month; two or three times a month; about once a week; more than once a week; don’t know; not answered/refused; inapplicable if child-reported attendance missing, then PCG-reported child attendance of religious services during the past 12 months was used (CDS-II)
29
Appendix A (continued). Data Cleaning and Sample Selection
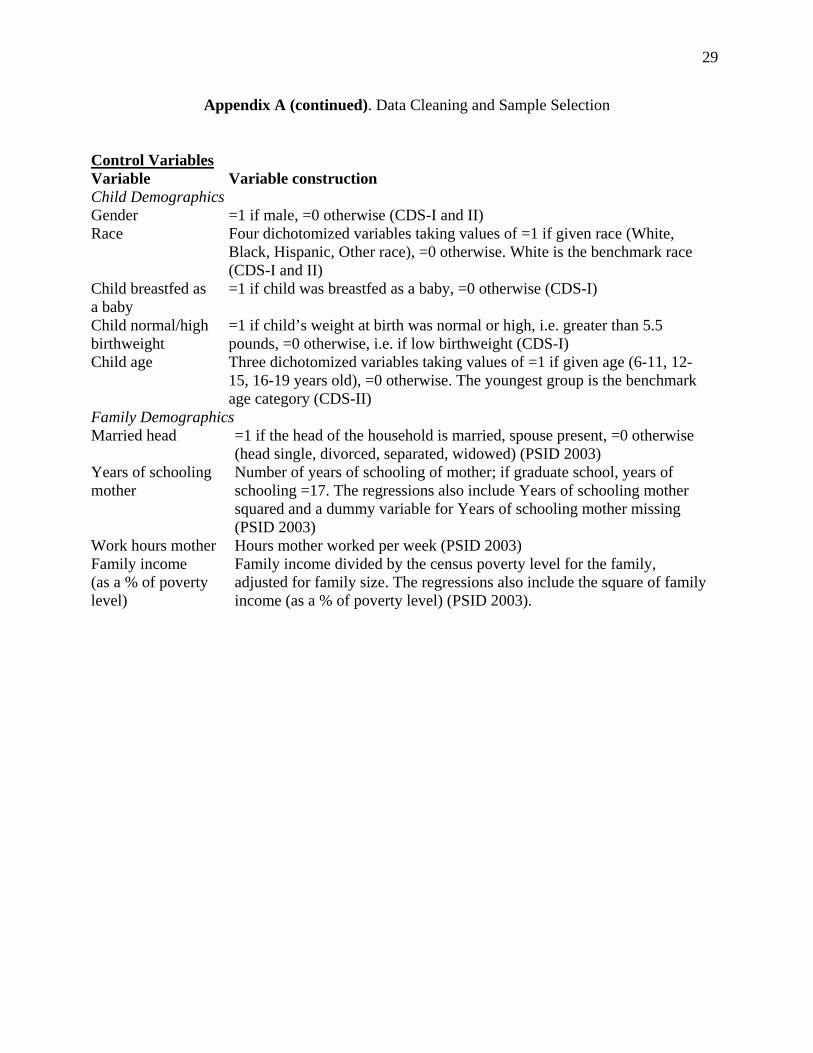
Control Variables Variable Variable construction Child Demographics Gender =1 if male, =0 otherwise (CDS-I and II) Race Four dichotomized variables taking values of =1 if given race (White,
Black, Hispanic, Other race), =0 otherwise. White is the benchmark race (CDS-I and II)
Child breastfed as a baby
=1 if child was breastfed as a baby, =0 otherwise (CDS-I)
Child normal/high birthweight
=1 if child’s weight at birth was normal or high, i.e. greater than 5.5 pounds, =0 otherwise, i.e. if low birthweight (CDS-I)
Child age Three dichotomized variables taking values of =1 if given age (6-11, 12-15, 16-19 years old), =0 otherwise. The youngest group is the benchmark age category (CDS-II)
Family Demographics Married head =1 if the head of the household is married, spouse present, =0 otherwise
(head single, divorced, separated, widowed) (PSID 2003) Years of schooling mother
Number of years of schooling of mother; if graduate school, years of schooling =17. The regressions also include Years of schooling mother squared and a dummy variable for Years of schooling mother missing (PSID 2003)
Work hours mother Hours mother worked per week (PSID 2003) Family income (as a % of poverty level)
Family income divided by the census poverty level for the family, adjusted for family size. The regressions also include the square of family income (as a % of poverty level) (PSID 2003).
30
Appendix B. Full Regression results: by religious denomination, importance of religion, and church attendance
Table B1. Probit Analysis of Overall Health: Religious Denomination, by Age Group
Overall Health Psychological Health (1) 6-19 (2) 6-11 (3) 12-15 (4) 16-19 (1) 6-19 (2) 6-11 (3) 12-15 (4) 16-19
0.0466** 0.0287 0.0579 0.0805** 0.0318 0.0031 0.0468 0.0205 Catholic
(0.0218) (0.0358) (0.0333) (0.0393) (0.0293) (0.0424) (0.0586) (0.0697) 0.0568*** 0.0613* 0.1015*** 0.0010 -0.0020 -0.0587 0.0859* -0.0118 Conservative Protestant
(0.0214) (0.0329) (0.0338) (0.0405) (0.0272) (0.0412) (0.0511) (0.0620) 0.0600*** 0.0509 0.1064*** 0.0166 0.0157 -0.0440 0.1146** -0.0299 Mainline Protestant
(0.0207) (0.0320) (0.0246) (0.045) (0.0297) (0.0462) (0.0511) (0.0719) 0.0613** 0.0488 0.0615 0.0881* 0.0060 -0.0789 0.0860 0.0751 Other religion
(0.0232) (0.0356) (0.0351) (0.0427) (0.0393) (0.0628) (0.0650) (0.0984) -0.0057 -0.0406** 0.0232 0.0364 -0.0561*** -0.0667*** -0.0451 -0.0265 Male
(0.0133) (0.0188) (0.023) (0.0274) (0.0159) (0.0193) (0.0321) (0.0394) -0.0079 -0.0684*** 0.0219 0.0530 0.1274*** 0.1134*** 0.1411*** 0.1218** Black
(0.0180) (0.0279) (0.0288) (0.0388) (0.0207) (0.0247) (0.0406) (0.0547)
-0.0561* -0.0556 -0.0376 -0.0797 0.0996*** 0.0376 0.2062*** 0.1495 Hispanic
(0.0346) (0.0446) (0.0639) (0.0925) (0.0299) (0.0356) (0.0481) (0.0841) -0.0443 -0.0216 -0.0417 -0.0984 0.0585 0.0652 -0.0752 0.1699* Other race
(0.0399) (0.0531) (0.0755) (0.0927) (0.0345) (0.0363) (0.0928) (0.0728) 0.0586*** 0.0680*** 0.0423 0.0550** 0.0209 0.0168 0.0222 0.0080 Child breastfed as a baby
(0.0145) (0.0200) (0.0262) (0.0304) (0.0185) (0.0217) (0.0379) (0.0477) 0.0888*** 0.1162*** 0.0375 0.0858* 0.0072 0.0179 -0.0116 0.0172 Child normal/high
birthweight (0.0256) (0.0379) (0.0391) (0.0576) (0.0268) (0.0341) (0.0487) (0.0699) 0.0063 -0.0183 0.0301 0.0075 0.1343*** 0.0960*** 0.1742*** 0.1297*** Married head
(0.0163) (0.0236) (0.0276) (0.0295) (0.0210) (0.0288) (0.0391) (0.0476) 0.0292* 0.0570** 0.0165 0.0068 -0.0289 -0.0361 0.0124 -0.0324 Years of schooling
mother (0.0159) (0.0248) (0.0286) (0.0257) (0.0215) (0.0282) (0.0442) (0.0481) -0.0008 -0.0019* -0.0003 0.0003 0.0013 0.0016 -0.0001 0.0011 Years of schooling
mother squared (0.0007) (0.0010) (0.0012) (0.0012) (0.0009) (0.0011) (0.0018) (0.0020) 0.1300** 0.1401** 0.1085 0.0974 -0.1616 -0.2846 0.1343 -0.2333 Years of schooling
mother missing (0.0254) (0.0190) (0.0596) (0.0660) (0.1785) (0.3100) (0.2018) (0.3619) 0.0006 0.0013** 0.0002 -0.0003 0.0007* 0.0004 0.0003 0.0017 Work hours mother
(0.0004) (0.0006) (0.0007) (0.0008) (0.0005) (0.0006) (0.0009) (0.0011) 0.0166** 0.0152* 0.0236*** 0.0063 -0.0006 0.0101 -0.0047 -0.0022 Family income
(as a % of poverty level) (0.0090) (0.0092) (0.008) (0.0206) (0.0038) (0.0073) (0.0064) (0.0109) 0.00004 -0.0002 -0.0002* 0.0012 -0.000004 -0.0002 0.00001 0.0001 Family income squared
(as a % of poverty level) (0.0007) (0.0005) (0.0001) (0.0015) (0.00004) (0.0003) (0.0001) (0.0001) 0.0003 -0.1322*** Child age: 12-15 yrs
(0.0155) (0.0206)
31
-0.0328* -0.1661*** Child age: 16-19 yrs
(0.0191) (0.0253)
Pseudo R2 0.077 0.098 0.096 0.091 0.059 0.050 0.053 0.038 N 2,604 1,262 806 536 2,604 1,262 806 536
Source: Child Development Supplement-I and II and Panel Study of Income Dynamics 2003. Notes: 1. Marginal effects reported from PROBIT regressions; robust standard errors shown in parentheses. 2. The symbols (***), (**), and (*) represent statistical significance at p<.01, p<.05, and p<.10, respectively. 3. Religion benchmark: not affiliated with religion, atheist or agnostic. Table B2. Probit Analysis of Overall Health: Importance of Religion, by Age Group
Overall Health Psychological Health (1) 6-19 (2) 6-11 (3) 12-15 (4) 16-19 (1) 6-19 (2) 6-11 (3) 12-15 (4) 16-19
0.0516** -0.0104 0.1041*** 0.0200 0.0654*** -0.0111 0.1255*** 0.0106 Importance of religion: somewhat important
(0.0198) (0.0496) (0.0249) (0.0357) (0.0237) (0.0552) (0.0410) (0.054) 0.0579*** 0.0351 0.0657** 0.0286 0.0551** -0.0533 0.1266*** 0.0890* Importance of religion:
very important (0.0228) (0.0497) (0.0297) (0.0356) (0.0252) (0.0439) (0.0429) (0.0515) -0.0042 -0.0410** 0.0204 0.0398 -0.0529*** -0.0659*** -0.0408 -0.0159 Male
(0.0134) (0.0189) (0.0229) (0.0286) (0.016) (0.0194) (0.0321) (0.04) -0.0108 -0.0661*** 0.0267 0.0319 0.1154*** 0.1117*** 0.1332*** 0.0964* Black
(0.0177) (0.0275) (0.0276) (0.0366) (0.0201) (0.0241) (0.0390) (0.0529) -0.0599** -0.0683* -0.0593 -0.0223 0.1061*** 0.0561 0.2009*** 0.1612 Hispanic
(0.0341) (0.0463) (0.0659) (0.0717) (0.0282) (0.0308) (0.0466) (0.0804)
-0.0475 -0.0340 -0.0281 -0.0995 0.0578 0.0691 -0.0809 0.1714* Other race
(0.0400) (0.0550) (0.0706) (0.0887) (0.0341) (0.0346) (0.0934) (0.0716) 0.0575*** 0.0684*** 0.0411 0.0542* 0.0211 0.0166 0.0203 0.0146 Child breastfed as a baby
(0.0146) (0.0200) (0.0265) (0.031) (0.0185) (0.0217) (0.0380) (0.0479) 0.0887*** 0.1197*** 0.0388 0.0803* 0.0066 0.0163 -0.0132 0.0044 Child normal/high
birthweight (0.0254) (0.0382) (0.039) (0.0554) (0.0267) (0.0337) (0.0482) (0.0685) 0.0058 -0.0205 0.0324 0.0079 0.1329*** 0.1038*** 0.1663*** 0.1223*** Married head
(0.0164) (0.0236) (0.0277) (0.0304) (0.0210) (0.0295) (0.0388) (0.0473) 0.0294* 0.0594** 0.0234 0.0046 -0.0305 -0.0386 0.0245 -0.0321 Years of schooling
mother (0.0159) (0.0246) (0.0288) (0.0263) (0.0214) (0.028) (0.0428) (0.0498) -0.0008 -0.0020** -0.0006 0.0003 0.0013 0.0016 -0.0005 0.0011 Years of schooling
mother squared (0.0007) (0.0010) (0.0012) (0.0012) (0.0009) (0.0011) (0.0017) (0.0020) 0.1311** 0.1417** 0.1193 0.0908 -0.1796 -0.3074 0.1804 -0.2118 Years of schooling
mother missing (0.0253) (0.0180) (0.0460) (0.0786) (0.1811) (0.3095) (0.1576) (0.3757) 0.0005 0.0012** 0.0002 -0.0003 0.0008* 0.0004 0.0005 0.0017 Work hours mother
(0.0004) (0.0006) (0.0007) (0.0008) (0.0005) (0.0006) (0.0009) (0.0011) 0.0174** 0.0145 0.0243*** 0.0091 -0.000005 0.0106 -0.0037 -0.0014 Family income
(as a % of poverty level) (0.0089) (0.0105) (0.0079) (0.0221) (0.0038) (0.0074) (0.0065) (0.0111)
32
0.000003 -0.0001 -0.0002** 0.0012 -0.00001 -0.0002 0.00001 0.0001 Family income squared (as a % of poverty level)
(0.0006) (0.0007) (0.0001) (0.0016) (0.00004) (0.0003) (0.0001) (0.0001) 0.0070 -0.1255*** Child age: 12-15 yrs
(0.0159) (0.0208) -0.0254 -0.1546*** Child age: 16-19 yrs
(0.0196) (0.0258)
Pseudo R2 0.077 0.098 0.098 0.078 0.061 0.049 0.058 0.042 N 2,604 1,262 806 536 2,604 1,262 806 536
Source: Child Development Supplement-I and II and Panel Study of Income Dynamics 2003. Notes: 1. Marginal effects reported from PROBIT regressions; robust standard errors shown in parentheses. 2. The symbols (***), (**), and (*) represent statistical significance at p<.01, p<.05, and p<.10, respectively. 3. Religion benchmark: religion not important.
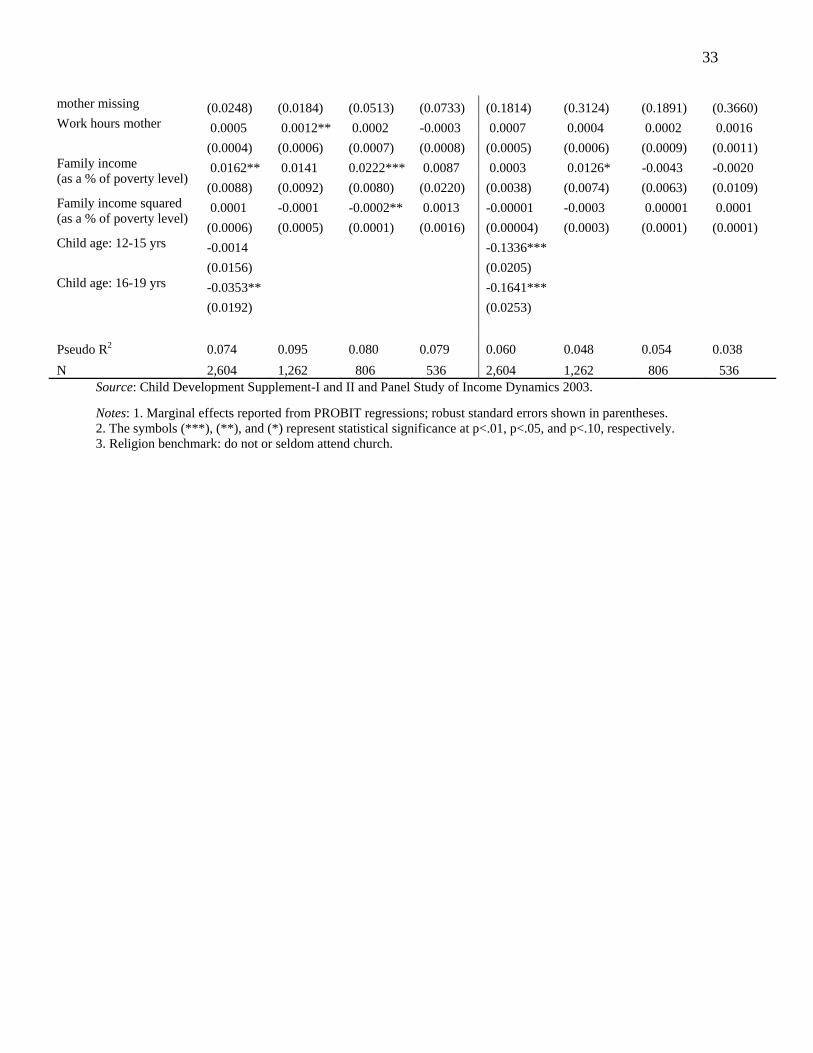
Table B3. Probit Analysis of Overall Health: Church Attendance, by Age Group
Overall Health Psychological Health (1) 6-19 (2) 6-11 (3) 12-15 (4) 16-19 (1) 6-19 (2) 6-11 (3) 12-15 (4) 16-19
0.0214 0.0244 0.0103 0.0055 0.0079 -0.0323 0.0487 0.0484 Church attendance: sometimes
(0.0174) (0.0246) (0.0307) (0.0351) (0.0212) (0.028) (0.0405) (0.0509) 0.0204 0.0155 0.0156 0.0320 0.0397** 0.0157 0.0926*** 0.0219 Church attendance:
weekly or more (0.0151) (0.0215) (0.0261) (0.0291) (0.0185) (0.0233) (0.0363) (0.0453) -0.0064 -0.0395** 0.0153 0.0370 -0.0542*** -0.0661*** -0.0434 -0.0208 Male
(0.0133) (0.0189) (0.0231) (0.0277) (0.0159) (0.0193) (0.0317) (0.0397) -0.0084 -0.0591** 0.0230 0.0358 0.1158*** 0.1019*** 0.1309*** 0.1110** Black
(0.0174) (0.0268) (0.0281) (0.0362) (0.0199) (0.0242) (0.0389) (0.0518) -0.0556* -0.0670* -0.0530 -0.0201 0.1073*** 0.0530 0.1973*** 0.1659* Hispanic
(0.0336) (0.0454) (0.0645) (0.0696) (0.0281) (0.0319) (0.0486) (0.0771) -0.0463 -0.0294 -0.0393 -0.0988 0.0559 0.0693 -0.0873 0.1751* Other race
(0.0397) (0.0542) (0.0738) (0.0867) (0.0343) (0.0345) (0.0926) (0.0697) 0.0570*** 0.0675*** 0.0374 0.0541* 0.0204 0.0165 0.0216 0.0106 Child breastfed as a baby
(0.0146) (0.0201) (0.0272) (0.0307) (0.0185) (0.0217) (0.0376) (0.0478) 0.0896*** 0.1188*** 0.0347 0.0838* 0.0083 0.0186 -0.0168 0.0110 Child normal/high
birthweight (0.0255) (0.0380) (0.0393) (0.0564) (0.0269) (0.0342) (0.0487) (0.0682) 0.0077 -0.0178 0.0382 0.0064 0.1307*** 0.0918*** 0.1661*** 0.1276*** Married head
(0.0164) (0.0239) (0.0286) (0.0300) (0.0212) (0.0293) (0.0392) (0.0477) 0.0297* 0.0585** 0.0183 0.0060 -0.0304 -0.0394 0.0167 -0.0274 Years of schooling
mother (0.0158) (0.0247) (0.0291) (0.0258) (0.0215) (0.0281) (0.044) (0.0487) -0.0008 -0.0020** -0.0003 0.0003 0.0013 0.0017 -0.0003 0.0009 Years of schooling
mother squared (0.0007) (0.0010) (0.0013) (0.0012) (0.0009) (0.0011) (0.0018) (0.0020)
Years of schooling 0.1316** 0.1422** 0.1201 0.0940 -0.1818 -0.3399 0.1482 -0.2027
33
mother missing (0.0248) (0.0184) (0.0513) (0.0733) (0.1814) (0.3124) (0.1891) (0.3660) 0.0005 0.0012** 0.0002 -0.0003 0.0007 0.0004 0.0002 0.0016 Work hours mother
(0.0004) (0.0006) (0.0007) (0.0008) (0.0005) (0.0006) (0.0009) (0.0011) 0.0162** 0.0141 0.0222*** 0.0087 0.0003 0.0126* -0.0043 -0.0020 Family income
(as a % of poverty level) (0.0088) (0.0092) (0.0080) (0.0220) (0.0038) (0.0074) (0.0063) (0.0109) 0.0001 -0.0001 -0.0002** 0.0013 -0.00001 -0.0003 0.00001 0.0001 Family income squared
(as a % of poverty level) (0.0006) (0.0005) (0.0001) (0.0016) (0.00004) (0.0003) (0.0001) (0.0001) -0.0014 -0.1336*** Child age: 12-15 yrs
(0.0156) (0.0205) -0.0353** -0.1641*** Child age: 16-19 yrs
(0.0192) (0.0253)
Pseudo R2 0.074 0.095 0.080 0.079 0.060 0.048 0.054 0.038 N 2,604 1,262 806 536 2,604 1,262 806 536
Source: Child Development Supplement-I and II and Panel Study of Income Dynamics 2003. Notes: 1. Marginal effects reported from PROBIT regressions; robust standard errors shown in parentheses. 2. The symbols (***), (**), and (*) represent statistical significance at p<.01, p<.05, and p<.10, respectively. 3. Religion benchmark: do not or seldom attend church.