remote access to sensor networks - computer sciencerlaz/ms_seminars2012/rajeprojectreport.pdffor the...
TRANSCRIPT

Remote Access to Sensor Networks
2010-2011
R o c h e s t e r I n s t i t u t e o f T e c h n o l o g y , D e p a r t m e n t o f
C o m p u t e r S c i e n c e
L e o n R e z n i k
( C h a i r )
F e r e y d o u n K a z e m i a n ( R e a d e r )
R i c h a r d Z a n i b b i ( O b s e r v e r )
5 / 1 2 / 2 0 1 1

Sensor Networks 2011
Problem Definition
Today Sensor Networks form an important part of various agencies. It is sometimes not
possible for humans to reach areas where sensors can be easily fit in. These sensors can act as
cognitive devices performing the tasks which otherwise a human would have performed. Being
mechanical, they have a better sensing technology which sometimes makes it easier to access
the environment around them and report them to a central server.
Sun SPOT sensors are a great way of deploying a network, especially due to the flexibility
offered by them. This sensor runs a Java Virtual Machine on it and hence can run all the
elementary programs which are written in Java. The J2ME modules and architecture also allows
a lot of flexibility and code migration making it even more useful.
There are some issues and overheads involved with setting up sensors. This is not possible for
naïve users, since it involves a lot of configurations which are more advanced. Furthermore,
since it is programmable, without an efficient program, it is not possible to use such a device off
the shelf.
For an illustration, let us take an example of a weather bureau which wants to deploy
sensors which will sense the temperature and weather changes in order to make a prediction
for the weather. In such a case, the end user may not have knowledge of how to configure the
system in a way so as to start collecting data. An experienced java programmer can write a
program to get the data, but it is of no use if it is not collected properly. Hence the flexibility has
its own flip side and that is problems in deployment.
Another issue with SPOT Sensors is their range. While the devices have a very good
range, it is still not global. Many times outsourcing of work also makes work more efficient. As a
result sometimes the sensors can be half the globe away from where this information could
make a difference. The base station has to be strategically placed in such a case. Hence it was
important to make the base station independent from the control station and the information
processing center in order to efficiently use the networks.
In some cases, the number of SPOT devices might change. Everytime a new device
comes into the picture, due to the nature of the devices, a fresh configuration has to be done.
In such a case, the network is static and not conducive for growth. Furthermore, since the
required communication is mostly unicast, it involves configuring the sender and receiver in
order to successfully start the communication without any handshake protocol. A quick fix to
this solution to have all the sensors broadcasting their data at the same time and the receiver
reading all the broadcasts one after the other, but a quick thought tells us all the negative
2 | P a g e

Sensor Networks 2011
points associated with such an approach, security and network congestion being the prime
factor in mind.
A factor to consider is the setting up of a database. Most relational models do not
support temporal changes, but in case of our need, the Database is inherently temporal since
data keeps changing and a snapshot is definitely not intuitive enough for most of our results.
In most cases Sensor Networks need an efficient access mechanism and the data is
supposed to be aggregated in order to be presented. The data in such cases is not important on
its own but important only when it is aggregated properly.
As seen above, Sensor Networks can be a great tool for monitoring and administering various
parameters related to environment. This is where the project comes into the picture. The
project aims at simplifying the use of Sun SPOT Sensors and then in turn using them for
performing analysis on various parameters such as charts, extrapolation etc.
The main idea is to have the base station connected to the internet and a centralized database
in such a way as to facilitate remote connection over a web site or a web service. This way, the
scope is globalized.
As always the project also aims at simplifying the various problems associated with sensor
networks such as soft expansion. For an example, the ability to add a sensor to the network
without reconfiguration or the ability to start off and or stop the network without any changes
in the network is an example of the simplification process.
And last but not the least, it is important to add a simple and aesthetically good interface to the
application. Since the web applications have progressed in the recent past, it seemed the right
way to access the sensor networks. All these problems have been dealt with by the application.
The details of which are present in the subsequent chapters of this document.
3 | P a g e

Sensor Networks 2011
Project Specifications
SPOT Specifications:
Device built with an embedded Squawk Virtual Machine running Java 1.3 with SPOT App which
is capable of
1) Plug and Play Connectivity
2) Graceful Exits
3) Searching for Base when required
This program can be run and deployed using the ANT build script. It also has a few LED’s for
debugging.
It also has support to change the running frequency based on the various parameters available
in the sensors.
Host App:
Built on Java Version 1.6 capable of Plug and Play addition and restarting of SPOT(s) and
registering new SPOT(s) automatically for future use. This supports both, the dedicated as well
as the shared mode for the base station. The program is built and run using the ANT build tool
as provided by most J2EE applications.
Database:
SQL Server 2008 Database backend running on a windows environment with support for DAC
The Diagram of this database has been attached later on in this document. The database when
empty is around 3.8 MB and can expand as per requirement. Since it is SQL Server 2008, it
supports all the ACID Properties as declared by Microsoft
Web Site
This is an ASP .NET website which supports direct access of the Data in the Database. A part of
it has been reconstructed using the MVVM Design pattern and a special emphasis on various
object oriented technologies.
4 | P a g e

Sensor Networks 2011
This website also has some Atlas Ajax controls for improving the UI and the look and feel of the
application.
5 | P a g e
Sensor Networks 2011
Background and Literature Review
Sensor Networks are basically a set of devices which communicate with each other over an
adhoc or an infrastructure based setup. While most networks are infrastructure based, there
are a few systems which demand the use of adhoc networks. A sensor is a device which as the
name suggests, senses a particular parameter and reports this to the rest of the network. A
system which works at a higher level accumulates all the data reported by all these sensor
networks and then makes its own report. This report could be anything from a temperature
prediction to critical information about dynamics of a vehicle. The sections to come will go into
details of this setup.
Applications and Types
Sensors have their application in almost all types of fields and hence the Sensor Networks is an
upcoming field. Some of the common applications of sensors include
1) Weather monitoring stations
2) Motion Sensors in Lights and Electrical Appliance control in a building
3) Security System in a building
4) Parking lot sensors to determine which parking lot is open (The National Institute of
Standards and Technology)
5) Traffic Sensors to monitor and report traffic
And many more can be added to the list.
Based on its use, a sensor network can be broadly classified into 4 major parts.
1) Networks to determine a parameter and perform various actions on it. Like find the
average temperature of a region, or find the min and max temperature of an area
2) Predict the value of a particular attribute, for eg, predict the speed of a car or
temperature in an area based on interpolated data
3) Track a particular object, for eg track the enemy tank in an area
4) Classify an object based on sensors, eg trucks, cars etc in a toll booth
6 | P a g e
Sensor Networks 2011
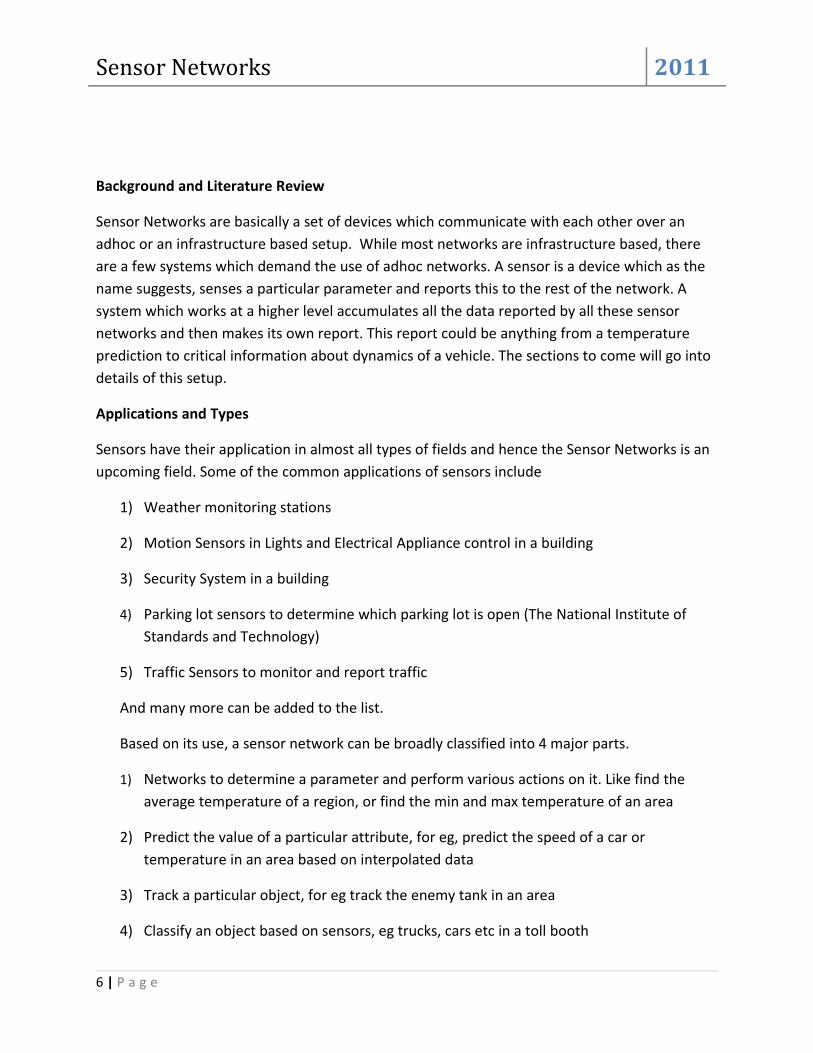
In all these systems, the most important part is to relay this data to the concerned system in
order to take suitable action. For eg, In case of the enemy tank, it is important to inform the
authorities about the breach. In general the sensor networks can be used to identify problems
as follows
(Lee & Mao, 2009)
As seen in the above paper, there are several ways of detecting an anomaly using the sensor
networks as well. However, for the sake of the project, this is not very important and perhaps is
a great future work for the project.
Based on requirements, the network can be designed accordingly. These requirements can
change. Some of the common requirements in a network include
1) Low power use
2) Large number of nodes to support
3) Network Self Organization
4) Querying ability
5) Limited availability of resources
Architecture
7 | P a g e

Sensor Networks 2011
As discussed in (Lan, Qilong, & Du, 2008), the basic architecture for a Sensor Network is as
follows
(Lan, Qilong, & Du, 2008)
The nodes form the end sensors while the ones directly connected to the system forms the
base station. There are multiple connections which may denote a hierarchy of base stations
or in some cases shared base stations.
A more detailed structure of the stack can be seen in the diagram below.
8 | P a g e

Sensor Networks 2011
(Lan, Qilong, & Du, 2008)
As seen from the diagram, each network can be divided into layers like the ISO’s OSI model.
Each layer has its own working and is kept independent of the next layer of abstraction. This
involves a low level of coupling and a higher level of cohesion. I have tried to keep the same
in the various modules of my program.
Since the diagram shown above is strictly for environmental networks, the implementation
is not strictly similar to the one shown above, but as a general thumb rule, I have tried to
follow the guidelines established in the application above.
Sensor Network Abstraction Layer: The main idea of this layer is to communicate with the
network and have an interface for the layers above. This layer hides the complexity of the
underlying network which is an objective of our problem as in the problem statement.
Sensor Information Management Layer: This layer is used to collect all the information
sensed by the various sensors and maintain it in a central location. This may involve a
database backend or a flat file data storage. If the Sensor Network Abstraction Layer has
9 | P a g e

Sensor Networks 2011
been implemented properly, this layer is just another application and hence is not any
different from a desktop application.
SOA / Open API: This is used to expand the current application to new levels of abstraction.
This will ensure that future applications can make use of our application without demanding
any special privileges or rights in the application in a way which is secure and useful at the
same time.
Service
This is the top level of our project which involves the data processing.
I believe that in order to ensure a good architecture, the fundamental must be strong.
Hence most a great deal of effort has been spent in the first part of the project which is the
Sensor Network Abstraction Layer. Around 60% of the entire code revolves around this
layer of the code. (Baeg, Park, Koh, Park, & Baeg, 2007)
Infrastructure based networks are generally made up of a set of sensors which
communicate with a central device. The central device is the one which is generally
connected to the rest of the world, however this is not a requirement. If the case is
different, the inner intricacies are generally abstracted away from the user.
Sensors
Sensors are usually small thin devices with limited computation capacity deployed only to
perform limited tasks. Because of their limited computational limitation, the actions
deployed to the sensors has to be planned keeping in mind a lot of factors.
SUN Programmable Object Technology
Sun Spot sensors are a product of the Sun Microsystems. (Wikipedia Sun Spot) . These
devices are built on the IEEE 802.15.4 standard. These devices run the Squawk Virtual
Machine on them which is a virtual machine for java.
10 | P a g e

Sensor Networks 2011
(Wikipedia Sun Spot)
As seen above. The Squawk Virtual machine has all its layers and a stack of its own which
runs on top of the device and provides an abstraction for the end programmer. Hence the
programmer can write programs in Java and deploy them over the sun spot devices and
expect them to run as they would on their systems.
The Spot devices have their own API which is programmed using java programs and the
internal systems can be queried using this API.
Sun provides a diverse development environment where in programs can be written in an
environment of choice by the user and later deployed to the devices. These devices can be
connected to the system with the use of a USB cable and hence be programmed. The
programs are then deployed using ANT Build Scripts to the individual devices. The same is
applied for the base station. The base station however runs closely with the VM on the
system, and hence runs a regular Java VM.
The program can be divided into two parts
1) Spot App: The app which is deployed on individual Spot sensors which works on the
Squawk VM and sends data to the Base station. This app has a limitation with respect to
access, computational and other issues. For eg this program cannot access specific
objects or resources which are designed to operate only on certain machines. This VM
11 | P a g e

Sensor Networks 2011
also cannot run native applications. This program needs a cable connection in order to
be deployed, but once deployed, it can work on radio technology without a cable
connection.
2) Host App: As mentioned earlier, this is a part of the Sensor Network Abstraction Layer of
the program. This ensures that the top level applications such as the web server have a
direct access to the sensors without bothering about the complexity or the changes in
the underlying sensors (Baeg, Park, Koh, Park, & Baeg, 2007)
This is the part of the program which runs on the base station. This is like any other Java
program and hence has fewer limitations. This can also communicate with the internet
and other services. Since the base station works closely with the system, it needs a
connection all the time it is running. The host app can be run in two modes.
a. Dedicated Mode: In this, only one VM is launched on the Host Machine and this
hosts the base station as well as the running app. Hence the target sensor is just
one radio hop away from the app. Here only one app can run at a time
b. Shared Mode: In this, two VMs are launched by the Host machine. One VM hosts
the app while the other hosts the base station. In this, the base station is 3 radio
hops away from the target sensor. The major advantage of this kind of a
communication is that the base station can be shared by multiple applications
running on the host machine.
The main disadvantage being that the PAN id of the device cannot be changed at
run time.
Tools Used for Development
1) Netbeans : Netbeans is an IDE used for programming in Java. It is primarily used for
Swing and GUI programming. It adds various features such as intellisense auto complete
for code and the ability to add external Jars, compilation, deployment, etc. Since
netbeans is widely accepted and used, it sticks to the standards of the Java community.
The Netbeans modules provided by Sun Spot make it easier to create and deploy
projects on the sensors.
2) ANT : To give a background of ANT, I would like to go back in the days of C++ where in
dependancies and other support files used to create a problem. Makefiles were
introduced for this reason. Each make file had a list of files which were to be compiled
along with the main program in order for it to work.
12 | P a g e

Sensor Networks 2011
Bringing this concept to Java, ANT provides the same functionality. All the dependancies
are coded into XML files and the ANT scripts run the JDK compiler and deploy the
various files
It is not a requirement for the project to be in Java. It has been tested successfully on
C/C++ projects as well. But Java remains to be the popular technology. Furthermore,
specifying of classpaths, environment variables etc can be done using the ANT Scripts
Important files
• Build.Properties – for user defined properties. Contains classpath and other
user variables
• Build.xml – main build file
• Project.xml – Contains netbeans project information
3) Solarium: This is a tool provided by the Sun Systems which helps in setting up sensors
and / or virtual SPOT sensors for communicating with the system. It is also used to
perform various activites like
1) Updating the sensor firmware
2) Find out information about a particular sensor like its version, battery life, serial no
etc
3) Find out links between networks
4) Administer a network at a physical level
4) Visual Studio 2010: This was used primarily to create the Front end part of the project.
The front end page was in ASP .NET which requires a .NET Backbone. Visual Studio is
the preferred tool used for this development. While many options are available, Visual
Studio 2010 is the latest version and is used
5) SQL Server 2008 Management Studio: The Database forms the backbone of the project.
The Database can be complicated to create and design. Luckily SQL Server 2008 provides
a lot of tools for development which can help in making this process simpler. These
include creating Diagrams, schema and designing table. SQL Server also has its own
front end for entering and manipulating the values in the database tables
6) Microsoft Project: Project Management is an important aspect of any project and in
order to do so, we need various tools which can help us in all the processes. These can
13 | P a g e

Sensor Networks 2011
include allotting resources, dividing tasks, using CPM Pert techniques or estimating
timelines. It is very important to track changes with respect to the tasks. Microsoft
Project provides us with all these functionalities and reporting capabilities to create
reports which can improve the productivity of any project.
7) SVN: Since this project is huge and has many contributors, it is important to have a
proper version control in place. The Google Code SVN seemed to be a perfect fit for
these needs. It involves installation of a small plugin in the IDE (Visual Studio or
Netbeans) and setting up an account on the Google code Project.
8) Rational Rose : This was used as a UML tool for documentation purposes. Creating
Sequence, statechart, Class and Use Case Diagrams.
Each of the technologies and its application will be discussed in detail in the later sections
of this document
14 | P a g e

Sensor Networks 2011
SPOT Sensor Application
Sun Spot Background
As discussed above, the Sun Spot sensors work on the Squawk Virtual Machine which supports
j2ME. Hence many applications running java can be run on this machine. Most of the internal
tools are available as an API for the programs and these programs can work with this API. Out
of all the tools available the important ones are
1) Temperature Transducers: These can fetch the temperature of the surrounding in
Celcius or Fahrenheit. This is implemented using a polymorphic reference to the
ITemperatureInput interface in the
com.sun.spot.resources.transducers.ITemperatureInput pakage. In order to get the
value of the temperature, we first need to create a solid instance of the
ITemperatureInput interface. We can use the Resources.lookup method to do the same
for us.
2) Light Sensors: Like the Temperature Sensors, the light sensors can be used to sense the
light incident on the sensor. They are a part of the ILightSensor interface and can be
used in the same way as the temperature sensors.
3) TriColorLED Display: Since there is no display on the sensors, the only way of signaling
and having an output for debugging is through the LEDs which are present on the
sensor.
4) Accelerometer Sensor: This will report the inclination of the sensor. This value can be
used to sense motion, wind, velocity etc.
5) IAT91 Timer : This is an internal timer which can be used by all the applications for
keeping time in their programs. While even the Date class is supported by the timer,
Date is synchronized by the base station. This on the other hand will work
independently
Communication
15 | P a g e

Sensor Networks 2011
Communication takes place between the base station and a spot sensor, or a sensor and
another sensor (adhoc). This happens due to the fact that each of the sensor works on a fixed
frequency and the base station is
programmed to accept this
frequency. This frequency is pre
established by the sender and the
receiver. SPOT allows various
channels for communication each
with a different frequency in order to
ensure that two different networks
do not interfere with each other. This
can be done using different Pan ID.
As seen from the figure, each spot
device is connected to the base
station which is connected to the
server which hosts the host app. The sensors relay their signals to the base machine and thus
work independently. Since each sensor has its own app running on its Virtual Machine, it
becomes difficult to keep track of which all sensors are active in the current network and
synchronize their work. Hence I had to write a module for establishing their connection. Each
Sensor can be identified by its IEEE address which is printed on each sensor device. This is a 48
bit dotted decimal address and resembles the Ethernet Mac address in functionality. Hence
every target sensor has a unique IEEE address.
Data and Messages are exchanged between the sensor and its host app in the form of Packets.
There are two types of connections which can be established.
• Radio / Datagram Connection
• Radiostream Connection
Datagram Connection:
This is a connectionless protocol in which data is sent asynchronously from one end and
received by the receiver. Hence there is no guarantee of packet loss or delay. In order to ensure
delivery, external mechanism has to be put in place. Hence this is used when time and packet
size is an important issue Datagram connection is the connection of choice.
DatagramConnection recvConn = (DatagramConnection)
Connector.open("radiogram://:100");
recvConn.receive(dg);
16 | P a g e

Sensor Networks 2011
String answer = dg.readUTF();
(Sun Microsystems)
As can be seen the communication can then proceed in the form of UDP communication like
any other socket program. There is a list of all different type of data that can be transferred in
the form of datagrams. There is support for all the primitive data types as well as string and
other data. There is support for Data Serialization, however since J2ME does not support
automatic serialization, the externalizable interface is the only possible way to do so.
A major advantage of Datagram connection is the fact that it allows broadcasts. Hence if the
application uses broadcast messages, this is the best way to go.
Radiostream Connection
This is a connection oriented protocol aimed at emulating the TCP connection in conventional
network communication. As with TCP, it involves a guaranteed delivery of packets and hence is
more reliable. This is a 3 step process which involves setting up and breaking down the
connection. Once the connection is established, data transfer can commence in a way similar to
streams in Java.
DataInputStream dis = conn.openDataInputStream();
DataOutputStream dos = conn.openDataOutputStream();
As shown above, streams are set up to transfer data. One of the disadvantages of this kind of a
connection is the fact that broadcasts are not possible, since they do not use 802.15.4 ACK.
In both the above communication protocols, it is necessary to use a port. This could be any
number between 0-31. However, the port must be agreed upon by the sender and the receiver
in order to achieve proper communication.
Broadcast Messages
As seen above, Broadcast Messages do not have 802.15.4 ACKs and hence cannot be supported
by the radiostream protocol. Hence the only way to achieve this service is through the
Datagram protocol. Broadcasts do not have a fixed size and can be any data with certain
restrictions. The maximum permissible size of a packet for broadcast is set to 1260 bytes of
payload. However, broadcast is not recommended beyond 200 bytes due to fragmentation
issues. As per the Sun Documentation, broadcast frames broken into 2 fragments are generally
reliable, however those broken into 3 or more fragments generally experience packet loss.
Being connectionless, it is generally not advisable to do so. If such a situation is unavoidable, a
20 ms pause between packets ensures keeping up the reception.
17 | P a g e
Sensor Networks 2011
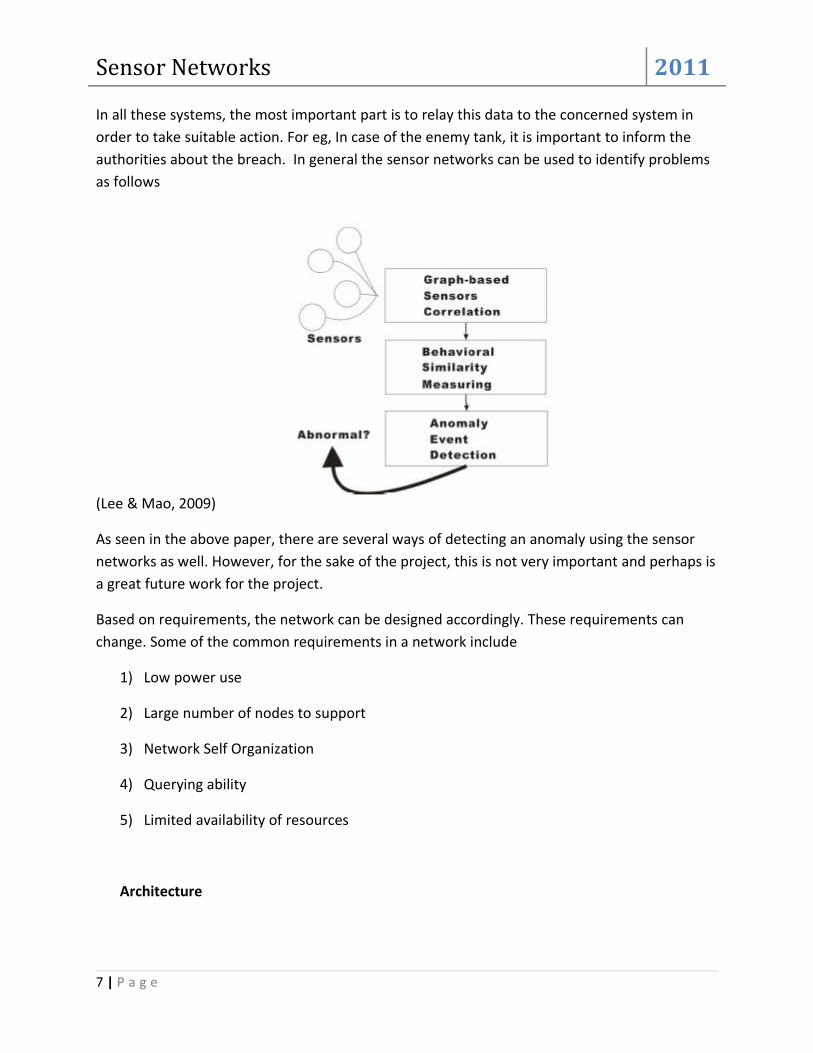
Structure of the Transmitter
As seen above, the application works on the transmitter. When the application is started, it may
or may not be in the range of the base station. However, it may go into the range once it is
started. Hence, the first state in which the app starts is to search indefinitely for the base
station. I have used the Telemetry Demo as a reference from the Sun Microsystems samples to
build this application. Certain classes are used while some others are based on ideas presented
in various samples.
State Chart: Transmitter setup
The above state diagram explains the states which the transmitter can be in briefly. One thing
worth noting is that the base station can go out of range and the transmitter will then
automatically go back to the searching for base state. This functionality has been added keeping
in mind that the transmission is not always reliable.
In order to achieve “Plug and Play” functionality in the sensors, I took a key out of the Sun Spot
Telemetry Demo Sample provided with the sensors.
Algorithm for Initiation of Communication
Register handlers
While(true){
18 | P a g e
Sensor Networks 2011
Wait for base station
If(Base Station found){
Send frame
Start Periodic task
}
Else
Continue;
}
These actions can be better explained with the sequence diagram as below.
19 | P a g e

Sensor Networks 2011
Sequence 1: For SPOT sensors
So in detail,
1) The base first broadcasts a Display Server Restart frame.
2) The spot first broadcasts a frame with the header (Locate Server Request).
3) The base responds to this request with a Locate Server Response Header
4) The base then establishes connection and sends the Get temperature frame which is a
command to start the periodic task
5) The periodic task sends back regular frames with the Get Temperature reply frame.
20 | P a g e

Sensor Networks 2011
The type of frames which can be sent are as follows.
Header Type ID
Locate Display Server Request 1
Display Server Restart 2
Display Server Quitting(NotifyDestroyed) 3
Blink Leds 10
Ping Request 9
Ping Response 110
Message Response 111
Get Temperature 114
Get Temperature for Network 116
Get Temperature Reply 115
Get Temperature Network Reply 117
Get Gui Info 118
Get Gui Info Reply 119
Set Period 120
All the packet headers are stored in the org.sunspotworld.demo.PacketTypes.java file and
implemented as an interface as constants and hence any class which wants to refer them can
implement this interface.
Listeners
In order to implement it as an observer observable model, I followed the technique used in the
sample program by having a listener for each command.
The process is 3 fold.
1) Each class which is capable of handling any type of command from the above table will
first register itself with the
2) Once registered, the adapter will add the object reference to a list.
3) The handle method as per the interface will be called for every object in the list for that
particular event.
Periodic Task
21 | P a g e

Sensor Networks 2011
The periodic task abstract class Is used to implement any process which can act as a daemon on
the spot sensor (Sun Microsystems). This is a class which has been provided by Sun
Microsystems in their sample code. Every implementation of the task implements a multiton
pattern in a way. This is made to ensure that not more than 3 timers are used. Every
implementation of the multiton will have a few methods.
Components
• Timer: This is a set of 3 universal timers whose tick will determine the period for
repetition of the task
• Task: The activity to be performed on each task
• TaskPeriod: the time interval in between two ticks
• ServiceName: A more descriptive name to the process
• Priority: priority in a realtime environment
Temperature Class:
This is a concrete implementation of the periodic task which sends back the temperature and
light readings to the base station.
22 | P a g e

Sensor Networks 2011
Host Application
The host app is the Desktop version of the module. The main aim of this app is to enter the
readings recorded by the spot sensor into the database. This app has been written in Java as
well to match the SPOT device application. In order to maintain autonomy, this app has the
ability to support multiple sensors and does not require any particular device to be
preconfigured as long as the sensor and the receiver agree on the protocol. As with the
transmitter, the Telemetry Demo sample has been used as a reference in many places to create
this application.
Spot Listener
This is the main thread of the application. It is a continuously running process. Every new
thread forks off from this thread. The algorithm is as follows.
While(true){
If (Incoming spot request)
Fork()
If(new spot device)
Register in the database
Initiate handshake protocol
Start collecting data
Display panel with data
}
Handshake
1) This is the first communication which happens using the Radiogram
protocol(Asynchronous).
23 | P a g e

Sensor Networks 2011
2) If a SPOT sensor comes in the range, it sends a request by first sending a Locate Server
request.
3) The host app then compares the type of the arriving packet with the packet types
headers.
4) If it is indeed a locate server request, it replies back with a Display Server Available
response
5) It then starts the listener with its own address
24 | P a g e

Sensor Networks 2011
As seen above, all new spots are plug and play. Like the spot device, even the host app has an
observer-observable pattern. Hence it has its own listener. It shares the packet headers from
the spot app. It can issue a few commands to the spot app which includes
Set Period Set the period for the sampling
Get Temperature Get the temperature reading(Force a sample)
Send Data Send a packet
Ping Similar to a TCP Ping request
Blink Blink all LEDS 10 times
Once a new spot has been connected to, the SPOT starts recording its readings, in the database.
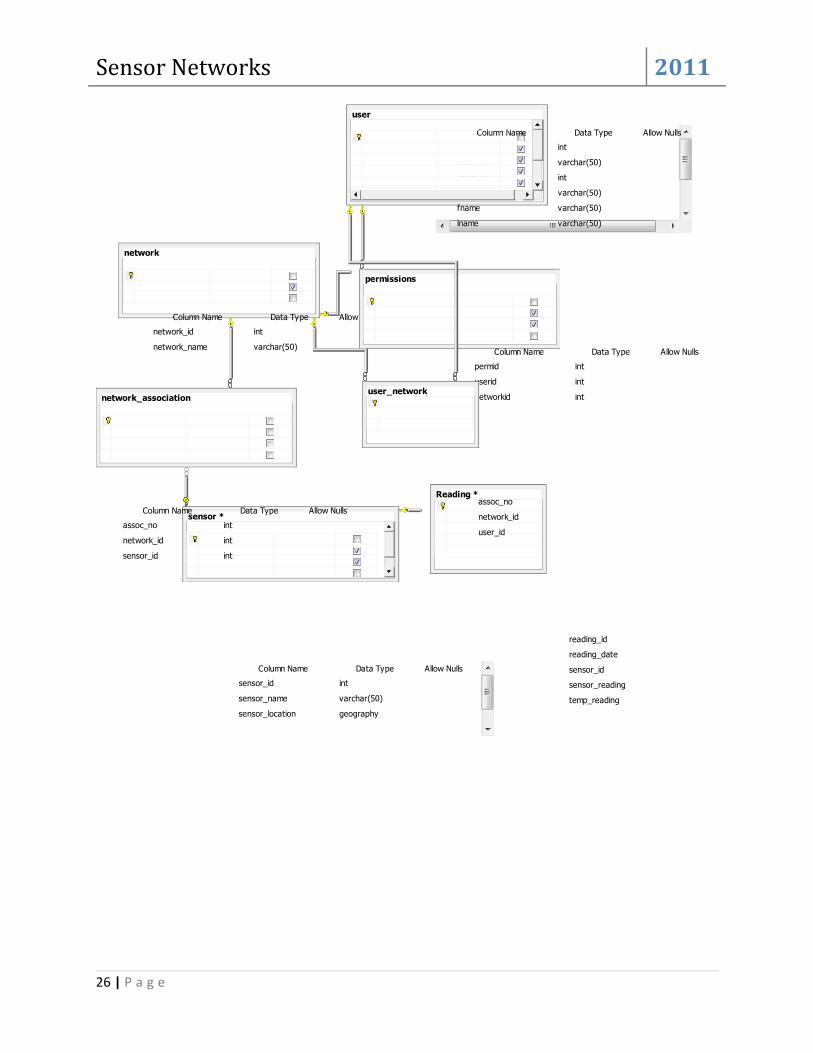
The Database Design is as follows:
25 | P a g e
Sensor Networks 2011
sensor *
sensor_id int
sensor_name varchar(50)
sensor_location geography
Column Name Data Type Allow Nulls
network
network_id int
network_name varchar(50)
Column Name Data Type Allow Nulls
network_association
assoc_no int
network_id int
sensor_id int
Column Name Data Type Allow Nulls
user
userid int
username varchar(50)
usertype int
password varchar(50)
fname varchar(50)
lname varchar(50)
Column Name Data Type Allow Nulls
permissions
permid int
userid int
networkid int
Column Name Data Type Allow Nulls
Reading *
reading_id
reading_date
sensor_id
sensor_reading
temp_reading
user_network
assoc_no
network_id
user_id
26 | P a g e

Sensor Networks 2011
Database Description :
The Sensor Table:
This is the table which holds all information about sensors , mainly the location, IEEE address
and the name assigned to it. The IEEE address and the id is assigned by the system. However,
for it to be fully functional, the location must be updated manually by the user in the web
interface.
Reading:
This is where readings are logged in. This is a 3 dimensional table in the sense, it is temporally
sensitive
User:
This is the table for storing information about the user. This may include his personal details
and information related to the system. As per the business rules, one user may be concerned
with a number of networks which in turn may have a number of sensors in it. The hierarchy is
maintained in the database.
Network:
This is a group of sensors which are combined together as a network. This may not be
tantamount to the fact that all sensors share the same base station. In fact the current business
rules permit the association of multiple sensors from different networks to the same network
by providing an abstraction layer. It also means that sensor may be a part of multiple networks.
27 | P a g e

Sensor Networks 2011
Web Interface
The web interface is an ASP .NET interface which sits on top of the existing database. This
provides a flexible interface for the users to access and modify the parameters related to the
sensors, and also to obtain various visualizations on the data. This is another way of interacting
with the sensors remotely. The web interface provides the flexibility achieved by the
application with the added advantage of being accessible remotely.
The web interface could be divided into various pages as follows:
1) Register.aspx
This page is used to initially register a user in the system. Each network is a function of a
user and hence the user is the top level class in this case
2) Login.aspx
The name is self explanatory. Once registered, the user can login securely into the
network. Behind the scenes, this is the page which will eventually set the sessions for a
successful login
3) AddSensor.aspx
As mentioned before, in order to make a sensor available on the map, it is essential to
register a sensor. This can be achieved using this page. This page provides the map
where the user can register the sensor at a particular location.
4) Visualization.aspx
This is the page where the user can get charts on the statistics of the network.
5) Map.aspx
This is the page where the user sensors are shown on a GIS map.
User:
As seen from the database, each user may be interested in a series of networks. These
networks in turn could have a collection of sensors. Hence the sensors have an indirect
association with the user.
Structure:
28 | P a g e

Sensor Networks 2011
The use case diagram below will describe the functions better
Use Case as in Proposal 1
The use case diagram points out the hierarchy present in the users. This is also visible in the
class diagram as presented in the later part of the document.
The structure of the C# application can be better explained by the class diagram as shown
below.
29 | P a g e

Sensor Networks 2011
30 | P a g e
Sensor Networks 2011
GIS and Maps
Background and Need in the Project:
As seen in the proposal, one key aspect of the project is visualization. Visualization helps us in
making better decisions with respect to the data. Along with Data Mining, presenting this data
in a more user friendly way and reducing the need for imagination is one of the key elements of
the project. This involves representing the Data in a more efficient manner. This is where the
GIS module comes into the picture. The GIS module is a very standardized way of projecting the
sensor locations on a global map in order to paint a clearer picture in front of the user. Doing so
will help monitor the various networks and immediately identify problems or solutions if any
from the map. The map also helps in extending the project by making the various geographic
parameters in a system. One example of this extension would be to extrapolate weather
conditions in regions where sensors are not present by means of their proximity to actual
sensor locations. While this is not a part of this project, it is a possible future development for
the project and not a huge leap from its current status.
Think GEO Application Programming Interface:
Instead of Re-Inventing the wheel, I decided to make use of existing libraries to implement this
module and concentrate on the Spatial Data Storage, and implementation of this. For this
purpose, as proposed earlier, I made use of the Think Geo Web Edition with Ajax. (Think Geo
Software, 2011). A look at the samples provided gave me a good idea for its implementation in
my project.
The API provides a map overlay. It has the ability to add a custom overlay such as Google Maps
API or Bing Maps or use their own overlay.
31 | P a g e

Sensor Networks 2011
(Think Geo Software, 2011)
As seen above the overlay can be added to the MAP implementation in order to have a custom
implementation. From the project point of view, the user can have a familiar Google Maps
Interface for the application while maintaining the data which is provided by our application.
For the purpose of the project however, I have preferred to use the regular overlay for the sake
of simplicity.
(Think Geo Software, 2011)
32 | P a g e

Sensor Networks 2011
Basics of GIS Programming
The main idea behind GIS is that data and visualization are stored separately. Hence, we store
information along with metadata in the database and this data is rendered at runtime based on
the other parameters. One of the most common way of storing spatial data is in the form of
SQL Geography objects. (Microsoft Corporation, 2008)
This data type provides the capability to store semantically information related to all geography
objects on the map in the form of
• Point
• LineString
• Polygon
And many more
For the sake of the project, we are only concerned with the Point Datatype. All these structures
are based on the OGC Specifications. (Ryden, 2005)
Point:
As with Geometry, a point is a dimensionless entity which can denote a single quantized place
on the map. A point is made up of a variety of parameters, but the most common way of
representing a point on a global map is with the help of its Longitude and Lattitude.
Since both Raster as well as Vector Formats are supported, I preferred going for the Raster
implementation given the fact that the Point is the most commonly used entity in the project.
Shapes:
While this is not a part of the project, I thought of sharing information about this for future
purposes. In order to have a shape shown on the map, it is possible to define these spatial
shapes as a part of an .SHP file which can then be accessed by the map.
SRID: Each map is identified by its SRID. In this case, I have used 4326 as the SRID. This is just a
number randomly generated which is unique.
33 | P a g e

Sensor Networks 2011
Geography: The begin geography and end geography are commands which limit the start and
end of the geography declarations
34 | P a g e
Sensor Networks 2011
Running the Application
Starting the base station
The first thing to do in this case is to start the base station. This is done by first building the host
application and then in the directory with the build.xml
• Ant host-compile
• Ant host-run
The device will then automatically choose the mode to run(Shared base or Isolated). If all goes
well, the program then enters a loop where in it will keep listening for SPOT sensors to connect.
It is worth noting that if there is already a sensor in range, it will connect at this instance
Compiling Sensor App
This app will be deployed using ant scripts as well. In order to compile the application we use
• Ant compile
• Ant deploy
If there is a specific sensor that we need to deploy this application to, we can use it as one of
our environment variable. So that is done as
ant -DremoteId=0014.4F01.0000.0F2A deploy (Sun Microsystems, 2008).
Once the application is properly deployed on the sensor, we are free to start connecting it to
the main program. This is done by restarting the sensor.
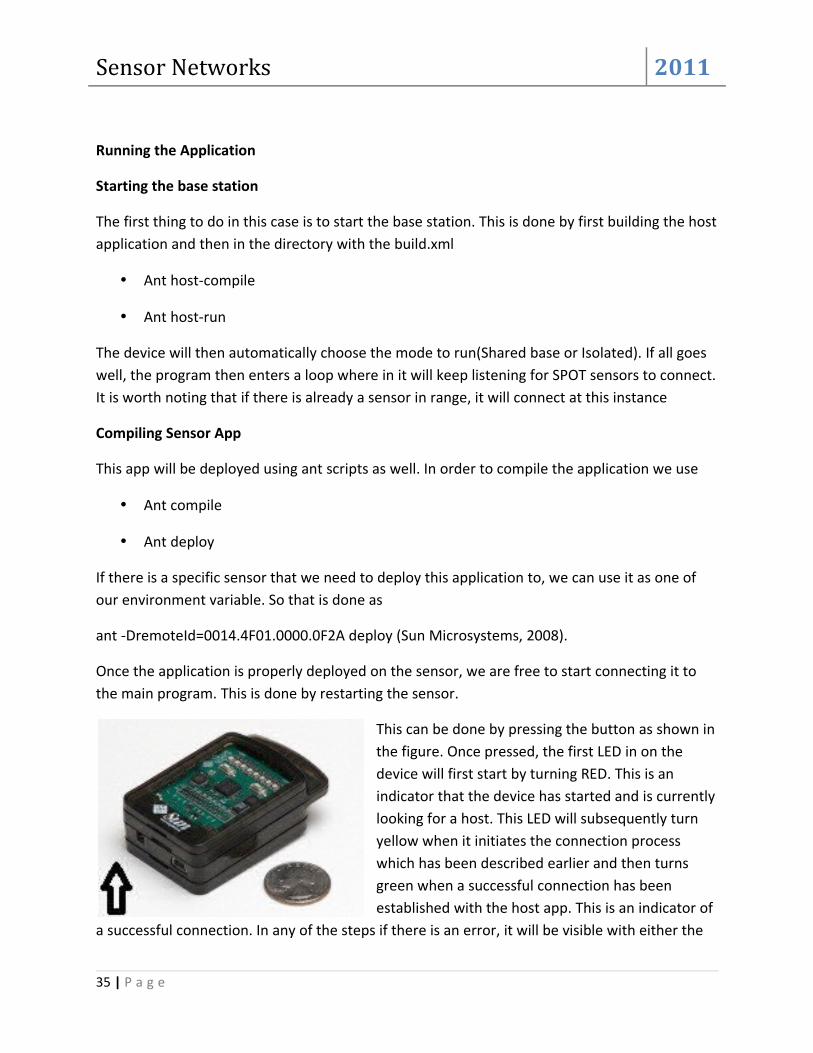
This can be done by pressing the button as shown in
the figure. Once pressed, the first LED in on the
device will first start by turning RED. This is an
indicator that the device has started and is currently
looking for a host. This LED will subsequently turn
yellow when it initiates the connection process
which has been described earlier and then turns
green when a successful connection has been
established with the host app. This is an indicator of
a successful connection. In any of the steps if there is an error, it will be visible with either the
35 | P a g e

Sensor Networks 2011
LED not turning green or there being an error on the Host application side. Once connected, the
application will now start sampling the temperature and reporting it to the host app which in
turn will start recording these readings in the database.
If this is the first time this sensor has been used with the Host app, we need to specify the
location. All the other registration fields are filled in automatically by the application.
Web Interface
The web interface can be run by setting up an IIS Server and running the SensorNetworksUI
project in it. The default.aspx page will decide the best start point for the program. In most
cases the start.aspx will be the first page.
If a user is not registered, he has to register using the registration form provided in the
register.aspx page. After filling in the data, the user can then access the various controls in the
program which include adding and deleting sensor locations amongst others. It is worth noting
that the web interface will also need the database running and the connection string provided
to the correct SQL Server. It will also need all user privileges.
Operations:
Having talked about the service platform layer, we now come to the topmost layer in the stack.
This is the service layer. The service layer defines the various operations which can be
performed over the network and the sensors. We have already studied a few operations in
detail before. But I would like to add a few operations in this section as well.
They can be broadly divided as follows
User Setup Operations:
These include registering, setting up and logging in of the user. The authentication as of now is
not encrypted, but this can be thought of as a future addition to the project when it is
implemented in the real world. The validation and summary is implemented using the controls
provided by Microsoft .NET .
For the reason of flexibility, I chose to not use the login user wizard control
36 | P a g e

Sensor Networks 2011
Temporal Operations:
These include the operations which are performed over sensors in a temporal sense, which
include the data in the previous timestep and the current. These operations are used on
individual sensors and provide us with details of the same. The operations are statistical and are
useful in extrapolating data, or guessing the status of the sensors.
I have implemented 2 such operations.
Chart: This is used to plot the graphs of various trends in the sensor data such as light and
temperature. These are plots which include line, box and other common graphs implemented
using the Microsoft controls.
Outlier Analysis: This is another way of testing the sensors. In most of the cases, outliers are
not just a nuisance but unacceptable. It is sometimes difficult to analyze outliers since they may
indicate trends and are very specific to the sensor and its current trend. The system provides a
basic mechanism for analyzing outliers.
According to Central Limit Theorem, the mean of a sample will always be distributed normally.
(Charles Grinstead)
Here, we define the sample as a section of the temporal readings which we find to be out of
sync with the rest of the data. The hypothesis testing is performed over this sample over the
population (the entire set of readings) to test for the mean and standard deviation. In case of a
pass, we add this sensor to the non outliers section of the list. Otherwise, we add it to the list of
outliers.
While this is a basic way of doing so, it is indeed a powerful way of analyzing outliers.
Group Operations:
These operations are those which are performed over a set of sensors together (generally over
a network) to find basic parameters of these networks. These include
37 | P a g e

Sensor Networks 2011
Parameterless operations: such as Mean, Median, Mode, Min, Max, Standard Deviation and
other parameters of the networks which will indicate the statistical parameters which can be
used for other complex statistical calculations
One Parameter Operations: These are operations which include operations performed on
certain values such as Rank, finding out the quartile, percentile, decile etc of the sample data.
These operations can help other complicated operations on the data. The Rank operation will
find the rank of our parameter if it were a part of the sample data.
Probability Based Operations: These are operations which make use of probability to predict
certain parameters. For eg, if we have to find the probability of a particular reading to be a part
of a particular system based on probability, we can use some of the distributions to do so. The
currently supported distributions include the Normal Distribution and the Uniform Distribution
which will predict the probability of a value in the distribution.
Special Installation Instructions:
Netbeans:
The project can be opened directly in Netbeans. Make sure you open it as a project. The ant
build scripts will import all the jar files. It is also required to have the Microsoft JDBC Drivers
installed. The user.classpath value should be set in the /hostapp/build.properties file to include
the path to the sqljdbc.jar file
Visual Studio
The program uses 3 different libraries which need to be installed prior to use.
1) Think Geo Web Edition (Ajax supported): http://thinkgeo.com/
2) NMath Statistics Suite : http://www.centerspace.net/
3) NMath Math Suite: http://www.centerspace.net/
These three libraries and its dlls should be included with the Visual Studio .sln file in order to
run the application.
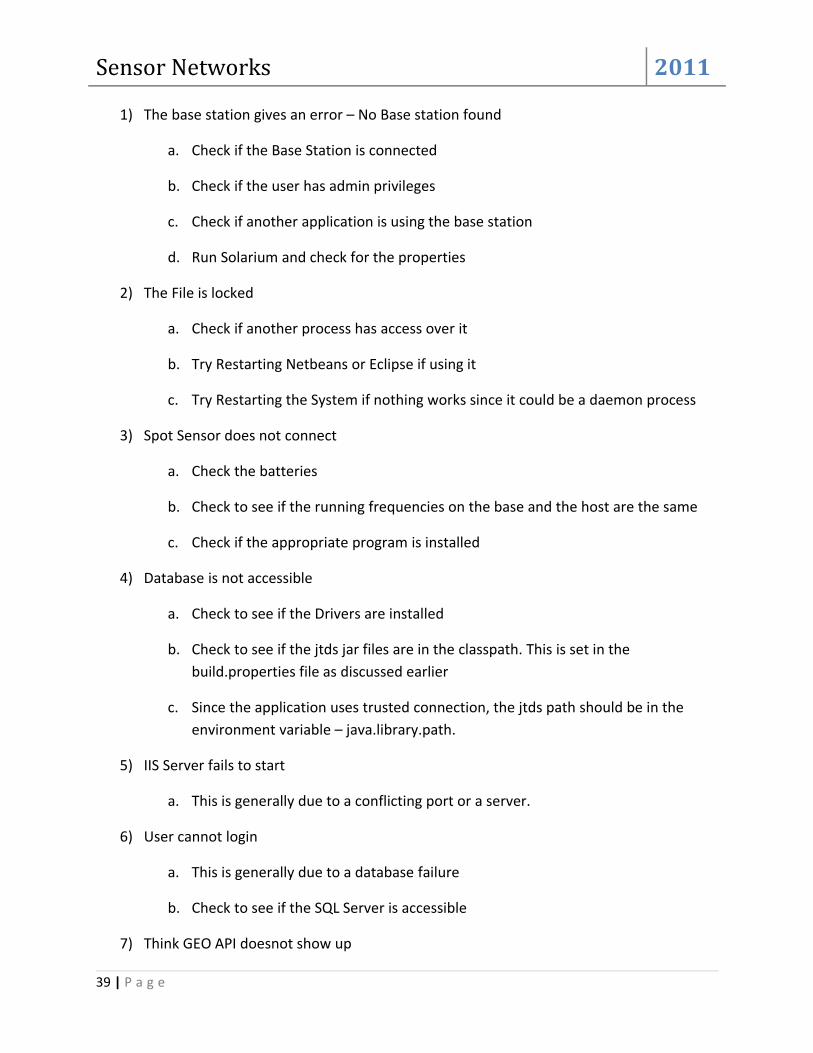
Troubleshooting
38 | P a g e
Sensor Networks 2011
1) The base station gives an error – No Base station found
a. Check if the Base Station is connected
b. Check if the user has admin privileges
c. Check if another application is using the base station
d. Run Solarium and check for the properties
2) The File is locked
a. Check if another process has access over it
b. Try Restarting Netbeans or Eclipse if using it
c. Try Restarting the System if nothing works since it could be a daemon process
3) Spot Sensor does not connect
a. Check the batteries
b. Check to see if the running frequencies on the base and the host are the same
c. Check if the appropriate program is installed
4) Database is not accessible
a. Check to see if the Drivers are installed
b. Check to see if the jtds jar files are in the classpath. This is set in the
build.properties file as discussed earlier
c. Since the application uses trusted connection, the jtds path should be in the
environment variable – java.library.path.
5) IIS Server fails to start
a. This is generally due to a conflicting port or a server.
6) User cannot login
a. This is generally due to a database failure
b. Check to see if the SQL Server is accessible
7) Think GEO API doesnot show up
39 | P a g e

Sensor Networks 2011
a. Check to see if the trial period is still active
b. Check to see if the right browser is installed
8) Google Maps Overlay is giving errors
a. Google Maps sometimes change their Javascript Library address.
b. Updating to the right location should fix this error
40 | P a g e

Sensor Networks 2011
Testing and Analysis
As with any problem, the outcome is the most important aspect. Since the problem is
complicated, various situations can lead to several different outcomes. It is the duty of the
programmer to analyze all these outcomes. Depending on the circumstances, the system
can either give a satisfactory result or handle exceptions gracefully. There are cases when
we expect exceptions and in such cases they should be projected to the user gracefully.
Sr
No
Test Case Remarks
1 Sensor is started but Base Station is not Broadcasting Waits for the base station by
showing the orange indicator
periodically changing to red
indicating that it keeps
searching for a base station
periodically
2 Base Station is started but no sensor is in range The base station waits
listening for spots
3 SPOT Sensor is now in range The base station recognizes
the spot and starts its
function by popping out a
new window
4 A new SPOT Sensor is added to the network without
any configuration changes
This is efficiently recognized
by the system and a new
admin window is opened by
the system
5 One of the sensor stops broadcasting The Base Station tries
broadcasting frames till the
sensor comes back in the
network. This is one place
where the application could
improve in the future
6 The base station stops responding The sensors lose their
connection. If the base station
has responded by having the
notify destroyed, the base
station start searching for a
new station
7 The database is not functioning A Database Connection error
41 | P a g e

Sensor Networks 2011
is thrown, since the sensor is
not in a level where it can
make a decision in such a
situation
8 No user is present in the database The network still keeps
broadcasting and recording
readings since the user may
be added to a particular
network at a later stage
9 Sensor is restarted The Network will make the
readings based on
timestamps. In such cases the
spacing might change
affecting parameters such as
Standard Deviation but other
parameters such as mean and
variance are still kept intact
10 A user is added with no networks in his account The user is given access to no
networks which is equivalent
to not being present and as
expected he is given access
only once networks are
assigned to him
11 A user is given access to networks These networks and their
functions show up on his web
interface
12 User is trying to view the map for whom he has no
access
Since the Map is password
protected at loading time, it is
impossible for such a situation
to arise
13 A Sensor is present but not shown on the map This is typically when the GIS
location is not updated in the
database. This is a drawback
of the sensors due to their
lack of Geo Sensing Capacity
14 Sensor Network hangs due to unknown reasons In this case the sensor cannot
send out packets with a
recognized header. Hence
their value is not counted in
the calculations. This is still a
problem but mitigated to its
lowest extent
15 Exception is thrown at the web interface The exception is very abstract
42 | P a g e
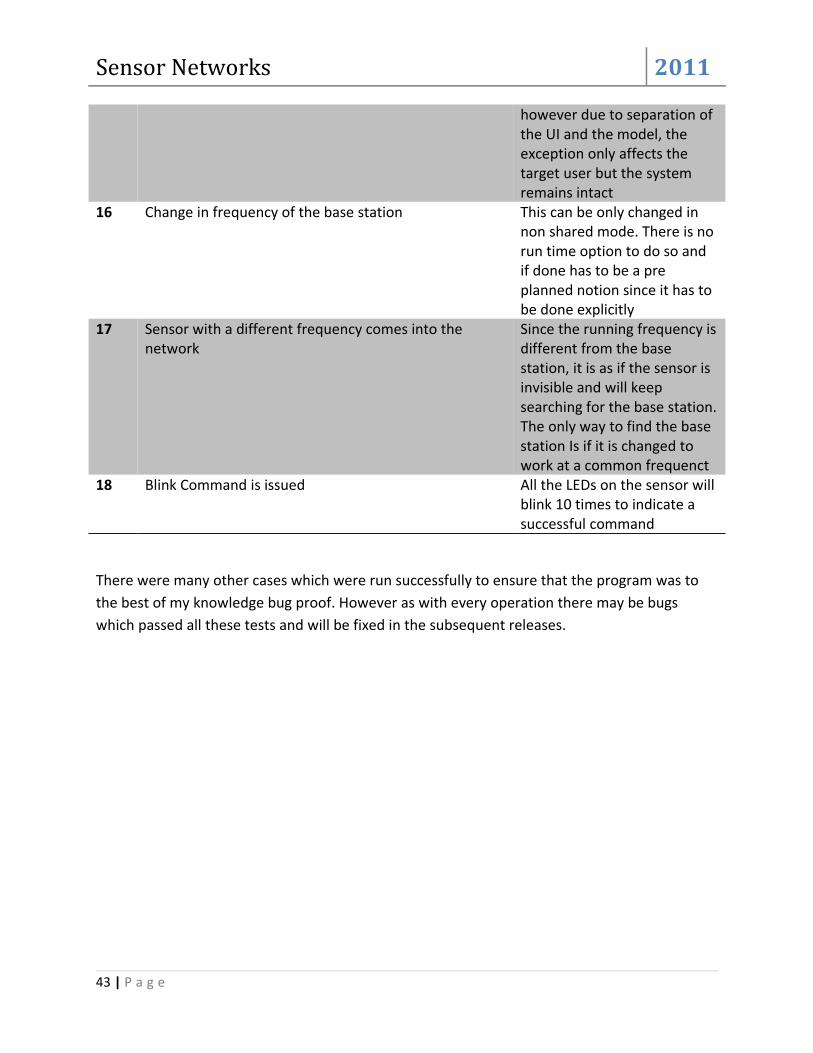
Sensor Networks 2011
however due to separation of
the UI and the model, the
exception only affects the
target user but the system
remains intact
16 Change in frequency of the base station This can be only changed in
non shared mode. There is no
run time option to do so and
if done has to be a pre
planned notion since it has to
be done explicitly
17 Sensor with a different frequency comes into the
network
Since the running frequency is
different from the base
station, it is as if the sensor is
invisible and will keep
searching for the base station.
The only way to find the base
station Is if it is changed to
work at a common frequenct
18 Blink Command is issued All the LEDs on the sensor will
blink 10 times to indicate a
successful command
There were many other cases which were run successfully to ensure that the program was to
the best of my knowledge bug proof. However as with every operation there may be bugs
which passed all these tests and will be fixed in the subsequent releases.
43 | P a g e

Sensor Networks 2011
Result
The application was run on May 3rd 2011 from 2-30 pm to 4- 30 pm for testing and analysis. The
test cases were as above. However, I feel that the basic description of its working is also worth
mentioning.
1) The application was able to start off successfully on the system on the execution of the
ant host-run command in the ./HostApp folder. The host application then went into
individual or shared mode as per the availability of resources. In either mode, it kept
listening for new spot devices to connect on port 43 which was the specified port for the
application.
2) The SPOT app was first deployed using the ant deploy command. The SPOT was then
restarted using the button and then its behavior was observed. The application ran
within 5 mins of the restart. As expected the application began to search for an available
base station upon restarting and once found it initiated the handshake protocol which
was described in the previous text. At the successful completion of the handshake
protocol, I was able to see the successful LED pattern
3) The most important phase was when the connection took place since this was the place
where there was a high chance for an error. However, the connection was established
gracefully. The host app made entries in the database for a newly discovered spot
device or just reconfigured itself for the older ones.
4) The readings were taken once the connection was established. As programmed, both
the light as well as the temperature readings were taken by the application and stored
in the Reading table in the database. These readings mentioned the timestamp at the
time of recording (Not entering) hence making the system more accurate.
5) The Web Site was the final piece of the puzzle but in no means the smallest since it
constitute to almost 70 % of the entire application. The web site pulled out details from
the database and displayed various tools for the end user to perform his operations on.
The website ran on port 58213 of the localhost for testing purposes.
6) The Statistic engine was up and running and able to perform various computations and
calculations
44 | P a g e

Sensor Networks 2011
7) The GIS Maps were able to show the overlay and the various locations perfectly on the
global map which was the icing on the cake. The Bing Maps however had bugs with
them and hence I decided to let go off the idea.
45 | P a g e
Sensor Networks 2011
Future Work
This project lays a foundation for many new projects. While this is a very general and open
field, there are many topics and projects which I felt would be great additions to my current
project but for the sake of staying focused, I could not include in the current project. I have
mentioned a few which come to my mind along with a very brief description of the same.
1) Distributed Sensor Network:
• The whole time, we operated on the principle that each sensor should be
connected to a base station remotely and then the level of abstraction issued by
this made it possible to have multiple networks. However, it sometimes is a good
idea to have a network which is inherently decentralized as discussed. (Ketel,
Dogan, & Homaifar, 2005). The advantages of using a distributed system need
not be reemphasized, but the reliability gained by such an approach is worth a
mention
2) Extrapolation using GIS
• The main advantage of GIS is that the geographic semantics can be mapped to
the system. Distance between two points is an important feature which can be
efficiently obtained from the GIS System. This distance can be used effectively to
calculate the temperature of any point on the map. This can be done by having a
weighted sum of the actual values to estimate the temperature at a point.
3) Cell Phone Interface
• As the title says, instead of extending the concept to websites, it will be even
more handy if a cell phone app(Android or Iphone or other smartphone) were to
be created in order to access the system.
4) Automatic GPS Sensing
• This is more of an issue with the sensors. Their inability to sense their location
makes us add an extra step of configuring sensors. However these sensors have
to be stationary as a result. If the sensors are able to sense their location in the
future, it may be possible to incorporate such a thing in the future technologies
to come. (Yu, Choi, Park, Lee, Jin, & Kim, 2008)
46 | P a g e

Sensor Networks 2011
5) Use of Neural Networks to predict results
• The part of data collection has already been successfully executed. Now more
effective and accurate techniques for data prediction can be used to effectively
predict the outcome of various questions. Neural networks is one such approach.
(Guan & Li, 2007)
(Microsoft Corporation, 2008)
Bibliography
Baeg, S.-H., Park, J.-H., Koh, J., Park, K.-W., & Baeg, M.-H. (2007). Building a smart home
environment for service robots based on RFID and sensor networks. ICCAS '07. International
Conference , (pp. 1078-1082).
Guan, P., & Li, X. (2007). Minimizing Distribution Cost of Distributed Neural Networks in
Wireless Sensor Networks. Global Telecommunications Conference (pp. 790-794). IEEE .
Ketel, M., Dogan, N., & Homaifar, A. (2005). Distributed sensor networks based on mobile
agents paradigm. Thirty-Seventh Southeastern Symposium, (pp. 411- 414).
Krco, S., Matusikova, K., & Johansson, M. (2007). Mobile Network Supported Wireless Sensor
Network Services. IEE International Conference, (pp. 1-3).
Lan, S., Qilong, M., & Du, J. (2008). Architecture of Wireless Sensor Networks for Environmental
Monitoring. International Workshop on GeoScience and Remote Sensing (pp. 579-582). ETT and
GRS 2008.
Lee, H.-M., & Mao, C.-H. (2009). Finding abnormal events in home sensor network environment
using correlation graph,. SMC 2009. IEEE International Conference, (pp. 1852-1856).
Microsoft Corporation. (2010). C# Language Specification. Seattle Wa: Microsoft Publication.
Microsoft Corporation. (2008). Getting Started with Geography Data Types. Retrieved April 26,
2011, from MSDN : http://msdn.microsoft.com/en-us/library/bb895266.aspx
Ryden, K. (2005). Open GIS Specification for Geographic Information . Open GeoSpatial
Consortium Inc , 4-35.
Sun Microsystems. Sun Spot Programmers Manual.
Sun Microsystems. (2008, May 06). Sun Spot World Forums. Retrieved April 27, 2011, from Sun
Spot World: https://www.sunspotworld.com/forums/viewtopic.php?f=23&t=1308
47 | P a g e

Sensor Networks 2011
The National Institute of Standards and Technology. (n.d.). Wireless Adhoc Networks : Smart
sensor networks. Retrieved April 18, 2011, from http://www.antd.nist.gov/wahn_ssn.shtml
Think Geo Software. (2011). Think Geo MapSuite Web Samples. Retrieved April 26, 2011, from
Think Geo MapSuite: http://websamples.thinkgeo.com/
Wikipedia Sun Spot. (n.d.). Retrieved 04 14, 2011, from Wikipedia:
http://en.wikipedia.org/wiki/Sun_SPOT
Yu, F., Choi, Y., Park, S., Lee, E., Jin, M.-S., & Kim, S.-H. (2008). Sink Location Service for
Geographic Routing in Wireless Sensor Networks. Wireless Communications and Networking
Conference, (pp. 2111-2116).
48 | P a g e