remote sensing - hansung
TRANSCRIPT

Remote Sensing
Ch. 3 Microwaves (Part 2 of 2) 3.5 Target Interaction and Image Appearance 3.6 Radar Image Properties 3.7 Advanced Radar Applications 3.9 Airborne versus Spaceborne Radars 3.10 Airborne and Spaceborne Radar Systems

3.5 Target Interaction and Image Appearance
• The brightness of features in a radar image is dependent on the portion of the transmitted energy that is returned back to the radar from targets on the surface.
• The magnitude or intensity of this backscattered energy is dependent on how the radar energy interacts with the surface, which is a function of several variables or parameters.
• These parameters include - The characteristics of the radar system (frequency, polarization, viewing geometry, etc.) as well as - the characteristics of the surface (landcover type, topography, relief, etc.).
• Because many of these characteristics are interrelated, the brightness of features in an image is usually a combination of several of these variables. • Three areas which fundamentally control radar energy/target interactions.
Surface roughness of the target Radar viewing and surface geometry relationship Moisture content and electrical properties of the target

3.5 Target Interaction and Image Appearance
1) Surface roughness of the target • The surface roughness of a feature controls how the microwave energy interacts with that surface or target and is generally the dominant factor in determining the tones seen on a radar image.
• Surface roughness refers to the average height variations in the surface cover from a plane surface, and is measured on the order of cm. Whether a surface appears rough or smooth to a radar depends on the wavelength and incidence angle.
• Simply put, a surface is considered
- "smooth" if the height variations are much smaller than the radar wavelengt - "rough“ if the height variations begin to approach the size of the wavelength
Thus, a given surface will appear rougher as the wavelength becomes shorter and smoother as the wavelength becomes longer.

3.5 Target Interaction and Image Appearance
• A smooth surface (A) causes specular (mirrorlike) reflection of the incident energy (generally away from the sensor) and thus only a small amount of energy is returned to the radar. This results in smooth surfaces appearing as darker toned areas on an image.
• A rough surface (B) will scatter the energy approximately equally in all directions (i.e. diffusely) and a significant portion of the energy will be backscattered to the radar. Thus, rough surfaces will appear lighter in tone on an image.
• Incidence angle, in combination with wavelength, also plays a role in the apparent roughness of a surface. For a given surface and wavelength, the surface will appear smoother as the incidence angle increases. Thus, as we move farther across the swath, from near to far range, less energy would be returned to the sensor and the image would become increasingly darker in tone.

3.5 Target Interaction and Image Appearance
2) Radar viewing and surface geometry
• The local incidence angle is the angle between the radar beam and a line perpendicular to the slope at the point of incidence (A). Thus, local incidence angle takes into account the local slope of the terrain in relation to the radar beam.
• With flat terrain, the local incidence angle is the same as the look angle (B) of the radar. For terrain with any type of relief, this is not the case. Generally, slopes facing towards the radar will have small local incidence angles, causing relatively strong backscattering to the sensor, which results in a bright-toned appearance in an image.
• As the concept of local incidence angle demonstrates, the relationship between viewing geometry and the geometry of the surface features plays an important role in how the radar energy interacts with targets and their corresponding brightness on an image. Variations in viewing geometry will accentuate and enhance topography and relief in different ways, such that varying degrees of foreshortening, layover, and shadow may occur depending on surface slope, orientation, and shape.

3.5 Target Interaction and Image Appearance
• The look direction (or aspect angle) of the radar describes the orientation of the transmitted radar beam relative to the direction or alignment of linear features on the surface.
• The look direction can significantly influence the appearance of features on a radar image, particularly when ground features are organized in a linear structure (such as agricultural crops or mountain ranges).
• If the look direction is close to perpendicular to the orientation of the feature (A), then a large portion of the incident energy will be reflected back to the sensor and the feature will appear as a brighter tone. • If the look direction is more oblique in relation to the feature orientation (B), then less energy will be returned to the radar and the feature will appear darker in tone. • Look direction is important for enhancing the contrast between features in an image. It is particularly important to have the proper look direction in mountainous regions in order to minimize effects such as layover and shadowing. By acquiring imagery from different look directions, it may be possible to enhance identification of features with different orientations relative to the radar.

3.5 Target Interaction and Image Appearance
• Features which have two (or more) surfaces (usually smooth) at right angles to one another, may cause corner reflection to occur if the 'corner' faces the general direction of the radar antenna.
• The orientation of the surfaces at right angles causes most of the radar energy to be reflected directly back to the antenna due to the double bounce (or more) reflection.
• Corner reflectors with complex angular shapes are common in urban environments (e.g. buildings and streets, bridges, other man-made structures). Naturally occurring corner reflectors may include severely folded rock and cliff faces or upright vegetation standing in water. In all cases, corner reflectors show up as very bright targets in an image, such as the buildings and other man-made structures in this radar image of a city.

3.5 Target Interaction and Image Appearance
3) Moisture content & electrical properties of the target
• The presence (or absence) of moisture affects the electrical properties of an object or medium. Changes in the electrical properties influence the absorption, transmission, and reflection of microwave energy. Thus, the moisture content will influence how targets and surfaces reflect energy from a radar and how they will appear on an image.
• Generally, reflectivity (and image brightness) increases with increased moisture content. For example, surfaces such as soil and vegetation cover will appear brighter when they are wet than when they are dry.
• When a target is moist or wet, scattering from the topmost portion (surface scattering) is the dominant process taking place. The type of reflection (ranging from specular to diffuse) and the magnitude will depend on how rough the material appears to the radar.

3.5 Target Interaction and Image Appearance
• If the target is very dry and the surface appears smooth to the radar, the radar energy may be able to penetrate below the surface. For a given surface, longer wavelengths are able to penetrate further than shorter wavelengths.
• If the radar energy does manage to penetrate through the topmost surface, then volume scattering may occur. Volume scattering is the scattering of radar energy within a volume or medium, and usually consists of multiple bounces and reflections from different components within the volume.
• For example, in a forest, scattering may come from the leaf canopy at the tops of the trees, the leaves and branches further below, and the tree trunks and soil at the ground level.
• Volume scattering may serve to decrease or increase image brightness, depending on how much of the energy is scattered out of the volume and back to the radar.

3.5 Target Interaction and Image Appearance
Did You Know? ... that an L-band radar (23.5 cm wavelength) imaging from the orbiting space shuttle was able to discover ancient river channels beneath the Sahara Desert in Northern Africa. Because of the long wavelength and the extreme dryness of the sand, the radar was able to penetrate several meters below the desert surface to reveal the old river beds during ancient times when this area was not so dry.

3.5 Target Interaction and Image Appearance
Quiz If an agricultural area, with crops such as wheat and corn, became flooded, what do you think these areas might look like on a radar image? Explain the reasons for your answers based on your knowledge of how radar energy interacts with a target.
ANS.

3.5 Target Interaction and Image Appearance
Quiz If an agricultural area, with crops such as wheat and corn, became flooded, what do you think these areas might look like on a radar image? Explain the reasons for your answers based on your knowledge of how radar energy interacts with a target.
ANS Generally, image brightness increases with increased moisture content. However, in the case of flooding, the surface is completely saturated and results in standing water. (1) Areas where the water has risen above the height of the crops will likely appear dark in tone, as the water acts as a specular reflector bouncing the energy away from the radar sensor. Flooded areas would generally be distinguishable by a darker tone from the surrounding agricultural crops which are not flooded and would scatter more diffusely. (2) However, if the wheat and corn stalks are not completely submersed, then these areas may actually appear brighter on the image. In this situation, specular reflections off the water which then bounce and hit the wheat and corn stalks may act like corner reflectors. This would result in these areas appearing quite bright on the image. Thus, the degree of flooding and how much the crops are submersed will impact the appearance of the image.
3.6 Radar Image Properties
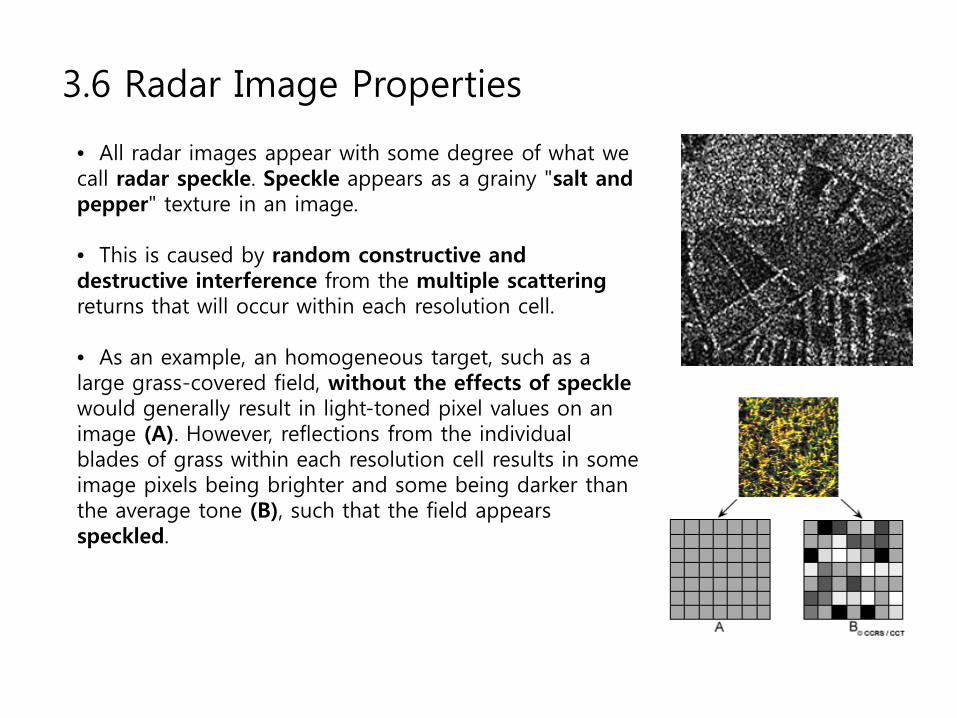
• All radar images appear with some degree of what we call radar speckle. Speckle appears as a grainy "salt and pepper" texture in an image. • This is caused by random constructive and destructive interference from the multiple scattering returns that will occur within each resolution cell.
• As an example, an homogeneous target, such as a large grass-covered field, without the effects of speckle would generally result in light-toned pixel values on an image (A). However, reflections from the individual blades of grass within each resolution cell results in some image pixels being brighter and some being darker than the average tone (B), such that the field appears speckled.

3.6 Radar Image Properties
• Speckle is essentially a form of noise which degrades the quality of an image and may make interpretation (visual or digital) more difficult. Thus, it is generally desirable to reduce speckle prior to interpretation and analysis. Speckle reduction can be achieved in two ways:
(1) multi-look processing, or (2) spatial filtering.
• Multi-look processing refers to the division of the radar beam (A) into several (in this example, five) narrower sub-beams (1 to 5). Each sub-beam provides an independent "look" at the illuminated scene, as the name suggests. Each of these "looks" will also be subject to speckle, but by summing and averaging them together to form the final output image, the amount of speckle will be reduced.
One-look (left) vs multi-look processing (right). [http://envisat.esa.int/handbooks/asar/CNTR1-4.htm]

3.6 Radar Image Properties
• Speckle reduction by spatial filtering is performed on the output image in a digital (i.e. computer) image analysis environment. Speckle reduction filtering consists of moving a small window of a few pixels in dimension (e.g. 3x3 or 5x5) over each pixel in the image, applying a mathematical calculation using the pixel values under that window (e.g. calculating the average), and replacing the central pixel with the new value. The window is moved until the entire image has been covered. By calculating the average of a small window around each pixel, a smoothing effect is achieved and the visual appearance of the speckle is reduced.
• This graphic shows a radar image before (top) and after (bottom) speckle reduction using an averaging filter. The median value of all the pixels underneath the moving window is also often used to reduce speckle. Other more complex filtering calculations can be performed to reduce speckle while minimizing the amount of smoothing taking place.
Speckle reduction using an averaging filter
3.6 Radar Image Properties
• Both multi-look processing and spatial filtering reduce speckle at the expense of resolution, since they both essentially smooth the image. Therefore, the amount of speckle reduction desired must be balanced with the particular application the image is being used for, and the amount of detail required.
• If fine detail and high resolution is required, then little or no multi-looking/spatial filtering should be done.
• If broad-scale interpretation and mapping is the application, then speckle reduction techniques may be more appropriate and acceptable.

3.6 Radar Image Properties
Correction of slant-range distortion
• Another property peculiar to radar images is slant-range distortion. Features in the near-range are compressed relative to features in the far range due to the slant-range scale variability.
• For most applications, it is desirable to have the radar image presented in a format which corrects for this distortion, to enable true distance measurements between features. This requires the slant-range image to be converted to 'ground range' display. This can be done by the radar processor prior to creating an image or after data acquisition by applying a transformation to the slant range image. In most cases, this conversion will only be an estimate of the geometry of the ground features due to the complications introduced by variations in terrain relief and topography.
slant-range display (top) vs. ground-range display (bottom)

3.6 Radar Image Properties
Antenna pattern correction
• A radar antenna transmits more power in the mid-range portion of the illuminated swath than at the near and far ranges. This effect is known as antenna pattern and results in stronger returns from the center portion of the swath than at the edges.
• Combined with this antenna pattern effect is the fact that the energy returned to the radar decreases dramatically as the range distance increases. Thus, for a given surface, the strength of the returned signal becomes smaller and smaller moving farther across the swath. These effects combine to produce an image which varies in intensity (tone) in the range direction across the image.
• A process known as antenna pattern correction may be applied to produce a uniform average brightness across the imaged swath, to better facilitate visual interpretation.

3.6 Radar Image Properties
Scaling of the Dynamic Range
• The range of brightness levels a remote sensing system can differentiate is related to radiometric resolution and is referred to as the dynamic range.
• While optical sensors, such as those carried by satellites such as Landsat and SPOT, typically produce 256 intensity levels, • radar systems can differentiate intensity levels up to around 100,000 levels.
• Since the human eye can only discriminate about 40 intensity levels at one time, this is too much information for visual interpretation. Even a typical computer would have difficulty dealing with this range of information.
• Therefore, most radars record and process the original data as 16 bits (65,536 levels of intensity), which are then further scaled down to 8 bits (256 levels) for visual interpretation and/or digital computer analysis.

3.6 Radar Image Properties
Calibration • Calibration is a process which ensures that the radar system and the signals that it measures are as consistent and as accurate as possible. • relative calibration : Prior to analysis, most radar images will require relative calibration. Relative calibration corrects for known variations in radar antenna and systems response and ensures that uniform, repeatable measurements can be made over time. This allows relative comparisons between the response of features within a single image, and between separate images to be made with confidence. • absolute calibration : However, if we wish to make accurate quantitative measurements representing the actual energy or power returned from various features or targets for comparative purposes, then absolute calibration is necessary.

3.6 Radar Image Properties
Quiz Outline the basic steps you might want to perform on a radar image before carrying out any visual interpretation.
ANS

3.6 Radar Image Properties
Quiz Outline the basic steps you might want to perform on a radar image before carrying out any visual interpretation.
ANS Before visually interpreting and analyzing a radar image, there are several procedures which would be useful to perform, including: • Converting the slant-range image to the ground-range plane display. This will remove the effects of slant-range scale distortion so that features appear in their proper relative size across the entire swath and distances on the ground are represented correctly. • Correcting for antenna pattern. This will provide a uniform average brightness of image tone making visual interpretation and comparison of feature responses at different ranges easier. • Reducing the effects of speckle to some degree. Unless there is a need for detailed analysis of very small features, speckle reduction will reduce the "grainy" appearance of the image and make general image interpretation simpler. • Scaling of the dynamic range in the image to a maximum of 8-bits (256 grey levels). Because of the limitations of most desktop computer systems, as well as of the human eye in discriminating brightness levels, any more grey levels would not be useful.

3.7 Advanced Radar Applications
• In addition to standard acquisition and use of radar data, there are 3 specific applications worth mentioning. (1) stereo radar (2) interferometry (3) polarimetry
Stereo Radar • The stereo radar is similar in concept to stereo mapping using aerial photography. Stereo radar image pairs are acquired covering the same area, but with different look/incidence angles or opposite look directions. • Unlike aerial photos where the displacement is radially outward from the nadir point directly below the camera, radar images show displacement only in the range direction. • Stereo pairs taken from opposite look directions (i.e. one looking north and the other south) may show significant contrast and may be difficult to interpret visually or digitally. In mountainous terrain, this will be even more pronounced as shadowing on opposite sides of features will eliminate the stereo effect. • Same side stereo imaging has been used operationally for years to assist in interpretation for forestry and geology and also to generate topographic maps. The estimation of distance measurements and terrain height for topographic mapping from stereo radar data is called radargrammetry, and is analogous to photogrammetry carried out for similar purposes with aerial photographs.

3.7 Advanced Radar Applications
Interferometry
• Another, more advanced method of estimating terrain height using radar is interferometry. Interferometry relies on being able to measure a property of electromagnetic waves called phase.
• Suppose we have two waves with the exact same wavelength and frequency traveling along in space, but the starting point of one is offset slightly from the other. The offset between matching points on these two waves (A) is called the phase difference.
• Interferometric systems use two antennas, separated in the range dimension by a small distance, both recording the returns from each resolution cell. The two antennas can be on the same platform (as with some airborne SARs), or the data can be acquired from two different passes with the same sensor, such has been done with both airborne and satellite radars.

3.7 Advanced Radar Applications
• By measuring the exact phase difference between the two returns (A), the path length difference can be calculated to an accuracy that is on the order of the wavelength (i.e cm).
• Knowing the position of the antennas with respect to the Earth's surface, the position of the resolution cell, including its elevation, can be determined. • The phase difference between adjacent resolution cells, is illustrated in this interferogram, where colors represents the variations in height. The information contained in an interferogram can be used to derive topographic information and produce three-dimensional imagery of terrain height.

3.7 Advanced Radar Applications
Polarimetry
• As its name implies, polarimetry involves discriminating between the polarizations that a radar system is able to transmit and receive.
• Most radars transmit microwave radiation in either horizontal (H) or vertical (V) polarization, and similarly, receive the backscattered signal at only one of these polarizations.
• Multi-polarization radars are able to transmit either H or V polarization and receive both the like- and cross-polarized returns (e.g. HH & HV or VV & VH).
horizontal (black) and vertical (red) polarizations of a plane EM wave

3.7 Advanced Radar Applications
• Polarimetric radars are able to transmit and receive both horizontal and vertical polarizations. Thus, they are able to receive and process all four combinations of these polarizations: HH, HV, VH, and VV. Each of these "polarization channels" have varying sensitivities to different surface characteristics and properties. Thus, the availability of multi-polarization data helps to improve the identification of, and the discrimination between features.
Illustration of how different polarizations (HH, VV, HV & color composite) bring out different features in an agricultural scene
• In addition to recording the magnitude of the returned signal for each polarization, most polarimetric radars are also able to record the phase information of the returned signals. This can be used to further characterize the polarimetric "signature" of different surface features.

3.7 Advanced Radar Applications
Did You Know? ... besides being able to determine terrain height using interferometry, it is also possible to measure the velocity of targets moving towards or away from the radar sensor, using only one pass over the target. This is done by recording the returns from two antennas mounted on the platform, separated by a short distance in the along-track or flight direction. The phase differences between the returns at each antenna are used to derive the speed of motion of targets in the illuminated scene. Potential applications include determination of sea-ice drift, ocean currents, and ocean wave parameters.
3.9 Airborne versus Spaceborne Radars
• Like other RS systems, an imaging radar sensor may be carried on either an airborne or spaceborne platform. Depending on the use of the prospective imagery, there are trade-offs between the two types of platforms. Regardless of the platform used, a significant advantage of using a Synthetic Aperture Radar (SAR) is that the spatial resolution is independent of platform altitude. Thus, fine resolution can be achieved from both airborne and spaceborne platforms.
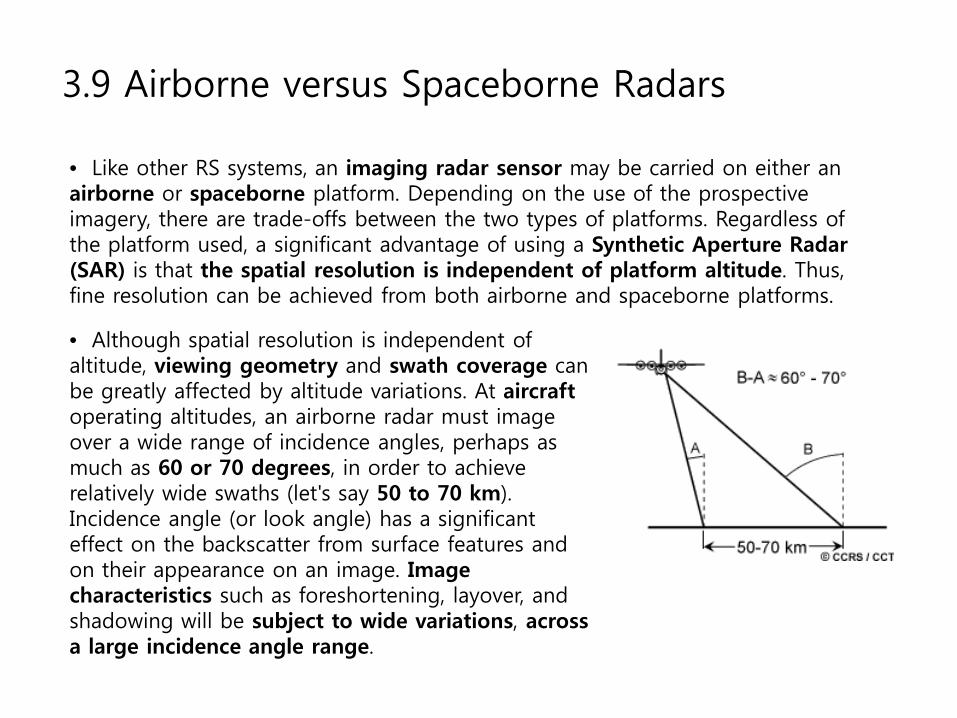
• Although spatial resolution is independent of altitude, viewing geometry and swath coverage can be greatly affected by altitude variations. At aircraft operating altitudes, an airborne radar must image over a wide range of incidence angles, perhaps as much as 60 or 70 degrees, in order to achieve relatively wide swaths (let's say 50 to 70 km). Incidence angle (or look angle) has a significant effect on the backscatter from surface features and on their appearance on an image. Image characteristics such as foreshortening, layover, and shadowing will be subject to wide variations, across a large incidence angle range.

3.9 Airborne versus Spaceborne Radars
• Spaceborne radars are able to avoid some of these imaging geometry problems since they operate at altitudes up to one hundred times higher than airborne radars. At altitudes of several hundred Km, spaceborne radars can image comparable swath widths, but over a much narrower range of incidence angles, typically ranging from five to 15 degrees. This provides for more uniform illumination and reduces undesirable imaging variations across the swath due to viewing geometry.
• Although airborne radar systems may be more susceptible to imaging geometry problems, they are flexible in their capability to collect data from different look angles and look directions. By optimizing the geometry for the particular terrain being imaged, or by acquiring imagery from more than one look direction, some of these effects may be reduced. • Additionally, an airborne radar is able to collect data anywhere and at any time (as long as weather and flying conditions are acceptable!). A spaceborne radar does not have this degree of flexibility, as its viewing geometry and data acquisition schedule is controlled by the pattern of its orbit.

3.9 Airborne versus Spaceborne Radars
• Satellite radars do have the advantage of being able to collect imagery more quickly over a larger area than an airborne radar, and provide consistent viewing geometry. The frequency of coverage may not be as often as that possible with an airborne platform, but depending on the orbit parameters, the viewing geometry flexibility, and the geographic area of interest, a spaceborne radar may have a revisit period as short as one day.
• Airborne radars will be susceptible to variations in velocity and other motions of the aircraft as well as to environmental (weather) conditions. In order to avoid image artifacts or geometric positioning errors due to random variations in the motion of the aircraft, the radar system must use sophisticated navigation/positioning equipment and advanced image processing to compensate for these variations. Generally, this will be able to correct for all but the most severe variations in motion, such as significant air turbulence.
• Spaceborne radars are not affected by motion of this type. Indeed, the geometry of their orbits is usually very stable and their positions can be accurately calculated. However, geometric correction of imagery from spaceborne platforms must take into account other factors, such as the rotation and curvature of the Earth, to achieve proper geometric positioning of features on the surface.

3.10 Airborne and Spaceborne Radar Systems
• The Convair-580 C/X SAR system developed and operated by the CCRS was a workhorse for experimental research into advanced SAR applications in Canada and around the world, particularly in preparation for satellite-borne SARs.
• This system operates at two radar bands, C- (5.66 cm) and X- (3.24 cm). Cross-polarization data can be recorded simultaneously for both the C- and X-band channels, and the C-band system can be operated as a fully polarimetric radar.
• Imagery can be acquired at three different imaging geometries (nadir, narrow and wide swath modes) over a wide range of incidence angles (5 degrees to almost 90 degrees).
• In addition to being a fully calibratable system for quantitative measurements, the system has a second antenna mounted on the aircraft fuselage to allow the C-band system to be operated as an interferometric radar.

3.10 Airborne and Spaceborne Radar Systems
• The AirSAR system (from the US NASA’s JPL) is a C-, L-, and P-band advanced polarimetric SAR which can collect data for each of these bands at all possible combinations of horizontal and vertical transmit and receive polarizations (i.e. HH, HV, VH, and VV). • Data from the AirSAR system can be fully calibrated to allow extraction of quantitative measurements of radar backscatter. Spatial resolution of the AirSAR system is on the order of 12 m in both range and azimuth. Incidence angle ranges from 0 º at nadir to about 70 º at the far range. • This capability to collect multi-frequency, multi-polarization data over such a diverse range of incidence angles allows a wide variety of specialized research experiments to be carried out.
3.10 Airborne and Spaceborne Radar Systems
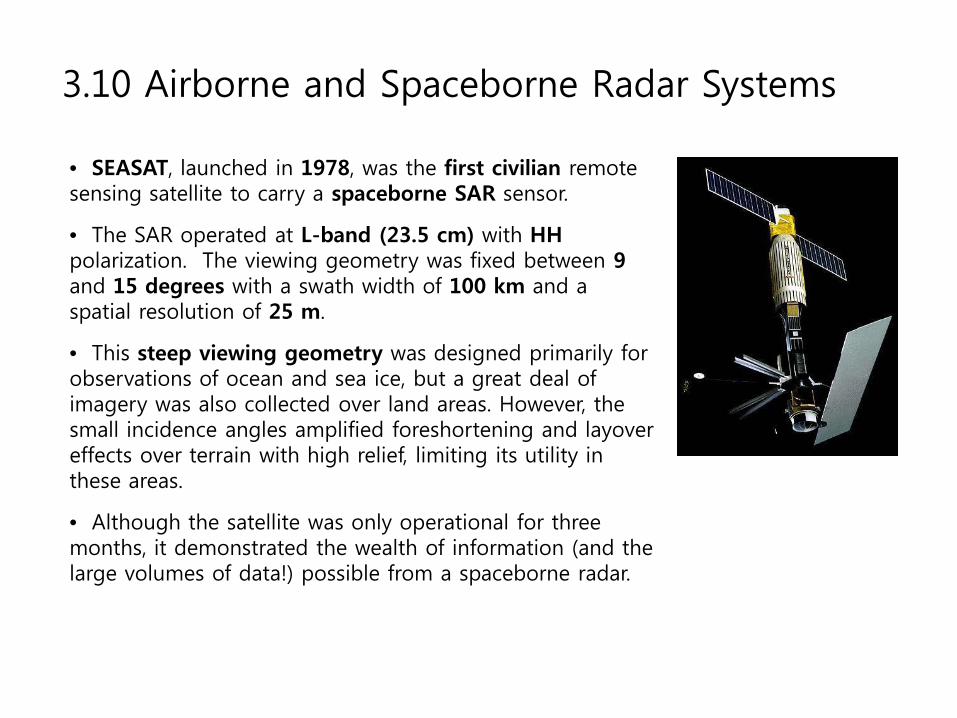
• SEASAT, launched in 1978, was the first civilian remote sensing satellite to carry a spaceborne SAR sensor.
• The SAR operated at L-band (23.5 cm) with HH polarization. The viewing geometry was fixed between 9 and 15 degrees with a swath width of 100 km and a spatial resolution of 25 m.
• This steep viewing geometry was designed primarily for observations of ocean and sea ice, but a great deal of imagery was also collected over land areas. However, the small incidence angles amplified foreshortening and layover effects over terrain with high relief, limiting its utility in these areas.
• Although the satellite was only operational for three months, it demonstrated the wealth of information (and the large volumes of data!) possible from a spaceborne radar.

3.10 Airborne and Spaceborne Radar Systems
• The European Space Agency (ESA) launched ERS-1 in July of 1991 (ERS-2 in April of 1995). Designed primarily for ocean monitoring applications and research, ERS-1 provided the worldwide remote sensing community with the first wide-spread access to spaceborne SAR data. Imagery from both satellites has been used in a wide range of applications, over both ocean and land environments. • ERS-1 carried on-board a radar altimeter, an infrared radiometer and microwave sounder, and a C-band (5.66 cm), active microwave instrument.
• This is a flexible instrument which can be operated as a scatterometer to measure reflectivity of the ocean surface, as well as ocean surface wind speed and direction. It can also operate as a synthetic aperture radar, collecting imagery over a 100 km swath over an incidence angle range of 20 to 26 degrees, at a resolution of approximately 30 m. Polarization is VV which, combined with the fairly steep viewing angles, make ERS-1 particularly sensitive to surface roughness. • The revisit period (or repeat cycle) of ERS-1 can be varied by adjusting the orbit, and has ranged from 3 to 168 days, depending on the mode of operation. Generally, the repeat cycle is about 35 days.

3.10 Airborne and Spaceborne Radar Systems
• The National Space Development Agency of Japan (NASDA), launched the JERS-1 satellite in February of 1992.
• In addition to carrying two optical sensors, JERS-1 has an L-band (23.5 cm) SAR operating at HH polarization. The swath width is approximately 75 km and spatial resolution is approximately 18 m in both range and azimuth.
• The imaging geometry of JERS-1 is slightly shallower than either SEASAT or the ERS satellites, with the incidence angle at the middle of the swath being 35 degrees. Thus, JERS-1 images are slightly less susceptible to geometry and terrain effects.
• The longer L-band wavelength of JERS-1 allows some penetration of the radar energy through vegetation and other surface types.

3.10 Airborne and Spaceborne Radar Systems
• Spaceborne SAR remote sensing took a giant leap forward with the launch of Canada's RADARSAT satellite in Nov. 1995.
• RADARSAT carries an advanced C-band (5.6 cm), HH-polarized SAR with a steerable radar beam allowing various imaging options over a 500 km range. Imaging swaths can be varied from 35 to 500 km in width, with resolutions from 10 to 100 m.
• Viewing geometry is also flexible, with incidence angles ranging from less than 20 deg to more than 50 deg.

3.10 Airborne and Spaceborne Radar Systems
Operating Mode
Standard: 7 beam modes with incidence angle ranging from 20 to 49 deg nominal, 100 km swath width and 25 m resolution. Wide: 3 beam modes with varying incidence angles, 150 km swath width. Fine: 5 beam modes with 50 km swath width and resolution better than 10 m. Scansar: Wide swath width (300-500 km) with a coarser resolution of 50 to 100 m. Extended mode.
• Although the satellite's orbit repeat cycle is 24 days, the flexibility of the steerable radar beam gives RADARSAT the ability to image regions much more frequently and to address specific geographic requests for data acquisition.
• Radarsat-2 satellite was put into orbit in December, 2007. Fully active phased antenna array ensuring the imaging with the resolution up to 1-3 m; The multi-polarization mode with the signals of two or four types of polarization at the same time is implemented; Left- and right-looking imaging along the track is enabled, thus reducing the revisit time; Capacity of the onboard storage device is increased to ensure global survey; Accuracy of satellite orbital position and attitude is improved, so is the image geolocation accuracy.

3.10 Airborne and Spaceborne Radar Systems
Quiz A particular object or feature may not have the same appearance (i.e. backscatter response) on all radar images, particularly airborne vs. spaceborne radars. List some of the factors which might account for this. ANS

3.10 Airborne and Spaceborne Radar Systems
Quiz A particular object or feature may not have the same appearance (i.e. backscatter response) on all radar images, particularly airborne vs. spaceborne radars. List some of the factors which might account for this. ANS The backscatter response, and thus the appearance of an object or feature on a radar image, is dependent on several things. • Different radar wavelengths or frequencies will result in variations due to their differing sensitivities to surface roughness, which controls the amount of energy backscattered.
• Using different polarizations will also affect how the energy interacts with a target and the subsequent energy that is reflected back to the radar. • Variations in viewing geometry, including look/incidence angle, the look direction and orientation of features to the radar, and the local incidence angle at which the radar energy strikes the surface, play a major role in the amount of energy reflected. Generally, these differences can be quite significant between airborne and spaceborne platforms. • Changes in the moisture content of an object or feature will also change the amount of backscatter.