remote sensing introduction to image classification · remote sensing is the practice of deriving...
TRANSCRIPT
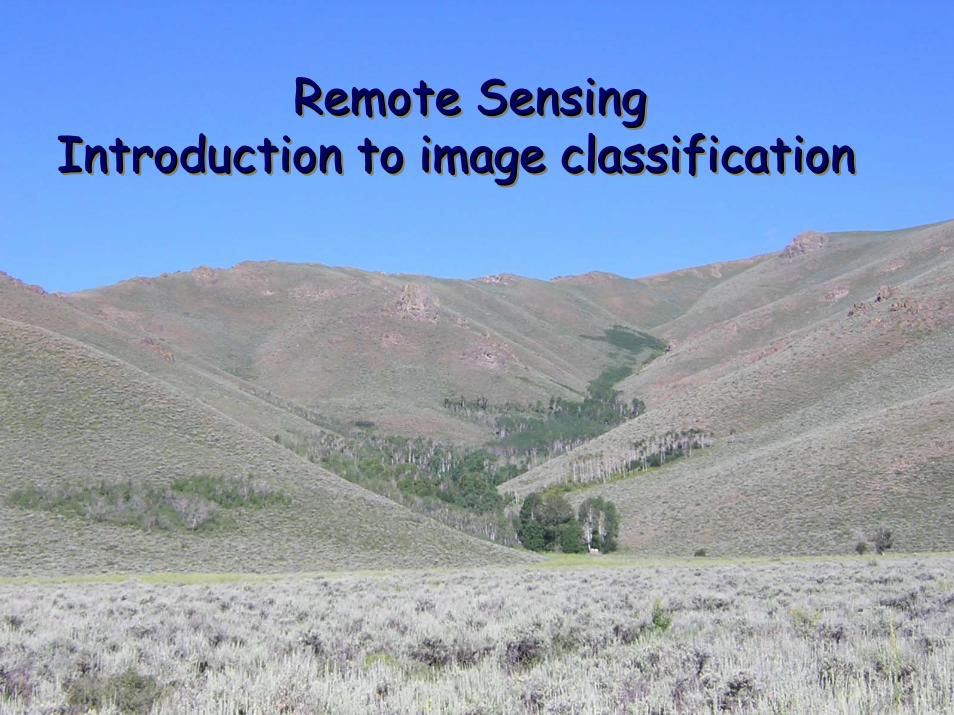
Remote SensingIntroduction to image classification
Remote SensingRemote SensingIntroduction to image classification Introduction to image classification

Remote Sensing is the practice of deriving information about the earth’s surface using images acquired from an overhead perspective.
• Aerial Photography• Digital orthophotos• Satellite imagerey• Hyperspectral data• Radar technology• Lidar, laser technology
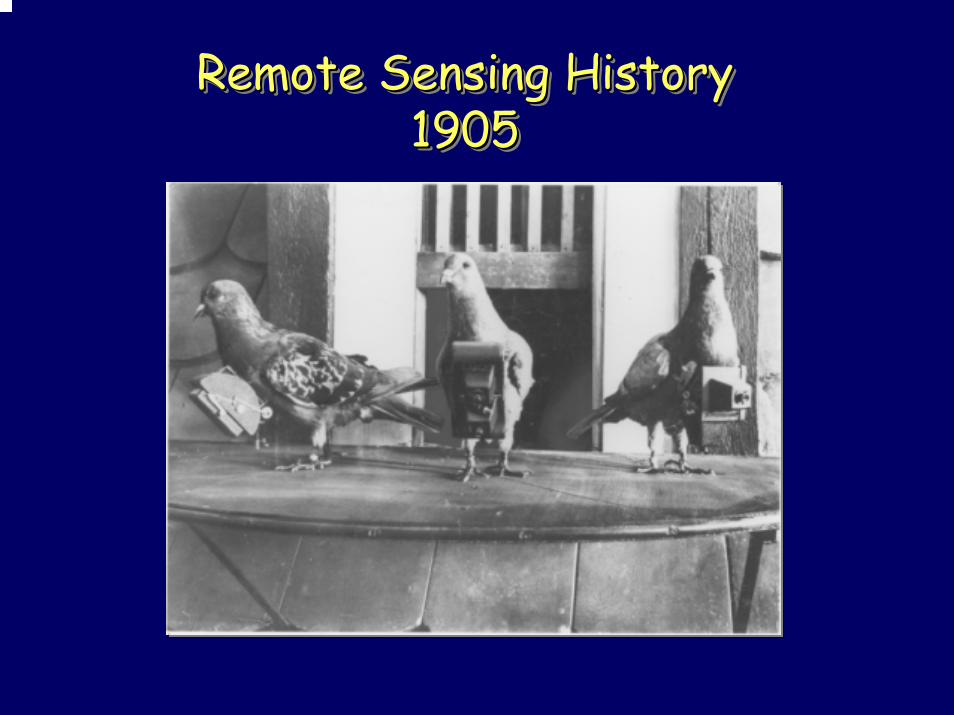
Remote Sensing History1905
Remote Sensing HistoryRemote Sensing History19051905

Aerial PhotographyEarly photography from the 30’s and 40’s
D

Aerial Photo Interpretation
DenseMediumSparse

Aspen polygons over orthophotoAspen polygons over Delineating habitats of interest using GIS
Aspen polygons over orthophotoorthophotoDelineating habitats of interest using GISDelineating habitats of interest using GIS

First satellite imageMulti Spectral Scanner 1972
First satellite imageFirst satellite imageMulti Spectral Scanner 1972Multi Spectral Scanner 1972
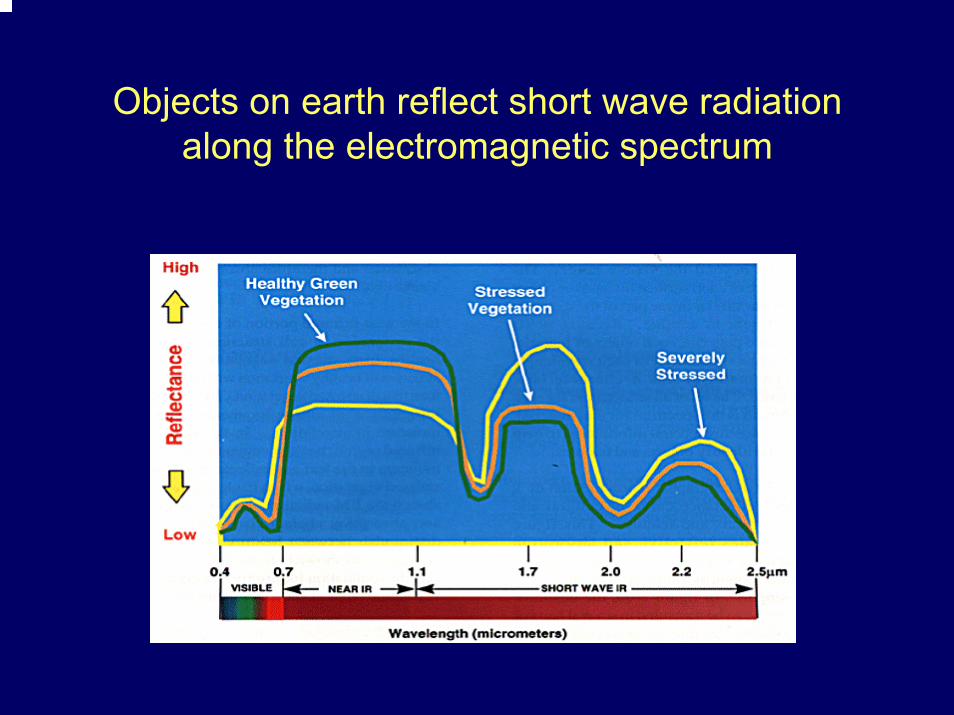
Objects on earth reflect short wave radiationalong the electromagnetic spectrum
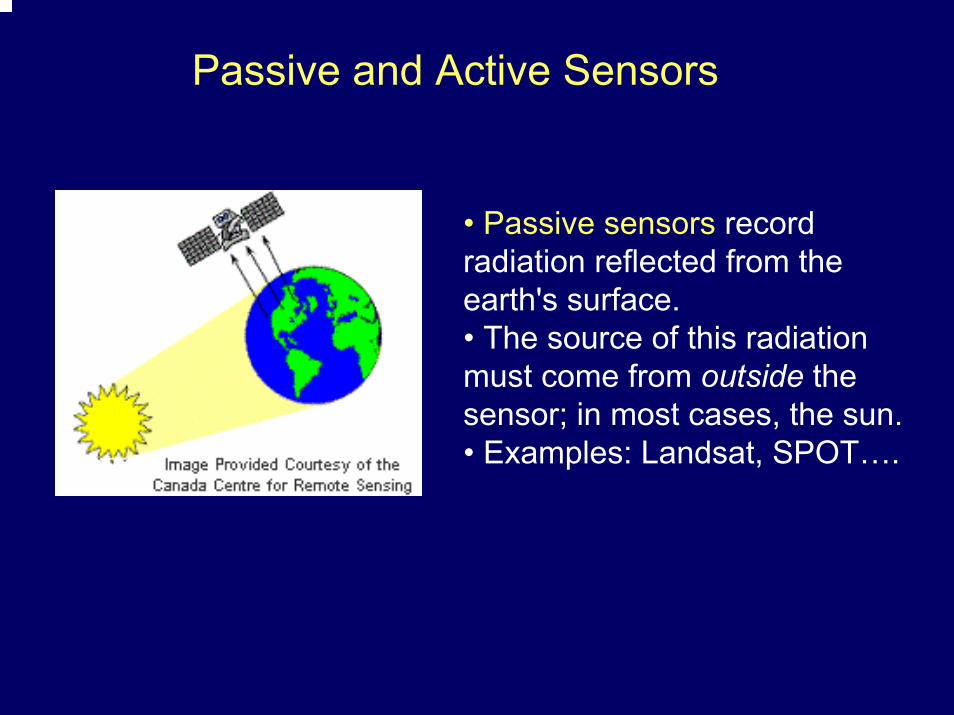
Passive and Active Sensors
• Passive sensors record radiation reflected from the earth's surface.• The source of this radiation must come from outside the sensor; in most cases, the sun.• Examples: Landsat, SPOT….
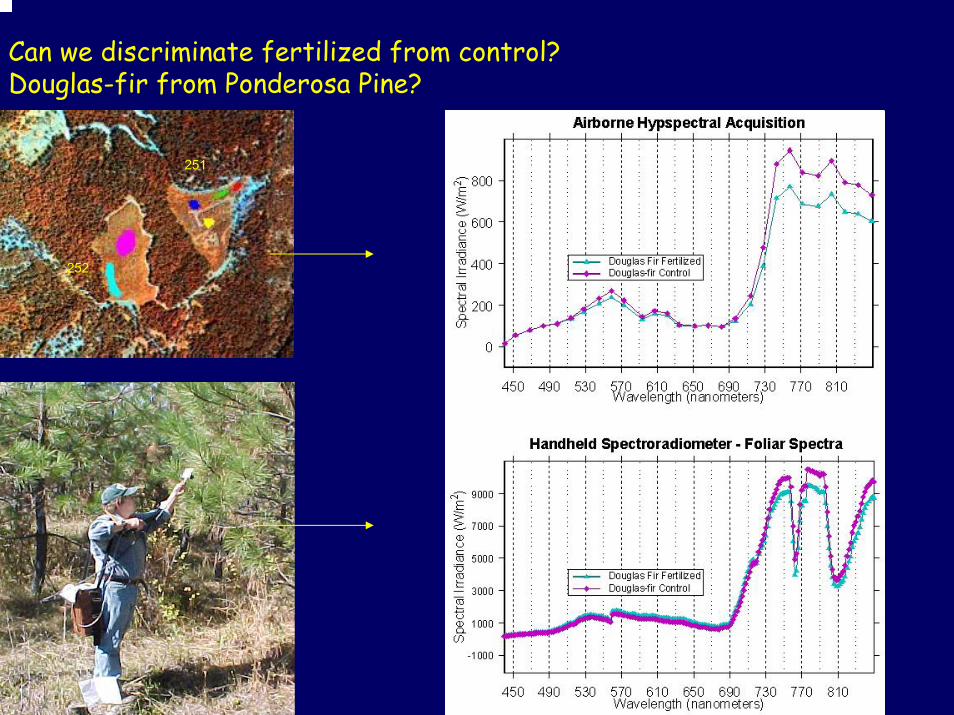
Can we discriminate fertilized from control?Douglas-fir from Ponderosa Pine?
251252
251
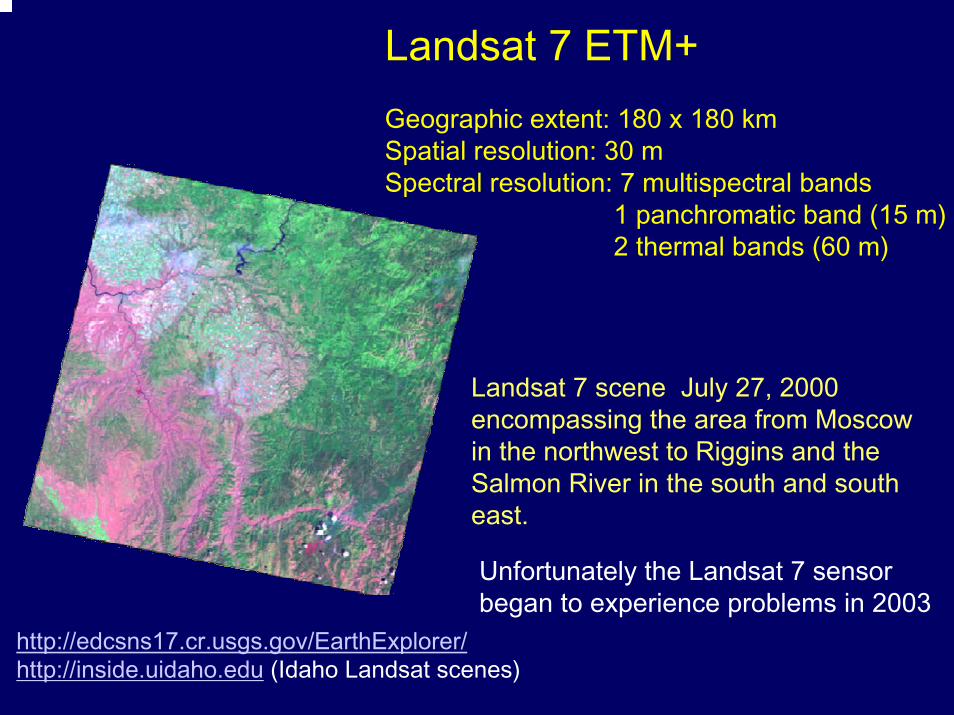
Landsat 7 scene July 27, 2000 encompassing the area from Moscow in the northwest to Riggins and the Salmon River in the south and south east.
Landsat 7 ETM+Geographic extent: 180 x 180 kmSpatial resolution: 30 mSpectral resolution: 7 multispectral bands
1 panchromatic band (15 m)2 thermal bands (60 m)
Unfortunately the Landsat 7 sensorbegan to experience problems in 2003
http://edcsns17.cr.usgs.gov/EarthExplorer/http://inside.uidaho.edu (Idaho Landsat scenes)

Landsat TM bands in the electromagnetic spectrum
7 Bands1-Blue2-Green3-Red4-Near IR5-Mid IR6-Thermal7-Mid IR
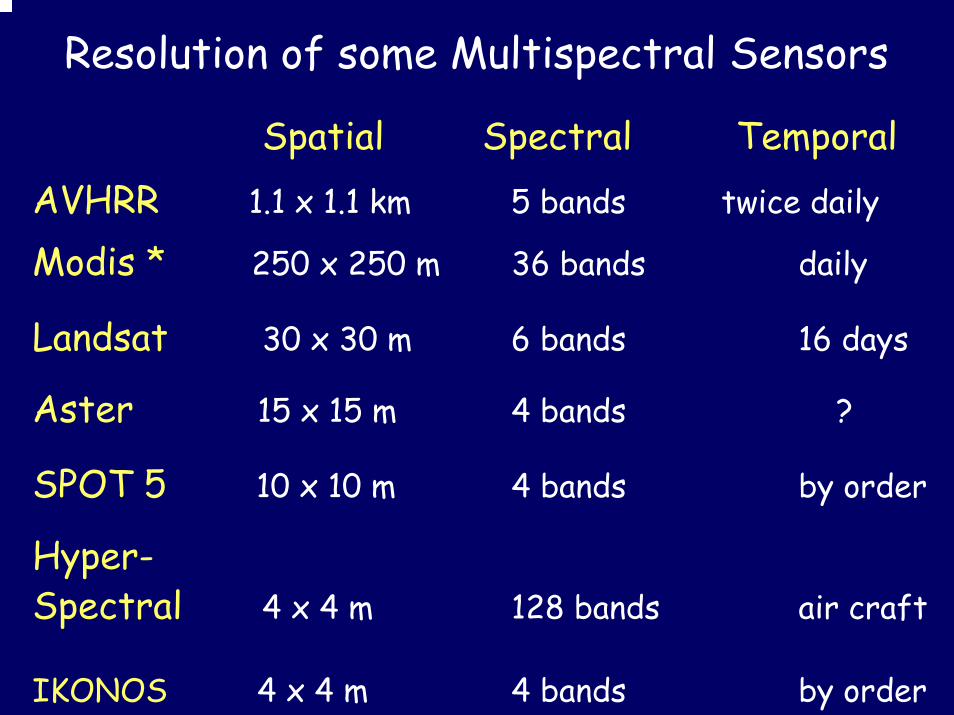
Resolution of some Multispectral Sensors
Spatial Spectral TemporalAVHRR 1.1 x 1.1 km 5 bands twice daily
Modis * 250 x 250 m 36 bands daily
Landsat 30 x 30 m 6 bands 16 days
Aster 15 x 15 m 4 bands ?
SPOT 5 10 x 10 m 4 bands by order
Hyper-Spectral 4 x 4 m 128 bands air craft
IKONOS 4 x 4 m 4 bands by order
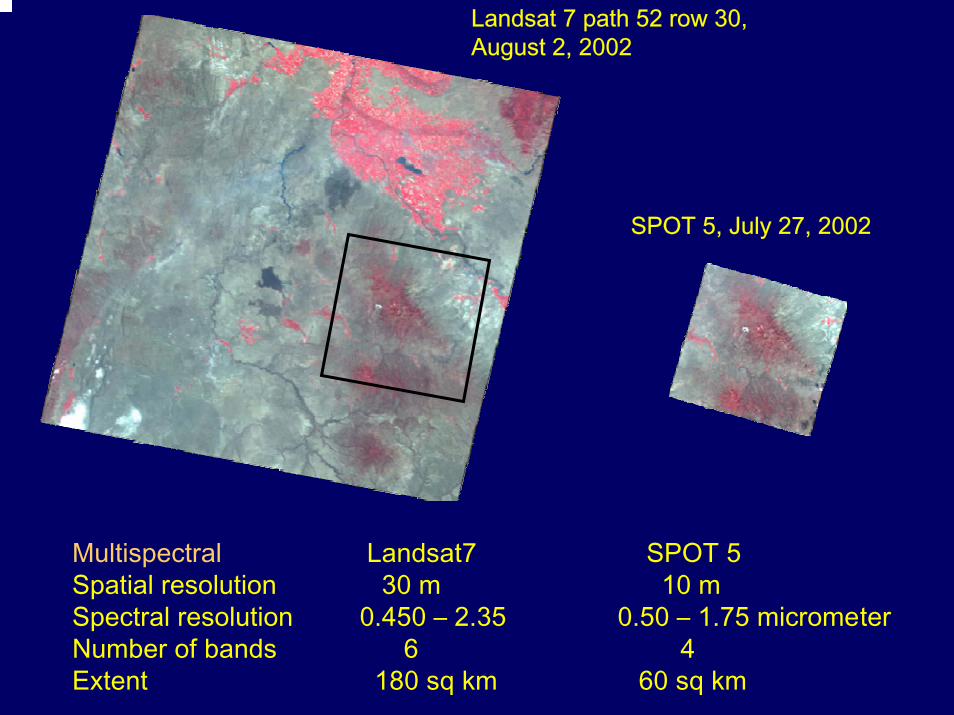
Landsat 7 path 52 row 30, August 2, 2002
SPOT 5, July 27, 2002
Multispectral Landsat7 SPOT 5Spatial resolution 30 m 10 mSpectral resolution 0.450 – 2.35 0.50 – 1.75 micrometerNumber of bands 6 4Extent 180 sq km 60 sq km

Spatial resolution comparison
3 m pixelsAVIRIS
30 m pixelsLandsat ETM
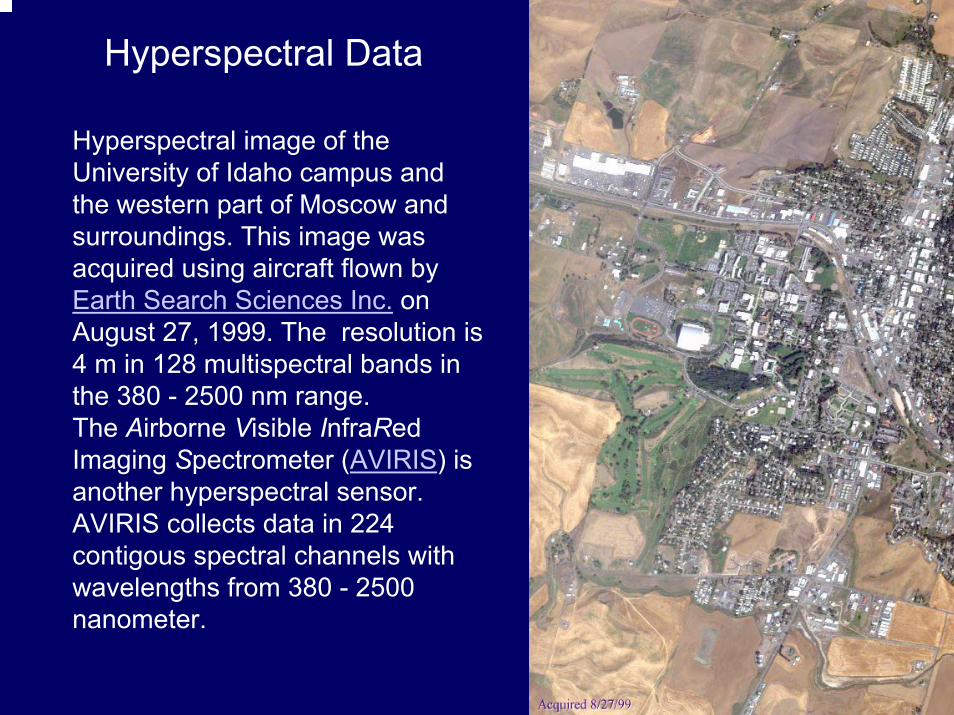
Hyperspectral Data
Hyperspectral image of the University of Idaho campus and the western part of Moscow and surroundings. This image was acquired using aircraft flown by Earth Search Sciences Inc. on August 27, 1999. The resolution is 4 m in 128 multispectral bands in the 380 - 2500 nm range.The Airborne Visible InfraRedImaging Spectrometer (AVIRIS) is another hyperspectral sensor. AVIRIS collects data in 224 contigous spectral channels with wavelengths from 380 - 2500 nanometer.
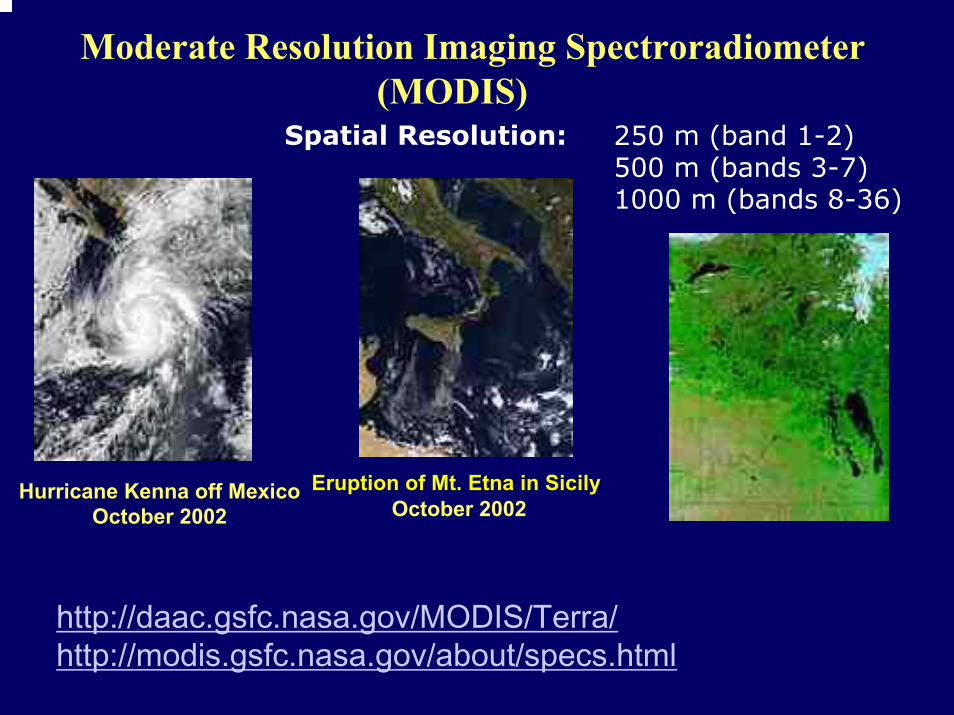
Moderate Resolution Imaging Spectroradiometer(MODIS)
Spatial Resolution: 250 m (band 1-2)500 m (bands 3-7)1000 m (bands 8-36)
Hurricane Kenna off MexicoOctober 2002
Eruption of Mt. Etna in SicilyOctober 2002
http://daac.gsfc.nasa.gov/MODIS/Terra/http://modis.gsfc.nasa.gov/about/specs.html
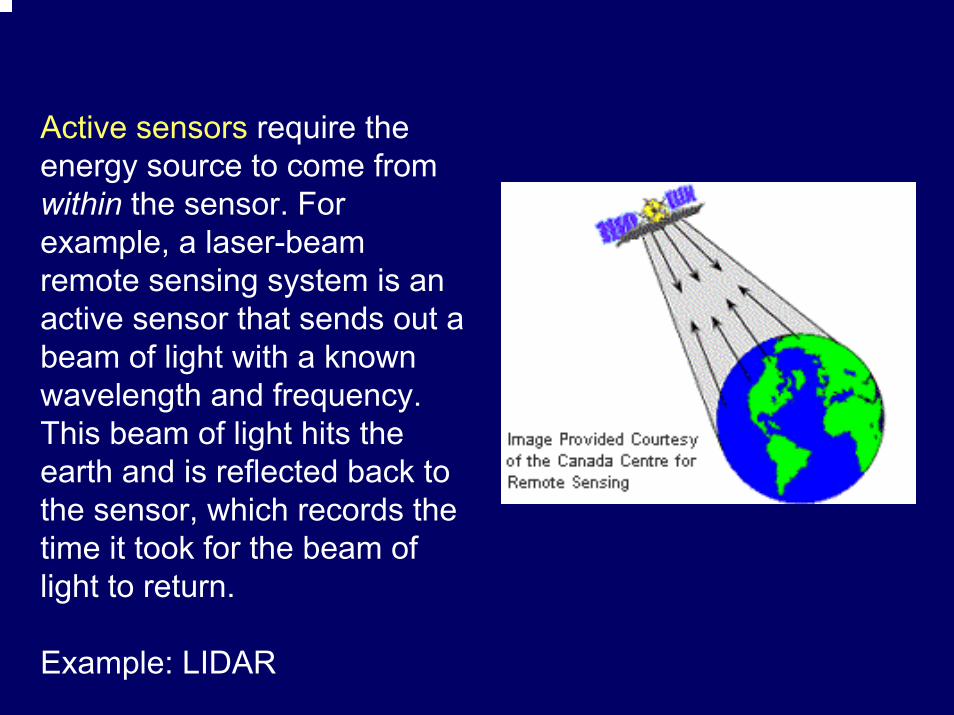
Active sensors require the energy source to come from within the sensor. For example, a laser-beam remote sensing system is an active sensor that sends out a beam of light with a known wavelength and frequency. This beam of light hits the earth and is reflected back to the sensor, which records the time it took for the beam of light to return.
Example: LIDAR
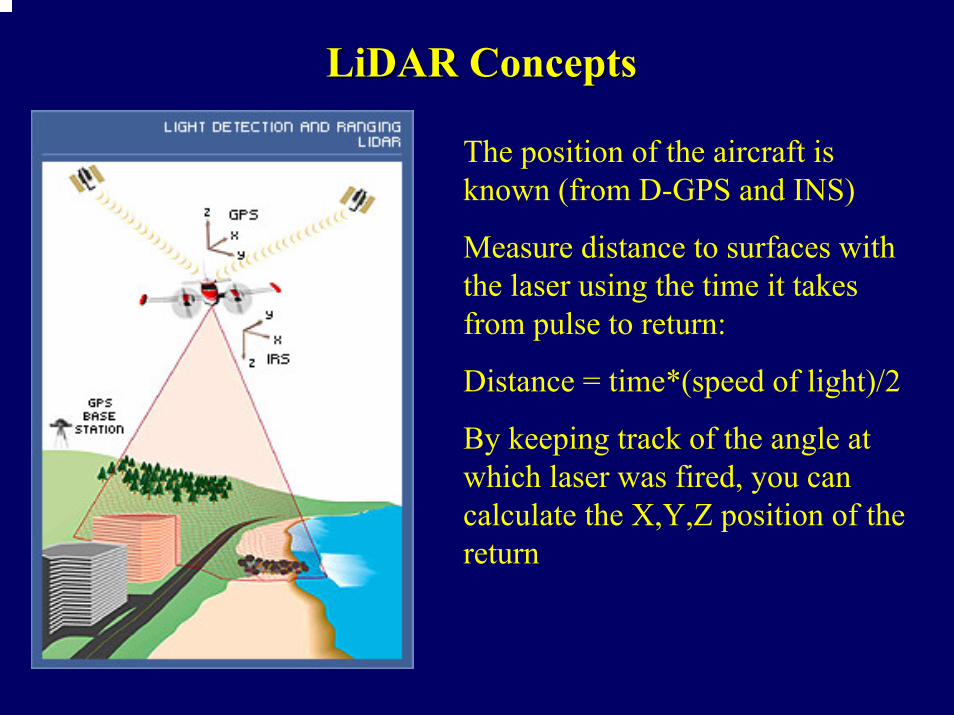
LiDAR ConceptsLiDAR Concepts
The position of the aircraft is known (from D-GPS and INS)
Measure distance to surfaces with the laser using the time it takes from pulse to return:
Distance = time*(speed of light)/2
By keeping track of the angle at which laser was fired, you can calculate the X,Y,Z position of the return

Discrete Return LiDAR for ForestryDiscrete Return LiDAR for Forestry
Can be used to measure stand characteristics including stand height, biomass distribution, volume.
DEMs are used in planning for erosion and engineering projects including roads
Mapping of forest stand structure characteristics and fire fuels conditions is under development
Today’s assignment
View Landsat image in ERDAS imagineDelineate vegetation types from training dataTest separabilityClassify image using a maximum likelihood
supervised classification technique

Landsat 7 ETM+ image (subset)
Image from the Owyhee Mountains, sw Idaho
Image pre-processing
• Radiometric correction
• Geometric correction
• Atmospheric correction
Already done for this image!
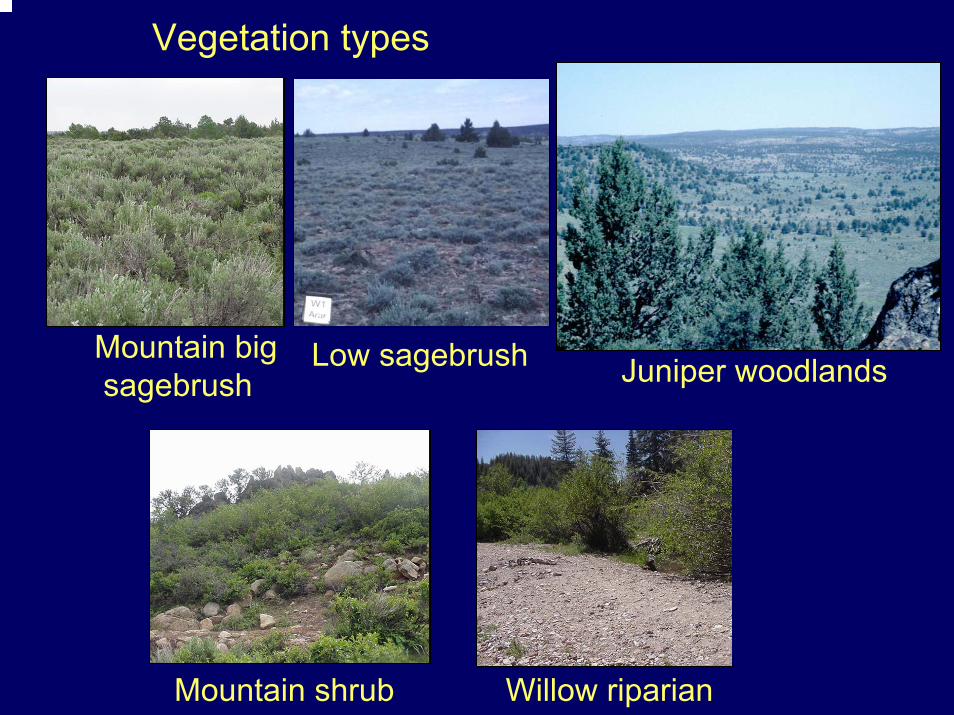
Vegetation types
Juniper woodlandsMountain bigsagebrush
Low sagebrush
Mountain shrub Willow riparian
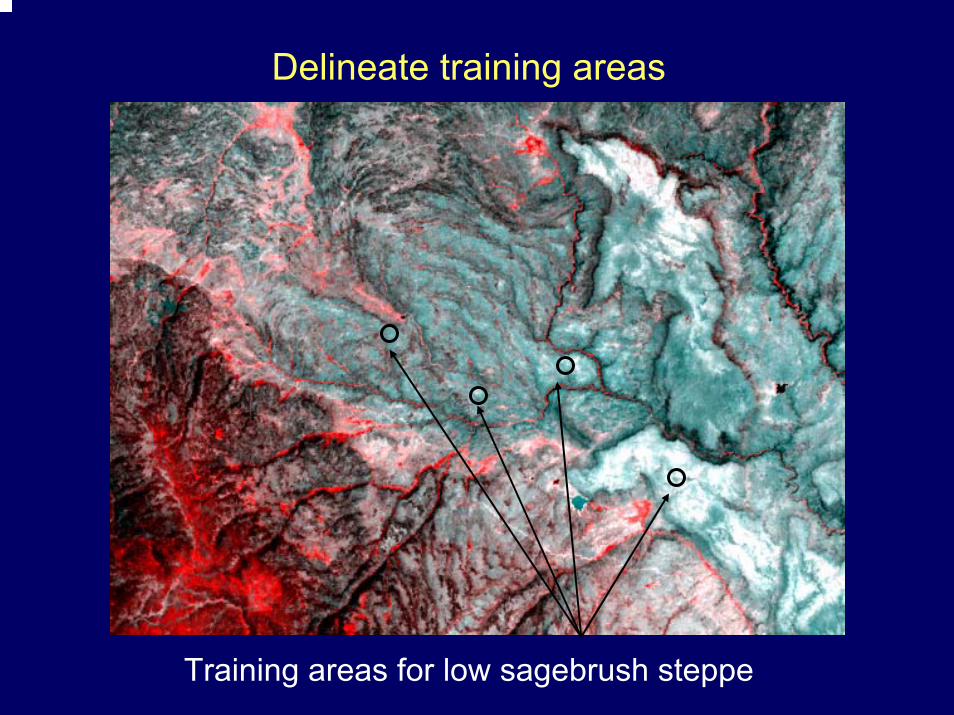
Delineate training areas
Training areas for low sagebrush steppe
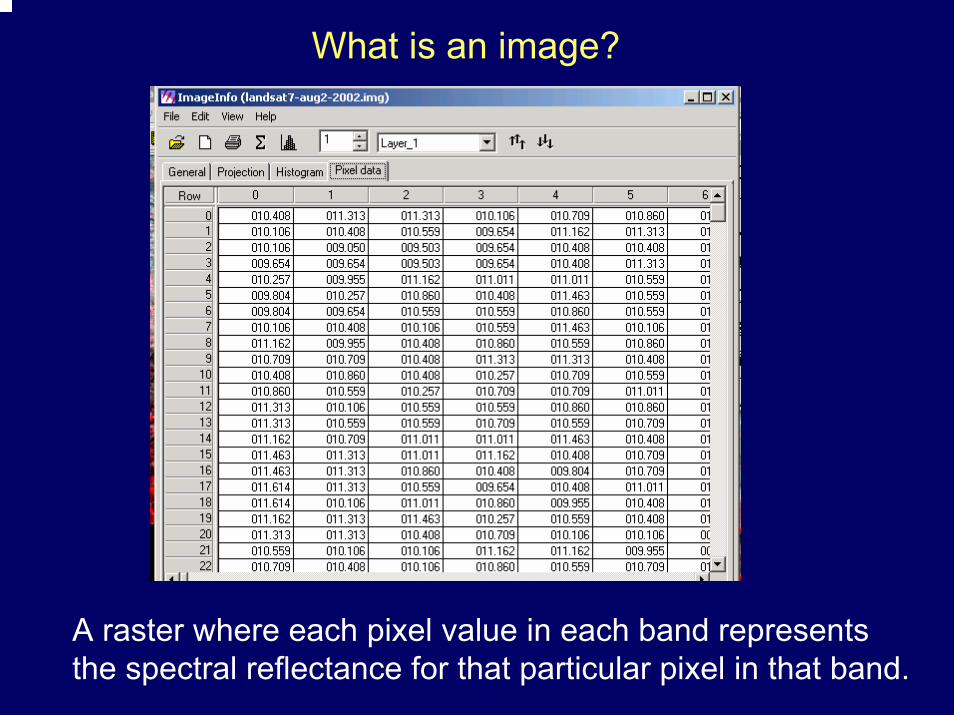
What is an image?
A raster where each pixel value in each band represents the spectral reflectance for that particular pixel in that band.
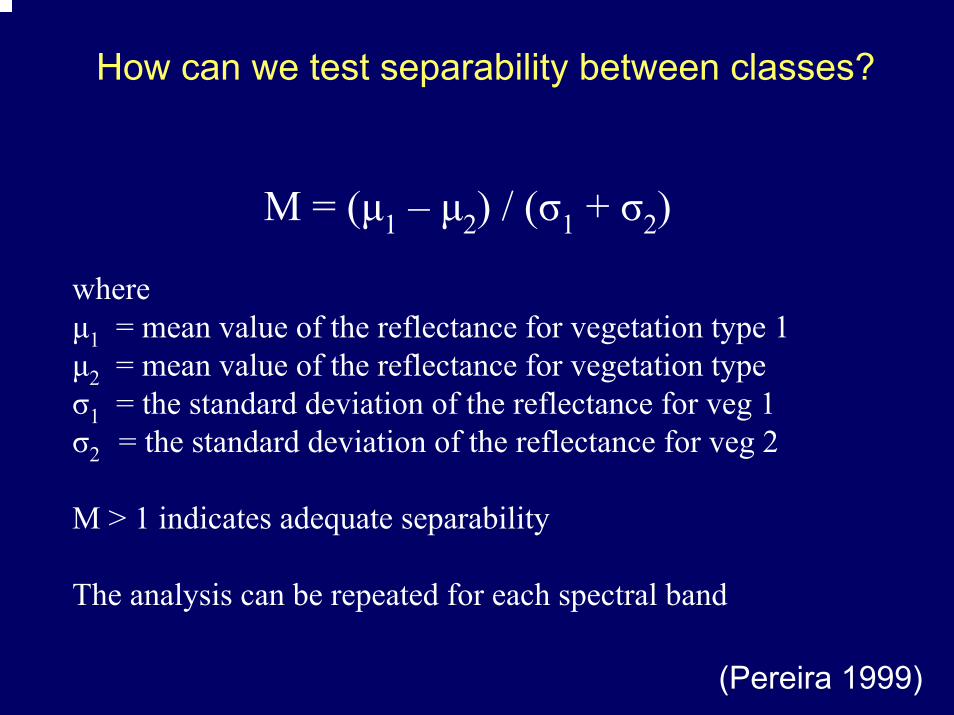
How can we test separability between classes?
M = (µ1 – µ2) / (σ1 + σ2)
whereµ1 = mean value of the reflectance for vegetation type 1µ2 = mean value of the reflectance for vegetation type σ1 = the standard deviation of the reflectance for veg 1 σ2 = the standard deviation of the reflectance for veg 2
M > 1 indicates adequate separability
The analysis can be repeated for each spectral band
(Pereira 1999)

You can also visually view the histograms for the classes.
Classes with overlapping histograms in all bands are not separable.
Bi-modal signatures are not desirable, maybe the two ‘modes’ should be separate classes.
Histograms
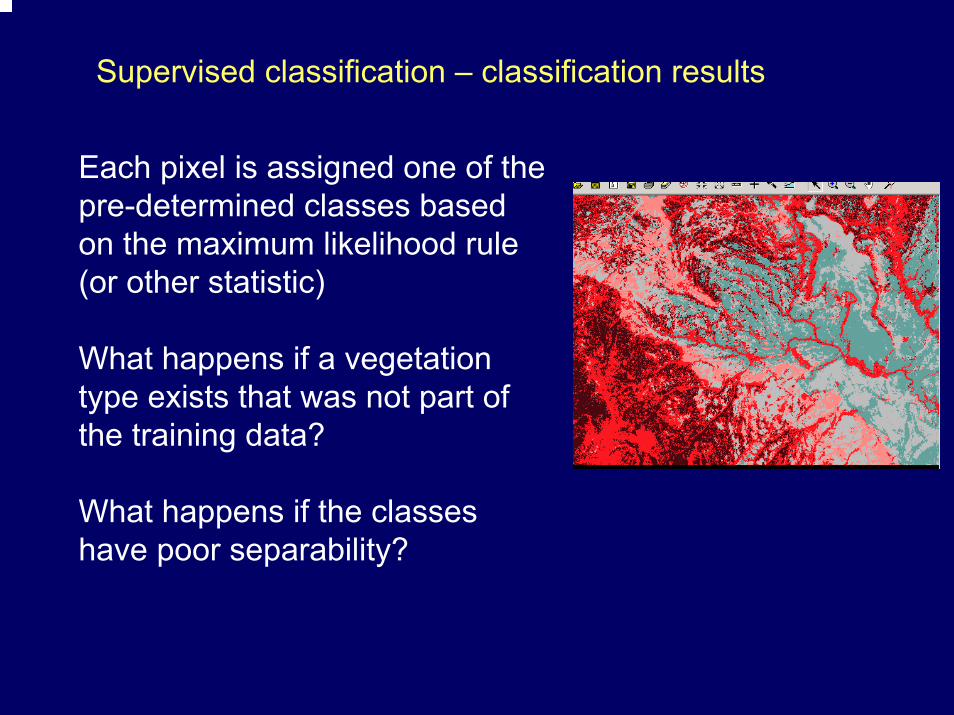
Supervised classification – classification results
Each pixel is assigned one of the pre-determined classes based on the maximum likelihood rule (or other statistic)
What happens if a vegetation type exists that was not part of the training data?
What happens if the classes have poor separability?

Remote sensing?