renewable electricity: insights for the coming decade · renewable electricity: insights for the...
TRANSCRIPT
The Joint Institute for Strategic Energy Analysis is operated by the Alliance for Sustainable Energy, LLC, on behalf of the U.S. Department of Energy’s National Renewable Energy Laboratory, the University of Colorado-Boulder, the Colorado School of Mines, the Colorado State University, the Massachusetts Institute of Technology, and Stanford University.
Contract No. DE-AC36-08GO28308
Renewable Electricity: Insights for the Coming Decade Camila Stark, Jacquelyn Pless, Jeffrey Logan, Ella Zhou, and Douglas J. Arent Joint Institute for Strategic Energy Analysis
Technical Report NREL/TP-6A50-63604 February 2015
The Joint Institute for Strategic Energy Analysis is operated by the Alliance for Sustainable Energy, LLC, on behalf of the U.S. Department of Energy’s National Renewable Energy Laboratory, the University of Colorado-Boulder, the Colorado School of Mines, the Colorado State University, the Massachusetts Institute of Technology, and Stanford University.
JISEA® and all JISEA-based marks are trademarks or registered trademarks of the Alliance for Sustainable Energy, LLC.
The Joint Institute for Strategic Energy Analysis 15013 Denver West Parkway Golden, CO 80401 303-275-3000 • www.jisea.org Contract No. DE-AC36-08GO28308
Renewable Electricity: Insights for the Coming Decade Camila Stark, Jacquelyn Pless, Jeffrey Logan, Ella Zhou, and Douglas J. Arent Joint Institute for Strategic Energy Analysis
Prepared under Task No. WRGD.1000
Technical Report NREL/TP-6A50-63604 February 2015
NOTICE
This report was prepared as an account of work sponsored by an agency of the United States government. Neither the United States government nor any agency thereof, nor any of their employees, makes any warranty, express or implied, or assumes any legal liability or responsibility for the accuracy, completeness, or usefulness of any information, apparatus, product, or process disclosed, or represents that its use would not infringe privately owned rights. Reference herein to any specific commercial product, process, or service by trade name, trademark, manufacturer, or otherwise does not necessarily constitute or imply its endorsement, recommendation, or favoring by the United States government or any agency thereof. The views and opinions of authors expressed herein do not necessarily state or reflect those of the United States government or any agency thereof.
This report is available at no cost from the National Renewable Energy Laboratory (NREL) at www.nrel.gov/publications.
Available electronically at http://www.osti.gov/scitech
Available for a processing fee to U.S. Department of Energy and its contractors, in paper, from:
U.S. Department of Energy Office of Scientific and Technical Information P.O. Box 62 Oak Ridge, TN 37831-0062 phone: 865.576.8401 fax: 865.576.5728 email: mailto:[email protected]
Available for sale to the public, in paper, from:
U.S. Department of Commerce National Technical Information Service 5285 Port Royal Road Springfield, VA 22161 phone: 800.553.6847 fax: 703.605.6900 email: [email protected] online ordering: http://www.ntis.gov/help/ordermethods.aspx
Cover Photos: (left to right) PIX 04135, iStock 22779761, PIX 16933., PIX 15648, PIX 08466, PIX 21205
NREL prints on paper that contains recycled content.
iii
This report is available at no cost from the National Renewable Energy Laboratory (NREL) at www.nrel.gov/publications.
Acknowledgments We thank Brandon Owens and colleagues at GE Ecomagination for making this study possible. Thanks also to reviewers at General Electric for providing feedback on earlier versions of this report.
We would also like recognize the following National Renewable Energy Laboratory/Joint Institute for Strategic Energy Analysis peer reviewers: Chad Augustine, David Corbus, George Douglas, Thomas Foust, Bobi Garrett, Benjamin Kroposki, Jordan Macknick, David Mooney, Robin Newmark, Gian Porro, Brian Smith, Robert Thresher, Sarah Truitt, Craig Turchi, and Gregory Wilson.
Thanks also to the following renewable electricity technology experts who helped inform the technology assessments: Scott Huffman, David Mooney, Walter Musial, and Mark Ruth.
Finally, thanks to the communications team: Scott Gossett, Karin Haas, and Lauren Zwicker.
Any remaining errors, omissions, or mischaracterizations are the responsibility of the authors.
iv
This report is available at no cost from the National Renewable Energy Laboratory (NREL) at www.nrel.gov/publications.
Preface This study was commissioned by Ecomagination of General Electric and carried out by the Joint Institute for Strategic Energy Analysis. It describes recent trends in renewable electricity (RE) costs and technology improvements. RE technologies, led by wind and solar photovoltaics, have accounted for roughly half of all new capacity additions around the world since 2011. This research highlights how RE costs have declined to the point of being increasingly competitive with many traditional generation options, even without incentives.
This study focuses on costs and brief technology assessments; it does not consider the many complex market and policy issues that influence deployment of technologies. It also restricts itself to RE costs at the busbar, or point of departure from the power plant. Transmission and integration costs are complex, highly site-specific, and beyond the scope of this study.
The authors calculate the levelized cost of electricity generation for three regions of the world as the technologies are understood today, and based on expected changes over the next decade. Of course, no one knows how costs will actually change over that time, so the results should be considered as one view of the future. The estimated costs used in this study were taken from a combination of literature reviews and expert interviews.
The technology assessments in this study also come from a combination of materials from published literature and from expert interviews with scientists at the National Renewable Energy Laboratory in late 2014.
Finally, the authors present case study “snapshots” of RE deployment trends in two countries: China and the United States. While there are many other interesting stories to tell about RE deployment around the globe, the authors chose these two because of their sizes, dynamism, and unique policy environments. Although an analysis of market and policy effects on RE is beyond the scope of this study, these case studies provide real world context for the RE technology trends described throughout the paper.
v
This report is available at no cost from the National Renewable Energy Laboratory (NREL) at www.nrel.gov/publications.
Executive Summary A sophisticated set of renewable electricity (RE) generation technologies is now commercially available. Globally, RE captured approximately half of all capacity additions since 2011. The cost of RE is already competitive with fossil fuels in some areas around the world, and prices are anticipated to continue to decline over the next decade. RE options, led by wind and solar, are part of a suite of technologies and business solutions that are transforming electricity sectors around the world.
Renewable deployment is expected to continue due to:
• Increasingly competitive economics
• Favorable environmental characteristics such as low water use, and minimal local air pollution and greenhouse gas (GHG) emissions
• Complementary risk profiles when paired with natural gas generators
• Strong support from stakeholders.
Despite this positive outlook for renewables, the collapse in global oil prices since mid-2014 and continued growth in natural gas supply in the United States—due to the development of low-cost shale gas—raise questions about the potential impacts of fossil fuel prices on RE. Today, oil plays a very minor role in the electricity sectors of most countries, so direct impacts on RE are likely to be minimal (except where natural gas prices are indexed to oil). Natural gas and RE generating options appear to be more serious competitors than oil and renewables. Low gas prices raise the hurdle for RE to be cost competitive. Additionally, although RE emits far less GHG than natural gas, both natural gas and RE offer the benefits of reducing carbon relative to coal and oil (see Section 4.1 for more detail on the GHG intensity of electricity technologies). However, many investors and decision makers are becoming aware of the complementary benefits of pairing natural gas and renewables to minimize risk of unstable fuel prices and maintain the reliability of electricity to the grid. Even relatively low natural gas prices in North America over the past five years have not significantly impacted the deployment of RE, and it thus appears that both natural gas and renewables have opportunities to continue growing in the near- to mid-term.
This report examines cost reduction and technology improvement trends for a suite of RE generation options, and illuminates other factors that may influence their deployment through 2025.
Cost Trends
Over the past few decades, technological advancements have led to notable cost and performance improvements for some RE options, particularly land-based wind and solar photovoltaics (PV). The combination of technical and cost competiveness advances along with innovative financing, deal structuring, and business models for solar PV has opened the market to new producer and consumer segments, and more generally has made renewables increasingly cost competitive in many regions.
RE costs have declined dramatically over the past decades—some up to nearly 80% since 2009—with the most significant improvements in wind and solar PV (see Section 2 for more
vi
This report is available at no cost from the National Renewable Energy Laboratory (NREL) at www.nrel.gov/publications.
detail). Cost reductions are likely to continue as markets expand and technologies improve. The levelized cost of electricity1 (LCOE) of solar PV dropped by 50% between 2010 and 2014 alone, making PV increasingly competitive in both the residential and utility markets. Today, onshore wind LCOEs fall either within the range or below those of new fossil fuel power generation.
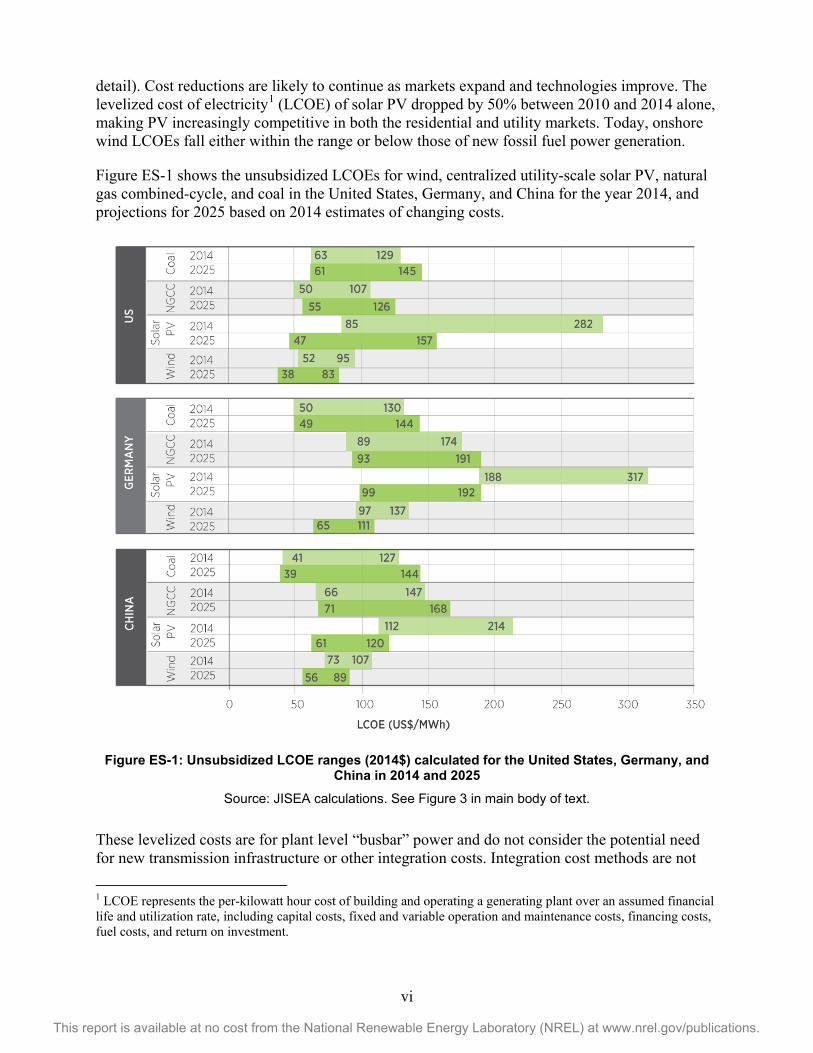
Figure ES-1 shows the unsubsidized LCOEs for wind, centralized utility-scale solar PV, natural gas combined-cycle, and coal in the United States, Germany, and China for the year 2014, and projections for 2025 based on 2014 estimates of changing costs.
Figure ES-1: Unsubsidized LCOE ranges (2014$) calculated for the United States, Germany, and
China in 2014 and 2025 Source: JISEA calculations. See Figure 3 in main body of text.
These levelized costs are for plant level “busbar” power and do not consider the potential need for new transmission infrastructure or other integration costs. Integration cost methods are not
1 LCOE represents the per-kilowatt hour cost of building and operating a generating plant over an assumed financial life and utilization rate, including capital costs, fixed and variable operation and maintenance costs, financing costs, fuel costs, and return on investment.
vii
This report is available at no cost from the National Renewable Energy Laboratory (NREL) at www.nrel.gov/publications.
consistent across studies and are still evolving; therefore, it is difficult to compare integration costs across technologies. The LCOE ranges are wide because RE costs vary by region within a country based on solar and wind resource.2 For example, the highest LCOE values in solar PV reflect regions with low solar resource, such as in northern Germany. Likewise, fossil fuel prices vary across countries and within them. In the United States, Germany, and China, solar and wind are either currently competitive or are expected to become competitive with new fossil generation, on average, by 2025 based on our assessment.
Technology and Integration Trends
Growth in RE installations around the globe has been robust since 2004. Cumulative global wind power capacity expanded from 48 GW in 2004 to 318 GW at the end of 2013, while solar PV grew from 2.6 GW to 139 GW over the same time period. Record growth continued in 2014 (REN21 2014).
Wind technology improvements have centered on higher towers, longer blades, advanced materials, and use of intelligent communications to increase the energy output per unit of investment. Likewise, solar technologies have improved through steady engineering and manufacturing advances, greater economies of scale, and fundamental advances in materials research.
With the increased penetration of RE, grid operators are faced with a new challenge: integrating these often variable resources into the grid. New developments in near-term wind and solar forecasting, faster planning cycles, expanded control areas, transmission expansion, demand side flexibility, and flexible generators are helping to address this challenge. Research, and an increasing experience base, suggests that integration of variable renewable generation, particularly wind and solar electricity, of 30% of annual energy demand is readily feasible in most locations around the world with the upper limits varying based on system flexibility, market design, grid management and operations and other factors.
Other Key Insights
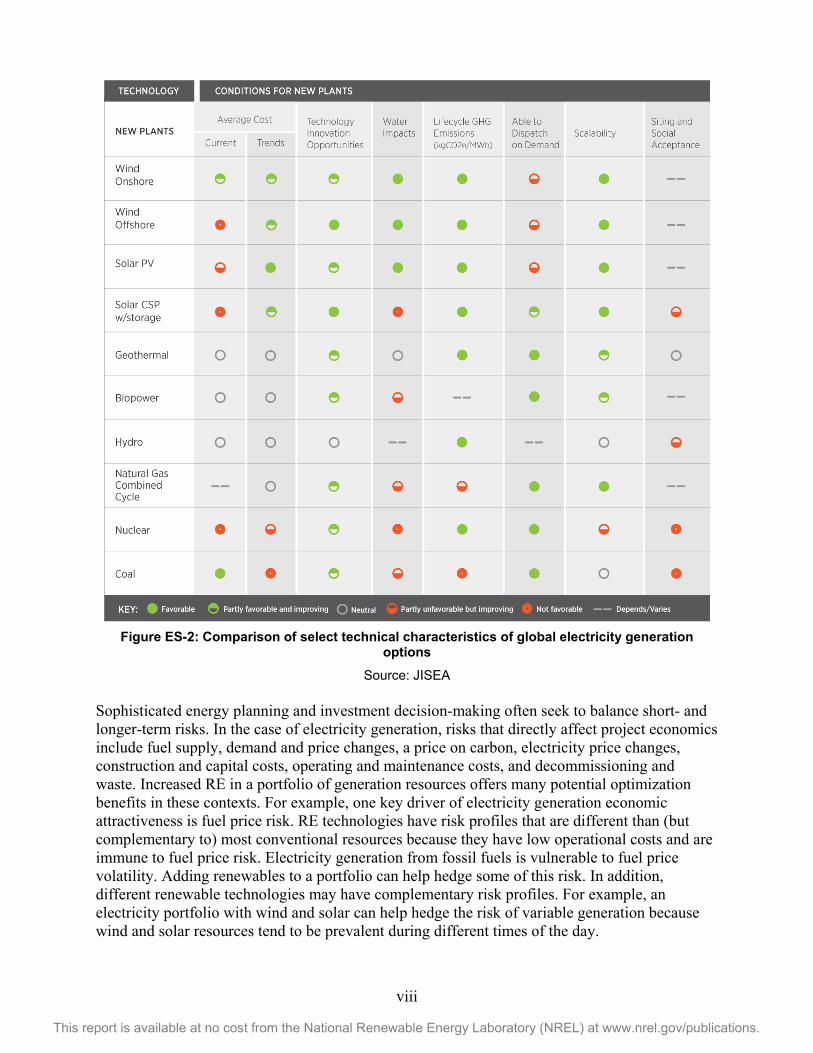
RE market development is increasingly being driven by the many benefits of renewables, including energy security, resiliency, and the minimal impact renewables have on the environment. Most RE options provide cleaner and less water-intensive power than traditional generation. In addition, renewables are readily scalable, and can be rapidly deployed in both centralized and decentralized markets. Figure ES-2 summarizes some of the key economic and technical characteristics of RE options and compares them to natural gas combined-cycle (NGCC), nuclear, and coal generators. Some of these ratings are admittedly dynamic and subjective (siting and social acceptance, technology innovation opportunities); others are more quantifiable and stable (water impacts, GHG emissions). This figure does not attempt to capture other market and policy issues—such as the feasibility of finance—that go beyond the scope of this study.
2 Some of the best resource sites, particularly for onshore wind, may lead to even lower LCOEs than reported here. See section 2 for more detail.
viii
This report is available at no cost from the National Renewable Energy Laboratory (NREL) at www.nrel.gov/publications.
Figure ES-2: Comparison of select technical characteristics of global electricity generation options
Source: JISEA Sophisticated energy planning and investment decision-making often seek to balance short- and longer-term risks. In the case of electricity generation, risks that directly affect project economics include fuel supply, demand and price changes, a price on carbon, electricity price changes, construction and capital costs, operating and maintenance costs, and decommissioning and waste. Increased RE in a portfolio of generation resources offers many potential optimization benefits in these contexts. For example, one key driver of electricity generation economic attractiveness is fuel price risk. RE technologies have risk profiles that are different than (but complementary to) most conventional resources because they have low operational costs and are immune to fuel price risk. Electricity generation from fossil fuels is vulnerable to fuel price volatility. Adding renewables to a portfolio can help hedge some of this risk. In addition, different renewable technologies may have complementary risk profiles. For example, an electricity portfolio with wind and solar can help hedge the risk of variable generation because wind and solar resources tend to be prevalent during different times of the day.

ix
This report is available at no cost from the National Renewable Energy Laboratory (NREL) at www.nrel.gov/publications.
Globally, RE continues to benefit from transparent long-term pricing, low or reduced water intensity, use of domestic resources, and contribution to local, regional, and global policy goals of meeting renewable energy and environmental standards. Financial incentives and subsidies are less likely to play a substantial role in the expansion of RE going forward than they have previously, given increasing cost competitiveness within the current economic structures. Indeed, in many locations, many RE technologies are already cost competitive with new conventional generating sources even without financial support. However, a subsidy-free world does not imply a policy-free environment. Moving forward, energy policies may focus more on enabling integration, alternative market designs (such as one that values flexibility), and operational advances.
Countries all over the world are incorporating more RE and transforming their electricity sectors. Some of the countries with the most notable investment in RE since 2004 include Australia, Brazil, Canada, China, Denmark, France, Germany, India, Italy, Japan, Mexico, the Philippines, South Africa, the United Kingdom, the United States, and many others. This report briefly explores two of these countries, the United States and China, which provide real world context for the RE technology trends described throughout the paper. The case studies illustrate that increased competitiveness of RE options may substantially contribute to local and national goals—which would reflect strategic industrial policy, energy security and fuel diversification, and air pollution mitigation drivers—and may lead to continued strong expansion of RE and contribute to the transformation of the power market dynamics in China and the United States.
Advancements in RE technologies and experience gained from decades of learning have dramatically changed electricity markets worldwide. Growing concerns about the water intensity and GHG emissions from the electricity industry have illustrated the need for alternative electricity options that are clean, reliable, and affordable. With the reductions in costs and RE innovations that have occurred over the past decade, RE is better positioned than at any time in history to provide increased value to customers, utilities and system operators, and contribute to the new wave of electricity systems solutions.
x
This report is available at no cost from the National Renewable Energy Laboratory (NREL) at www.nrel.gov/publications.
Table of Contents 1 Introduction ........................................................................................................................................... 1
1.1 Historical Background ................................................................................................................... 2 1.2 Drivers of Greater Penetrations of RE .......................................................................................... 3 1.3 Challenges of Greater Penetrations of RE ..................................................................................... 5
2 Economic Competitiveness: Moving Beyond Incentive Reliance ................................................... 7 2.1 LCOE: Recent Improvements and a Focus on Wind and Solar PV .............................................. 7 2.2 Looking Beyond LCOE .............................................................................................................. 13
3 Assessing Technology Trends ......................................................................................................... 15 3.1 Wind Energy ............................................................................................................................... 15 3.2 Solar PV ...................................................................................................................................... 20 3.3 Concentrating Solar Power .......................................................................................................... 24 3.4 Geothermal .................................................................................................................................. 26 3.5 Bio-power .................................................................................................................................... 27 3.6 Ocean Energy .............................................................................................................................. 28 3.7 Synthesis of RE Technology Trends ........................................................................................... 28
4 Environmental Attributes of RE ........................................................................................................ 31 4.1 The Role of RE in Reducing GHG Emissions ............................................................................ 31 4.2 Renewables and the Energy-Water Nexus .................................................................................. 33
5 Putting it All Together: Grid Integration ........................................................................................... 37 5.1 Demand Side Flexibility .............................................................................................................. 37 5.2 Supply Side Flexibility ................................................................................................................ 38 5.3 Communication, Control, and Information Technology ............................................................. 39 5.4 Grid Expansion and Geographic Management............................................................................ 40 5.5 Energy Storage ............................................................................................................................ 41
6 International Case Studies ................................................................................................................ 42 6.1 United States ............................................................................................................................... 42 6.2 China ........................................................................................................................................... 45
7 Conclusion .......................................................................................................................................... 49 References ................................................................................................................................................. 51 Appendix A: LCOE Inputs and Assumptions ......................................................................................... 66 Appendix B: Supplemental References .................................................................................................. 79
Wind Energy ......................................................................................................................................... 79 Solar Photovoltaic Energy .................................................................................................................... 79 Concentrating Solar Power ................................................................................................................... 79 Geothermal Energy ............................................................................................................................... 80 Bio-power ............................................................................................................................................. 80 Ocean Energy ....................................................................................................................................... 81 Grid Integration .................................................................................................................................... 81
1
This report is available at no cost from the National Renewable Energy Laboratory (NREL) at www.nrel.gov/publications.
1 Introduction Economists and scientists describe several “energy eras” through which societies have progressed over time (Channell et al. 2013). Biomass, wind, solar, and water were some of our earliest forms of energy. We used them to heat and cook, propel ships, and dry and grind grains. Coal, oil, and natural gas—the fossil fuels—drove the industrial revolution and still make up the bulk of energy use in most countries today. The ability to control nuclear fission led to a rapid growth in nuclear electricity starting in the 1960s, and nuclear electricity continues to play an important role in several countries. Starting in the 1970s, oil price shocks and environmental concerns brought a renewed emphasis to harnessing our natural, renewable resources. RE options have become major contributors in the latest energy era.
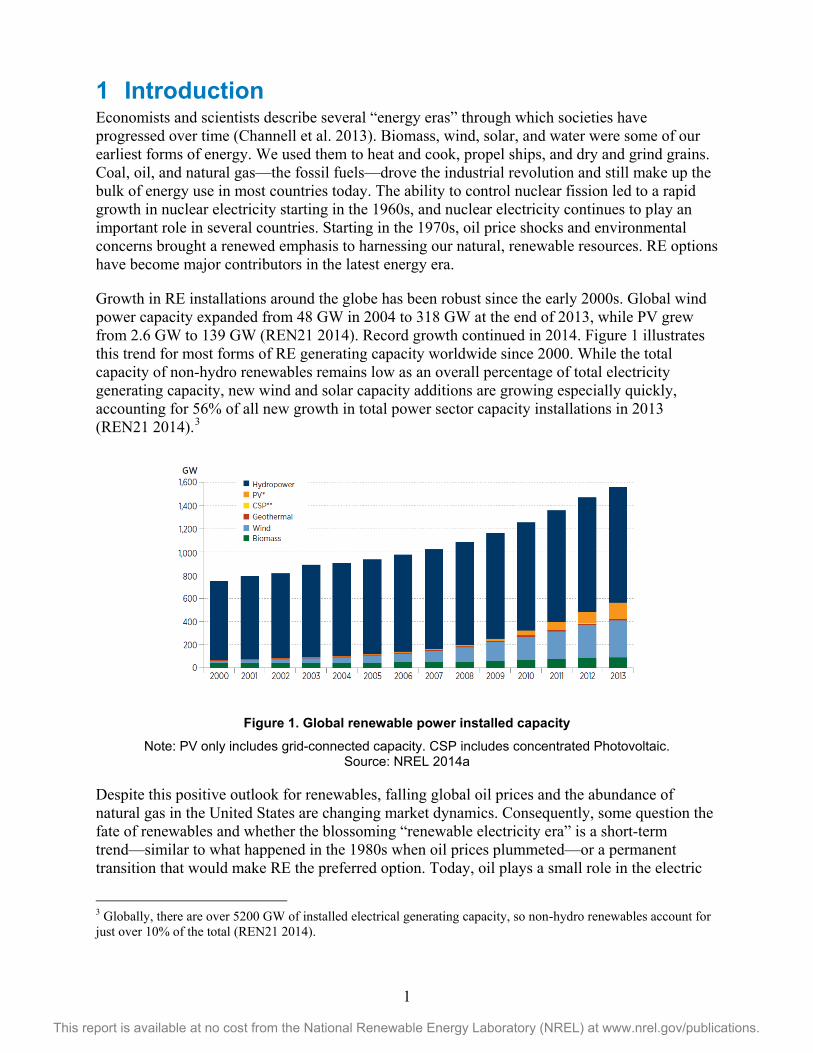
Growth in RE installations around the globe has been robust since the early 2000s. Global wind power capacity expanded from 48 GW in 2004 to 318 GW at the end of 2013, while PV grew from 2.6 GW to 139 GW (REN21 2014). Record growth continued in 2014. Figure 1 illustrates this trend for most forms of RE generating capacity worldwide since 2000. While the total capacity of non-hydro renewables remains low as an overall percentage of total electricity generating capacity, new wind and solar capacity additions are growing especially quickly, accounting for 56% of all new growth in total power sector capacity installations in 2013 (REN21 2014).3
Figure 1. Global renewable power installed capacity Note: PV only includes grid-connected capacity. CSP includes concentrated Photovoltaic.
Source: NREL 2014a
Despite this positive outlook for renewables, falling global oil prices and the abundance of natural gas in the United States are changing market dynamics. Consequently, some question the fate of renewables and whether the blossoming “renewable electricity era” is a short-term trend—similar to what happened in the 1980s when oil prices plummeted—or a permanent transition that would make RE the preferred option. Today, oil plays a small role in the electric
3 Globally, there are over 5200 GW of installed electrical generating capacity, so non-hydro renewables account for just over 10% of the total (REN21 2014).
2
This report is available at no cost from the National Renewable Energy Laboratory (NREL) at www.nrel.gov/publications.
power sectors of most countries; however, natural gas prices are sometimes indexed on oil and low natural gas prices make it more challenging for renewables to be cost competitive. However, natural gas is sometimes considered a complement to renewable sources of generation rather than a competitor.4
This brief report does not pursue a detailed analysis of how changing market dynamics such as falling oil prices or natural gas abundance will impact the market for renewables. Rather, the focus is on examining recent RE cost reduction trends and technology improvements, providing insights into the potential role of RE in the coming decade.
1.1 Historical Background RE options including wind, biomass, hydro, and solar were the first forms of energy that humans exploited, and they remain important in many countries. Hydropower has played perhaps the most import role among renewable options since 1900 and was especially notable in helping countries bring electricity to the masses (Kellert 1997). In China, for example, small hydropower brought energy access to some 300 million rural residents and enabled notable rural development (IPCC 2011; Li et al. 2015). Today, however, wind and solar are driving transformation in many countries, while geothermal, biomass, and hydropower make key contributions in others.
For much of the 20th century, electricity markets across the globe were fairly predictable, even if they grew rapidly.5 Vertically integrated utilities—sometimes owned by the state—had natural monopolies to generate, transmit, and distribute electricity from large, centralized generating stations to end users. Many industrialized countries gradually shifted from a heavy reliance on hydropower to coal, oil, nuclear, and natural gas. But the oil price and availability shocks of the 1970s and growing concerns about environmental impacts associated with fossil fuel use and nuclear accidents, especially, added at least some pressure for change. Many industrialized countries also began to experiment with market reforms and restructuring of electricity markets to introduce competition in generation and distribution. Technologies evolved, starting with the gas turbine, and put new pressure on business models to change. Niche markets for “green” power emerged and have grown into serious competitors with traditional sources, initially in northern Europe, California, Hawaii, and island nations, where imported petroleum is prohibitively expensive.
In the mid-2000s, when oil and natural gas prices were both high and volatile, RE began to hit its stride in many countries. Wind, especially, grew rapidly in both developed and developing countries. By 2010, prices for PV were in steep decline, leading to very strong growth in many regions of the world. Still, coal, natural gas, and nuclear continued to grow strongly in at least a few select nations. On top of this, the North American shale revolution began transforming the outlook for natural gas (and oil) in that region and beyond. Perhaps surprisingly, the emergence of abundant, relatively low-cost natural gas has not to date slowed renewable power growth. Finally, ever-growing concerns about climate change are leading to new costs or investment risks for carbon-intensive generating fuels and further incentivizing low-carbon options.
4 See Lee et al. 2012 and Cochran et al. 2014 for more background on the complementary nature of natural gas and renewables. 5 For more background on the history of the electricity sector and current challenges, see, for example Eurolectric 2013; Smil 2010.
3
This report is available at no cost from the National Renewable Energy Laboratory (NREL) at www.nrel.gov/publications.
One thing is now clear: the once staid electric utility industry is now undergoing considerable change in Europe, the United States, and other regions of the world, with renewable generation uptake, traditional business models, systems operations, and long-term planning changing as never before.
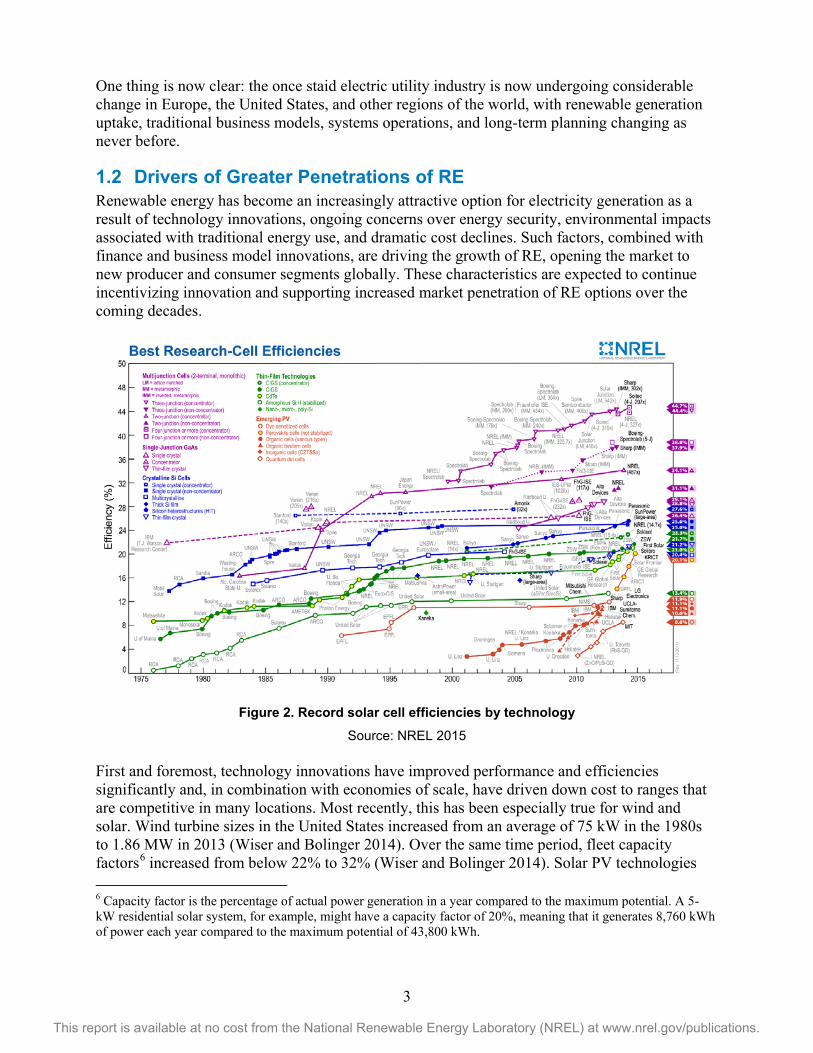
1.2 Drivers of Greater Penetrations of RE Renewable energy has become an increasingly attractive option for electricity generation as a result of technology innovations, ongoing concerns over energy security, environmental impacts associated with traditional energy use, and dramatic cost declines. Such factors, combined with finance and business model innovations, are driving the growth of RE, opening the market to new producer and consumer segments globally. These characteristics are expected to continue incentivizing innovation and supporting increased market penetration of RE options over the coming decades.
Figure 2. Record solar cell efficiencies by technology
Source: NREL 2015 First and foremost, technology innovations have improved performance and efficiencies significantly and, in combination with economies of scale, have driven down cost to ranges that are competitive in many locations. Most recently, this has been especially true for wind and solar. Wind turbine sizes in the United States increased from an average of 75 kW in the 1980s to 1.86 MW in 2013 (Wiser and Bolinger 2014). Over the same time period, fleet capacity factors6 increased from below 22% to 32% (Wiser and Bolinger 2014). Solar PV technologies 6 Capacity factor is the percentage of actual power generation in a year compared to the maximum potential. A 5-kW residential solar system, for example, might have a capacity factor of 20%, meaning that it generates 8,760 kWh of power each year compared to the maximum potential of 43,800 kWh.
4
This report is available at no cost from the National Renewable Energy Laboratory (NREL) at www.nrel.gov/publications.
also improved significantly, leading solar power to be one of the fastest growing energy sources globally. Record cell efficiencies for crystalline silicon (the largest market share PV technology) improved from about 16% in 1980 to 25% in 2014 (see Figure 2).
The technically- and scale-driven cost improvements have led to more economically attractive investment options, opening the market to new producer and consumer segments, and more generally making RE more cost competitive with fossil fuels. In the face of rising electricity prices and volatile fuel prices creating uncertainties for conventional generating facilities, the value proposition for adopting renewables is increasingly grounded economically as well as environmentally.
For example, the LCOE of solar PV dropped by 50% between 2010 and 2014, which has made it increasingly competitive at the utility scale (IRENA 2015). Total installed costs of utility-scale PV fell by 29% to 65% (depending on location) in that same time period, resulting in electricity prices of US$0.08 per kWh (without financial incentives) for the most competitive utility-scale projects (see Section 2 for more detail). While LCOE is only one metric used for investment decisions that must account for resource diversification, regulation and policy goals, as well as market design and dispatch decisions, the comparative cost of electricity generated from new fossil fuel power plants typically ranges from US$0.045 to US$0.14 per kWh (without incentives). As the least cost source of electricity available today, onshore wind LCOEs fall either within the range or lower than for fossil fuels, where the most competitive wind projects globally deliver electricity for roughly US$0.05/kWh without financial incentives (IRENA 2015; see Section 2 for more detail).7
As renewable technologies become economically competitive at both distributed and utility scales and market structures mature, rapid year-on-year growth of RE deployment unfolds (IRENA 2014). Rapid deployment coupled with high learning rates8 for some of these technologies has engendered a cycle that is expected to continue driving down costs, making renewable power generation increasingly competitive with fossil fuels even without financial support (IRENA 2015).
Furthermore, energy security concerns and the historical impacts of oil and natural gas price swings have increasingly focused attention on renewables. Investment in more RE can help establish diverse and stable generation portfolios because the risk profile of RE is different but complementary to some conventional generation technologies (Lee et al. 2012). RE technologies, with the exception of biomass power, have very low fuel and maintenance expenses and thus they have predictable long-term costs. These traits complement fossil power generation options, which tend to have lower upfront capital but higher (and volatile) operational costs due to uncertain fossil fuel prices. Often, these costs (and their inherent uncertainties) are passed through to the end-user.
While some commentators have declared traditional natural gas price volatility a thing of the past in North America due to the shale gas revolution, gas prices continue to experience notable seasonal and regional fluctuation (Spence 2012; Khan 2014). Prices are lower and perhaps less
7 Some of the best resource sites, particularly for onshore wind, may lead to even lower LCOEs. 8 Learning rates refer to the reduction in costs with increasing deployment of a technology.
5
This report is available at no cost from the National Renewable Energy Laboratory (NREL) at www.nrel.gov/publications.
volatile than in the past; however, gas prices are still unstable and unpredictable. Furthermore, environmental policy and regulation could impose additional costs on exploiting such resources, which leaves producers with an additional source of uncertainty. Because renewables generally have zero fuel costs and thus little to no uncertainty associated with operating costs, diversified energy portfolios comprised of both renewables and conventional generation help minimize the risk associated with generation cost escalation (Lee et al. 2012).
From an environmental standpoint, renewables offer GHG and conventional air pollution emission reduction and lower water resource needs. Renewables have been a primary tool for reducing GHG emissions from the power sector over the long-term, and are integral to some countries’ efforts to clean up other air pollution as well (see NREL 2012a, for example).
As power systems continue to evolve, increasing RE generation has the potential to substantially reduce CO2 emissions. The reduction becomes even more significant if RE generation displaces coal instead of natural gas. For example, IPCC (2011) and Cochran et al. (2014) summarize a wide variety of global simulations with very high levels of RE penetration; emissions of carbon dioxide are generally inversely related to RE penetration. If concerns about the negative impacts of climate change increase over the coming decades, RE options will likely become increasingly attractive low-carbon energy alternatives.
Furthermore, increasing RE can reduce water withdrawals and consumption, which is particularly relevant in water-constrained regions. For example, in 2000, electricity generation accounted for about 50% of total United States water withdrawals from lakes or rivers; and, although most of the water is recycled, about 9% of the water is consumed, which is the equivalent of about 68 billion liters of water usage per day (DOE 2008). Electricity generation from thermal sources, including nuclear, natural gas and coal, is significantly more water-intensive. Increasing renewable penetration in the United States to 80% by 2050 could result in a 50% reduction in water consumption from electricity generation (NREL 2012a). Although some RE generation consumes water—i.e., bio-power and concentrating solar power for cleaning and the power generation cycle— further investment in solar PV and wind generation has the potential to substantially reduce future water usage. This is particularly beneficial for dry and arid regions such as the Middle East, northern China and the southwestern area of the United States, where water shortages are already a major concern (see Section 6 for international case studies).
1.3 Challenges of Greater Penetrations of RE Although RE, particularly variable wind and solar PV, faces challenges related to integration within existing power systems, such challenges have been less onerous than originally estimated. Wind and solar electricity have variable output, which increases the difficulty of operating the real time power system as their penetration increases. However, the historical record suggests that these are not fundamental limitations. System operators have dealt with variability since the early days of the power grid and implemented solutions so that lights turn on when needed, air conditioners run when it’s hot, and we have warm water as needed. Generation sources such as steam turbines can respond to changes in power demand. In other words, they are dispatchable. The introduction of variable generators has driven the need for changes in system operation procedures, advances in forecasting of clouds and wind, and further advances in enabling demand to respond dynamically to power system needs and price signals (see Section 5 for more details).
6
This report is available at no cost from the National Renewable Energy Laboratory (NREL) at www.nrel.gov/publications.
Whether on land, sea, or on top of a building, siting for renewable power systems is subject to “the eye of the beholder.” Wind turbines can visually impact a landscape. Solar panels can change the look of a house or building. In some cases, the addition of solar or wind has led to value enhancements for the property owner (Hoen et al. 2013; Hoen 2012), but other situations have highlighted concern for aesthetics or other impacts such as wildlife. Research over the past decades has highlighted avian, radar, and property valuation issues and shown that active and early community engagement is key to successful project development and balancing stakeholder concerns (Devine-Wright and Howes 2010).
Another limitation to widespread RE deployment is related to high upfront capital costs and the need in some markets for incentives that impact public spending. However, as highlighted in this report, market developments since 2004 are rapidly improving system economics at all scales. Continued improvements in cost-competitiveness are expected to lead to renewables accounting for 69% to 74% of new power capacity added worldwide by 2030 (BNEF 2013). As RE technologies have improved and new business models have developed, countries around the globe have been diversifying their electric generation portfolios and markets for cleaner, renewable resources have continued to expand. Additionally, as we have seen in many regions around the world, some renewable technologies are already competitive with conventional energy sources even without government incentives (IRENA 2012).
This report is organized as follows. Section 2 evaluates the current and future cost estimates for RE options and compares them with conventional options in three distinct regions of the world. Section 3 explores innovations driving the substantial growth in RE over the past two decades and how these innovations could change through 2025. Section 4 outlines environmental drivers (GHG and water attributes especially) that add further weight to the growing benefits of RE Section 5 discusses some of the best practices followed in integrating variable RE into the grid. Finally, Section 6 presents case studies for the United States and China exploring recent RE trends in two countries with contrasting market dynamics.
7
This report is available at no cost from the National Renewable Energy Laboratory (NREL) at www.nrel.gov/publications.
2 Economic Competitiveness: Moving Beyond Incentive Reliance
One popularized myth about RE is that it is simply too expensive. This section aims to demystify that myth. While there is often little disagreement about the environmental benefits of various renewable technologies, there is less agreement about whether renewable technology is economically efficient. RE may have been too expensive in the past; however, with innovations in RE technology and cost improvements since 2004, RE options are becoming competitive with conventional electricity in many regions throughout the world.
2.1 LCOE: Recent Improvements and a Focus on Wind and Solar PV The metric most commonly used to characterize economic “competitiveness” between renewables and other traditional forms of electricity generation is levelized cost of electricity (LCOE).9 The LCOEs of leading technologies such as solar PV, wind, and others have been declining with reduced capital costs, economies of scale, improved capacity factors, and increased technology efficiency (REN21 2014; Feldman et al. 2014; Wiser and Bolinger 2014). Leading the accelerated renewables market growth is utility-scale solar PV and wind energy – the LCOEs of PV and wind have fallen most significantly, by more than 50% since 2009 (Lazard 2014; IRENA 2015).
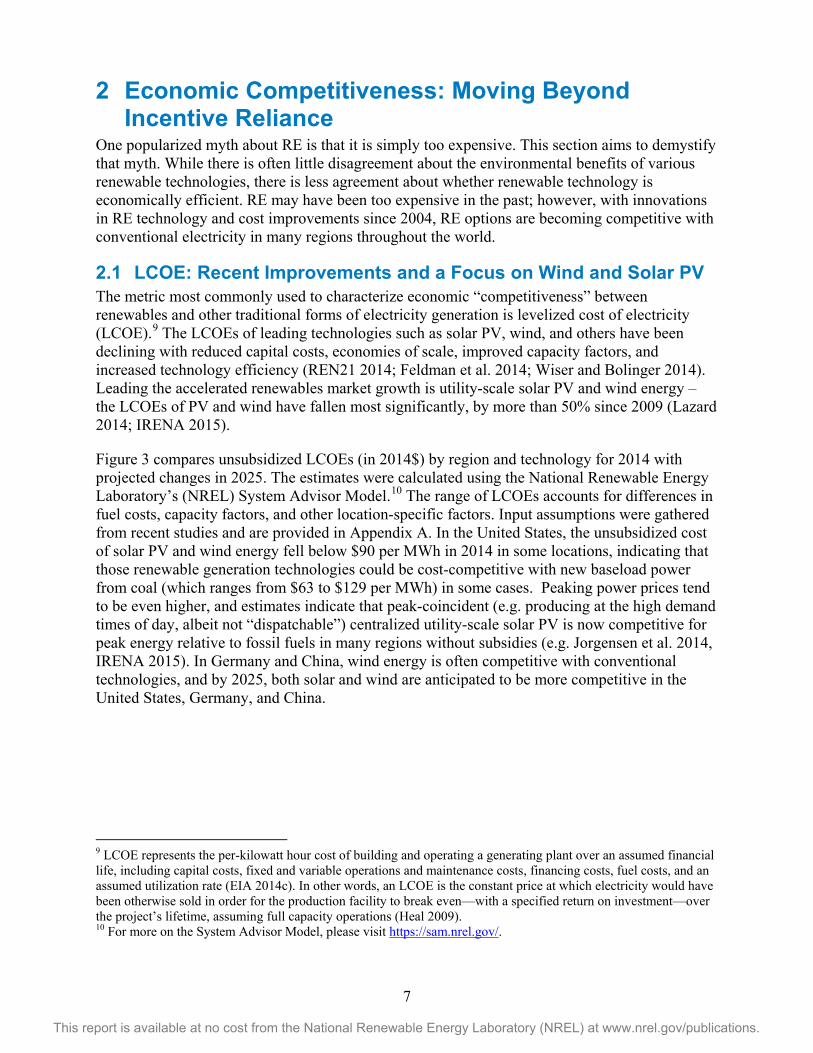
Figure 3 compares unsubsidized LCOEs (in 2014$) by region and technology for 2014 with projected changes in 2025. The estimates were calculated using the National Renewable Energy Laboratory’s (NREL) System Advisor Model.10 The range of LCOEs accounts for differences in fuel costs, capacity factors, and other location-specific factors. Input assumptions were gathered from recent studies and are provided in Appendix A. In the United States, the unsubsidized cost of solar PV and wind energy fell below $90 per MWh in 2014 in some locations, indicating that those renewable generation technologies could be cost-competitive with new baseload power from coal (which ranges from $63 to $129 per MWh) in some cases. Peaking power prices tend to be even higher, and estimates indicate that peak-coincident (e.g. producing at the high demand times of day, albeit not “dispatchable”) centralized utility-scale solar PV is now competitive for peak energy relative to fossil fuels in many regions without subsidies (e.g. Jorgensen et al. 2014, IRENA 2015). In Germany and China, wind energy is often competitive with conventional technologies, and by 2025, both solar and wind are anticipated to be more competitive in the United States, Germany, and China.
9 LCOE represents the per-kilowatt hour cost of building and operating a generating plant over an assumed financial life, including capital costs, fixed and variable operations and maintenance costs, financing costs, fuel costs, and an assumed utilization rate (EIA 2014c). In other words, an LCOE is the constant price at which electricity would have been otherwise sold in order for the production facility to break even—with a specified return on investment—over the project’s lifetime, assuming full capacity operations (Heal 2009). 10 For more on the System Advisor Model, please visit https://sam.nrel.gov/.
8
This report is available at no cost from the National Renewable Energy Laboratory (NREL) at www.nrel.gov/publications.
Figure 3. Unsubsidized LCOE ranges (2014$) calculated for the United States, Germany, and China for 2014 and 2025
Source: Natural gas and coal prices from EIA 2014a; Quandl 2014; BNEF 2014a; BNEF 2014b. Capital costs from NREL 2015; BNEF 2014b; Lazard 2014; REN21 2014; IEA 2013; Philibert et al. 2014;
Feldman et al. 2014; TCDB 2014; EIA 2013; EIA 2014c; Mai et al. 2014; Fraunhofer 2013. See Appendix A for all input assumptions.
A key driver of RE attractiveness is the absence of fuel price risk. Renewables such as solar and wind generation technologies have zero fuel costs and relatively small variable operation and maintenance (O&M) costs, so their LCOEs are roughly proportionate to estimated capital costs and the cost of financing. However, LCOEs for technologies with high fuel costs are determined by both fuel cost and capital costs, which not only impose additional costs but also an additional uncertainty regarding fuel prices—particularly on a multi-decadal basis reflective of the technology’s economic and operational life. Electricity generation from fossil fuels is more vulnerable to fuel price volatility. This not only impacts revenue streams for investors but also electricity prices faced by ratepayers because fuel price increases (or decreases) can be passed through to customers.
9
This report is available at no cost from the National Renewable Energy Laboratory (NREL) at www.nrel.gov/publications.
The costs of integrating these variable sources of RE into the grid so that the grid operate reliably are not included in these estimates. Estimating the causality and magnitude of these costs is complicated and regionally specific. An increasing number of integration cost studies are available, especially in the United States and Europe. Integration studies strive to economically account for the unique characteristics of variable RE generation such as lower average and decreasing marginal capacity value for wind and the high correlation of solar production profile with peak demand, as well as many other power system requirements. However, the methods for calculating integration costs are still evolving and not consistent across studies, which creates difficulties when comparing integration costs across technologies (Milligan et al. 2011). In general, integration costs are considered modest (less than $5 per MWh) at renewable penetration levels below 20% or 30%, although actual costs are system-specific and dependent on the existing level of variable renewable generators in the system (IPCC 2011, Porter et al. 2013).
Also not included in these LCOE comparisons are the external environmental costs, which are often far higher for conventional technologies than for renewable options due to the large amounts of GHG emissions produced from fossil fuels (see Section 4.1 for more detail on the GHG-intensity of electricity technologies). These costs to the environment are difficult to calculate due to uncertainties. However, including external environmental costs in the LCOE may significantly increase the cost competitiveness of renewables. For example, the United States government estimates that the social cost of carbon (SCC)11 ranges from $12 per ton of carbon to $116 in 2015, depending on the discount rate used. The SCC is expected to increase to a range from $22 to $204 per ton by 2040 (Interagency Working Group on Social Cost of Carbon 2013).
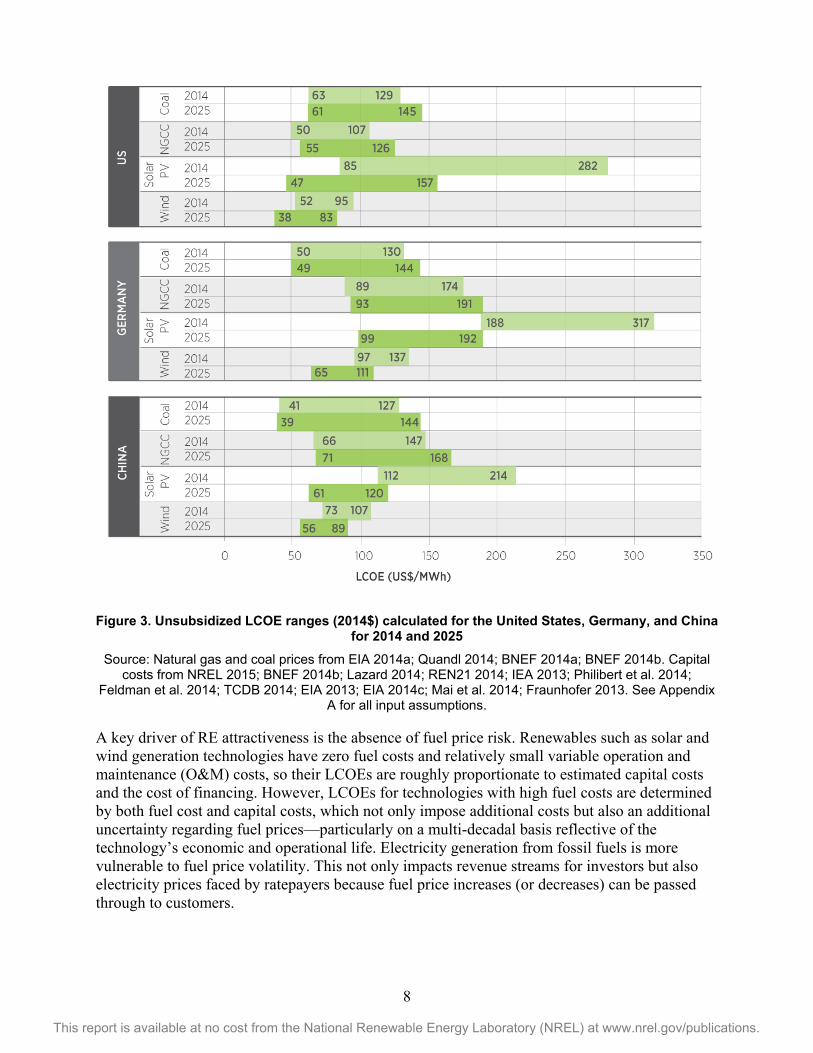
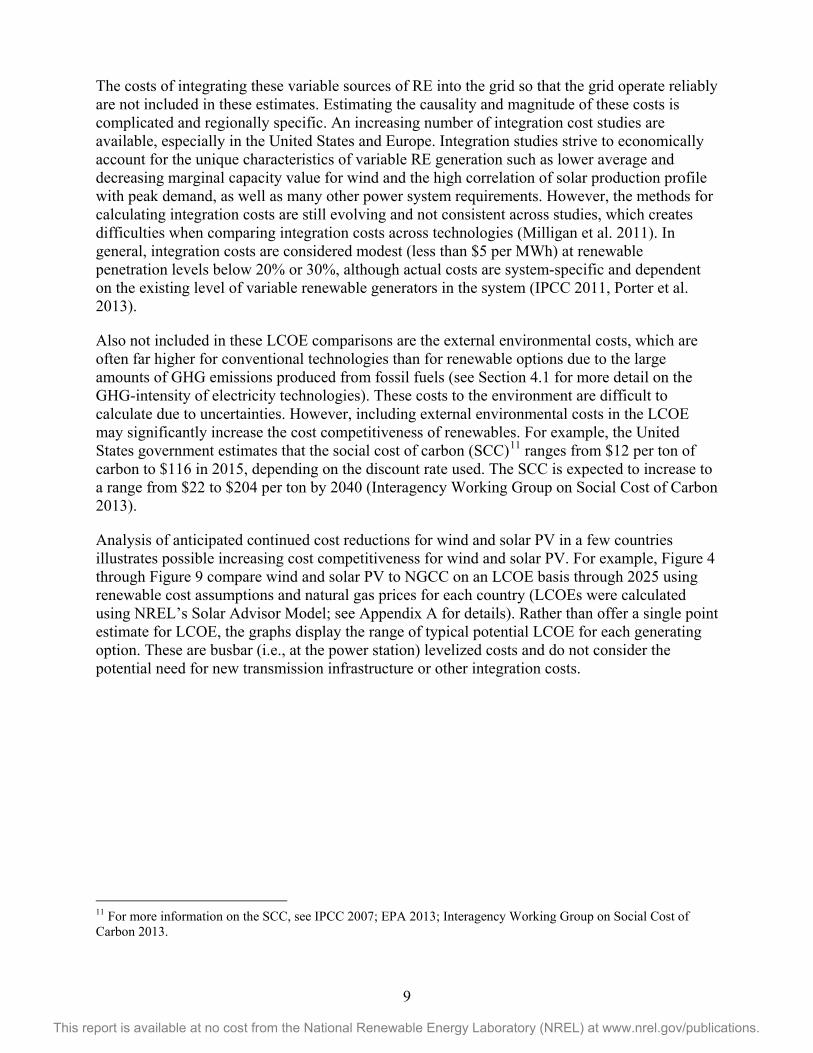
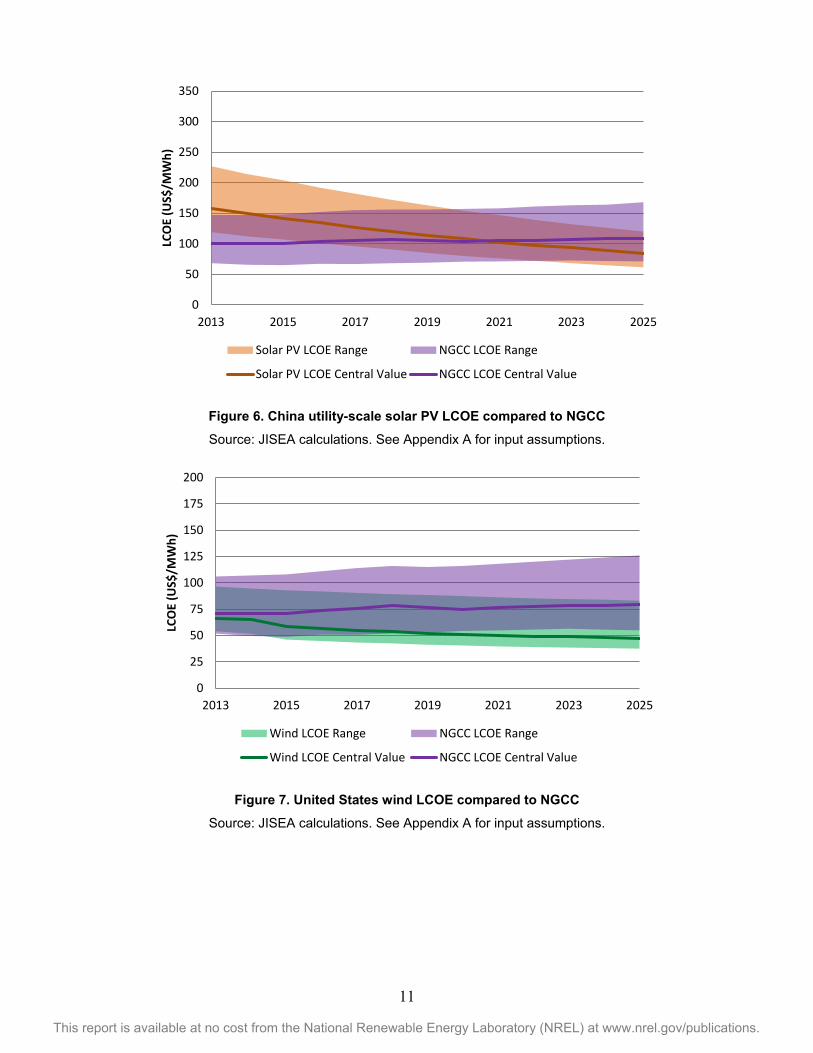
Analysis of anticipated continued cost reductions for wind and solar PV in a few countries illustrates possible increasing cost competitiveness for wind and solar PV. For example, Figure 4 through Figure 9 compare wind and solar PV to NGCC on an LCOE basis through 2025 using renewable cost assumptions and natural gas prices for each country (LCOEs were calculated using NREL’s Solar Advisor Model; see Appendix A for details). Rather than offer a single point estimate for LCOE, the graphs display the range of typical potential LCOE for each generating option. These are busbar (i.e., at the power station) levelized costs and do not consider the potential need for new transmission infrastructure or other integration costs.
11 For more information on the SCC, see IPCC 2007; EPA 2013; Interagency Working Group on Social Cost of Carbon 2013.

10
This report is available at no cost from the National Renewable Energy Laboratory (NREL) at www.nrel.gov/publications.
Figure 4. United States utility-scale solar PV LCOE compared to NGCC
Source: JISEA calculations. See Appendix A for input assumptions.
Figure 5. Germany utility-scale solar PV LCOE compared to NGCC
Source: JISEA calculations. See Appendix A for input assumptions.
0
50
100
150
200
250
300
350
2013 2015 2017 2019 2021 2023 2025
LCO
E (U
S$/M
Wh)
Solar PV LCOE Range NGCC LCOE Range
Solar PV LCOE Central Value NGCC LCOE Central Value
0
50
100
150
200
250
300
350
2013 2015 2017 2019 2021 2023 2025
LCO
E (U
S$/M
Wh)
Solar PV LCOE Range NGCC LCOE Range
Solar PV LCOE Central Value NGCC LCOE Central Value
11
This report is available at no cost from the National Renewable Energy Laboratory (NREL) at www.nrel.gov/publications.
Figure 6. China utility-scale solar PV LCOE compared to NGCC
Source: JISEA calculations. See Appendix A for input assumptions.
Figure 7. United States wind LCOE compared to NGCC
Source: JISEA calculations. See Appendix A for input assumptions.
0
50
100
150
200
250
300
350
2013 2015 2017 2019 2021 2023 2025
LCO
E (U
S$/M
Wh)
Solar PV LCOE Range NGCC LCOE Range
Solar PV LCOE Central Value NGCC LCOE Central Value
0
25
50
75
100
125
150
175
200
2013 2015 2017 2019 2021 2023 2025
LCO
E (U
S$/M
Wh)
Wind LCOE Range NGCC LCOE Range
Wind LCOE Central Value NGCC LCOE Central Value

12
This report is available at no cost from the National Renewable Energy Laboratory (NREL) at www.nrel.gov/publications.
Figure 8. Germany wind LCOE compared to NGCC
Source: JISEA calculations. See Appendix A for input assumptions.
Figure 9. China wind LCOE compared to NGCC Source: JISEA calculations. See Appendix A for input assumptions
In each case examined, wind and solar bands either already overlap with NGCC LCOE ranges or the RE technologies become competitive before 2025.
Going forward, RE is expected to be less reliant on financial incentives and subsidies given increasing cost competitiveness within the current economic structures. At the same time, a
0
25
50
75
100
125
150
175
200
2013 2015 2017 2019 2021 2023 2025
LCO
E (U
S$/M
Wh)
Wind LCOE Range NGCC LCOE Range
Wind LCOE Central Value NGCC LCOE Central Value
0
25
50
75
100
125
150
175
200
2013 2015 2017 2019 2021 2023 2025
LCO
E (U
S$/M
Wh)
Wind LCOE Range NGCC LCOE Range
Wind LCOE Central Value NGCC LCOE Central Value
13
This report is available at no cost from the National Renewable Energy Laboratory (NREL) at www.nrel.gov/publications.
subsidy-free world does not mean policy-free. Future policies may focus more on enabling integration and market design (such as one that values flexibility), and operational advances.
The use of LCOE alone for evaluating economic competitiveness can be misleading because it does not consider costs and risks of conventional technologies, such as fuel price volatility and environmental externalities, or the value of risk hedging more generally. These factors make renewables even more cost-competitive, if not the least-cost option, in many situations. On the other hand, accounting for integration costs for variable RE, including capacity value and transmission infrastructure needs, while moderate, allows for more complete economic comparisons.
2.2 Looking Beyond LCOE Electricity capacity expansion planning and policymaking has traditionally relied upon least-cost analyses. But when considering the broader energy landscape, investment decision-making generally goes beyond a simple least-cost analysis because numerous factors and risks offer additional value propositions, particularly in energy markets. More sophisticated energy planning and investment decision-making applies portfolio optimization techniques as investors and policymakers seek to balance costs, reliability, and risks in order to maximize prospective returns on investment and to meet reliability objectives (Bachrach et al. 2003; Gross et al. 2007).12 While costs are certainly relevant, risks and prospective investment returns are also critical components, and they are particularly relevant for RE technology options.
In the case of electricity generation, risks directly affecting project economics include fuel supply, demand and price changes, a price on carbon, electricity price changes, construction and capital costs, operating and maintenance costs, and decommissioning and waste (Lee et al. 2012). A price on carbon could pose a significant risk to electricity generation, particularly conventional technologies, due to the large amount of GHG emissions from burning fossil fuels (see Section 4.1 for more detail on the GHG-intensity of electricity technologies). Other risks that affect the economics of electricity generation include contract structure, credit, and the weighted cost of capital risks (Blyth 2006).
RE, particularly wind and solar, is often capital-intensive and requires significant upfront investments, but RE has low operational costs. Cost profiles are generally fixed over time, and RE has no fuel price risk. Further, analysis indicates that wind is primarily a fuel saver that can add significant economic value (See Lew et al. 2011, and Lew et al. 2013) while the economic value of solar depends on penetration levels, peak coincidence and many other factors (Jorgensen et al. 2014). These characteristics add value to RE use but are not captured in standard LCOE calculations13 (Awerbuch 2000; Bolinger et al. 2004; Bush et al. 2012; Jenkin et al. 2013).
Lastly, revenue streams, which are not captured in LCOE estimates, are critical to profit-maximizing entities. Electricity price fluctuations present risks to net revenue and determine
12 Ultimately, energy expansion planning and investment optimization seeks to minimize risk and provide certainty, reducing the variance of expected future costs and portfolio risk. For more detail, see Awerbuch 2004; Bush et al. 2012; Jenkin et al. 2013. 13 Adding fixed cost renewables to a fossil energy portfolio increases the value of a portfolio of assets by offsetting (hedging) fossil fuel price risk.
14
This report is available at no cost from the National Renewable Energy Laboratory (NREL) at www.nrel.gov/publications.
returns on investment (Gross et al. 2009; Roques et al. 2006; Bush et al. 2012; Jenkin et al. 2013). The level of exposure to these prices varies among technologies; typically, RE generators enter into long-term contracts that provide a large degree of price certainty (although there is still some revenue uncertainty due to year-to-year variations in output). In contrast, merchant natural gas generators only sell power when they can operate profitably and often sell only into higher-priced hours, such sale volumes can be volatile which in turn can affect profitability. Even in cases in which both are merchant generators, adding RE to a generation portfolio may reduce some risks to cash flows and profitability. These effects are important to consider while evaluating investment options and relative value of renewable (or other) generating options.
15
This report is available at no cost from the National Renewable Energy Laboratory (NREL) at www.nrel.gov/publications.
3 Assessing Technology Trends This section highlights key trends in technologies that have improved the course of select RE options, and describes how additional advances or breakthroughs could occur over the next decade. Although a detailed description of each renewable technology is beyond the scope of this study, this section defines the technologies when necessary; for more detail on RE technologies, see references in Appendix B. Most of the improvements in technology since the 1980s have been evolutionary in nature, rather than revolutionary, meaning they have occurred in a gradual, albeit rapid, step-by-step fashion. Revolutionary breakthroughs still have the potential to occur both in generation technologies themselves and associated technologies like storage.
3.1 Wind Energy Humans have exploited wind energy for thousands of years, but the modern era of the wind power plant truly emerged beginning in the early 2000s (Logan and Kaplan 2008). Technological advances have allowed wind turbines to grow in size and complexity and generate electricity at a declining cost.
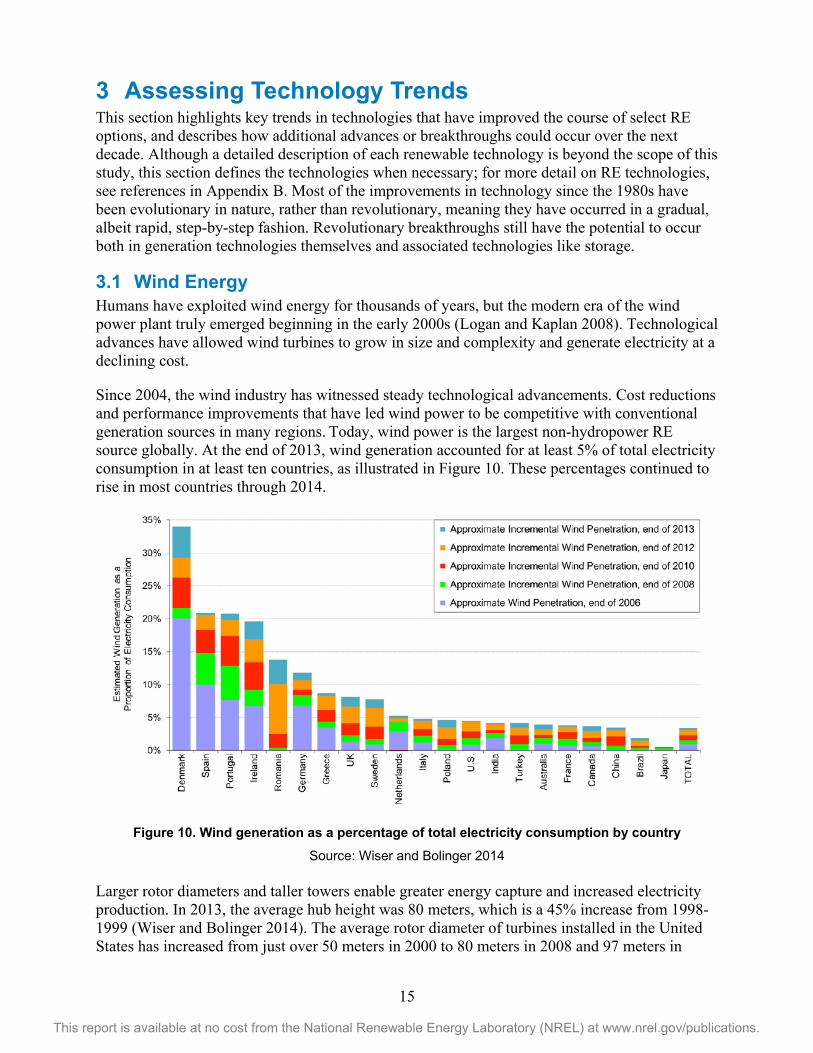
Since 2004, the wind industry has witnessed steady technological advancements. Cost reductions and performance improvements that have led wind power to be competitive with conventional generation sources in many regions. Today, wind power is the largest non-hydropower RE source globally. At the end of 2013, wind generation accounted for at least 5% of total electricity consumption in at least ten countries, as illustrated in Figure 10. These percentages continued to rise in most countries through 2014.
Figure 10. Wind generation as a percentage of total electricity consumption by country
Source: Wiser and Bolinger 2014 Larger rotor diameters and taller towers enable greater energy capture and increased electricity production. In 2013, the average hub height was 80 meters, which is a 45% increase from 1998-1999 (Wiser and Bolinger 2014). The average rotor diameter of turbines installed in the United States has increased from just over 50 meters in 2000 to 80 meters in 2008 and 97 meters in
16
This report is available at no cost from the National Renewable Energy Laboratory (NREL) at www.nrel.gov/publications.
2013. In 2014, 80% of turbines had a rotor diameter of at least 100 meters. Furthermore, in 2014, the average turbine size was just under 2 MW (AWEA 2015). For land-based wind power plants, larger turbines allow plants to tap wind resources at lower wind speed sites in a cost-effective manner. Tapping lower-quality wind sites opens up much larger resource areas that were previously not cost-effective. Even though more turbines are being installed in lower-quality wind resource sites, larger turbine designs are increasing capacity factors for plants located within a given wind resource class (Wiser and Bolinger 2014).
Increased blade and nacelle size and weights have raised logistical issues including shipping and transport by rail or truck that currently limit the size of land-based wind turbines in some locations. Many existing roads, bridges, and other transport infrastructure were simply not designed to accommodate increasingly large towers, blades, and nacelles. Modular components and on-site manufacture and assembly could lead to larger wind turbine sizes.14
Although wind generation in the United States is currently based entirely on land-based technology, offshore wind has become prominent in Europe. In 2014, 11 European countries had 74 offshore wind plants with over 8 GW of capacity. In 2014, the largest offshore wind turbine was 8 MW, and the average offshore turbine size was 3.7 MW. This distance of the turbines from the shore has also increased. In 2014, the average distance was 32.9 kilometers, and average water depth of offshore turbines was 22.4 meters (EWEA 2015). Offshore wind installations do not have the same logistical constraints as those on land: they can be manufactured near large shipping ports and the installation vessels can handle bigger equipment. Improvements in design and manufacturing that allow larger wind turbines components are likely to lead to giant 10-MW and 15-MW turbines by 2020, primarily for use in offshore wind power plants. Interest in floating offshore wind energy is growing rapidly worldwide. Floating technology would enable deployment of offshore wind projects in deeper water sites where the wind resource is generally stronger and more abundant but is not accessible with current technology.
Reducing the balance of plant (BOP) costs – everything except the wind turbine and installation costs – has become increasingly important over the last several years because these costs constitute a large portion of the total costs for wind plants. BOP costs account for approximately 35% and 70% of costs for onshore and offshore wind, respectively (Zipp 2012). Increasing turbine size reduces infrastructure requirements and the cost of servicing each turbine. Costs of wind power are expected to decrease by 15-30% compared to levels in 2010 with continued technology improvements, cheaper materials (for towers or floating platforms of offshore wind turbines), and non-magnet generators, which decrease consumption of expensive rare earth minerals (REN21 2013; Lantz et al. 2012).
3.1.1 Wind Technology Developments Larger turbines, longer blades, and taller towers have contributed to wind energy performance improvements and cost reductions over the past three decades (Robichaud 2014). Improved wind forecasting, data gathering, and computation have also led to more efficient operation and integration of wind turbines (Hodge 2013).
14 For more information on the challenges of transporting large wind turbines, see Cotrell et al. 2014.
17
This report is available at no cost from the National Renewable Energy Laboratory (NREL) at www.nrel.gov/publications.
The wind industry has experimented with different blade shapes and materials that have increased wind capacity factors, reduced noise impact, and increased the ease of transporting the blades (Dykes et al. 2014). Although wind turbine blades are predominantly constructed using fiberglass with a balsa core, more advanced materials are being introduced, such as carbon fiber and sophisticated engineered cores. The proportion of labor in the total manufacturing cost continues to decline as automated manufacturing processes are implemented (James and Goodrich 2013).
The dominant drive technology today is the three-stage gearbox with geared doubly fed induction generator that does not use permanent magnets. Variable-speed technology is universally used for utility-scale turbines because variable-speed turbines can extract more energy from low wind speeds and structural loads are reduced at higher wind speeds. Rotor speed is controlled using blade pitch and power electronics to alter the frequency of the generator field. Major manufacturers are marketing direct drive alternatives, which eliminate the need for a gearbox and use neodymium-based magnets (Wiser and Bolinger 2014). Permanent magnet synchronous generators with improved efficiency based on rare-earth materials have begun to be used in conjunction with high-speed gearbox designs as well as direct-drive, gearbox-free turbines.
Advances in manufacturing, computational tools, and controls make larger turbines possible at only modest increases in weight and cost (NREL 2013a). These advances are expected to continue to foster improvements in the ability to integrate wind power output into the grid.
Intelligent Turbine Control Systems Intelligent turbine control systems allow turbines to operate in such a way that structural loads that would be expected to increase with larger rotor size do not (Ela et al. 2014). Computational science and intelligent controls now enable a sophisticated balance between energy capture and structural loads.
Power Plant Control Systems A modern wind power plant can have 200 turbines at 3 MW each, totaling 600 MW of capacity, comparable to a conventional power plant. Near-term advances in voltage control systems and wake reduction in large power plants will help to control ramping up and ramping down and maximize energy output (Churchfield et al. 2014). These large power plants of the future will be designed to react to signals from grid operators, allowing accommodation of increased penetration on the grid.
Design Simulation Tools Steady advances in the accuracy and capability of computer-aided engineering tools have enabled significant advances in wind turbine technology and reliability. This simulation capability leads to improved performance and reduced costs and enables significant innovations to be deployed, such as swept rotor blades and sophisticated wind plant control schemes.
Advanced Sensors The wind industry is also using more remote sensing devices for wind resource assessment, including SODAR and LIDAR (sonic detection and ranging and light detection and ranging, respectively) technologies (IEA Wind 2013). For example, LIDAR—a laser sensor that measures
18
This report is available at no cost from the National Renewable Energy Laboratory (NREL) at www.nrel.gov/publications.
wind resources at different heights—could be used as a cheaper substitute for meteorological (met) towers to characterize wind resources. Accurate, reliable wind characterization is a crucial hurdle to secure financing for projects in most countries. Met towers are expensive, so it is common for wind plants to have only one for the entire project. The use of remote sensing could reduce costs as well as increase performance by measuring the production and loss of each turbine.
Wind turbines could also use “look-ahead” LIDAR, which points forward and signals to the turbine when gusts of wind are approaching instead of pointing up to measure wind in the atmosphere. “Look-ahead” LIDAR allows turbines to respond prior to receiving the wind, which reduces wear on the turbine, enables turbines to operate more smoothly, increases the life of the turbine, and increases the capacity factor. Improvements in information technology, such as the technologies mentioned above, offer significant potential for turbine reliability and lifetime improvements as well as reductions in maintenance costs by measuring the performance of each component.
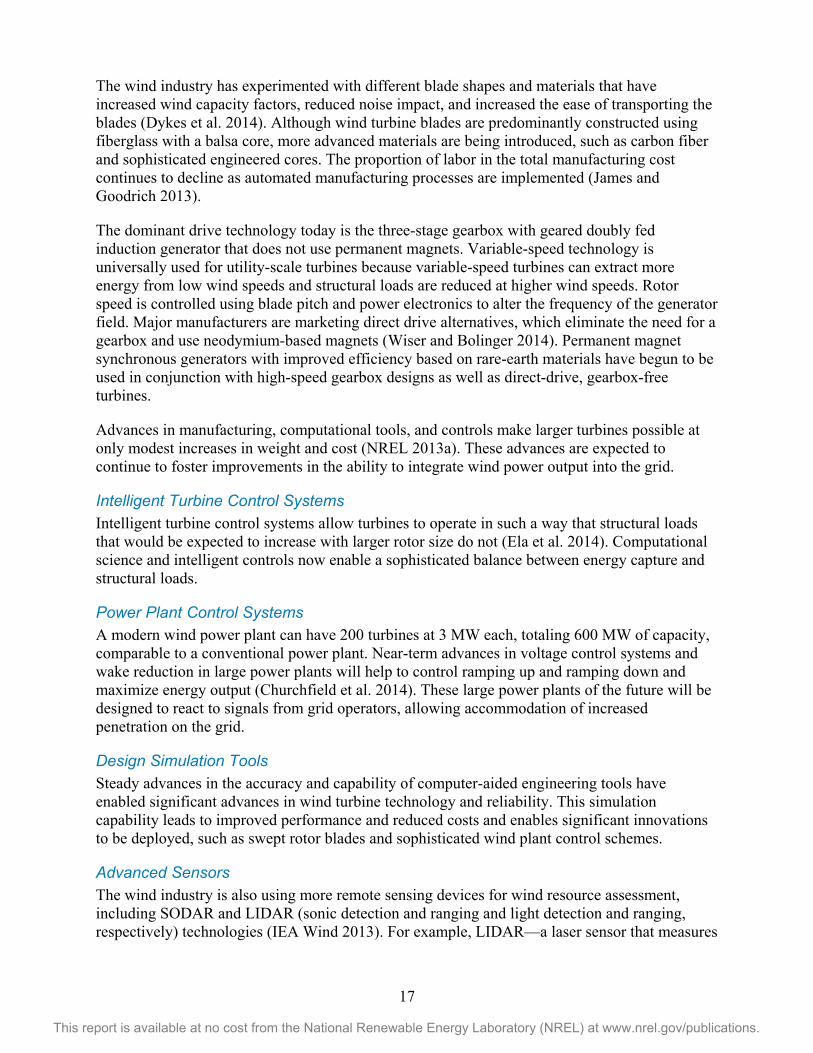
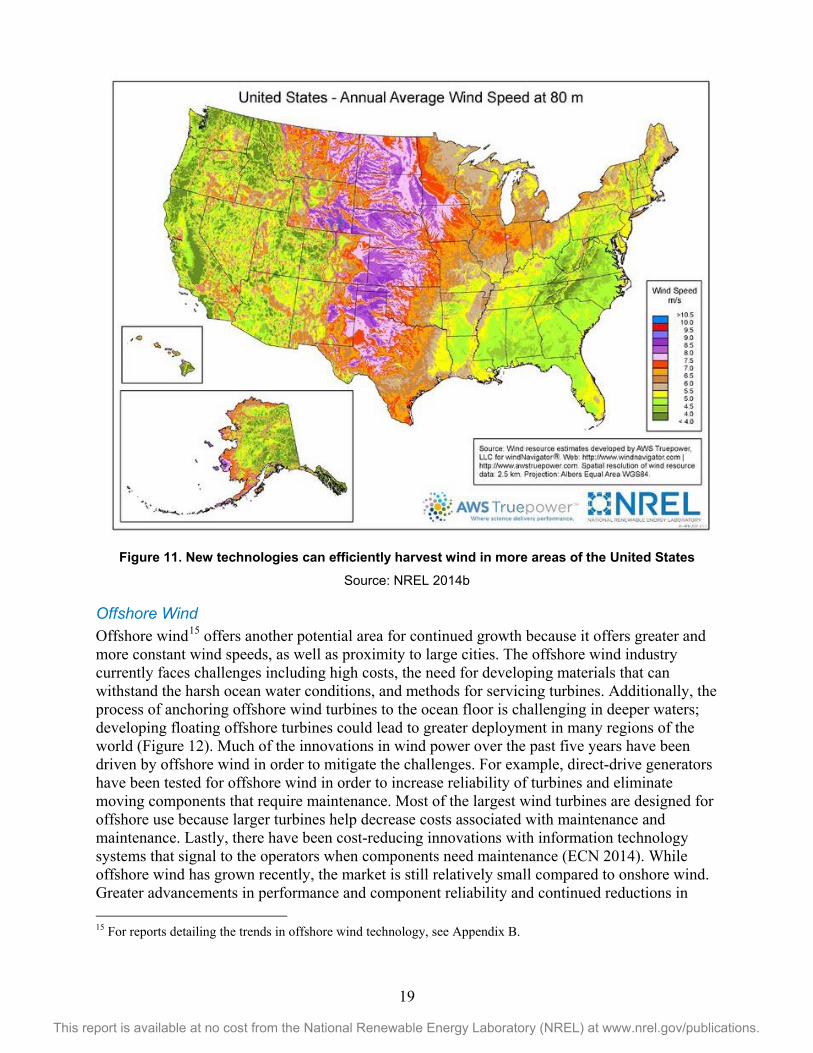
3.1.2 Expanding into Lower Wind Regimes One challenge that has limited the development of wind plants is that the highest-quality wind tends to be far from densely populated cities (Figure 11). Building transmission lines can be expensive and challenging. However, through 2025, there is potential to mitigate this challenge (Cohen et al. 2008). First, developing more integrated grids enables system operators to transmit wind power over a larger area (see Section 5 for more detail). Second, future innovations could enable more wind turbines to be located in low-speed sites (Dykes et al. 2014). This would expand the potential sites to include areas that are closer to large cities and allow for a greater distribution of wind turbines. Some improvements that would help this are larger rotors and bigger blades—which increase the turbines’ capture area—and controls that would rate machines for low-wind sites.
19
This report is available at no cost from the National Renewable Energy Laboratory (NREL) at www.nrel.gov/publications.
Figure 11. New technologies can efficiently harvest wind in more areas of the United States
Source: NREL 2014b
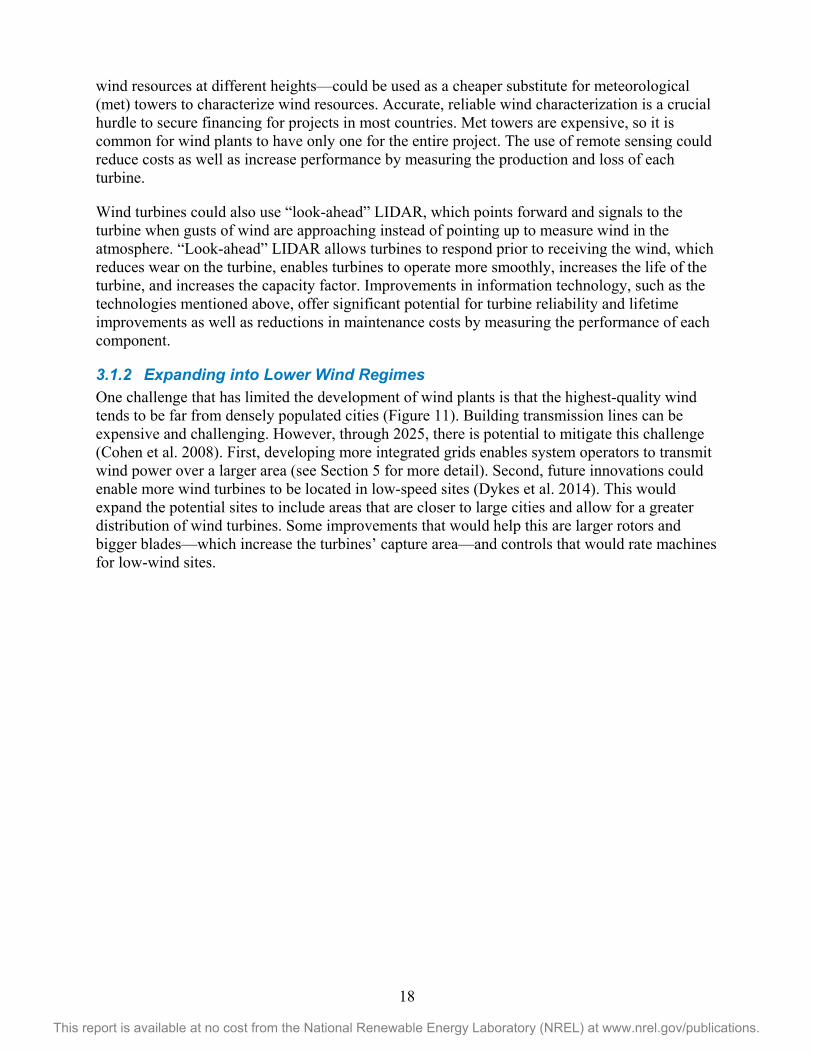
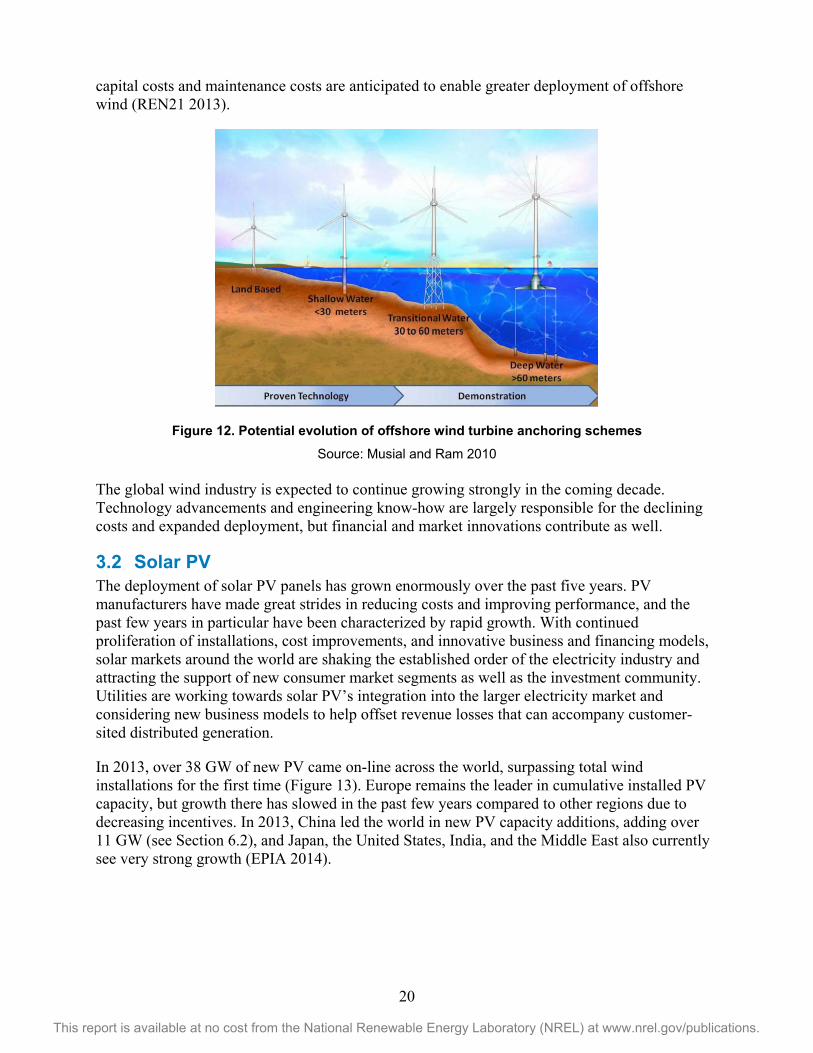
Offshore Wind Offshore wind15 offers another potential area for continued growth because it offers greater and more constant wind speeds, as well as proximity to large cities. The offshore wind industry currently faces challenges including high costs, the need for developing materials that can withstand the harsh ocean water conditions, and methods for servicing turbines. Additionally, the process of anchoring offshore wind turbines to the ocean floor is challenging in deeper waters; developing floating offshore turbines could lead to greater deployment in many regions of the world (Figure 12). Much of the innovations in wind power over the past five years have been driven by offshore wind in order to mitigate the challenges. For example, direct-drive generators have been tested for offshore wind in order to increase reliability of turbines and eliminate moving components that require maintenance. Most of the largest wind turbines are designed for offshore use because larger turbines help decrease costs associated with maintenance and maintenance. Lastly, there have been cost-reducing innovations with information technology systems that signal to the operators when components need maintenance (ECN 2014). While offshore wind has grown recently, the market is still relatively small compared to onshore wind. Greater advancements in performance and component reliability and continued reductions in 15 For reports detailing the trends in offshore wind technology, see Appendix B.
20
This report is available at no cost from the National Renewable Energy Laboratory (NREL) at www.nrel.gov/publications.
capital costs and maintenance costs are anticipated to enable greater deployment of offshore wind (REN21 2013).
Figure 12. Potential evolution of offshore wind turbine anchoring schemes
Source: Musial and Ram 2010 The global wind industry is expected to continue growing strongly in the coming decade. Technology advancements and engineering know-how are largely responsible for the declining costs and expanded deployment, but financial and market innovations contribute as well.
3.2 Solar PV The deployment of solar PV panels has grown enormously over the past five years. PV manufacturers have made great strides in reducing costs and improving performance, and the past few years in particular have been characterized by rapid growth. With continued proliferation of installations, cost improvements, and innovative business and financing models, solar markets around the world are shaking the established order of the electricity industry and attracting the support of new consumer market segments as well as the investment community. Utilities are working towards solar PV’s integration into the larger electricity market and considering new business models to help offset revenue losses that can accompany customer-sited distributed generation.
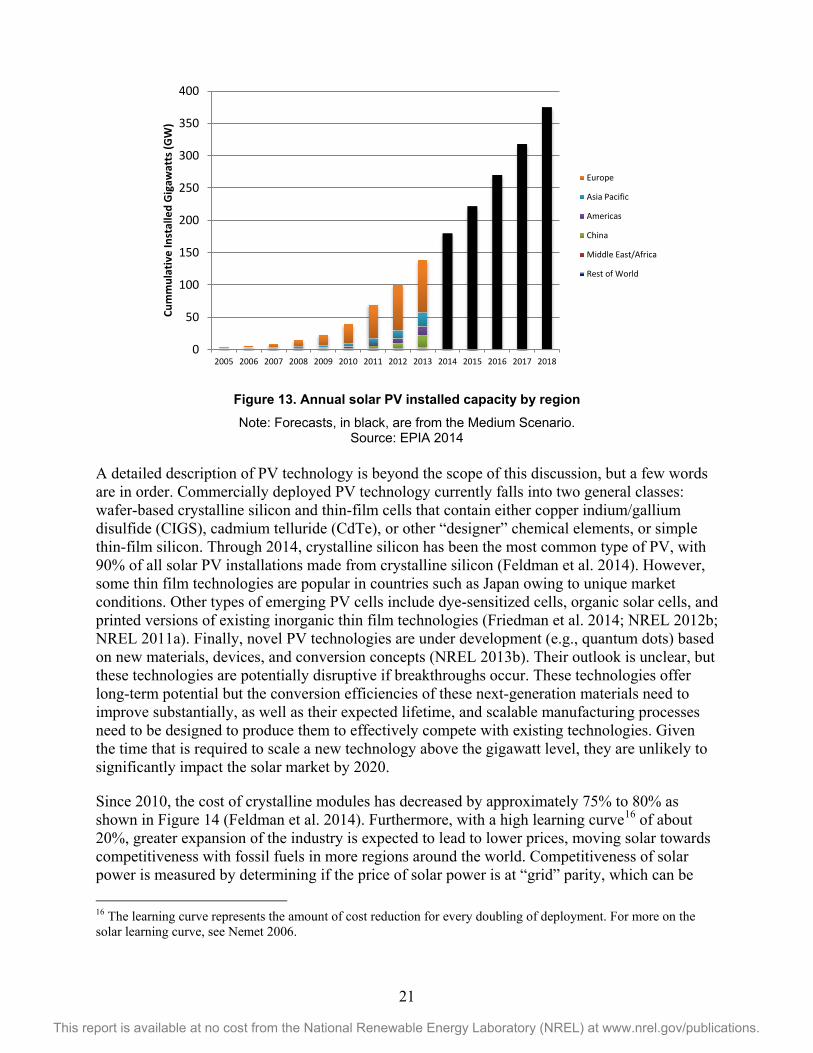
In 2013, over 38 GW of new PV came on-line across the world, surpassing total wind installations for the first time (Figure 13). Europe remains the leader in cumulative installed PV capacity, but growth there has slowed in the past few years compared to other regions due to decreasing incentives. In 2013, China led the world in new PV capacity additions, adding over 11 GW (see Section 6.2), and Japan, the United States, India, and the Middle East also currently see very strong growth (EPIA 2014).
21
This report is available at no cost from the National Renewable Energy Laboratory (NREL) at www.nrel.gov/publications.
Figure 13. Annual solar PV installed capacity by region
Note: Forecasts, in black, are from the Medium Scenario. Source: EPIA 2014
A detailed description of PV technology is beyond the scope of this discussion, but a few words are in order. Commercially deployed PV technology currently falls into two general classes: wafer-based crystalline silicon and thin-film cells that contain either copper indium/gallium disulfide (CIGS), cadmium telluride (CdTe), or other “designer” chemical elements, or simple thin-film silicon. Through 2014, crystalline silicon has been the most common type of PV, with 90% of all solar PV installations made from crystalline silicon (Feldman et al. 2014). However, some thin film technologies are popular in countries such as Japan owing to unique market conditions. Other types of emerging PV cells include dye-sensitized cells, organic solar cells, and printed versions of existing inorganic thin film technologies (Friedman et al. 2014; NREL 2012b; NREL 2011a). Finally, novel PV technologies are under development (e.g., quantum dots) based on new materials, devices, and conversion concepts (NREL 2013b). Their outlook is unclear, but these technologies are potentially disruptive if breakthroughs occur. These technologies offer long-term potential but the conversion efficiencies of these next-generation materials need to improve substantially, as well as their expected lifetime, and scalable manufacturing processes need to be designed to produce them to effectively compete with existing technologies. Given the time that is required to scale a new technology above the gigawatt level, they are unlikely to significantly impact the solar market by 2020.
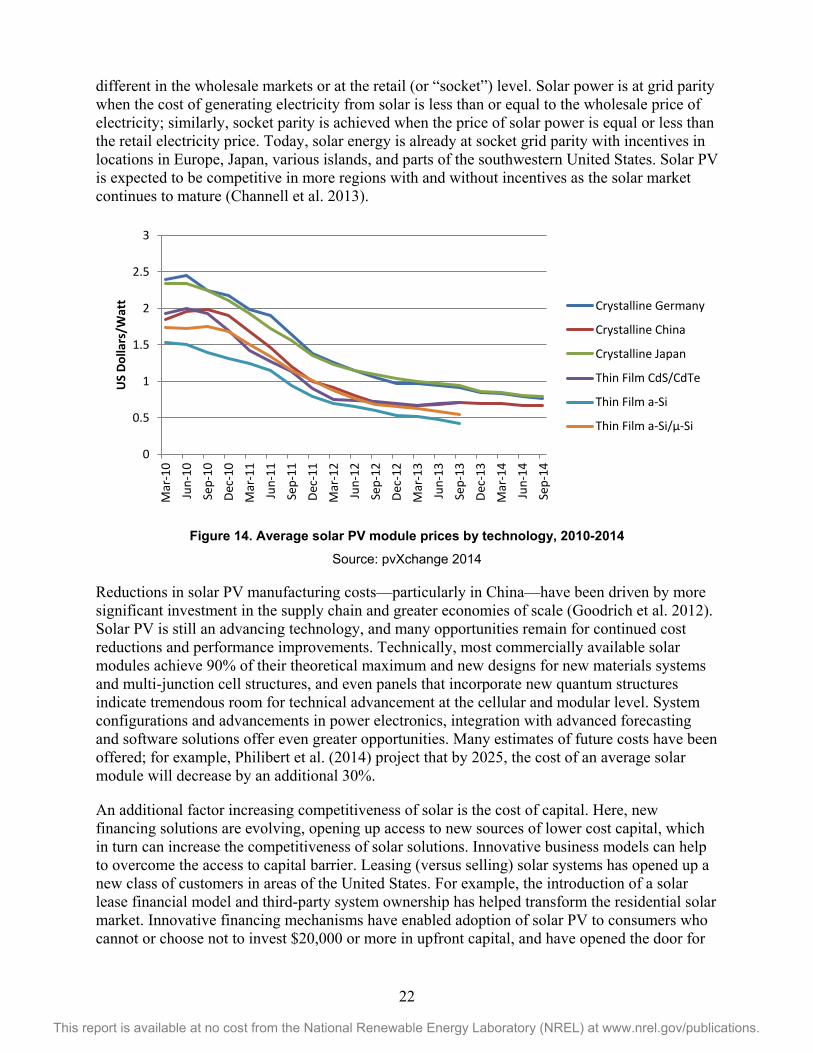
Since 2010, the cost of crystalline modules has decreased by approximately 75% to 80% as shown in Figure 14 (Feldman et al. 2014). Furthermore, with a high learning curve16 of about 20%, greater expansion of the industry is expected to lead to lower prices, moving solar towards competitiveness with fossil fuels in more regions around the world. Competitiveness of solar power is measured by determining if the price of solar power is at “grid” parity, which can be 16 The learning curve represents the amount of cost reduction for every doubling of deployment. For more on the solar learning curve, see Nemet 2006.
0
50
100
150
200
250
300
350
400
2005 2006 2007 2008 2009 2010 2011 2012 2013 2014 2015 2016 2017 2018
Cum
mul
ativ
e In
stal
led
Gig
awat
ts (G
W)
Europe
Asia Pacific
Americas
China
Middle East/Africa
Rest of World
22
This report is available at no cost from the National Renewable Energy Laboratory (NREL) at www.nrel.gov/publications.
different in the wholesale markets or at the retail (or “socket”) level. Solar power is at grid parity when the cost of generating electricity from solar is less than or equal to the wholesale price of electricity; similarly, socket parity is achieved when the price of solar power is equal or less than the retail electricity price. Today, solar energy is already at socket grid parity with incentives in locations in Europe, Japan, various islands, and parts of the southwestern United States. Solar PV is expected to be competitive in more regions with and without incentives as the solar market continues to mature (Channell et al. 2013).
Figure 14. Average solar PV module prices by technology, 2010-2014
Source: pvXchange 2014
Reductions in solar PV manufacturing costs—particularly in China—have been driven by more significant investment in the supply chain and greater economies of scale (Goodrich et al. 2012). Solar PV is still an advancing technology, and many opportunities remain for continued cost reductions and performance improvements. Technically, most commercially available solar modules achieve 90% of their theoretical maximum and new designs for new materials systems and multi-junction cell structures, and even panels that incorporate new quantum structures indicate tremendous room for technical advancement at the cellular and modular level. System configurations and advancements in power electronics, integration with advanced forecasting and software solutions offer even greater opportunities. Many estimates of future costs have been offered; for example, Philibert et al. (2014) project that by 2025, the cost of an average solar module will decrease by an additional 30%.
An additional factor increasing competitiveness of solar is the cost of capital. Here, new financing solutions are evolving, opening up access to new sources of lower cost capital, which in turn can increase the competitiveness of solar solutions. Innovative business models can help to overcome the access to capital barrier. Leasing (versus selling) solar systems has opened up a new class of customers in areas of the United States. For example, the introduction of a solar lease financial model and third-party system ownership has helped transform the residential solar market. Innovative financing mechanisms have enabled adoption of solar PV to consumers who cannot or choose not to invest $20,000 or more in upfront capital, and have opened the door for
0
0.5
1
1.5
2
2.5
3
Mar
-10
Jun-
10Se
p-10
Dec-
10M
ar-1
1Ju
n-11
Sep-
11De
c-11
Mar
-12
Jun-
12Se
p-12
Dec-
12M
ar-1
3Ju
n-13
Sep-
13De
c-13
Mar
-14
Jun-
14Se
p-14
US
Dolla
rs/W
att Crystalline Germany
Crystalline China
Crystalline Japan
Thin Film CdS/CdTe
Thin Film a-Si
Thin Film a-Si/µ-Si
23
This report is available at no cost from the National Renewable Energy Laboratory (NREL) at www.nrel.gov/publications.
an otherwise restricted market segment. Continued reduction in the cost of financing substantially reduces the cost of solar PV (Feldman et al. 2014). The cost and deployment of solar PV may also be affected by an oversupply of PV modules in countries such as China and developments in net-metering regulations; however, analyzing these complex market and policy issues is beyond the scope of this study.
As the costs of solar PV are likely to continue to decrease, reducing balance of system costs becomes increasingly important. Balance of system costs—or “soft” costs—are costs associated with installing PV panels, including cost of labor, permitting and commissioning, and land acquisition (Friedman et al. 2013). Reducing soft costs is challenging because they include costs from many components and depend on region as well as financing options. For example, soft costs are higher in the United States than in Europe and for residential systems relative to utility-scale systems (Feldman et al. 2014). In the short term, in order to reduce balance of system costs, the solar industry could use graphite mountings instead of steel and manufacture cheaper electronics (REN21 2013). Additionally, in the 2020s, there is the potential for deployment of smart inverters and utilizing substitutes for rare materials in manufacturing solar cells (NREL 2014c).
The solar PV industry has also experienced major technology innovations that have greatly improved system performance. Solar modules that are tested in labs are only about 3% more efficient than commercially manufactured modules. Other innovative technological improvements have increased the efficiency of manufacturing silicon with a process called fluidized bed reactor (FBR) technology, which enables polysilicon to be produced with less energy than traditional methods and reduces wastes associated with the production process (Register 2014). Furthermore, continued changes in orientation and improvements in solar-tracking devices of solar modules can increase energy output of PV (EIA 2014e), which could enhance the attractiveness of overall system economics.
Although the majority of deployed solar panels today are silicon-based, thin film solar cell technology has also improved. The price of silicon was very high between 2005 and 2008 due to market imbalances; this sent strong signals for firms to invest in additional silicon-based manufacturing capacity and resulted in rapidly falling prices as these new sources of supply came on-line. Thin film technologies thus had a harder time capturing more market share compared to initial estimates. However, thin-film options may still achieve larger penetrations moving forward. The solar industry could differentiate thin-film from silicon by developing thin-film in different forms such as a thin-film that can be sprayed on different surfaces.
Another potential venue for innovation is to create high efficiency modules that are cheap enough to compete with silicon. The solar industry is experimenting with gallium arsenide cells, which are high efficiency, thin-film cells—with the highest proven efficiency of 45%. Today, the manufacturing process for gallium arsenide cells requires cells to be grown very slowly, which is not conducive to scaling or mass production. In order for gallium arsenide to be competitive through 2025, a new process could be developed that enable cells to be grown more quickly and on a larger scale. Lastly, over the longer term, the solar industry could explore the potential to develop tandem cells, which are two solar cells on top of each other. This would double efficiency and could be suited for the existing silicon infrastructure.
24
This report is available at no cost from the National Renewable Energy Laboratory (NREL) at www.nrel.gov/publications.
Solar PV faces its own set of challenges, but continued innovation can help to break these barriers. For example, integrating variable solar power into the grid is often cited as a challenge for load management. Greater penetrations of variable RE put pressures on the grid, which could limit the potential of the renewable resources, particularly for distributed PV solutions. However, utilities and other key stakeholders have developed tools that have improved analysis, software, and technology for overcoming integration challenges (see Section 5 for more details). Additionally, improvements and cost reductions for battery storage might also help mitigate grid pressures. By 2018, solar PV with battery storage is expected to increase from 90 MW to 900 MW, globally (Wilkinson 2014). Distributed generation is a much more efficient way to deliver electricity to where it is needed; however, increasing distributive generation to a TW scale requires substantial innovations in the utility business model, PV grid integration strategies and the cost of energy storage.
Despite the challenges associated with solar PV, significant performance improvements and cost reductions now make PV competitive with conventional energy in many markets. Solar is often an economically attractive energy option at all scales—residential, commercial, and utility-level—even without incentives. Furthermore, with continued innovation to overcome technological, regulatory, and market barriers, the solar PV industry is expected to reach grid parity in markets around the globe.
3.3 Concentrating Solar Power Concentrating solar power (CSP) technologies produce heat through the use of mirrors and concentrated sunlight, which is then used to produce electricity. Unlike other solar energy technologies, CSP allows demand to be met even when the sun is not shining since it can incorporate thermal energy storage. Although CSP technologies are currently not as competitive as solar PV power, there are many opportunities for CSP growth moving forward Jorgensen et al. 2013).
There are four main technologies used in CSP: parabolic troughs, solar towers, parabolic dishes, and Linear Fresnel Reflectors (Richter et al. 2009). Each technology—shown in Figure 15—generates power by collecting heat from the sun and using that thermal energy to drive a thermo-electric power cycle, such as a steam turbine.
Parabolic troughs (technology A in Figure 15) are the most commonly used as well as most mature CSP technology today. Parabolic troughs use curved trough-like mirrors to concentrate the sun’s rays onto a tube that carries a heat transfer fluid. The solar-heated fluid can be stored for later use or sent to a heat exchanger to generate steam for a steam turbine or generator. Parabolic trough technology has been produced on a large-scale and multiple plants of 50-MW or larger are in service around the world. Parabolic troughs also can be integrated with other energy systems such as natural gas plants or energy storage in order to provide more reliable power to the grid, which highlights an additional avenue for potential market growth. However, the heat-transfer fluid that parabolic troughs use is oil-based, which limits the temperature that can be achieved. Alternative heat transfer fluids could boost operating temperature and efficiency. Currently, the industry is conducting tests on the use of molten salt as a heat transfer fluid, which could increase the efficiency of parabolic trough plants and reduce the cost of energy storage for those facilities.
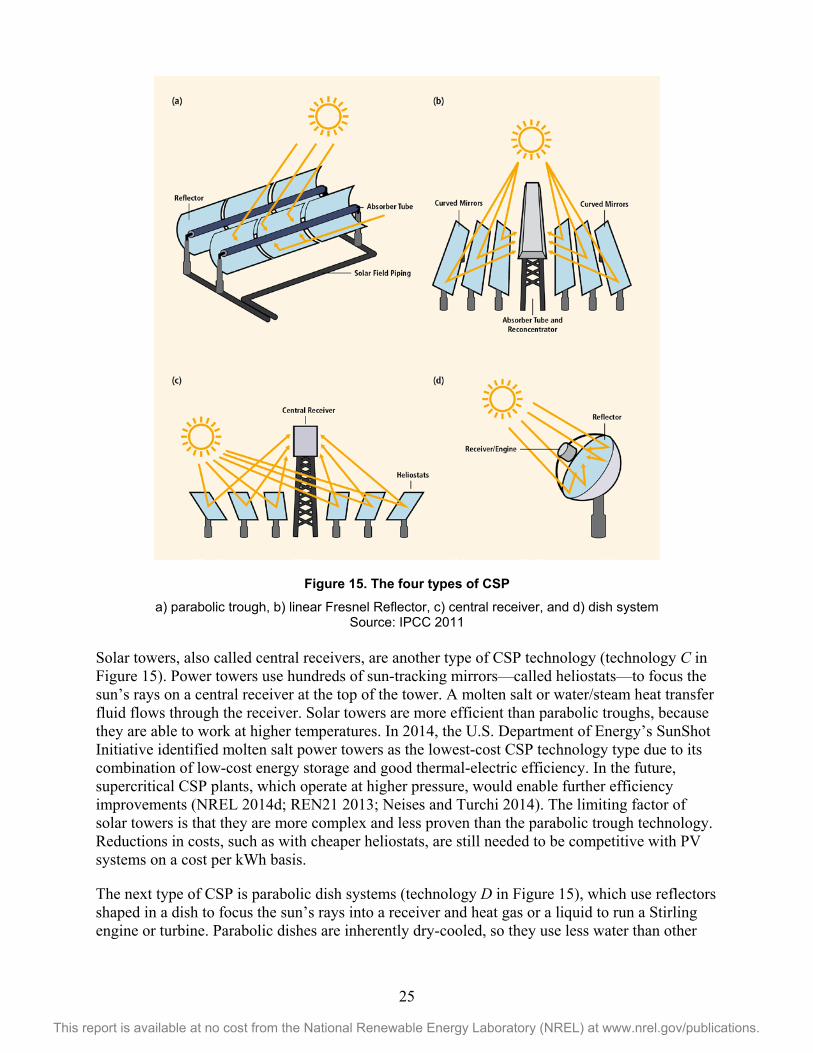
25
This report is available at no cost from the National Renewable Energy Laboratory (NREL) at www.nrel.gov/publications.
Figure 15. The four types of CSP
a) parabolic trough, b) linear Fresnel Reflector, c) central receiver, and d) dish system Source: IPCC 2011
Solar towers, also called central receivers, are another type of CSP technology (technology C in Figure 15). Power towers use hundreds of sun-tracking mirrors—called heliostats—to focus the sun’s rays on a central receiver at the top of the tower. A molten salt or water/steam heat transfer fluid flows through the receiver. Solar towers are more efficient than parabolic troughs, because they are able to work at higher temperatures. In 2014, the U.S. Department of Energy’s SunShot Initiative identified molten salt power towers as the lowest-cost CSP technology type due to its combination of low-cost energy storage and good thermal-electric efficiency. In the future, supercritical CSP plants, which operate at higher pressure, would enable further efficiency improvements (NREL 2014d; REN21 2013; Neises and Turchi 2014). The limiting factor of solar towers is that they are more complex and less proven than the parabolic trough technology. Reductions in costs, such as with cheaper heliostats, are still needed to be competitive with PV systems on a cost per kWh basis.
The next type of CSP is parabolic dish systems (technology D in Figure 15), which use reflectors shaped in a dish to focus the sun’s rays into a receiver and heat gas or a liquid to run a Stirling engine or turbine. Parabolic dishes are inherently dry-cooled, so they use less water than other
26
This report is available at no cost from the National Renewable Energy Laboratory (NREL) at www.nrel.gov/publications.
types of CSP, which are often wet-cooled, although dry cooling is possible. Because parabolic dishes are individual units, they can be readily mass-produced. The biggest hurdle for parabolic dishes is they do not offer thermal energy storage and so much compete directly with PV systems that are less complex and have lower maintenance costs. Today, there are no large-scale parabolic dish plants.
Lastly, Linear Fresnel Reflector (LFR) systems utilize flat mirrors that reflect the sun’s rays onto long linear receivers that contain water (technology B in Figure 15). Concentrated solar rays turn the water into steam. These LFR systems are cheaper, but also less efficient, than parabolic troughs due to the use of flat mirrors. The LFR technology is relatively new and is not widely used to date.
One of the main challenges that the CSP industry faces is that it is currently not as economical as solar PV, which makes it difficult for CSP to achieve “learning by doing” benefits by deploying at scale. Solar PV is not only cheaper than CSP, but each module can be installed individually instead of the whole plant simultaneously, which means that PV has less risk than CSP. CSP’s biggest edge is its ability to incorporate thermal storage. Thermal storage can provide a unique differentiating factor that enables dispatchability and economic optimization for site and market specific applications.17 Thermal storage would allow a managed flow of energy from CSP, which would increase reliability as well as improve the economics (Denholm and Mehos 2011). Smaller CSP systems with thermal storage could provide peak electricity to the grid.
Further economic attractiveness of CSP is expected to be largely driven by achieving higher efficiencies and economies of scale. Efficiency gains can be realized by the development of new heat transfer fluids and the evolution of new, supercritical power cycles. There are several opportunities for CSP integration with other energy systems. For example, CSP systems can be integrated with fossil fuel plants in hybrid operation that offers firm capacity and dispatchable power on demand. For example, General Electric has developed a system, called the “Flex Efficiency 50”, which integrates a combined cycle power plant with CSP steam turbine technology (GE 2011). Integrated energy systems such as FlexEfficiency 50 could offer many benefits to energy consumers, utilities and grid operators. Not only does integration with other energy sources such as natural gas open a potential avenue for CSP technology deployment, it also could increase grid reliability as it allows for flexible power generation.
3.4 Geothermal Geothermal energy taps reservoirs of steam or hot water from beneath the earth’s surface to generate electricity. Although traditional hydrothermal geothermal is considered a mature technology, and therefore recent improvements have been incremental, continued technology advancements could increase efficiency, decrease the risk associated with identifying and developing geothermal resources, and expand its capabilities, potentially opening new locations for resource exploitation.
A number of challenges have limited the growth of geothermal. Geothermal power is still relatively expensive due to high capital costs and drilling expenses. Additionally, there is high
17 Solar PV with battery storage also has the potential to offer these services, although electric batteries are much more expensive than thermal energy storage systems.
27
This report is available at no cost from the National Renewable Energy Laboratory (NREL) at www.nrel.gov/publications.
uncertainty regarding whether the resource will be wet or permeable enough to produce an adequate amount of energy prior to development, which poses substantial risk for project developers and their financiers. In the medium term, technology advancements that decrease exploration and resource development (drilling) risks or provide incentives for geothermal development in more locations, as well as cost reductions, could enable further deployment.
Despite the challenges and high risk involved with geothermal, there have been several technology improvements that have the potential to reduce costs. First, the utilization of techniques from the oil and gas industry such as directional drilling could help reduce costs and increased access to geothermal resources (Augustine 2011, REN21 2014). Second, geothermal can be used in integrating energy systems, which has an even greater potential in the future. For example, geothermal energy has the ability to provide flexible, dispatchable power to the electricity grid, which could increase the reliability of a grid that utilizes other variable RE resources (Linvill et al. 2013). Geothermal also could be utilized in combined heat and power co-generation plants in order to increase the cost-effectiveness of geothermal. Efforts to define “best practices” for geothermal exploration and to develop new exploration technologies are helping to reduce the risk involved in the exploration phases of development (GeothermEx 2013; Harvey et al. 2014; Phillips et al. 2013). Lastly, additional reduction in costs can be achieved with cheaper drilling techniques, improving its economic attractiveness even further.
Through 2025, continued technology improvements would enhance access to geothermal resources. One technology that could significantly increase access to geothermal resources is Enhanced Geothermal Systems (EGS), which is a technique that fractures underground rock to increase the permeability, enabling energy extraction from areas that are otherwise too dry or not permeable enough for conventional geothermal techniques. EGS techniques can also be used at conventional hydrothermal fields to increase production. Recent successes at EGS demonstration projects have resulted in the United States’ first sustained EGS reservoir creation demonstration and the first commercial EGS project to supply electricity to the grid.18 EGS would not only increase the potential sites for geothermal, but also decrease economic risk.
3.5 Bio-power Bio-power falls into two main categories: direct combustion, often mixed with coal, or gasification, where the biomass is gasified by a number of techniques to produce a syngas that predominately consists of carbon monoxide and hydrogen. The syngas can be combusted in a modified gas turbine. Although the bio-power industry is very large and mature, technology improvements have slowed over the last ten years. Furthermore, Bio-power technology is not expected to improve substantially through 2025. This does not mean that bio-power use won’t grow, as there may be opportunities to offset additional coal combustion in co-fired applications. Other developments could also occur that would increase the penetration of bio-power in the electricity industry. First, biomass is one of the few renewable sources of energy that can be transported without storage. Common fuels for bio-power include solid biomass such as wood chips, landfill gas, and organic municipal waste. Currently, outside of northern Europe, there is only a relatively small market for importing and exporting wood pellets, and this market could grow substantially over the next ten years (REN21 2014). 18 For more detail about current EGS projects in the United States, visit http://energy.gov/eere/geothermal/enhanced-geothermal-systems-demonstration-projects
28
This report is available at no cost from the National Renewable Energy Laboratory (NREL) at www.nrel.gov/publications.
Next, although gasification plants have faced challenges associated with the technology, thermal gasification could be utilized in greater amounts in the future in countries such as China. Thermal gasification produces syngas from organic waste, which can then be converted into electricity. Cities in China have very limited land resources to devote to landfills; thus, larger markets for gasification and waste-to-energy plants could develop (IEA 2014). Gasification has high capital costs and doesn’t always run reliably. Therefore, technology improvements through 2025 would help increase the deployment of gasification.
Lastly, greater utilization of bio-power in combined heat and power plants and integrated systems would both increase the efficiency and mitigate GHG emissions. Bio-power has the potential to be used in multi-purpose systems that would greatly improve its performance.
3.6 Ocean Energy Most of the technologies that produce energy from ocean tides or waves are still in their development or demonstration stages. However, there is a potential for ocean energy deployment, in certain markets (Jimenez and Tegen 2015). Currently, there are five main ocean energy technologies: tidal rise and fall (barrages), tidal/ocean currents, waves, temperature gradients, and salinity gradients (IPCC 2011; DOE – EERE 2014). However, as of 2014, tidal rise and fall is the only mature technology. In 2011, South Korea built the largest ocean tidal plant, which has a capacity of 250 MW.
There are many challenges with ocean energy technology that are the subject of increasing RD&D effort. Some of the costs can be reduced over time by increasing scale and learning from operation; additionally, technology improvements and cheaper materials are expected to contribute to increased cost competitiveness. Some technologies that are being tested in ocean energy are buoy devices that operate pumps or drive electric generators, turbines similar to onshore wind turbines with direct-drives, and systems that work well in low-current waters (REN21 2014; DOE – EERE 2014). Greater improvements in reliability, capacity factors, and costs are expected to be realized within the next ten years.
3.7 Synthesis of RE Technology Trends Figure 16 qualitatively summarizes some of the key economic and technical characteristics of RE options, and compares them to conventional generation sources. While the assessment of many of these characteristics is admittedly dynamic and subjective, we provide this example as a means to catalyze discussion and debate over even better metrics.
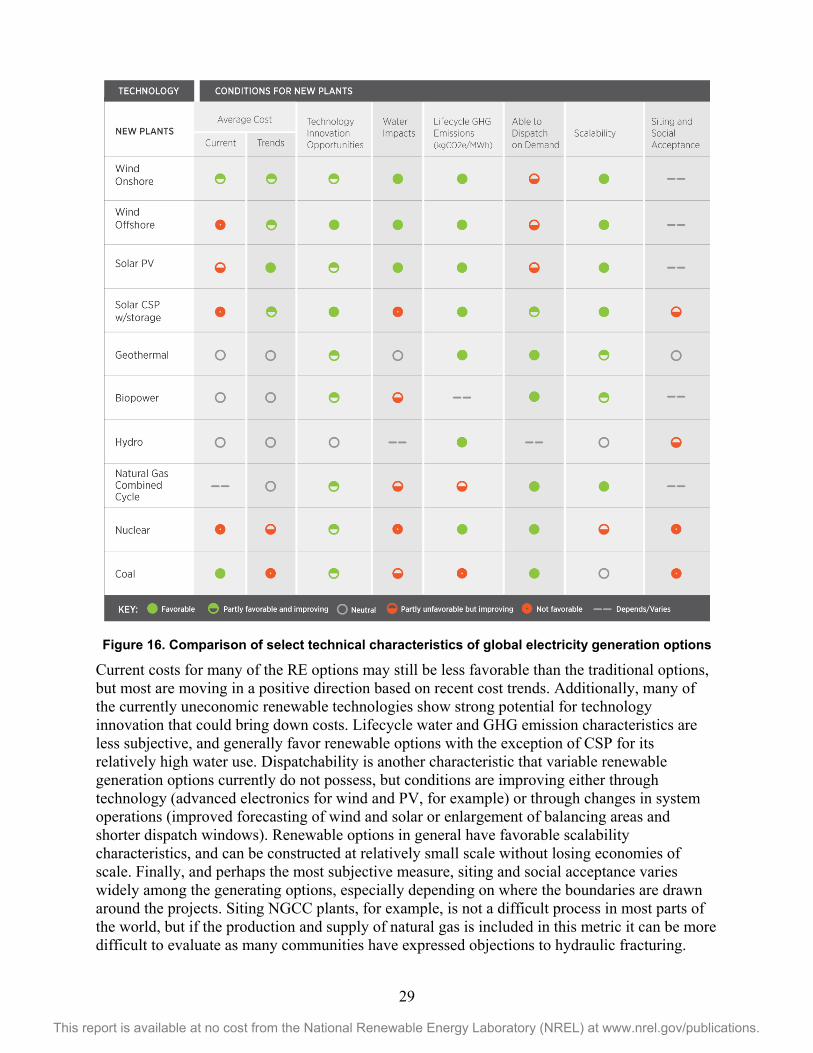
29
This report is available at no cost from the National Renewable Energy Laboratory (NREL) at www.nrel.gov/publications.
Figure 16. Comparison of select technical characteristics of global electricity generation options
Current costs for many of the RE options may still be less favorable than the traditional options, but most are moving in a positive direction based on recent cost trends. Additionally, many of the currently uneconomic renewable technologies show strong potential for technology innovation that could bring down costs. Lifecycle water and GHG emission characteristics are less subjective, and generally favor renewable options with the exception of CSP for its relatively high water use. Dispatchability is another characteristic that variable renewable generation options currently do not possess, but conditions are improving either through technology (advanced electronics for wind and PV, for example) or through changes in system operations (improved forecasting of wind and solar or enlargement of balancing areas and shorter dispatch windows). Renewable options in general have favorable scalability characteristics, and can be constructed at relatively small scale without losing economies of scale. Finally, and perhaps the most subjective measure, siting and social acceptance varies widely among the generating options, especially depending on where the boundaries are drawn around the projects. Siting NGCC plants, for example, is not a difficult process in most parts of the world, but if the production and supply of natural gas is included in this metric it can be more difficult to evaluate as many communities have expressed objections to hydraulic fracturing.

30
This report is available at no cost from the National Renewable Energy Laboratory (NREL) at www.nrel.gov/publications.
Similarly, CSP and hydro projects can face strong public opposition for the potential wildlife and ecosystem impacts they may create.
As the cost gap between renewable generation options and other technologies continues to tighten, the environmental and scalability traits are likely to become more important in market decision-making.
31
This report is available at no cost from the National Renewable Energy Laboratory (NREL) at www.nrel.gov/publications.
4 Environmental Attributes of RE Not only is RE increasingly competitive in regions around the world, but it also provides solutions for growing concerns about the environment. For example, renewable energy helps reduce GHG emissions and water use.
4.1 The Role of RE in Reducing GHG Emissions The energy sector is the largest source of GHG emissions globally, accounting for 26% of all GHG emissions (IPCC 2007). As climate change concerns increase, it becomes increasingly important to mitigate GHG emissions from all sources including the power sector.
Over the past several decades, thousands of life cycle analyses have been conducted; these analyses calculate the amount of GHG emitted from a technology throughout each step of the technology’s lifetime—including the GHG emissions associated with extracting materials, manufacturing components, building the plant, O&M, and decommissioning and disposing of the plant (Sathaye et al. 2011). GHG emission generation levels vary by electricity technology as does and the point in the technology’s life cycle at which most GHG emissions occur. Furthermore, emissions from RE are generated upstream, during the manufacturing of the components and extracting materials, whereas fossil fuels generate most associated GHG emissions during fuel combustion process and nuclear generates most associated GHG emissions upstream or during plant decommissioning (Sathaye et al. 2011).
Figure 17 shows life cycle GHG emissions across technologies. The estimates were gathered from hundreds of studies that provide high quality and transparent findings. The high and low values represent the range of estimate from the studies.
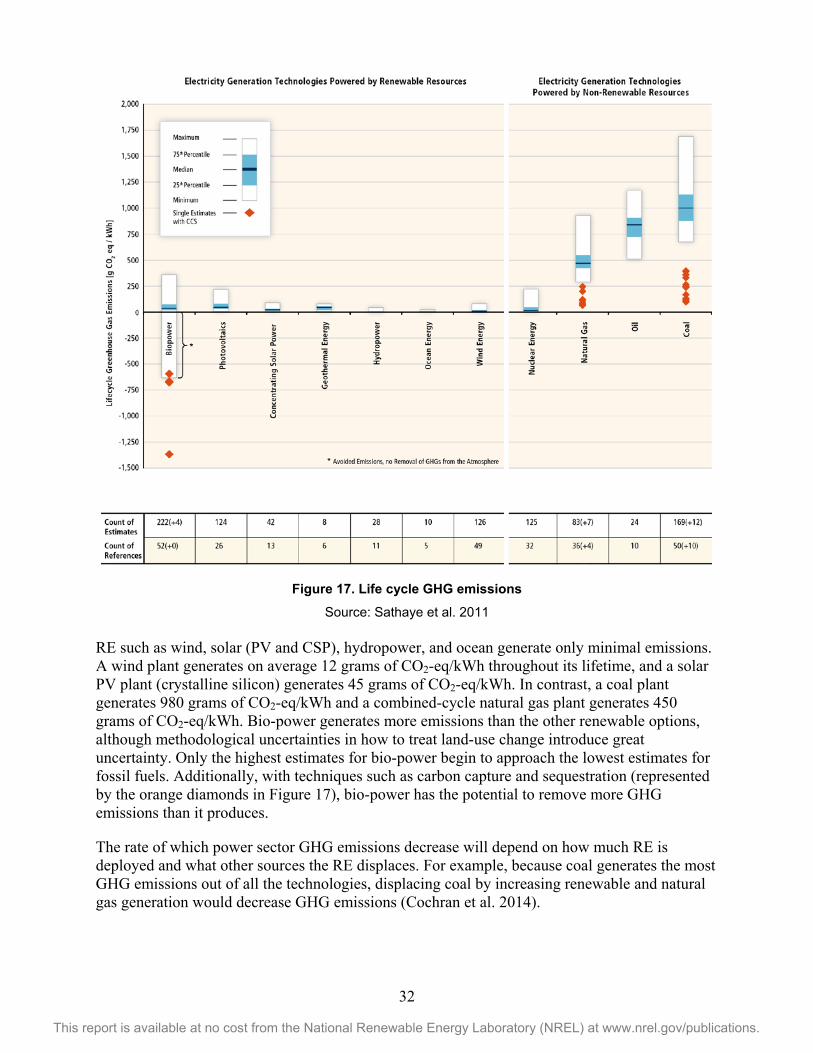
32
This report is available at no cost from the National Renewable Energy Laboratory (NREL) at www.nrel.gov/publications.
Figure 17. Life cycle GHG emissions
Source: Sathaye et al. 2011 RE such as wind, solar (PV and CSP), hydropower, and ocean generate only minimal emissions. A wind plant generates on average 12 grams of CO2-eq/kWh throughout its lifetime, and a solar PV plant (crystalline silicon) generates 45 grams of CO2-eq/kWh. In contrast, a coal plant generates 980 grams of CO2-eq/kWh and a combined-cycle natural gas plant generates 450 grams of CO2-eq/kWh. Bio-power generates more emissions than the other renewable options, although methodological uncertainties in how to treat land-use change introduce great uncertainty. Only the highest estimates for bio-power begin to approach the lowest estimates for fossil fuels. Additionally, with techniques such as carbon capture and sequestration (represented by the orange diamonds in Figure 17), bio-power has the potential to remove more GHG emissions than it produces.
The rate of which power sector GHG emissions decrease will depend on how much RE is deployed and what other sources the RE displaces. For example, because coal generates the most GHG emissions out of all the technologies, displacing coal by increasing renewable and natural gas generation would decrease GHG emissions (Cochran et al. 2014).
33
This report is available at no cost from the National Renewable Energy Laboratory (NREL) at www.nrel.gov/publications.
4.2 Renewables and the Energy-Water Nexus Energy planning and projects are increasingly at the intersection with water and natural resources. This “nexus” is becoming an integral component of global discussions ranging from national security to sustainable development (CEM 2014). The power sector is particularly vulnerable to changes in water resources, especially those that are already occurring and are likely to intensify with climatic change (DOE 2013). In the United States, for example, the power generation sector withdraws more water than any other sector, leaving operations heavily dependent on available water resources and reliability vulnerable to changes in water resources (Maupin et al. 2014; Kenny et al. 2009). Such vulnerabilities are not only incurred directly because of operational requirements (Huertas 2007; NETL 2009) but also indirectly due to water requirements throughout power plant equipment life cycles and fuel supply chains (Meldrum et al. 2013). These concerns are no exception for the energy-water nexus in regions around the globe.
Demand for water and energy is increasing globally, with many regions experiencing resource shortages already. Furthermore, regions that are experiencing large growth in energy demand, such as China and India, are also experiencing large increases in water demand, which has social, economic, and environmental impacts. Additionally, water scarcity can threaten energy production, increase operation costs, and threaten economic activity. Clean energy and improved efficiency in both water and energy systems can help to reduce water and energy use. (Field et al. 2014)
All electricity generation technologies use water throughout their life cycles, but water withdrawal and consumption factors vary across and within fuel technologies. Recent research that harmonized currently available data found that total life cycle water use across generation technologies seems to be lowest for solar PV and wind and highest for conventional coal technologies and nuclear (Meldrum et al. 2013; Macknick et al. 2012a). Significant volumes are required for the fuel cycles of coal, natural gas, and nuclear power plants. On the other hand, non-thermal renewable generation technologies have no water requirements associated with fuel extraction, and use almost no water for operational purposes, but require water for construction and manufacturing.
Figure 18 depicts estimated total life cycle water consumption and withdrawals for various generation technology pathways. Life cycle water use estimates capture aggregate impact on water resources given spatial and temporal characteristics of resource demand and availability. Estimates are calculated by summing water use factors for relevant stages with consistent performance parameters and consistent definitions for each life cycle (see Meldrum et al. [2013] for more detail on methodology). Based on median values, these figures ignore variation within each life cycle stage, which could be significant in some cases. Figure 18 suggests significant variability with respect to technology choices (Meldrum et al. 2013).
Across all generation technologies, operations dominate life cycle water use with the exception of solar PV, wind, and dry-cooled thermoelectric technologies (Meldrum et al. 2013). On the other hand, water use for solar PV is largely dominated by manufacturing relative to other life cycle stages. For example, estimates of water withdrawals for solar PV power plant equipment life cycle range from 1 to 1600 gal MWh-1 with a median of 94 gal MWh-1 (Meldrum et al. 2013). However, water use for operations is minimal (Meldrum et al. 2013) as few operators actually wash PV panels in practice (DOE 2012). For wind, the median water withdrawal is 26
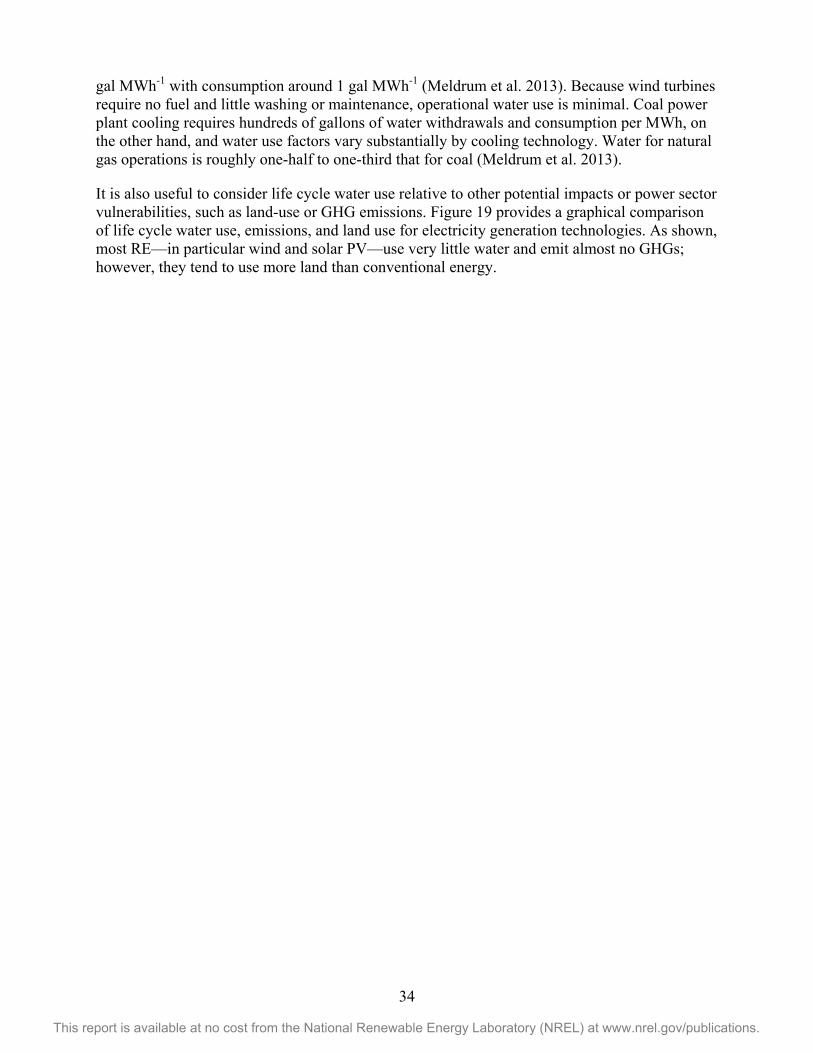
34
This report is available at no cost from the National Renewable Energy Laboratory (NREL) at www.nrel.gov/publications.
gal MWh-1 with consumption around 1 gal MWh-1 (Meldrum et al. 2013). Because wind turbines require no fuel and little washing or maintenance, operational water use is minimal. Coal power plant cooling requires hundreds of gallons of water withdrawals and consumption per MWh, on the other hand, and water use factors vary substantially by cooling technology. Water for natural gas operations is roughly one-half to one-third that for coal (Meldrum et al. 2013).
It is also useful to consider life cycle water use relative to other potential impacts or power sector vulnerabilities, such as land-use or GHG emissions. Figure 19 provides a graphical comparison of life cycle water use, emissions, and land use for electricity generation technologies. As shown, most RE—in particular wind and solar PV—use very little water and emit almost no GHGs; however, they tend to use more land than conventional energy.
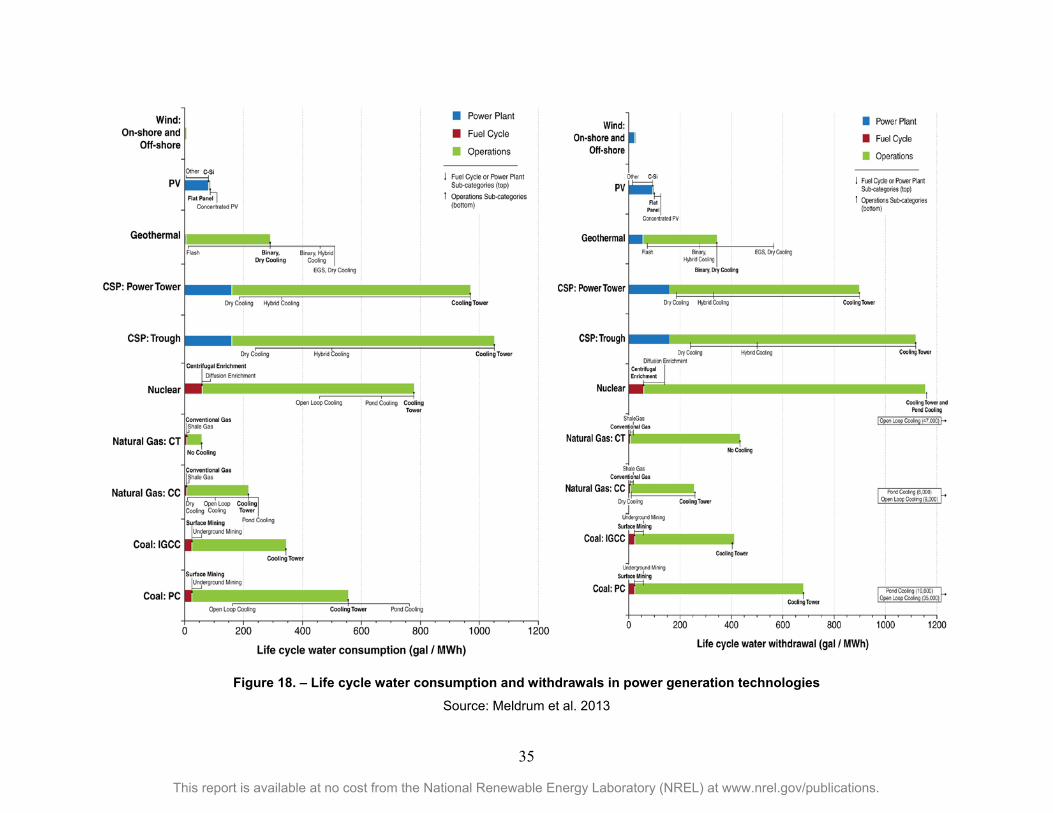
35
This report is available at no cost from the National Renewable Energy Laboratory (NREL) at www.nrel.gov/publications.
Figure 18. – Life cycle water consumption and withdrawals in power generation technologies Source: Meldrum et al. 2013
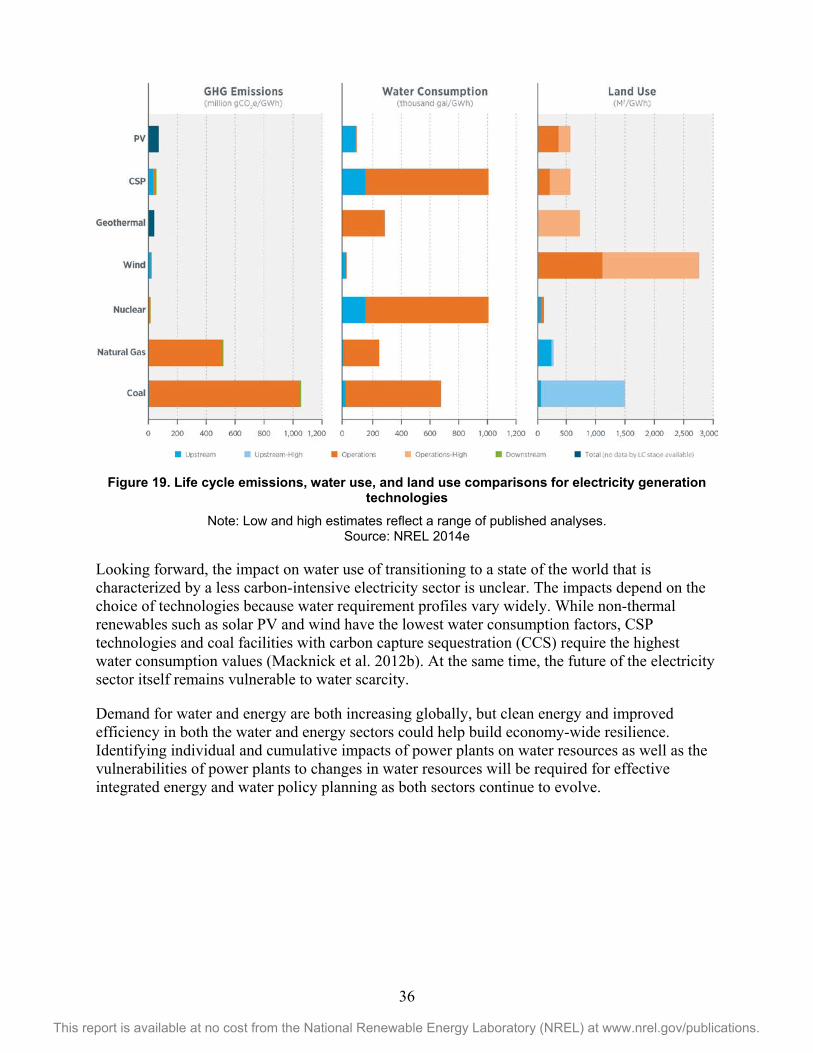
36
This report is available at no cost from the National Renewable Energy Laboratory (NREL) at www.nrel.gov/publications.
Figure 19. Life cycle emissions, water use, and land use comparisons for electricity generation technologies
Note: Low and high estimates reflect a range of published analyses. Source: NREL 2014e
Looking forward, the impact on water use of transitioning to a state of the world that is characterized by a less carbon-intensive electricity sector is unclear. The impacts depend on the choice of technologies because water requirement profiles vary widely. While non-thermal renewables such as solar PV and wind have the lowest water consumption factors, CSP technologies and coal facilities with carbon capture sequestration (CCS) require the highest water consumption values (Macknick et al. 2012b). At the same time, the future of the electricity sector itself remains vulnerable to water scarcity.
Demand for water and energy are both increasing globally, but clean energy and improved efficiency in both the water and energy sectors could help build economy-wide resilience. Identifying individual and cumulative impacts of power plants on water resources as well as the vulnerabilities of power plants to changes in water resources will be required for effective integrated energy and water policy planning as both sectors continue to evolve.
37
This report is available at no cost from the National Renewable Energy Laboratory (NREL) at www.nrel.gov/publications.
5 Putting it All Together: Grid Integration As penetration of RE increases through 2025, grid integration will become increasingly more important in managing electricity demand and supply. Renewable resources such as wind and solar provide energy at variable intervals and quantities; the variable supply creates new challenges for planning and operating electricity grids, especially when high percentages of variable generation are utilized.19
From 2015 to 2020, anticipated innovations in grid monitoring, forecasting, and control technologies, combined with new operational practices, could allow higher amounts of RE and distributed generation (DG) of all types to be managed within the integrated energy system. To accommodate increasing amounts of RE (and DG RE, as well as smart infrastructure and demand management options), power systems become increasingly characterized by operational flexibility, diverse fuels and technology, sophisticated and instantaneous system analysis capabilities, and faster response times (Horbaty and Huber 2012). Within these advanced systems that have greater contributions of RE, maintaining reliability is anticipated to be achieved by system-wide advances and also technical advances of variable RE systems that provide more grid services. These advanced RE systems offer a more compelling cost/benefit value proposition to developers, grid operators, and customers. Even in the absence of new RE technologies, grid operation is likely to need to change due to aging infrastructure, the changing generation mix, the need for greater resiliency, cybersecurity concerns, and other factors. An increased reliance on automation, advanced controls and sensors in grid integration, smart grid, and operations may, however, also increase security and resiliency vulnerability.
5.1 Demand Side Flexibility Demand side flexibility encompasses several emerging developments that change the traditional picture of how utilities, generators, and customers deal with electricity demand. Figure 20 illustrates some of these forms of flexibility.
Demand response. Demand response encourages consumers to shift their energy use in ways that help grid operations. These efforts can reduce peak demand for electricity. For example, utilities may offer electricity at different prices at different times of the day or seasons of the year. Real-time pricing, which uses new advanced meter technology, enables an even finer level of price discrimination.
Active demand control. Active demand control (also called direct load control) refers to a utility’s direct operational control over a customer’s use of electricity. Using special communications devices, or less sophisticated measures, a utility can temporarily shut down participating customers’ electrical appliances (such as air conditioners or water heaters). This reduces demand at strategic times, helping to maintain grid stability.
Active demand control is used around the world at both consumer and industrial scales. Larger industrial customers often have the option of taking interruptible service at a discounted rate. In organized wholesale power markets, interruptible service is treated as a commodity that large
19 For more detail on the challenges and opportunities of integrating large-scale renewable electricity in the United States, see Lew et al. 2013; NREL 2011b; NREL 2012a.
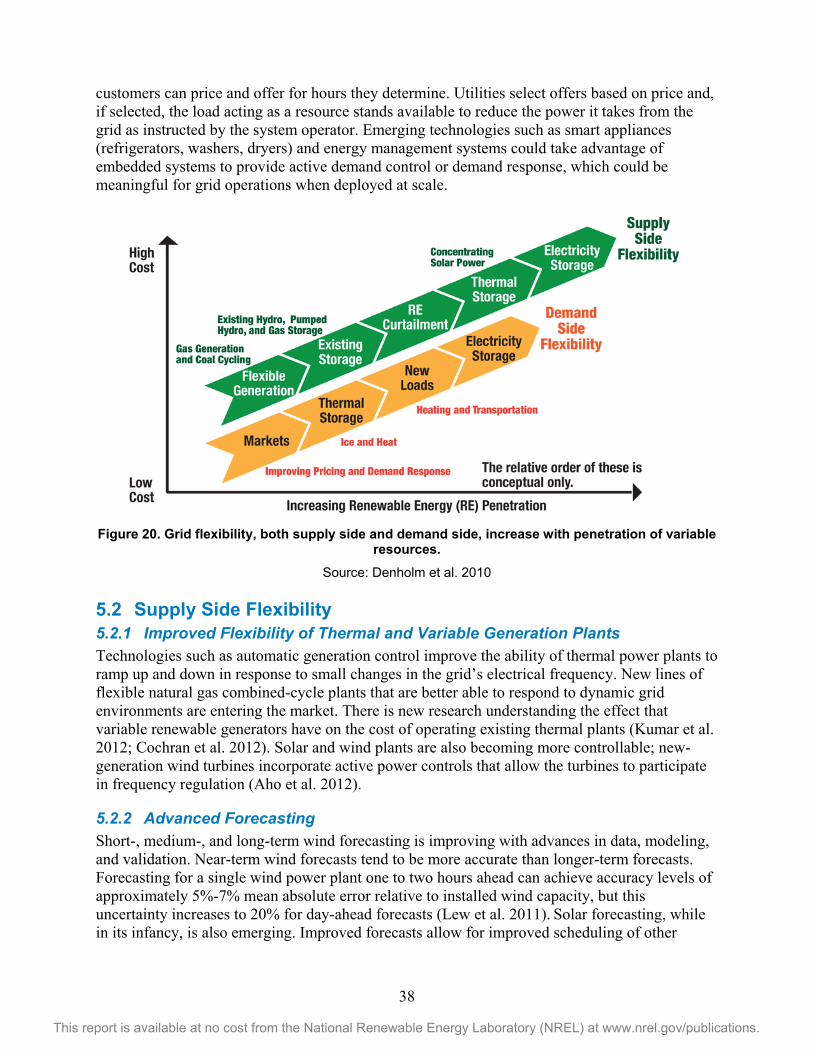
38
This report is available at no cost from the National Renewable Energy Laboratory (NREL) at www.nrel.gov/publications.
customers can price and offer for hours they determine. Utilities select offers based on price and, if selected, the load acting as a resource stands available to reduce the power it takes from the grid as instructed by the system operator. Emerging technologies such as smart appliances (refrigerators, washers, dryers) and energy management systems could take advantage of embedded systems to provide active demand control or demand response, which could be meaningful for grid operations when deployed at scale.
Figure 20. Grid flexibility, both supply side and demand side, increase with penetration of variable
resources. Source: Denholm et al. 2010
5.2 Supply Side Flexibility 5.2.1 Improved Flexibility of Thermal and Variable Generation Plants Technologies such as automatic generation control improve the ability of thermal power plants to ramp up and down in response to small changes in the grid’s electrical frequency. New lines of flexible natural gas combined-cycle plants that are better able to respond to dynamic grid environments are entering the market. There is new research understanding the effect that variable renewable generators have on the cost of operating existing thermal plants (Kumar et al. 2012; Cochran et al. 2012). Solar and wind plants are also becoming more controllable; new-generation wind turbines incorporate active power controls that allow the turbines to participate in frequency regulation (Aho et al. 2012).
5.2.2 Advanced Forecasting Short-, medium-, and long-term wind forecasting is improving with advances in data, modeling, and validation. Near-term wind forecasts tend to be more accurate than longer-term forecasts. Forecasting for a single wind power plant one to two hours ahead can achieve accuracy levels of approximately 5%-7% mean absolute error relative to installed wind capacity, but this uncertainty increases to 20% for day-ahead forecasts (Lew et al. 2011). Solar forecasting, while in its infancy, is also emerging. Improved forecasts allow for improved scheduling of other
39
This report is available at no cost from the National Renewable Energy Laboratory (NREL) at www.nrel.gov/publications.
resources to reduce reserves, fuel consumption, and costs (Marquis et al. 2011; Florita et al. 2012). As more variable resources are added on the customer side of the meter, it is conceivable that advanced load forecasting techniques will be needed to reduce the uncertainty in load forecasting in the future.
5.2.3 Better Utilization of Existing Transmission Capacity Scheduling dispatch at shorter intervals (5-15 minutes) can increase efficient use of the existing transmission system. Many competitive wholesale markets have implemented sub-hourly scheduling, but it has not been widely implemented in areas still served primarily by traditional utilities. Constraints on siting and costs of new infrastructure can make this an attractive option.
5.3 Communication, Control, and Information Technology Demand-side and supply-side flexibility depend on communication advances that enable greater control and coordination across the grid. General Electric monitors a significant number of its wind turbines worldwide from Schenectady, New York, and Salzbergen, Germany. In addition, improved monitoring and control and interactive local energy management systems, allow consumers to play an increasingly influential role in the future of energy systems (Kroposki et al. 2012).
5.3.1 High-Speed Digital Monitoring This advancement enables grid operators to check the status of the electric power grid and its elements in real time. The information can trigger an automated response or provide information to the operator for a manual response. On the transmission system, syncrophasor measurements are used to monitor grid stability.
5.3.2 Advanced Meters Some advanced meters allow communication between the customer and the utility. Most advanced meters provide high-resolution views of customer loads, typically in five-minute intervals. Advanced meter deployment continues to increase.
5.3.3 Advanced Grid The advanced, or smart, grid refers to a combination of technologies that lead to a more resilient, secure, and flexible grid that accommodates engagement of consumers and the two-way flow of electricity and information (GSGF 2012). These technologies can more effectively manage the variable temporal aspects of demand and supply. Technologies that enable a smart grid are embedded electronics in devices such as advanced meters or smart appliances, storage and a wide variety of advanced measurement, communication, and control that enable collection of real-time information and two-way communications over the internet between the utility, the grid, grid operators, and customers. This concept, “the industrial internet” of “internet of things” can include devices and communication that automate substations, or that interface with a building’s energy management system or individual end use systems. A major barrier to smart grid development is the development of standards and regulatory frameworks, which currently lags the pace of technology development (GSGF 2012). Other barriers cited are cyber security issues, consumer privacy and engagement, and the lack of incentive for or resistance from utilities that face lost revenues and hence are exploring new utility business models.
40
This report is available at no cost from the National Renewable Energy Laboratory (NREL) at www.nrel.gov/publications.
5.3.4 Microgrids Microgrids are emerging as a strategy for large campus operations with high risk or highly valuable operations (health care, military installations, data centers, industrial complexes) to ensure the availability and reliability of power. Microgrids allow the integration and control of multiple loads and onsite generators to optimize energy system operation at a single location. During normal, grid-connected operations, microgrids can receive price signals and schedule loads or onsite generators to avoid high electricity rates or to provide electricity to the grid. During grid outages, microgrids enable decoupling from the utility to sustain critical loads using onsite generation. At the end of the second quarter 2014, Navigant Research reports 4,393 MW of microgrid capacity globally, an increase of over 20% since the end of 2012. North America remains the leading market for microgrids, with 66% of the global total capacity (Navigant 2014). To fully realize interconnected macro and microgrids, researchers anticipate key advances in complex algorithms and dynamic control systems for multiple distributed loads and generators, including storage, complemented by design tools to optimize that accurately account for cost, environmental impact, line losses, grid interconnectivity, reliability, use of waste heat, and capacity for islanding, among others (Sioshansi 2011).
5.3.5 Virtual Power Plants A virtual power plant is a concept in which multiple distributed generation resources are aggregated and operated like a much larger central station plant. Virtual plants can also communicate with controllable loads to adjust resources and loads in response to real-time prices, network reliability conditions, or consumer choices for operating consumer-owned loads (IEA 2008).
5.4 Grid Expansion and Geographic Management 5.4.1 Expanded Transmission Lines Meeting increasing loads in major demand centers, while complying with federal, state and local regulations, often drives the development of expanded or new transmission paths that can be expensive and jurisdictionally complicated. As more transmission is added, increased security concerns (including cybersecurity) must also be considered.20 The cost of building new transmission lines varies greatly based on terrain, population density, land ownership, land use, and the size of the line itself. High-voltage direct current (HVDC) transmission can reduce the energy losses and cost of moving very large volumes of power over very long distances.
5.4.2 Power Management Across Larger Balancing Areas Managing supply, demand, and transmission over the largest possible area allows greater geographic diversity of variable generation resources (including wind and solar) and adds flexibility in grid operations (Kroposki et al. 2012). In addition, decisions to dispatch electricity over shorter time frames (5-15 minutes instead of hour-ahead) can achieve benefits in terms of lower system-wide costs and performance (Cochran et al. 2012).
20 For more information, see http://energy.gov/oe/services/cybersecurity.
41
This report is available at no cost from the National Renewable Energy Laboratory (NREL) at www.nrel.gov/publications.
5.5 Energy Storage Energy storage can provide additional system flexibility by storing energy for use when it is needed and provision of ancillary services. The major drawbacks for energy storage are high capital costs and geographic location availability for some large-scale technologies. From a utility perspective, the ability to store and discharge 8-15 hours of energy is often considered the most attractive scale for storage, although shorter periods are also very valuable in aiding frequency regulation (Denholm et al. 2010).
The value of storage, like other flexible tools, increases with the penetration of variable generation sources. Prior conventional wisdom suggested that energy storage in significant quantities was required to integrate greater contributions of variable RE sources on the grid. Many experts now articulate a more nuanced view: generally, storage is not essential at moderate levels of variable renewables but becomes increasingly valuable as higher levels are achieved (Denholm et al. 2010, NREL 2012a). Solutions are regionally specific, and other tools may be more cost-effective in helping integrate variable renewables. For example, the RE Futures analysis indicated storage levels of 30 to 100 GW or just 3%-7% of total generation capacity for the contiguous United States under scenarios of 30%-80% RE generation (NREL 2012a).
5.5.1 Large Scale Grid Storage Pumped hydropower and compressed air energy storage are currently the main utility-scale options for storing energy. Pumped hydropower uses reservoirs at different elevations, pumping water to the higher reservoir when the cost of power is low. The water is released to generate electricity when demand is high, replacing the need to use the most expensive fossil-fuel plants. Pumped hydropower is the only widespread energy storage technology in use today, with about 20 GW of capacity deployed in the United States, but no new sites have been developed since 1995.
Compressed air systems store energy by compressing air in underground storage caverns (such as are left when salt formations are mined), and then recapturing some energy when the compressed air is released and used in a gas turbine. These systems do require co-siting with a natural gas plant and are used to boost the overall efficiency of the gas plant.
5.5.2 Distributed Storage Batteries and flywheels have emerged as options for localized storage solutions, providing energy or other grid services, within the last five years. Several megawatt-scale battery energy storage systems have been sited with renewable energy plants to smooth short-term fluctuations in output and provide localized solutions for transmission congestion or supply constraints. Technology advancements, combined with significant new investments in gigawatt-scale factories, in combination with analyses that indicate cost effective opportunities in several power markets have led some to anticipate potentially 10s of GW market size by 2020. (Medina et al. 2014). Electric vehicles (EV) are being studied as energy storage elements for the grid in vehicle-to-grid technology. As the number of EVs increases there is an opportunity for large-scale distributed storage to interact with the grid. Another storage approach currently in the research and development stage is renewably generated hydrogen. Excess electricity from wind or solar is used to electrolyze water to hydrogen, which is then stored until needed to be used in place of natural gas in engines or fuel cells (Antonia and Saur 2012).
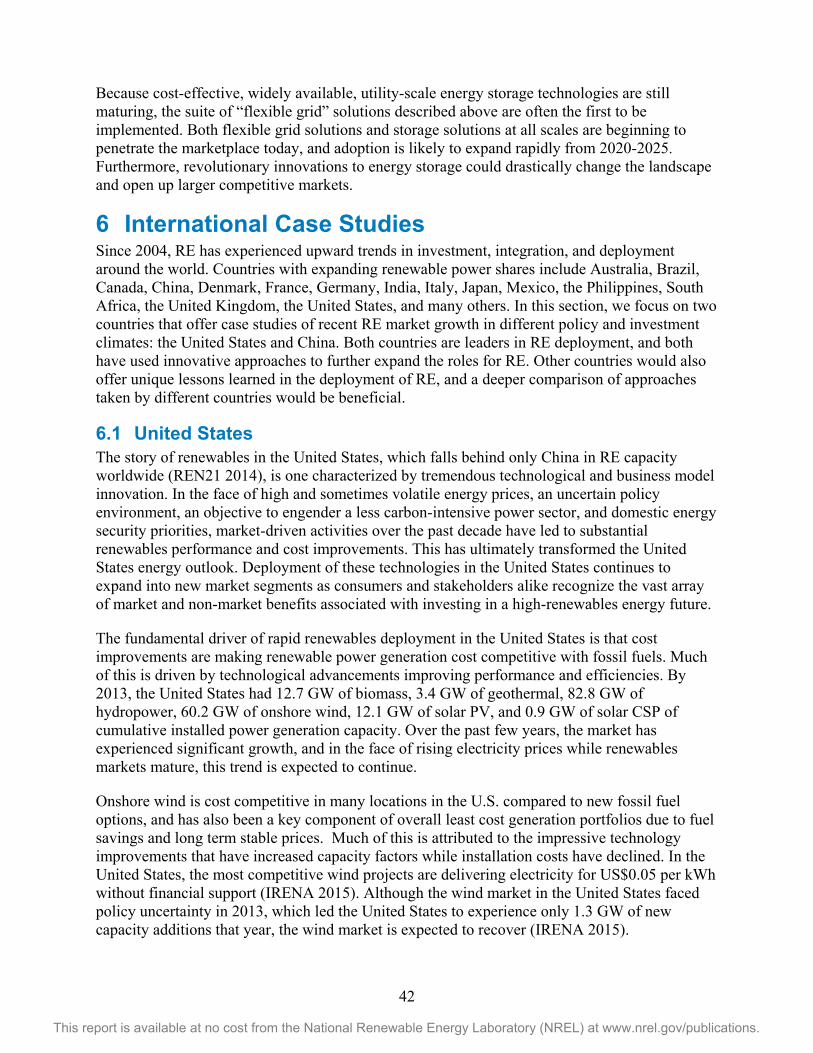
42
This report is available at no cost from the National Renewable Energy Laboratory (NREL) at www.nrel.gov/publications.
Because cost-effective, widely available, utility-scale energy storage technologies are still maturing, the suite of “flexible grid” solutions described above are often the first to be implemented. Both flexible grid solutions and storage solutions at all scales are beginning to penetrate the marketplace today, and adoption is likely to expand rapidly from 2020-2025. Furthermore, revolutionary innovations to energy storage could drastically change the landscape and open up larger competitive markets.
6 International Case Studies Since 2004, RE has experienced upward trends in investment, integration, and deployment around the world. Countries with expanding renewable power shares include Australia, Brazil, Canada, China, Denmark, France, Germany, India, Italy, Japan, Mexico, the Philippines, South Africa, the United Kingdom, the United States, and many others. In this section, we focus on two countries that offer case studies of recent RE market growth in different policy and investment climates: the United States and China. Both countries are leaders in RE deployment, and both have used innovative approaches to further expand the roles for RE. Other countries would also offer unique lessons learned in the deployment of RE, and a deeper comparison of approaches taken by different countries would be beneficial.
6.1 United States The story of renewables in the United States, which falls behind only China in RE capacity worldwide (REN21 2014), is one characterized by tremendous technological and business model innovation. In the face of high and sometimes volatile energy prices, an uncertain policy environment, an objective to engender a less carbon-intensive power sector, and domestic energy security priorities, market-driven activities over the past decade have led to substantial renewables performance and cost improvements. This has ultimately transformed the United States energy outlook. Deployment of these technologies in the United States continues to expand into new market segments as consumers and stakeholders alike recognize the vast array of market and non-market benefits associated with investing in a high-renewables energy future.
The fundamental driver of rapid renewables deployment in the United States is that cost improvements are making renewable power generation cost competitive with fossil fuels. Much of this is driven by technological advancements improving performance and efficiencies. By 2013, the United States had 12.7 GW of biomass, 3.4 GW of geothermal, 82.8 GW of hydropower, 60.2 GW of onshore wind, 12.1 GW of solar PV, and 0.9 GW of solar CSP of cumulative installed power generation capacity. Over the past few years, the market has experienced significant growth, and in the face of rising electricity prices while renewables markets mature, this trend is expected to continue.
Onshore wind is cost competitive in many locations in the U.S. compared to new fossil fuel options, and has also been a key component of overall least cost generation portfolios due to fuel savings and long term stable prices. Much of this is attributed to the impressive technology improvements that have increased capacity factors while installation costs have declined. In the United States, the most competitive wind projects are delivering electricity for US$0.05 per kWh without financial support (IRENA 2015). Although the wind market in the United States faced policy uncertainty in 2013, which led the United States to experience only 1.3 GW of new capacity additions that year, the wind market is expected to recover (IRENA 2015).
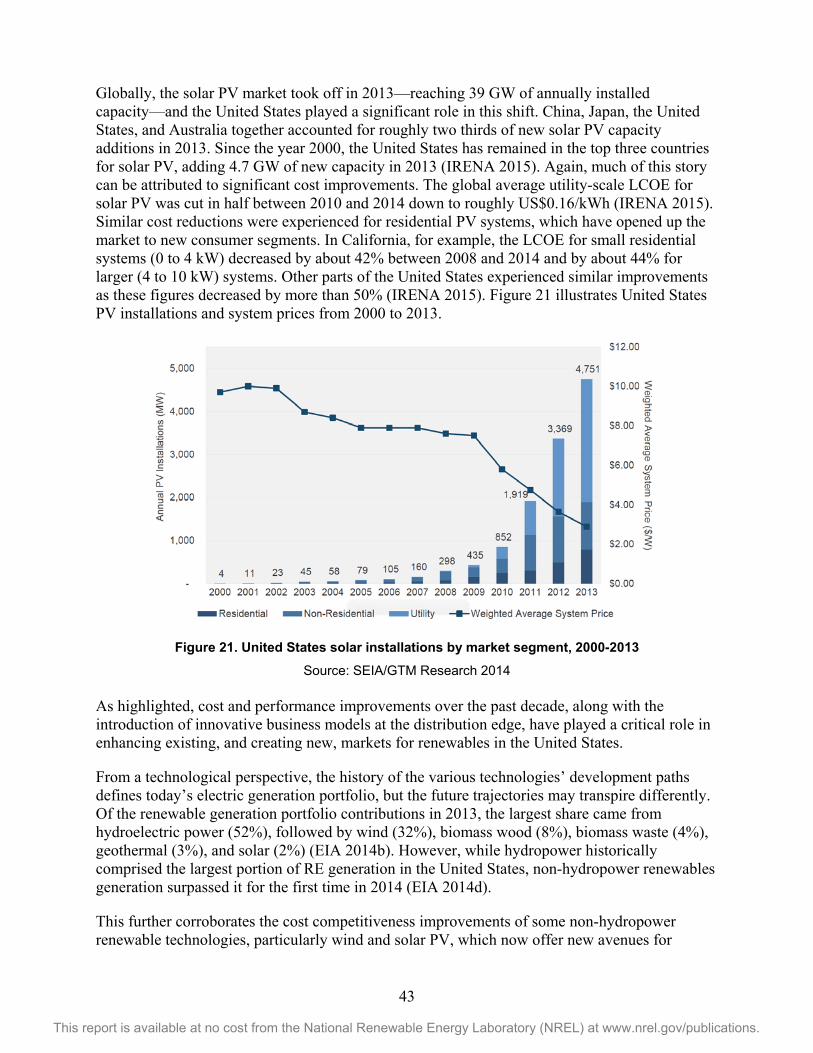
43
This report is available at no cost from the National Renewable Energy Laboratory (NREL) at www.nrel.gov/publications.
Globally, the solar PV market took off in 2013—reaching 39 GW of annually installed capacity—and the United States played a significant role in this shift. China, Japan, the United States, and Australia together accounted for roughly two thirds of new solar PV capacity additions in 2013. Since the year 2000, the United States has remained in the top three countries for solar PV, adding 4.7 GW of new capacity in 2013 (IRENA 2015). Again, much of this story can be attributed to significant cost improvements. The global average utility-scale LCOE for solar PV was cut in half between 2010 and 2014 down to roughly US$0.16/kWh (IRENA 2015). Similar cost reductions were experienced for residential PV systems, which have opened up the market to new consumer segments. In California, for example, the LCOE for small residential systems (0 to 4 kW) decreased by about 42% between 2008 and 2014 and by about 44% for larger (4 to 10 kW) systems. Other parts of the United States experienced similar improvements as these figures decreased by more than 50% (IRENA 2015). Figure 21 illustrates United States PV installations and system prices from 2000 to 2013.
Figure 21. United States solar installations by market segment, 2000-2013
Source: SEIA/GTM Research 2014 As highlighted, cost and performance improvements over the past decade, along with the introduction of innovative business models at the distribution edge, have played a critical role in enhancing existing, and creating new, markets for renewables in the United States.
From a technological perspective, the history of the various technologies’ development paths defines today’s electric generation portfolio, but the future trajectories may transpire differently. Of the renewable generation portfolio contributions in 2013, the largest share came from hydroelectric power (52%), followed by wind (32%), biomass wood (8%), biomass waste (4%), geothermal (3%), and solar (2%) (EIA 2014b). However, while hydropower historically comprised the largest portion of RE generation in the United States, non-hydropower renewables generation surpassed it for the first time in 2014 (EIA 2014d).
This further corroborates the cost competitiveness improvements of some non-hydropower renewable technologies, particularly wind and solar PV, which now offer new avenues for
44
This report is available at no cost from the National Renewable Energy Laboratory (NREL) at www.nrel.gov/publications.
business model innovation and rapid market transformation. Nearly all hydroelectric capacity was built before the mid-1970s, electricity produced from wood biomass largely occurs at lumber and paper mills, and biomass is primarily used in waste-to-energy power plants, but the wind and solar PV markets have seen significant growth since 2004.
Furthermore, the security of energy supply is an ongoing challenge for most economies around the world considering the long-lasting impacts of potential disruption, and the United States is no exception. Despite the current oversupply of crude oil and abundance of domestic natural gas, the United States’ electric power system still faces security risks from global fossil fuel supply dynamics, the capacity of infrastructure to meet growing electricity load, and fuel price volatility. Renewables can help to reduce demand from conventional resources and diversify the domestic portfolio, providing positive security benefits.
At the same time, natural gas is essential for facilitating and sustaining significant RE deployment. Fast-ramping natural gas-generating units help meet demand when output from variable renewables falls short, supporting the notion that natural gas and renewables are complementary. In the face of the United States shale boom and relatively inexpensive natural gas, the coupled growth of both renewables and natural gas offer significant energy security benefits as they enhance supply capacity with domestic resources. Combined they can contribute to system flexibility and significant infrastructure hardening through local generation.
Overall, despite federal incentive uncertainty and a sluggish domestic economy, RE markets continued to surge in 2014, and RE is expected to account for roughly one-third of new electricity generation added to the United States grid over the next three years (Worldwatch Institute 2013). As renewable technologies become more and more competitive at both distributed and utility scales, and market structures simultaneously mature, rapid year-on-year growth of RE deployment is expected to continue (IRENA 2015).
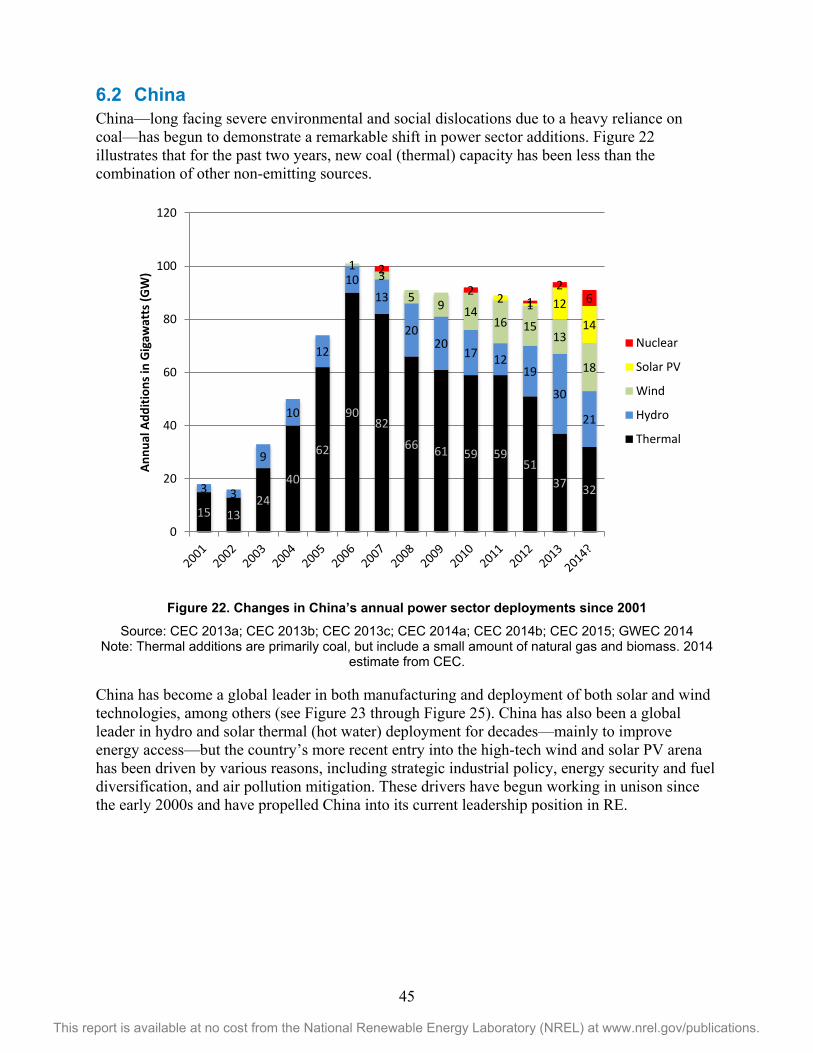
45
This report is available at no cost from the National Renewable Energy Laboratory (NREL) at www.nrel.gov/publications.
6.2 China China—long facing severe environmental and social dislocations due to a heavy reliance on coal—has begun to demonstrate a remarkable shift in power sector additions. Figure 22 illustrates that for the past two years, new coal (thermal) capacity has been less than the combination of other non-emitting sources.
Figure 22. Changes in China’s annual power sector deployments since 2001
Source: CEC 2013a; CEC 2013b; CEC 2013c; CEC 2014a; CEC 2014b; CEC 2015; GWEC 2014 Note: Thermal additions are primarily coal, but include a small amount of natural gas and biomass. 2014
estimate from CEC.
China has become a global leader in both manufacturing and deployment of both solar and wind technologies, among others (see Figure 23 through Figure 25). China has also been a global leader in hydro and solar thermal (hot water) deployment for decades—mainly to improve energy access—but the country’s more recent entry into the high-tech wind and solar PV arena has been driven by various reasons, including strategic industrial policy, energy security and fuel diversification, and air pollution mitigation. These drivers have begun working in unison since the early 2000s and have propelled China into its current leadership position in RE.
15 13 24
40
62
90 82
66 61 59 59 51
37 32 3 3
9
10
12
10 13
20 20
17 12 19
30
21
1 3
5 9 14 16 15
13
18
2 1 12
14
2
2 1
2 6
0
20
40
60
80
100
120
Annu
al A
dditi
ons i
n G
igaw
atts
(GW
)
Nuclear
Solar PV
Wind
Hydro
Thermal
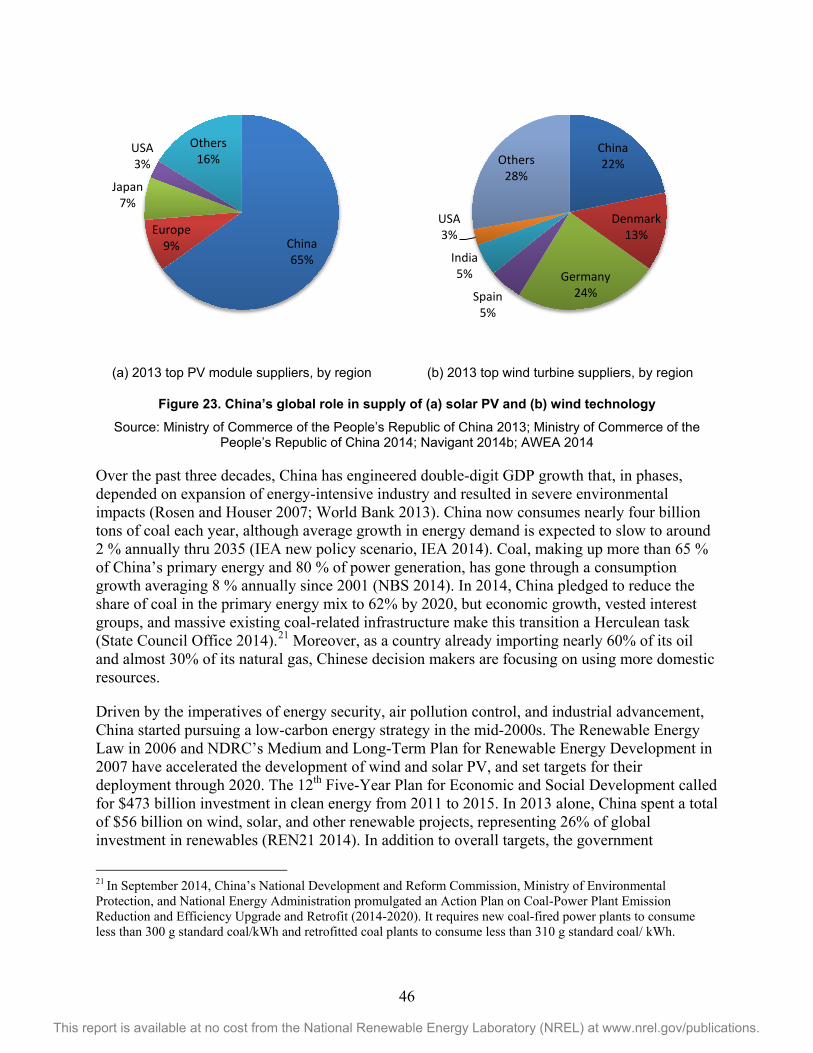
46
This report is available at no cost from the National Renewable Energy Laboratory (NREL) at www.nrel.gov/publications.
(a) 2013 top PV module suppliers, by region (b) 2013 top wind turbine suppliers, by region
Figure 23. China’s global role in supply of (a) solar PV and (b) wind technology Source: Ministry of Commerce of the People’s Republic of China 2013; Ministry of Commerce of the
People’s Republic of China 2014; Navigant 2014b; AWEA 2014
Over the past three decades, China has engineered double-digit GDP growth that, in phases, depended on expansion of energy-intensive industry and resulted in severe environmental impacts (Rosen and Houser 2007; World Bank 2013). China now consumes nearly four billion tons of coal each year, although average growth in energy demand is expected to slow to around 2 % annually thru 2035 (IEA new policy scenario, IEA 2014). Coal, making up more than 65 % of China’s primary energy and 80 % of power generation, has gone through a consumption growth averaging 8 % annually since 2001 (NBS 2014). In 2014, China pledged to reduce the share of coal in the primary energy mix to 62% by 2020, but economic growth, vested interest groups, and massive existing coal-related infrastructure make this transition a Herculean task (State Council Office 2014).21 Moreover, as a country already importing nearly 60% of its oil and almost 30% of its natural gas, Chinese decision makers are focusing on using more domestic resources.
Driven by the imperatives of energy security, air pollution control, and industrial advancement, China started pursuing a low-carbon energy strategy in the mid-2000s. The Renewable Energy Law in 2006 and NDRC’s Medium and Long-Term Plan for Renewable Energy Development in 2007 have accelerated the development of wind and solar PV, and set targets for their deployment through 2020. The 12th Five-Year Plan for Economic and Social Development called for $473 billion investment in clean energy from 2011 to 2015. In 2013 alone, China spent a total of $56 billion on wind, solar, and other renewable projects, representing 26% of global investment in renewables (REN21 2014). In addition to overall targets, the government
21 In September 2014, China’s National Development and Reform Commission, Ministry of Environmental Protection, and National Energy Administration promulgated an Action Plan on Coal-Power Plant Emission Reduction and Efficiency Upgrade and Retrofit (2014-2020). It requires new coal-fired power plants to consume less than 300 g standard coal/kWh and retrofitted coal plants to consume less than 310 g standard coal/ kWh.
China 65%
Europe 9%
Japan 7%
USA 3%
Others 16%
China 22%
Denmark 13%
Germany 24% Spain
5%
India 5%
USA 3%
Others 28%
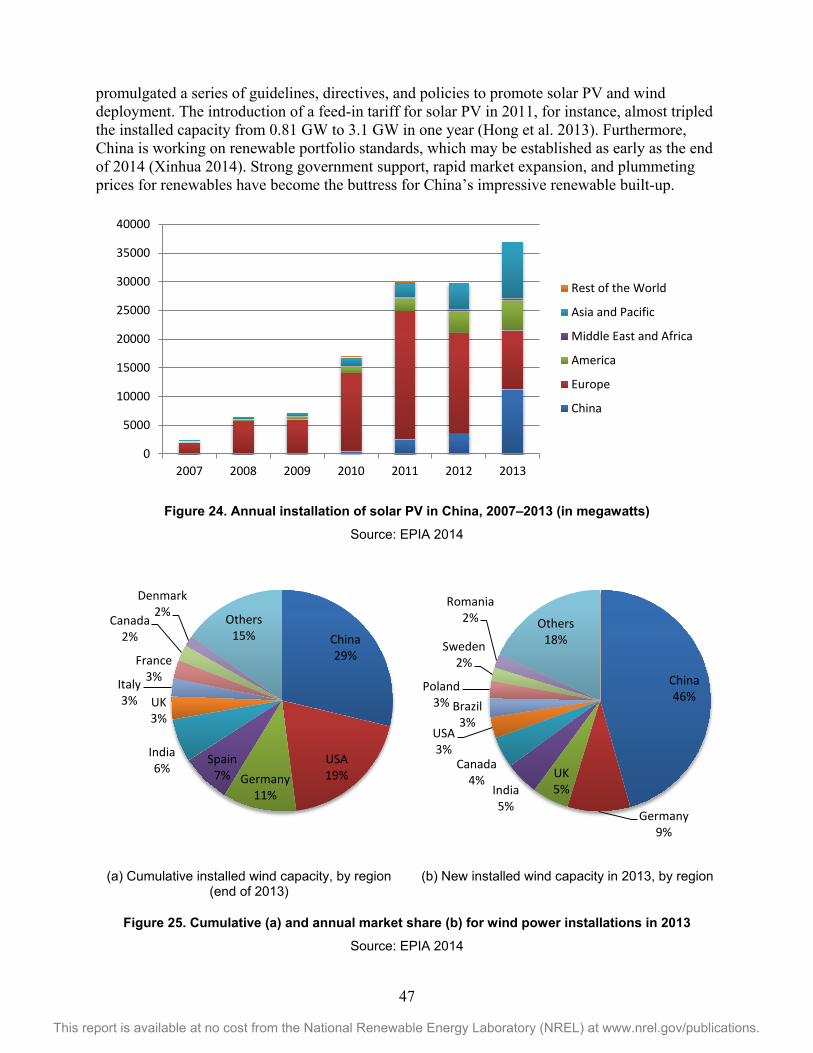
47
This report is available at no cost from the National Renewable Energy Laboratory (NREL) at www.nrel.gov/publications.
promulgated a series of guidelines, directives, and policies to promote solar PV and wind deployment. The introduction of a feed-in tariff for solar PV in 2011, for instance, almost tripled the installed capacity from 0.81 GW to 3.1 GW in one year (Hong et al. 2013). Furthermore, China is working on renewable portfolio standards, which may be established as early as the end of 2014 (Xinhua 2014). Strong government support, rapid market expansion, and plummeting prices for renewables have become the buttress for China’s impressive renewable built-up.
Figure 24. Annual installation of solar PV in China, 2007–2013 (in megawatts)
Source: EPIA 2014
(a) Cumulative installed wind capacity, by region (end of 2013)
(b) New installed wind capacity in 2013, by region
Figure 25. Cumulative (a) and annual market share (b) for wind power installations in 2013
Source: EPIA 2014
0
5000
10000
15000
20000
25000
30000
35000
40000
2007 2008 2009 2010 2011 2012 2013
Rest of the World
Asia and Pacific
Middle East and Africa
America
Europe
China
China 29%
USA 19% Germany
11%
Spain 7%
India 6%
UK 3%
Italy 3%
France 3%
Canada 2%
Denmark 2% Others
15%
China 46%
Germany 9%
UK 5% India
5%
Canada 4%
USA 3%
Brazil 3%
Poland 3%
Sweden 2%
Romania 2% Others
18%
48
This report is available at no cost from the National Renewable Energy Laboratory (NREL) at www.nrel.gov/publications.
China’s rapid RE expansion plays an important role in mitigating the health and environmental costs of coal. Coal and coal-related industrial processes account for about 60%-70% of China’s SO2, 50%-60% of NOx, and 50-60% of small particulate matter (PM 2.5) emissions (Zhao et al. 2008). These were estimated to induce 670,000 premature deaths in 2012 (NRDC 2014). From lost labor and the increased need for health care, air pollution was estimated to cost the Chinese economy $112 billion, nearly 5% of its GDP, in 2005. (Matus et al. 2012) Therefore, meeting the demand for coal with RE has notable impacts on GHG emissions, water, and local air pollution. In 2013, wind and solar PV generated 143.9 TWh of power in China, avoiding roughly 150 million tons of CO2e emissions, 2.6 trillion tons of water that would have been used in power plant cooling, 1.5 million tons of SO2, 0.4 million tons of NOx, and 30 thousand tons of particulates.22
RE development in China confronts a range of constraints from grid integration to financing. China’s grid development lags far behind the expansion of renewables. Many large wind power bases are hundreds of miles away from major cities and transmission lines. Weak transmission grids, outdated dispatch methods, and low-accuracy forecasting have caused chronic curtailment of RE generation. In 2012 alone, 20 billion KWh of wind power was curtailed – a financial loss of US$1.6 billion (Zhao et al. 2012; Wang 2014). Policy consistency is crucial in attracting investment, but China’s patchwork regulations on renewables have laid out an erratic path for its development. The 2009 “Golden Sun Demonstration Projects” offered subsidies to PV projects prior to project construction, which led to a number of scams, forcing the government to discontinue the program in 2013 and reclaim the subsidies. An estimated US$1.14 billion in subsidies given out from 2009-2011 were reclaimed, causing huge turmoil in China’s solar industry (Xinhua 2013). Since then, the government has established a set of measures aimed at promoting distributed PV, but lack of financing and cumbersome administrative procedures hindered the progress.
China is determined to make a low-carbon transition marked by robust development of the renewable energy industry. Looking forward, an effective national feed-in tariff and renewable portfolio standards, along with sound technical and administrative standards for grid connection can energize the market and sustain its growth vigor for decades to come.
22 Avoided GHGs emission calculated using the estimated mean life-cycle GHGs emissions for electricity generation in China in 2007 (Ou et al. 2011). Avoided water use calculated using the estimated mean life-cycle water consumption of pulverized coal plant with cooling tower (Meldrum et al. 2013). Avoided SO2, NOx, and particulates calculated using estimated emissions in China’s coal power plants (Logan and Luo 1999).
49
This report is available at no cost from the National Renewable Energy Laboratory (NREL) at www.nrel.gov/publications.
7 Conclusion The landscape for RE has changed dramatically due to advancements in performance, significant cost reductions, and the growing interest in renewables as a key component to achieve business and public policy goals, including mitigating environmental impacts of conventional electricity generation, energy security and economic growth. The technology advancements since 2004 have led to rapid decreases in the cost of RE and enabled greater deployment around the global. Currently, RE such as wind and solar PV are competitive with fossil fuels in many regions of the world.
Since 2009, the cost of RE has decreased between 29% and 78%, depending on the technology (IRENA 2015, Lazard 2014). The most notable improvements have been for wind and solar PV. The reductions in cost in addition to improvements in performance have led RE to be the some of the most attractive energy sources in many regions around the world. Globally, the cheapest wind technologies have fallen to US$65 per MWh and the cheapest solar PV technologies are now around US$85 per MWh, unsubsidized.
The levelized cost of RE differs by region due to varying quality of resources, capital costs, and balance-of-system costs. The competitiveness of RE depends on the levelized cost as well as regional fossil fuel prices and power prices. In Germany, China, and the United States, solar PV and wind generation is already competitive with natural gas electricity sources without incentives or projected to become competitive before 2025.
Oil price reductions in 2014 and the low price of natural gas and abundant resources in North America have led to some uncertainty about the future growth in RE. RE options are largely immune to low oil prices, except in markets with oil-indexed gas prices, but low natural gas prices make it more difficult for renewables to remain cost competitive. However, many developers, utilities, grid operators, and other decision makers view natural gas as complementary to RE, at least over the mid-term.
The cost competitiveness of RE is anticipated to increase in a growing number of locations around the globe, owing to further decline in costs and improvements in technology performance, through 2025. Furthermore, the increases in cost competitiveness are expected progress along with the maturing of renewable markets and continued rapid year-on-year growth of RE deployment.
New developments in near-term wind and solar forecasting, faster planning cycles, expanded control areas, transmission expansion, demand side flexibility and flexible generators are helping grid operators plan and operate power systems with variable resources. Integration of moderate amounts of variable RE generation, particularly wind and solar electricity, can be readily accomplished in most locations around the world through inexpensive changes in grid management and operations. Furthermore, integration of more than 30% variable RE can also be achieved in most power systems with additional, but likely more expensive, grid management techniques and technologies.
RE technologies are not only often attractive from an economic standpoint, they are also the preferred energy option from an environmental perspective. Natural gas generates more than 10 times as much GHG emissions as RE sources such as solar and wind, and coal generates more

50
This report is available at no cost from the National Renewable Energy Laboratory (NREL) at www.nrel.gov/publications.
than 20 times the amount of GHG emissions generated by solar or wind. Additionally, water consumption for conventional electricity generation is at least twice as much as from some renewables. Concerns about the effects of a growing electricity industry on the environment have been increasing, which has illuminated the importance of integrated cost-benefit analysis and collaborative planning across the scopes of energy and the environment.
Given the increasing cost competitiveness of RE, financial incentives and subsidies are likely to play less of a role in the expansion of RE going forward. However, a subsidy-free world does not imply policy-free. Future policies may focus on enabling integration, market design, and operational changes, which would help open the market to new segments and in new locations.
We are now at the threshold of a “RE era”, with a sophisticated set of technologies and experiences gained from decades of learning and innovation. Over the next few decades, RE options are anticipated to continue expanding owing to the many benefits they provide, including: low water intensity, use of valuable and abundant domestic resources, and contribution to local, regional, and national policy goals. Suppliers, developers, utilities, system operators and other key stakeholders envision resilient, affordable, reliable and low emissions power systems that incorporate technology advances, business model innovations, and changes in market designs, management and operations to provide power with 21st century system solutions.
51
This report is available at no cost from the National Renewable Energy Laboratory (NREL) at www.nrel.gov/publications.
References Aho, J.; Buckspan, A.; Laks, J.; Fleming, P.; Jeong, Y.; Dunne, F.; Churchfield, M.; Pao, L.; Johnson, K. (2012). Tutorial of Wind Turbine Control for Supporting Grid Frequency Active Power Control: Preprint. NREL/CP-5000-54605. Golden, CO: National Renewable Energy Laboratory. Accessed January 2015: http://www.nrel.gov/docs/fy12osti/54605.pdf.
American Wind Energy Association (AWEA). (2014). U.S. Wind Industry Annual Market Report 2013. Washington, D.C.: AWEA. Accessed December 2014: http://www.awea.org/amr2013
American Wind Energy Association (AWEA). (2015). U.S. Wind Industry Fourth Quarter 2014 Market Report. Accessed January 2015: http://awea.files.cms-plus.com/4Q2014%20AWEA%20Market%20Report%20Public%20Version.pdf.
Antonia, O.; Saur, G. (2012). Wind to Hydrogen in California: Case Study. NREL/TP-5600-53045. Golden, CO: NREL. Accessed January 2015: http://www.nrel.gov/docs/fy12osti/53045.pdf
Augustine, C. (2011). Updated U.S. Geothermal Supply Characterization and Representation for Market Penetration Model Input. NREL/TP-6A2-47459. Golden, CO: NREL. Accessed December 2014: http://www.nrel.gov/docs/fy12osti/47459.pdf.
Awerbuch, S. (2000). “Investing in photovoltaics: risk, accounting and the value of new technology.” Energy Policy 28(14); pp. 1023-1035. Accessed December 2014: http://aoatools.aua.gr/pilotec/files/bibliography/2000%20EP%20-%20Investing%20in%20PV%20--%20Nov1-0341940225/2000%20EP%20-%20Investing%20in%20PV%20--%20Nov1.pdf.
Awerbuch, S. (2004). “Portfolio-Based Electricity Generation Planning: Implications for Renewables and Energy Security.” Prepared for REEP Environmental Policy Department and United Nations Environment Programme. Accessed December 2014: http://www.awerbuch.com/shimonpages/shimondocs/unepfco_portfolio.pdf.
Bachrach, D.; Wiser, R.; Bolinger, M.; Golove, W. (2003). Comparing the Risk Profiles of Renewable and Natural Gas-fired Electricity Contracts. LBNL-50965. Berkeley, CA: LBNL. Accessed May 2013: http://emp.lbl.gov/sites/all/files/REPORT%20lbnl%20-%2050965.pdf.
Bloomberg New Energy Finance (BNEF). (2013). “Strong Growth for Renewables Expected Through to 2030.” Accessed November 21, 2014: http://about.bnef.com/press-releases/strong-growth-for-renewables-expected-through-to-2030/.
BNEF. (2014a). “German Power Costs Seen Dropping for Fourth Year: Energy.” Accessed December 2014: http://www.bloomberg.com/news/articles/2014-01-03/german-power-costs-seen-dropping-for-fourth-year-energy
BNEF and Kuang, M. (2014b). H2 2014 APAC LCOE Update: A Race Between Renewable Penetration and Fuel Prices.
52
This report is available at no cost from the National Renewable Energy Laboratory (NREL) at www.nrel.gov/publications.
Blyth, W. (2006). Factoring Risk into Investment Decisions. UK Energy Research Centre. Accessed December 2014: http://oxfordenergyassociates.com/wp-content/uploads/2013/03/UKERC_Factoring_Risk.pdf.
Bolinger, M.; Wiser, R.; Golove, W. (2004). “Accounting for fuel price risk when comparing renewable to gas-fired generation: the role of forward natural gas prices.” Energy Policy 34; pp. 706-720.
Bush, B.; Jenkin, T.; Lipowicz, D.; Arent, D. J.; Cooke, R. (2012). Variance Analysis of Wind and Natural Gas Generation under Different Market Structures: Some Observations. NREL/TP-6A20-52790. Golden, CO: NREL. Accessed December 2014: http://www.nrel.gov/docs/fy12osti/53730.pdf.
Channell, J.; Jansen, H.R.; Syme, A.R.; Savvantidou, S.; Morse, E.L.; Yuen, A. (2013). Energy Darwinism: The evolution of the energy industry. New York, NY: Citi Research. Accessed November 2014: https://ir.citi.com/Jb89SJMmf%2BsAVK2AKa3QE5EJwb4fvI5UUplD0ICiGOOk0NV2CqNI%2FPDLJqxidz2VAXXAXFB6fOY%3D.
CEC. (2013a). “2012 China Consumed 28.5% More Clean Energy Than Last Year.” Accessed December 2014: http://www.cec.org.cn/nengyuanyudianlitongji/hangyetongji/dianlixingyeshuju/2013-04-17/100361.html
CEC. (2013b). “2012 China Power Industry Operation Overview.” Accessed December 2014: http://www.cec.org.cn/yaowenkuaidi/2013-02-22/97555.html
CEC. (2013c). “2013 January-November Power Industry Operation Overview.” Accessed December 2014: http://www.cec.org.cn/guihuayutongji/gongxufenxi/dianliyunxingjiankuang/2013-12-17/113992.html
CEC. (2014a). “2013 Nationwide Grid-Connected Wind Electricity Reaches 137.1 Twh.” Accessed December 2014: http://www.cec.org.cn/yaowenkuaidi/2014-01-02/114839.html
CEC. (2014b). “Bureau of Statistics: Nationwide 2013 Electricity Generation 5,245.1 Twh, Increase of 7.6% from Last Year.” Accessed December 2014: http://www.cec.org.cn/nengyuanyudianlitongji/hangyetongji/dianlixingyeshuju/2014-01-23/116011.html
China Electricity Council (CEC). (2015). “2014 Power Industry Operation Overview.” Accessed February 2015: http://www.cec.org.cn/guihuayutongji/gongxufenxi/dianliyunxingjiankuang/2015-02-02/133565.html
Churchfield, M.J.; Fleming, P.; DeGeorge, E.; Bulder, B; White, S.M. (October 2014). “Active Wake Redirection Control to Improve Energy Yield.” Presented at the 2014 AWEA Offshore WINDPOWER Conference & Exhibition, 7-8 October 2014, Atlantic City, New Jersey. Accessed February 2015: http://www.nrel.gov/docs/fy14osti/62763.pdf.
53
This report is available at no cost from the National Renewable Energy Laboratory (NREL) at www.nrel.gov/publications.
Clean Energy Ministerial (CEM). (2014). “The Energy-Water Nexus: Overview and Relevance for the CEM Overview.” Accessed December 2014: http://www.cleanenergyministerial.org/Events/CEM5/Roundtables/EnergyWaterNexus.
Cochran, J.; Bird, L.; Heeter, J.; Arent, D. (2012). Integrating Variable Renewable Energy in Electric Power Markets: Best Practices from International Experience, Summary for Policymakers. NREL/TP-6A20-53730. Accessed December 2014: http://www.nrel.gov/docs/fy12osti/53730.pdf.
Cochran, J.; Zinaman, O.; Logan, J.; Arent, D. (2014). Exploring the Potential Business Case for Synergies Between Natural Gas and Renewable Energy. NREL/TP-6A50-60052. Golden, CO: NREL.
Cohen, J.; Schweizer, T.; Laxson, A.; Butterfield, S.; Schreck, S.; Fingersh, L.; Veers, P.; Ashwill, T. (2008). Technology Improvement Opportunities for Low Wind Speed Turbines and Implications for Cost of Energy Reduction: July 9, 2005 - July 8, 2006. NREL/TP-500-41036. Golden, CO: NREL. Accessed February 2015: http://www.nrel.gov/docs/fy08osti/41036.pdf.
Cotrell, J.; Stehly, T.; Johnson, J.; Roberts, J.; Heimiller, D., 2014. Analysis of Transportation and Logistics Challenges Affecting the Deployment of Larger Wind Turbines: Summary of Results. 17 pp.; NREL Report No. TP-5000-61063.Denholm, P.; & Mehos, M., 2011.O.; Parker, Z.; Scott, G.; Heimiller, D. (2014). Analysis of Transportation and Logistics Challenges Affecting the Deployment of Larger Wind Turbines: Summary of Results. NREL/TP-5000-61063. Golden, CO: NREL. Accessed December 2014: http://www.nrel.gov/docs/fy14osti/61063.pdf.
Denholm, P.; Mehos, M. (2011). Enabling greater penetration of solar power via the use of CSP with thermal energy storage. NREL/TP-6A20-52978. Golden, CO: NREL.
Denholm, P.; Ela, E.; Kirby, B.; Milligan, M. (2010). The Role of Energy Storage with Renewable Energy Generation. NREL/TP-6A2-47187. Golden, CO: NREL. Accessed June 19, 2013: http://www.nrel.gov/docs/fy10osti/47187.pdf.
Department of Energy (DOE) Office of Energy Efficiency and Renewable Energy (EERE). (2008). 20% Wind Energy by 2030: Increasing Wind Energy Contribution to the U.S. Electricity Supply. DOE/GO-102008-2567. Washington, D.C.: DOE.
DOE – EERE. (2012). SunShot Vision Study. DOE/GO-102012-303. Washington, D.C.: DOE.
DOE – EERE. (February 2014). 2014 Water Power Program Peer Review: Marine and Hydrokinetic Technologies, Compiled Presentations. Presented at the Department of Energy (DOE) 2014 Water Power Program Peer Review, 25-28 February 2014. Accessed February 2015: http://www.nrel.gov/docs/fy14osti/61854.pdf.
DOE. (2013). U.S. Energy Sector Vulnerabilities to Climate Change and Extreme Weather. DOE/PI-0013. Accessed December 2014: http://energy.gov/sites/prod/files/2013/07/f2/20130716-Energy%20Sector%20Vulnerabilities%20Report.pdf.
54
This report is available at no cost from the National Renewable Energy Laboratory (NREL) at www.nrel.gov/publications.
Devine-Wright, P.; Howes, Y. (2010). “Disruption to place attachment and the protection of restorative environments: A wind energy case study.” Journal of Environmental Psychology 30(3); pp. 271-280.
Dykes, K.; Platt, A.; Guo, Y.; Ning, A.; King, R.; Parsons, T.; Petch, D.; Veers, P.; Resor, B. (2014). Effect of Tip-Speed Constraints on the Optimized Design of a Wind Turbine. NREL/TP-5000-61726. Golden, CO: NREL. Accessed February 2015: http://www.nrel.gov/docs/fy15osti/61726.pdf.
Energy Research Center of the Netherlands (ECN). (2014). “O&M System Solution: Operational excellence for offshore wind farm operators.” Accessed November 2014: ftp://130.112.2.101/pub/www/library/report/2014/f14005.pdf.
Energy Information Administration (EIA). (2013). Annual Energy Outlook (AEO) 2013 with Projections to 2040. Washington, D.C.: EIA. Accessed December 2014: http://www.eia.gov/forecasts/aeo/pdf/0383(2013).pdf.
EIA. (2014a). Annual Energy Outlook (AEO) 2014 with Projections to 2040. DOE/EIA-0383(2014). Washington, D.C.: EIA. Accessed December 2014: http://www.eia.gov/forecasts/aeo/pdf/0383(2014).pdf.
EIA. (2014b). “How much U.S. electricity is generated from renewable energy?” Energy in Brief. Washington, DC: EIA. Accessed December 2014: http://www.eia.gov/energy_in_brief/article/renewable_electricity.cfm.
EIA. (2014c). “Levelized Cost and Levelized Avoided Cost of New Generation Resources in the Annual Energy Outlook 2014.” Washington, D.C.: EIA. Accessed December 2014: http://www.eia.gov/forecasts/aeo/electricity_generation.cfm.
EIA. (2014d). Short-term Energy Outlook. Accessed November 21, 2014: http://www.eia.gov/forecasts/steo/report/renew_co2.cfm.
EIA. (2014e). “Solar Photovoltaic Output Depends on Orientation, Tilt, and Tracking.” Accessed November 19, 2014: http://www.eia.gov/todayinenergy/detail.cfm?id=18871&utm_source=Sailthru&utm_medium=email&utm_term=Utility%20Dive&utm_campaign=Issue%3A%202014-11-19%20Utility%20Dive%20Newsletter.
Ela, E.; Gevorgian, V.; Fleming, P.; Zhang, Y. C.; Singh, M.; Muljadi, E.; Scholbrook, A.; Aho, J.; Buckspan, A.; Pao, L.; Singhvi, V.; Tuohy, A.; Pourbeik, P.; Brooks, D.; Bhatt, N. (2014). Active Power Controls from Wind Power: Bridging the Gaps. NREL/TP-5D00-60574. Golden, CO: NREL. Accessed February 2015: http://www.nrel.gov/docs/fy14osti/60574.pdf.
Environmental Protection Agency (EPA). (2013). “The Social Cost of Carbon.” Washington, D.C.: EPA. Accessed February 2015: http://www.epa.gov/climatechange/EPAactivities/economics/scc.html
55
This report is available at no cost from the National Renewable Energy Laboratory (NREL) at www.nrel.gov/publications.
Eurelectric. (2013). Power Statistics & Trends 2013. Brussels, Belgium: Eurelectric. Accessed December 2014: http://www2.warwick.ac.uk/fac/soc/csgr/green/foresight/energyenvironment/2013_eurelectric_power_statistics__trends_2013.pdf
European Photovoltaic Industry Association (EPIA). (2014). Global Market Outlook for Photovoltaics 2014-2018. Accessed December 6, 2014: http://www.epia.org/fileadmin/user_upload/Publications/44_epia_gmo_report_ver_17_mr.pdf.
European Wind Energy Association (EWEA). (2015). The European Offshore Wind Industry Key Trends and Statistics 2014. Accessed January 2015: http://www.ewea.org/fileadmin/files/library/publications/statistics/EWEA-European-Offshore-Statistics-2014.pdf.
Feldman, D.; Margolis, R.; Boff, D. (October 2014). “Q2/Q3 2014 Solar Industry Update.” SunShot Initiative. Presentation. October 31, 2014. U.S. Department of Energy.
Field, C.B.; Barros, V.R.; Mach, K.J.; Mastrandrea, M.D.; van Aalst, M.; Adger, W.N.; Yohe, G.W. (2014) “2014: Technical summary.” In Climate Change 2014: Impacts, Adaptation, and Vulnerability. Part A: Global and Sectoral Aspects. Contribution of Working Group II to the Fifth Assessment Report of the Intergovernmental Panel on Climate Change [Field, C.B., V.R. Barros, D.J. Dokken, K.J. Mach, M.D. Mastrandrea, T.E. Bilir, M. Chatterjee, K.L. Ebi, Y.O. Estrada, R.C. Genova, B. Girma, E.S. Kissel, A.N. Levy, S. MacCracken, P.R. Mastrandrea, and L.L.White (eds.)]. Cambridge, UK: Cambridge University Press.
Florita, A.; Hodge, B.M.; Milligan, M. (2012). Wind power forecasting error frequency analyses for operational power system studies. In 11th International Workshop on Large-Scale Integration of Wind Power in Power Systems Proceedings, Lisbon, Portugal.
Fraunhofer. (2013). Levelized Cost of Electricity: Renewable Energies. Fraunhofer Institut for Solar Energy Systems ISE. Freiburg, Germany. Accessed November 2014: http://www.ise.fraunhofer.de/en/publications/veroeffentlichungen-pdf-dateien-en/studien-und-konzeptpapiere/study-levelized-cost-of-electricity-renewable-energies.pdf.
Friedman, B.; Ardani, K.; Feldman, D.; Citron, R.; Margolis, R.; Zuboy, J. (2013). Benchmarking Non-Hardware Balance-of-System (Soft) Costs for U.S. Photovoltaic Systems, Using a Bottom-Up Approach and Installer Survey - Second Edition. NREL/TP-6A20-60412. Golden, CO: NREL. Accessed February 2015: http://www.nrel.gov/docs/fy14osti/60412.pdf.
Friedman, B.; Margolis, R.; Seel, J. (2014). Comparing Photovoltaic (PV) Costs and Deployment Drivers in the Japanese and U.S. Residential and Commercial Markets. NREL/TP-6A20-60360. Golden, CO: NREL. Accessed February 2015: http://www.nrel.gov/docs/fy14osti/60360.pdf.
General Electric Co. (GE). (2011). “GE FlexEfficiency* 50 Combined Cycle Power Plant Fact Sheet.” Accessed December 2014: http://www.ge.com/cn/energy/solutions/s5/FlexEfficiency50%20Combined%20Cycle%20Power%20Plant.pdf.
56
This report is available at no cost from the National Renewable Energy Laboratory (NREL) at www.nrel.gov/publications.
GeothermEx (International Finance Corporation [IFC]). (2013). Geothermal Exploration Best Practices: A Guide to Resource Data Collection, Analysis and Presentation for Geothermal Projects. Bochum, Germany: International Geothermal Association. Accessed December 2014: http://www.geothermie-zentrum.de/fileadmin/media/geothermiezentrum/Downloads/IFC-IGA_Geothermal_Exploration_Best_Practices-Final-publishedv2__JPG2_2-04-2013.pdf.
The Global Smart Grid Federation (GSGF). (2012). Global Smart Grid Federation Report. Accessed June 2013: http://www.ddline.fr/wp-content/uploads/2012/12/May31GSGF_report_digital_single.pdf.
Global Wind Energy Council (GWEC). (2014). Global Wind Report 2013 - Annual Market Update. Brussels, Belgium: GWEC. Accessed December 2014: http://www.gwec.net/publications/global-wind-report-2/global-wind-report-2013/
Goodrich, A.; James, T.; Woodhouse, M. (2012). Residential, Commercial, and Utility-Scale Photovoltaic (PV) System Prices in the United States: Current Drivers and Cost-Reduction Opportunities. NREL/TP-6A20-53347. Golden, CO: NREL.
Gross R.; Heptonstall P.; Blyth W. (2007). Investment in electricity generation: the role of costs, incentives, and risks.UK Energy Research Centre. Accessed December 2014: http://seg.fsu.edu/Library/Investment%20in%20Electricity%20Generation_%20The%20Role%20of%20Costs,%20Incentives,%20and%20Risks.pdf.
Gross, R.; Blyth W.; Heptonstall, P. (2009). “Risks, revenues and investment in electricity generation: Why policy needs to look beyond costs.” Energy Economics 32(4); pp. 786-804. Accessed December 2014: http://www.sciencedirect.com/science/article/pii/S0140988309001832.
Harvey, C.; Beardsmore, G.; Moeck, I.; Rüter, H.; Bauer, S. (2014). Best Practices Guide for Geothermal Exploration. 2nd ed. International Geothermal Association. Bochum, Germany: International Finance Corporation (IFC).
Heal, G. (2009). The Economics of Renewable Energy. National Bureau of Economic Research Working Paper 15081. Accessed November 2014: http://www.nber.org/papers/w15081.
Hodge, B. (December 2013). “The Value of Improved Wind Power Forecasting in the Western Interconnection.” Presented at European Wind Energy Association (EWEA) Wind Power Forecasting Technology Workshop, 4-5 December 2013, Rotterdam, Netherlands. Accessed February 2015: http://www.nrel.gov/docs/fy15osti/60980.pdf.
Hoen, B. (2012). “Research Investigating Wind Facility Effects On Nearby Property Values.” Berkeley, CA: LBNL. Accessed December 2014: http://kfw.wellscountywind.com/wp-content/uploads/2013/04/28_resp_propertyvalue_presentation.pdf.
Hoen, B.; Wiser, R.; Thayer, M.; Cappers, P. (2013). “Residential Photovoltaic Energy Systems in California: The Effect on Home Sales Prices.” Contemporary Economic Policy 31(4), pp. 708-718. Accessed December 2014: http://onlinelibrary.wiley.com/doi/10.1111/j.1465-7287.2012.00340.x/full.
57
This report is available at no cost from the National Renewable Energy Laboratory (NREL) at www.nrel.gov/publications.
Hong, L.; Zhou, N.; Fridley, D.; Raczkowski, C. (2013). Assessment of China’s renewable energy contribution during the 12th Five Year Plan. Energy Policy 62, pp. 1533-1543. Accessed December 2014: http://www.sciencedirect.com/science/article/pii/S0301421513007684.
Horbaty, R.; Huber, S. (2012). Final Report: IEA Wind Task 28 – Social Acceptance of Wind Energy Projects. International Energy Agency. Accessed May 2013: http://www. socialacceptance.ch/images/Task_28_final_report_2012.pdf.
Huertas, A. (2007). “Rising Temperatures Undermine Nuclear Power’s Promise.” Union of Concerned Scientists Backgrounder. Washington, DC: Union of Concerned Scientists.
Interagency Working Group on Social Cost of Carbon. (2013). Technical Support Document: Technical Update of the Social Cost of Carbon for Regulatory Impact Analysis- Under Executive Order 12866. Washington, D.C.: United States Government. Accessed February 2015: http://www.whitehouse.gov/sites/default/files/omb/assets/inforeg/technical-update-social-cost-of-carbon-for-regulator-impact-analysis.pdf
International Energy Agency (IEA). (2008). Integration of Demand Side Management, Distributed Generation, Renewable Energy Sources and Energy Storages: State of the Art Report. Finland: International Energy Agency Demand-Side Management Programme.
IEA. (2013). Renewable energy medium-term market report 2013: Market trends and projections to 2018. Paris, France: OECD/IEA. Accessed May 2013: http://www.iea.org/topics/renewables/medium-termrenewableenergymarketreport/.
IEA. (2014). World Energy Outlook. Paris, France: IEA. Accessed January 2015: http://www.worldenergyoutlook.org/publications/weo-2014/.
IEA Wind. (2013). 15. Ground-based Vertically-profiling Remote Sensing for Wind Resource Assessment. 1st ed. Accessed December 2014: http://www.ieawind.org/index_page_postings/RP/RP%2015_RemoteSensing_1stEd_8March2013.pdf
Intergovernmental Panel on Climate Change (IPCC). (2007). IPCC Assessment Report on Climate Prepared by Working Group III of the Intergovernmental Panel on Climate Change [B. Metz, O.R. Davidson, P.R. Bosch, R. Dave, L.A. Meyer (eds)]. Cambridge, UK: Cambridge University Press.
IPCC. (2011). IPCC Special Report on Renewable Energy Sources and Climate Change Mitigation (SRREN). Prepared by Working Group III of the Intergovernmental Panel on Climate Change [O. Edenhofer, R. Pichs-Madruga, Y. Sokona, K. Seyboth, P. Matschoss, S. Kadner, T. Zwickel, P. Eickemeier, G. Hansen, S. Schlömer, C. von Stechow (eds)]. Cambridge, UK: Cambridge University Press. Accessed May 2013: http://srren.ipcc-wg3.de/report.
International Renewable Energy Agency (IRENA) Secretariat. (2012). Renewable Power Generation Costs in 2012: An Overview. Abu Dhabi, United Arab Emirates: IRENA. Accessed December 2014: http://www.irena.org/DocumentDownloads/Publications/Overview_Renewable%20Power%20Generation%20Costs%20in%202012.pdf.
58
This report is available at no cost from the National Renewable Energy Laboratory (NREL) at www.nrel.gov/publications.
IRENA. (2014). Rethinking Energy: Towards a new power system. Abu Dhabi, United Arab Emirates: IRENA. Available at: http://www.irena.org/rethinking/Rethinking_FullReport_web_view.pdf.
IRENA. (2015). Renewable Power Generation Costs in 2014. Abu Dhabi, United Arab Emirates: IRENA. Accessed May 2014: http://www.irena.org/DocumentDownloads/Publications/IRENA_RE_Power_Costs_2014_report.pdf.
James, T.; Goodrich, A. (2013). Supply Chain and Blade Manufacturing Considerations in the Global Wind Industry. NREL/PR-6A20-60063. Golden, CO: NREL. Accessed February 2015: http://www.nrel.gov/docs/fy14osti/60063.pdf.
Jenkin, T.; Diakov, V.; Drury, E.; Bush, B.; Denholm, P.; Milford, J.; Arent, D.; Margolis, R.; Byrne, R. (2013). “Use of Solar and Wind as a Physical Hedge against Price Variability within a Generation Portfolio.” NREL TP-6A20-59065; Energy 76(1); pp. 663–672. Accessed September 2014: http://www.sciencedirect.com/science/article/pii/S0360544214009980.
Jimenez, T.; Tegen, S. (2015). Economic Impact from Large-Scale Deployment of Offshore Marine and Hydrokinetic Technology in Oregon. NREL/TP-5000-61727. Golden, CO: NREL. Accessed February 2015: http://www.nrel.gov/docs/fy15osti/61727.pdf.
Jorgenson, J.; Denholm, P.; Mehos, M. (2014). Estimating the Value of Utility-Scale Solar Technologies in California Under a 40% Renewable Portfolio Standard. NREL/TP-6A20-61685. Golden, CO: NREL. Accessed February 2015: http://www.nrel.gov/docs/fy14osti/61685.pdf
Jorgenson, J.; Denholm, P.; Mehos, M.; Turchi, C. (2013). Estimating the Performance and Economic Value of Multiple Concentrating Solar Power Technologies in a Production Cost Model. NREL/TP-6A20-58645. Golden, CO: NREL. Accessed February 2015: http://www.nrel.gov/docs/fy14osti/58645.pdf.
Kellert, S.R., ed. (1997). Macmillan Encyclopedia of the Environment. Vol. 3. New York: Macmillan Library Reference USA.
Kenny, J.F.; Barber, N.L.; Hutson, S.S.; Linsey, K.S.; Lovelace, J.K.; Maupin, M.A. (2009). Estimated Use of Water in the United States in 2005. U.S. Geological Survey Circular 1344. Reston, VA: USGS. Accessed December 2014: http://pubs.usgs.gov/circ/1344/pdf/c1344.pdf.
Khan, A. (2014). “Navigating the Shale Gale.” Utilities Unbundled #17. Ernst and Young. Accessed December 2014: http://www.ey.com/GL/en/Industries/Power---Utilities/EY-utilities-unbundled-issue-17-navigating-the-shale-gale.
Kroposki, B.; Garrett, B.; MacMillan, S.; Rice, B.; Komomua, C.; O’Malley, M.; Zimmerle, D. (2012). Energy Systems Integration: A Convergence of Ideas. NREL/TP-6A00-55649. Golden, CO: NREL. Accessed May 2013: http://www.nrel.gov/docs/fy12osti/55649.pdf.
59
This report is available at no cost from the National Renewable Energy Laboratory (NREL) at www.nrel.gov/publications.
Kumar, N.; Besuner, P.; Lefton, S.; Agan, D.; Hilleman, D. (2012). Power Plant Cycling Costs. NREL/SR-5500-455433. Golden, CO: NREL. Accessed May 2013: http://www.nrel.gov/docs/fy12osti/55433.pdf.
Lantz, E.; Wiser, R.; Hand, M. (2012). The Past and Future Cost of Wind Energy. NREL/TP-6A20-53510. Golden, CO: International Energy Agency Wind Implementing Agreement Task 26. Accessed May 2013: http://www.nrel.gov/docs/fy12osti/54526.pdf.
Lazard Ltd. (2014). Lazard’s Levelized Cost of Energy Analysis—version 8.0. New York, NY: Lazard Ltd. Accessed December 2014: http://www.lazard.com/PDF/Levelized%20Cost%20of%20Energy%20-%20Version%208.0.pdf.
Lee, A.; Zinaman, O.; Logan, J. (2012). Opportunities for Synergy Between Natural Gas and Renewable Energy in the Electric Power and Transportation Sectors. NREL/TP-6A50-56324. Golden, CO: NREL. Accessed May 2013: http://iea-retd.org/wp-content/uploads/2013/07/RE-ASSUME_IEA-RETD_2013.pdf.
Lew, D.; Brinkman, G.; Ibanez, E.; Florita, A.; Heaney, M.; Hodge, B. M.; Hummon, M.; Stark, G.; King, J.; Lefton, S. A.; Kumar, N.; Agan, D.; Jordan, G.; Venkataraman, S. (2013). Western Wind and Solar Integration Study Phase 2. NREL/TP-5500-55588. Accessed December 2014: http://www.nrel.gov/docs/fy13osti/55588.pdf.
Lew, D.; Milligan, M.; Jordan, G.; Piwko, R. (2011). Value of Wind Power Forecasting. NREL/CP-5500-50814. Golden, CO: NREL. Accessed February 2015: http://www.nrel.gov/docs/fy11osti/50814.pdf.
Li, K.; Bian, H.; Liu, C.; Zhang, D.; Yang, Y. (2015). Comparison of geothermal with solar and wind power generation systems. Renewable and Sustainable Energy Reviews 42; pp. 1464-1474.
Linvill, C.; Candelaria, J.; Elder, C. (2013). The Value of Geothermal Energy Generation Attributes: Aspen Report to Ormat Technologies. Aspen Environmental Group. Accessed December 2014: http://www.ormat.com/sites/default/files/Geothermal%20Valuation%20Project%20-%20February_2013.pdf
Logan, J.; Kaplan, S. (2008). Wind Power in the United States: Technology, Economic, and Policy Issues. Congressional Research Service. Report RL34546. Accessed June 2013: http:// digitalcommons.unl.edu/crsdocs/58/.
Logan, J.; Luo, D. (1999). Natural gas and China’s environment. In “Presentation, IEA-China Conference on Natural Gas Industry, Beijing.” Accessed May 2013: http://www.globalchange.umd.edu/data/publications/jl9918.pdf.
Macknick, J.; Newmark, R.; Heath, G.; Hallett, K.C. (2012a). “Operational water consumption and withdrawal factors for electricity generating technologies: a review of existing literature.” Environmental Research Letters 7(4); pp. 045802.
60
This report is available at no cost from the National Renewable Energy Laboratory (NREL) at www.nrel.gov/publications.
Macknick, J.; Sattler, S.; Averyt, K.; Clemmer, S.; Rogers, J. (2012b). “The water implications of generating electricity: water use across the United States based on different electricity pathways through 2050.” Environmental Research Letters 7(4); pp. 045803. Accessed November 2014: http://iopscience.iop.org/1748-9326/7/4/045803/article.
Mai, T.; Mulcahy, D.; Hand, M.; & Baldwin, S. (2014). “Envisioning a renewable electricity future for the United States.” Energy 65; pp. 374-386.
Marquis, M.; Wilczak, J.; Ahlstrom, M.; Sharp, J.; Stern, A.; Smith, J.C.; Calvert, S. (2011). “Forecasting the wind to reach significant penetration levels of wind energy.” Bulletin of the American Meteorological Society 92(9); pp. 1159-1171.
Matus, K.; Nam, K. M.; Selin, N. E.; Lamsal, L. N.; Reilly, J. M.; Paltsev, S. (2012). “Health damages from air pollution in China.” Global Environmental Change 22(1); pp. 55-66.
Maupin, M.A.; Kenny, J.F.; Hutson, S.S.; Lovelace, J.K.; Barber, N.L.; Linsey, K.S. (2014). Estimated use of water in the United States in 2010. U.S. Geological Survey Circular 1405. Reston, VA: USGS. Accessed December 2014: http://dx.doi.org/10.3133/cir1405.
Medina, P.; Bizuayehu, A.W.; Catalão, J.P.S.; Rodrigues, E.M.G.; Contreras, J. (2014). “Electrical Energy Storage Systems: Technologies’ State-of-the-Art, Techno-economic Benefits and Applications Analysis.” System Sciences (HICSS), 2014 47th Hawaii International Conference pp. 2295, 2304.
Meldrum, J.; Nettles-Anderson, S.; Heath, G.; Macknick, J. (2013). “Life cycle water use for electricity generation: a review and harmonization of literature estimates.” Environmental Research Letters 8(1). Accessed December 2014: http://iopscience.iop.org/1748-9326/8/1/015031.
Milligan, M.; Ela, E.; Hodge, B. M.; Kirby, B.; Lew, D.; Clark, C.; DeCesaro, J.; Lynn, K. (2011). Cost-Causation and Integration Cost Analysis for Variable Generation. NREL/TP-5500-51860. Golden, CO: NREL. Accessed February 2015: http://www.nrel.gov/docs/fy11osti/51860.pdf
Ministry of Commerce of the People’s Republic of China. (2013). “2014 China PV Industry Development Outlook.” Accessed December 2014: http://www.mofcom.gov.cn/article/hyxx/jidian/201312/20131200435023.shtml
Ministry of Commerce of the People’s Republic of China. (2014). “2013 China's Additional PV Capacity Ranks Global No. 1 for the First Time.” Accessed December 2014: http://acs.mofcom.gov.cn/sites/aqzn/aqjxnr.jsp?contentId=2790010033990
Musial, W.; Ram, B. (2010). Large-Scale Offshore Wind Power in the United States: Assessment of Opportunities and Barriers. NREL/TP-500-40745. Accessed May 2013: http://www.nrel.gov/docs/fy10osti/40745.pdf.
National Bureau of Statistics (NBS) of People’s Republic of China. (2014). China Statistical Yearbook 2013. Beijing, China: National Bureau of Statistics.
61
This report is available at no cost from the National Renewable Energy Laboratory (NREL) at www.nrel.gov/publications.
National Renewable Energy Laboratory (NREL). (2011a). Charge Dynamics Breakthrough May Improve Organic-Based PV Device Efficiencies. NREL/FS-5900-50858. Golden, CO: NREL. Accessed February 2015: http://www.nrel.gov/docs/fy11osti/50858.pdf.
National Renewable Energy Laboratory (NREL). (2011b). Eastern Wind Integration and Transmission Study (EWITS) (Revised). NREL/SR-5500-47078. Golden, CO: NREL. Accessed May 2013: http://www.nrel.gov/docs/fy11osti/47078.pdf.
NREL. (2012a). Renewable Electricity Futures Study. Hand, M.M.; Baldwin, S.; DeMeo, E.; Reilly, J.M.; Mai, T.; Arent, D.; Porro, G.; Meshek, M.; Sandor, D., eds. NREL/TP-6A20-52409. Golden, CO: NREL. Accessed May 2013: http://www.nrel.gov/analysis/re_futures/.
NREL. (2012b). New Fabrication Method Improves the Efficiency and Economics of Solar Cells. NREL/FS-5900-53386. Golden, CO: NREL. Accessed February 2015: http://www.nrel.gov/docs/fy12osti/53386.pdf.
NREL. (2013a). NREL Innovations Help Drive Wind Industry Transformation. NREL/FS-6A42-59014. Golden, CO: NREL. Accessed February 2015: http://www.nrel.gov/docs/fy13osti/59014.pdf.
NREL. (2013b.) Quantum Dots Promise to Significantly Boost Solar Cell Efficiencies. NREL/FS-6A42-59015. Golden, CO: NREL. Accessed February 2015: http://www.nrel.gov/docs/fy13osti/59015.pdf.
NREL. (2014a). 2013 Renewable Energy Data Book. DOE/GO-102014-4491. Golden, CO: NREL. Accessed January 2015: http://www.nrel.gov/docs/fy15osti/62580.pdf.
NREL. (2014b). “Wind Resource Assessment.” Accessed November 2014: http://www.nrel.gov/wind/resource_assessment.html
NREL. (2014c). Advanced Inverter Functions to Support High Levels of Distributed Solar: Policy and Regulatory Considerations. NREL/BR-6A20-62612. Golden, CO: NREL. Accessed February 2015: http://www.nrel.gov/docs/fy15osti/62612.pdf.
NREL (2014d). Advancing Concentrating Solar Power Research. NREL/FS-5500-61278. Golden, CO: NREL. Accessed February 2015: http://www.nrel.gov/docs/fy14osti/61278.pdf.
NREL. (2014e). Making Sustainable Energy Choices: Insights on the Energy/Water/Land Nexus. Analysis Insights, October 2014. NREL/TP-6A20-62566. Golden, CO: NREL. http://www.nrel.gov/docs/fy15osti/62566.pdf.
NREL. (2015). “Annual Technology Baseline (ATB) Spreadsheet.” Accessed February 2015: http://www.nrel.gov/analysis/data_tech_baseline.html.
Natural Resources Defense Council (NRDC). (2014). The True Cost of Coal in 2012. New York: NRDC.
62
This report is available at no cost from the National Renewable Energy Laboratory (NREL) at www.nrel.gov/publications.
National Energy Technology Laboratory (NETL). (2009). Impact of Drought on U.S. Steam Electric Power Plant Cooling Water Intakes and Related Water Resource Management Issues. DOE/NETL-2009/1364. Pittsburgh, PA: U.S Department of Energy, National Energy Technology Laboratory.
Navigant Consulting. (2014a). “Microgrid Deployment Tracker 2Q14.” Boulder, CO: Navigant Research. Accessed December 2014: http://www.navigantresearch.com/research/microgrid-deployment-tracker-2q14
Navigant Consulting Co. (2014b). World Market Update 2013: International Wind Energy Development Forecast 2014-28. Boulder, CO: Navigant Research. Accessed December 2014: http://www.navigantresearch.com/research/world-market-update-2013
Neises, T.; Turchi, C. (2014). “Comparison of Supercritical Carbon Dioxide Power Cycle Configurations with an Emphasis on CSP Applications.” Energy Procedia (49); pp. 1187–1196. Accessed February 2015: http://dx.doi.org/10.1016/j.egypro.2014.03.128.
Nemet, G.F. (2006). “Beyond the Learning Curve: Factors Influencing Cost Reductions in Photovoltaics.” Energy Policy (34:17); pp. 3218-3232.
Ou, X.; Yan, X.; & Zhang, X., 2011. “Life-cycle energy consumption and greenhouse gas emissions for electricity generation and supply in China.” Energy Policy 88: 289-297.
Philibert, C.; International Energy Agency (IEA). (2014). 2014 IEA Technology Roadmap: Solar Photovoltaic Energy. Paris, France: OECD/IEA.
Phillips, B.R.; Ziagos, J.; Thorsteinsson, H.; Hass, E. (2013). “A Roadmap for Strategic Development of Geothermal Exploration Technologies.” Proceedings, Thirty-Eighth Workshop on Geothermal Reservoir Engineering Stanford University, Stanford, CA. Accessed December 2014: http://www.geothermal-energy.org/pdf/IGAstandard/SGW/2013/Phillips.pdf
Porter, K.; Fink, S.; Buckley, M.; Rogers, J.; Hodge, B.M. (2013). A Review of Variable Generation Integration Charges. NREL/TP-5500-57583.
pvXchange. (2014). “Price Index.” Accessed November 16, 2014: http://pvxchange.com/default.aspx?langTag=en-GB.
Quandl. (2014). “Germany Natural Gas Price.” Accessed December 2014: https://www.quandl.com/ODA/PNGASEU_USD-Germany-Natural-Gas-Price.
Register, C. (2014). “Solar Continues Trumping Fossil Fuel Pricing, With More Innovations To Come.” Forbes.com. Accessed November 7, 2014: http://www.forbes.com/sites/chipregister1/2014/09/11/solar-continues-trumping-fossil-fuel-pricing-with-more-innovations-to-come/.
Renewable Energy Policy Network for the 21st Century (REN21). (2014). Renewables 2014 Global Status Report. Paris, France: REN21 c/o UNEP. Accessed January 2015: http://www.ren21.net/portals/0/documents/resources/gsr/2014/gsr2014_full%20report_low%20res.pdf.
63
This report is available at no cost from the National Renewable Energy Laboratory (NREL) at www.nrel.gov/publications.
REN21. (2013). Renewables 2013 Global Futures Report. Paris, France: REN21 c/o UNEP. Accessed January 2015: http://www.ren21.net/portals/0/documents/resources/gsr/2013/gsr2013_lowres.pdf.
Richter, C.; Teske, S.; Short, R. (2009). “Concentrating solar power global outlook 09.” Greenpeace International/European Solar Thermal Electricity Association (ESTELA)/IEA SolarPACES, Report. Accessed January 2015: http://www.estelasolar.eu/fileadmin/ESTELAdocs/documents/Greenpeace_Concentrating_Solar_Power_2009.pdf.
Robichaud, R. (July 2014). “Wind Technologies and Evolving Opportunities.” Presented at Energy 2014: Technical Training and Technology Showcase. Accessed February 2015: http://www.nrel.gov/docs/fy14osti/62435.pdf.
Roques, F. A.; Nuttall, W. J.; Newbery, D. M.; de Neufville, R.; Connors, S. (2006). “Nuclear power: a hedge against uncertain gas and carbon prices?” The Energy Journal pp. 1-23.
Rosen, D.; Houser, T. (2007). China Energy: A Guide for the Perplexed. Peterson Institute for International Economics. Accessed December 2014: http://www.petersoninstitute.org/publications/papers/rosen0507.pdf.
Sathaye, J.; Lucon, O.; Rahman, A.; Christensen, J.; Denton, F.; Fujino, J.; Shmakin, A. (2011). “Renewable Energy in the Context of Sustainable Development.” In IPCC Special Report on Renewable Energy Sources and Climate Change Mitigation [O. Edenhofer, R. Pichs-Madruga, Y. Sokona, K. Seyboth, P. Matschoss, S. Kadner, T. Zwickel, P. Eickemeier, G. Hansen, S. Schlömer, C. von Stechow (eds.)]. Cambridge, UK: Cambridge University Press.
Sioshansi, F. (2011). Smart Grid: Integrating Renewable, Distributed and Efficient Energy. 1st ed. Elsevier Inc. Accessed May 2013: http://store.elsevier.com/Smart-Grid/isbn-9780123864529/.
Smil, V. (2010). Energy Transitions: History, Requirements, Prospects. Santa Barbara, CA: ABC-CLIO.
Solar Energy Industries Association (SEIA)/GTM Research. (2014). U.S. Solar Market Insight: 2013 Year-in-Review. Washington, D.C.: SEIA. Accessed February 2015: http://www.seia.org/research-resources/solar-market-insight-report-2013-year-review.
Spence, D. (2012). Energy Management Brief: Is It Time for Federal Regulation of Shale Gas Production? Austin, TX: Energy Management and Innovation Center, McCombs School of Business, University of Texas at Austin. Accessed February 2015: http://www.mccombs.utexas.edu/~/media/Files/MSB/Centers/EMIC/Briefs/Energy-Brief-Is-It-Time-for-Federal-Regulation-of-Shale-Gas-Production.pdf
State Council Office. (2014). “能源发展战略行动计划(2014-2020年) (Energy Development Strategic Action Plan 2014-2020).” The State Council of the People’s Republic of China. Accessed December 2014: http://www.gov.cn/zhengce/content/2014-11/19/content_9222.htm.
64
This report is available at no cost from the National Renewable Energy Laboratory (NREL) at www.nrel.gov/publications.
The Transparent Cost Database (TCDB). (2014Retrieved from: http://energy.gov/sites/prod/files/2013/07/f2/20130716-Energy%20Sector%20Vulnerabilities%20Report.pdf
Turchi, C.S.; Ma, Z. (2014). “Co-Located Gas Turbine/Solar Thermal Hybrid Designs for Power Production.” Renewable Energy (64); pp. 172–179. Accessed February 2015: http://dx.doi.org/10.1016/j.renene.2013.11.005.
Wang, Z. (2014). “中国风电弃风限电分析报告(China Wind Abandonment and Curtailment Research Report).” Energy 4; pp. 42-46.
Wilkinson, W. (2014). “Residential Solar Energy Storage Market to grow by Factor of 10 from 2014 to 2018.” IHS Technology. Accessed November 17, 2014: https://technology.ihs.com/515746/residential-solar-energy-storage-market-to-grow-by-factor-of-10-from-2014-to-2018
Wilson, R. (2013). “Low Capacity Factors: Challenges for a Low Carbon Energy Transition.” The Energy Collective. Accessed December 2014: http://theenergycollective.com/robertwilson190/288846/low-capacity-factors-challenge-low-carbon-energy-transition.
Wiser, R; Bolinger, M. (2014). 2013 Wind Technologies Market Report. DOE/GO-102014-4459. Washington, D.C.: DOE. Accessed December 2014: http://emp.lbl.gov/sites/all/files/2013_Wind_Technologies_Market_Report_Final3.pdf.
World Bank. (2013). China 2030: Building a Modern, Harmonious, and Creative Society. Joint publication of the World Bank and The Development Research Centre of the State Council (PRC). Accessed December 2014: http://www.worldbank.org/content/dam/Worldbank/document/China-2030-complete.pdf.
Worldwatch Institute. (2013). “U.S. Renewable Energy Growth Accelerates.” Accessed November 21, 2014: http://www.worldwatch.org/node/5855.
Xinhua. (2013). “金太阳工程年内正式结束 骗补横行曾饱受诟病 (Golden Sun Projects to be determined by the end of the year; prevalent scams caused criticism).” Beijing Business Today. Accessed May 2014: http://news.xinhuanet.com/2013-10/10/c_125504749.htm.
Xinhua. (2014). “可再生能源配额制出台在即 指标完不成将追责 (Renewable portfolio standards to be establish; not meeting targets will be held accountable).” Xinhua News Agency. Accessed December 2014: http://news.xinhuanet.com/energy/2014-09/24/c_1112604322.htm.
Zhao, X.; Zhang, S.; Yang, R.; & Wang, M. (2012). “Constraints on the effective utilization of wind power in China: An illustration from the northeast China grid.” Renewable and Sustainable Energy Reviews 16; pp. 4508-4514.
Zhao, Y.; Wang, S.; Duan, L.; Lei, Y.; Cao, P.; Hao, J. (2008). “Primary air pollutant emissions of coal-fired power plants in China: Current status and future prediction.” Atmospheric Environment 42(36); pp. 8442-8452.
65
This report is available at no cost from the National Renewable Energy Laboratory (NREL) at www.nrel.gov/publications.
Zipp, K. (2012). “Understanding Costs for Large Wind-Turbine Drivetrains.” Windpower Engineering & Development. Accessed December 6, 2014: http://www.windpowerengineering.com/design/mechanical/understanding-costs-for-large-wind-turbine-drivetrains/.
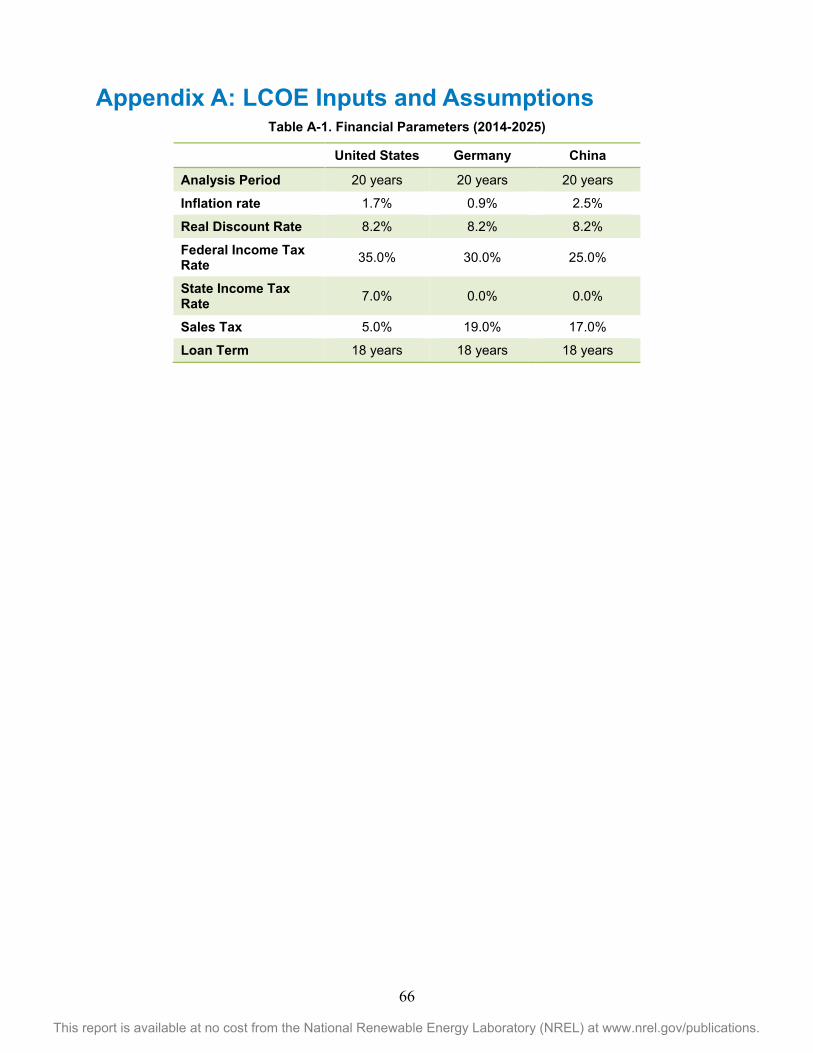
66
This report is available at no cost from the National Renewable Energy Laboratory (NREL) at www.nrel.gov/publications.
Appendix A: LCOE Inputs and Assumptions Table A-1. Financial Parameters (2014-2025)
United States Germany China
Analysis Period 20 years 20 years 20 years
Inflation rate 1.7% 0.9% 2.5%
Real Discount Rate 8.2% 8.2% 8.2%
Federal Income Tax Rate 35.0% 30.0% 25.0%
State Income Tax Rate 7.0% 0.0% 0.0%
Sales Tax 5.0% 19.0% 17.0%
Loan Term 18 years 18 years 18 years
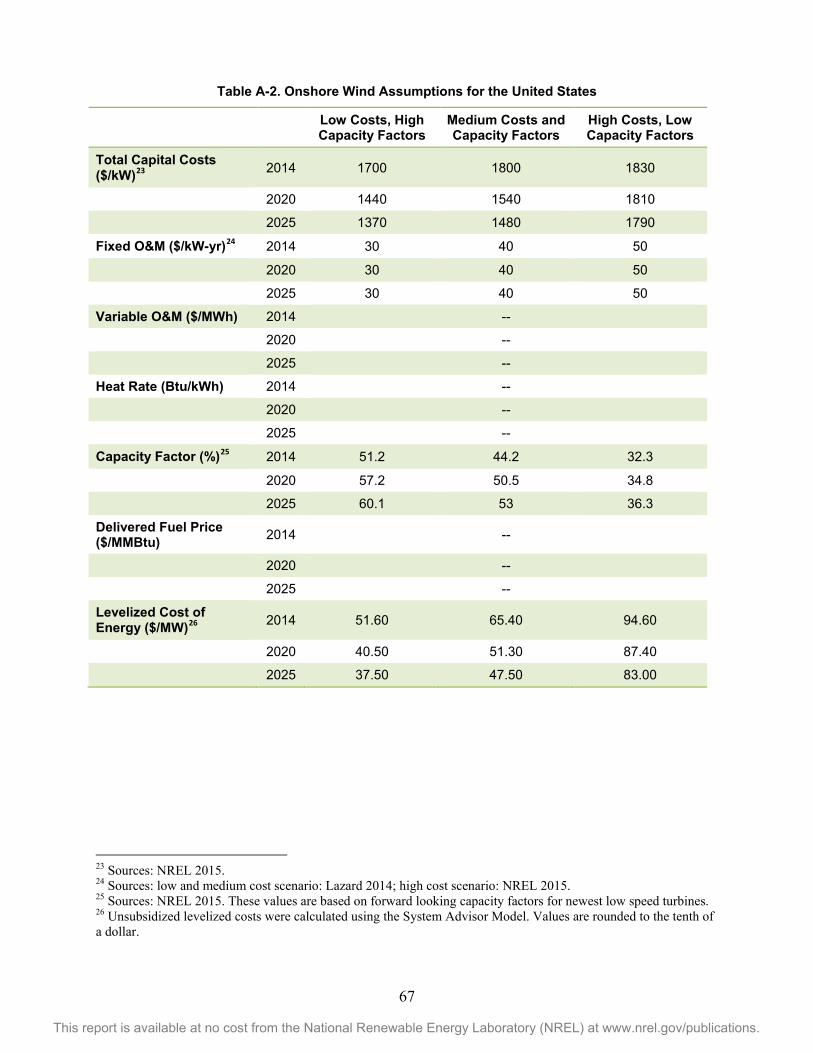
67
This report is available at no cost from the National Renewable Energy Laboratory (NREL) at www.nrel.gov/publications.
Table A-2. Onshore Wind Assumptions for the United States
Low Costs, High Capacity Factors
Medium Costs and Capacity Factors
High Costs, Low Capacity Factors
Total Capital Costs ($/kW)23 2014 1700 1800 1830
2020 1440 1540 1810
2025 1370 1480 1790
Fixed O&M ($/kW-yr)24 2014 30 40 50
2020 30 40 50
2025 30 40 50
Variable O&M ($/MWh) 2014 --
2020 --
2025 --
Heat Rate (Btu/kWh) 2014 --
2020 --
2025 --
Capacity Factor (%)25 2014 51.2 44.2 32.3
2020 57.2 50.5 34.8
2025 60.1 53 36.3
Delivered Fuel Price ($/MMBtu) 2014 --
2020 --
2025 --
Levelized Cost of Energy ($/MW)26 2014 51.60 65.40 94.60
2020 40.50 51.30 87.40
2025 37.50 47.50 83.00
23 Sources: NREL 2015. 24 Sources: low and medium cost scenario: Lazard 2014; high cost scenario: NREL 2015. 25 Sources: NREL 2015. These values are based on forward looking capacity factors for newest low speed turbines. 26 Unsubsidized levelized costs were calculated using the System Advisor Model. Values are rounded to the tenth of a dollar.
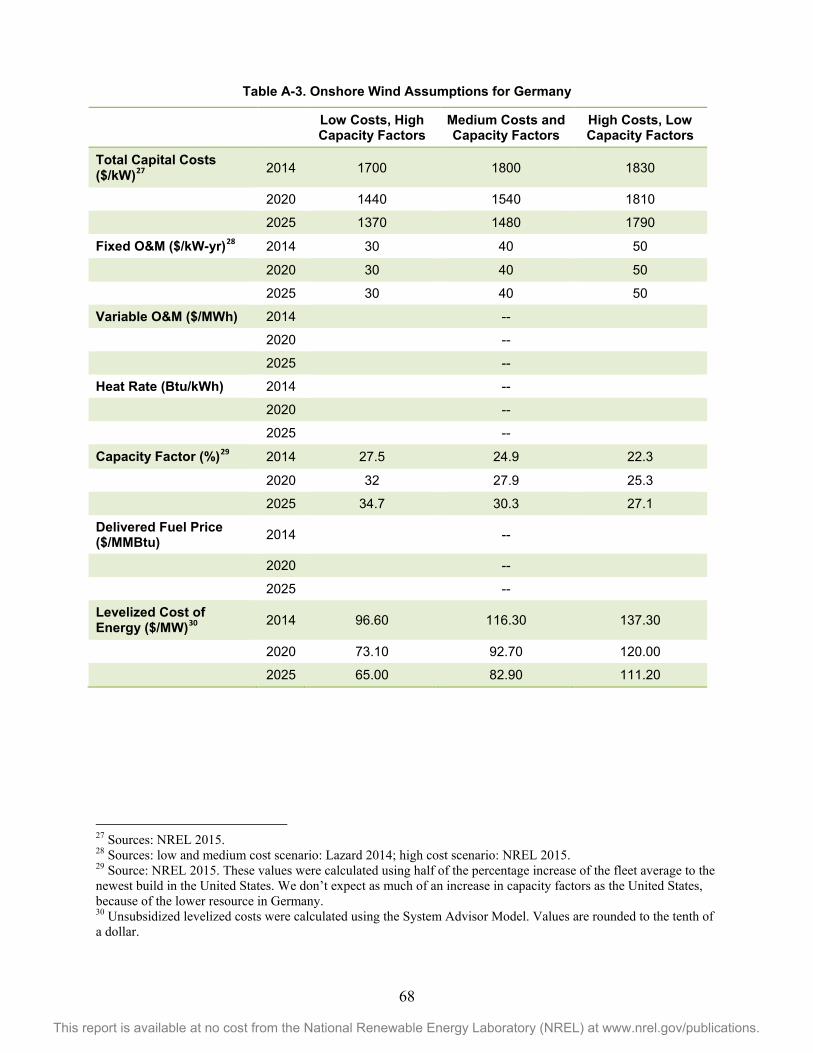
68
This report is available at no cost from the National Renewable Energy Laboratory (NREL) at www.nrel.gov/publications.
Table A-3. Onshore Wind Assumptions for Germany
Low Costs, High Capacity Factors
Medium Costs and Capacity Factors
High Costs, Low Capacity Factors
Total Capital Costs ($/kW)27 2014 1700 1800 1830
2020 1440 1540 1810
2025 1370 1480 1790
Fixed O&M ($/kW-yr)28 2014 30 40 50
2020 30 40 50
2025 30 40 50
Variable O&M ($/MWh) 2014 --
2020 --
2025 --
Heat Rate (Btu/kWh) 2014 --
2020 --
2025 --
Capacity Factor (%)29 2014 27.5 24.9 22.3
2020 32 27.9 25.3
2025 34.7 30.3 27.1
Delivered Fuel Price ($/MMBtu) 2014 --
2020 --
2025 --
Levelized Cost of Energy ($/MW)30 2014 96.60 116.30 137.30
2020 73.10 92.70 120.00
2025 65.00 82.90 111.20
27 Sources: NREL 2015. 28 Sources: low and medium cost scenario: Lazard 2014; high cost scenario: NREL 2015. 29 Source: NREL 2015. These values were calculated using half of the percentage increase of the fleet average to the newest build in the United States. We don’t expect as much of an increase in capacity factors as the United States, because of the lower resource in Germany. 30 Unsubsidized levelized costs were calculated using the System Advisor Model. Values are rounded to the tenth of a dollar.
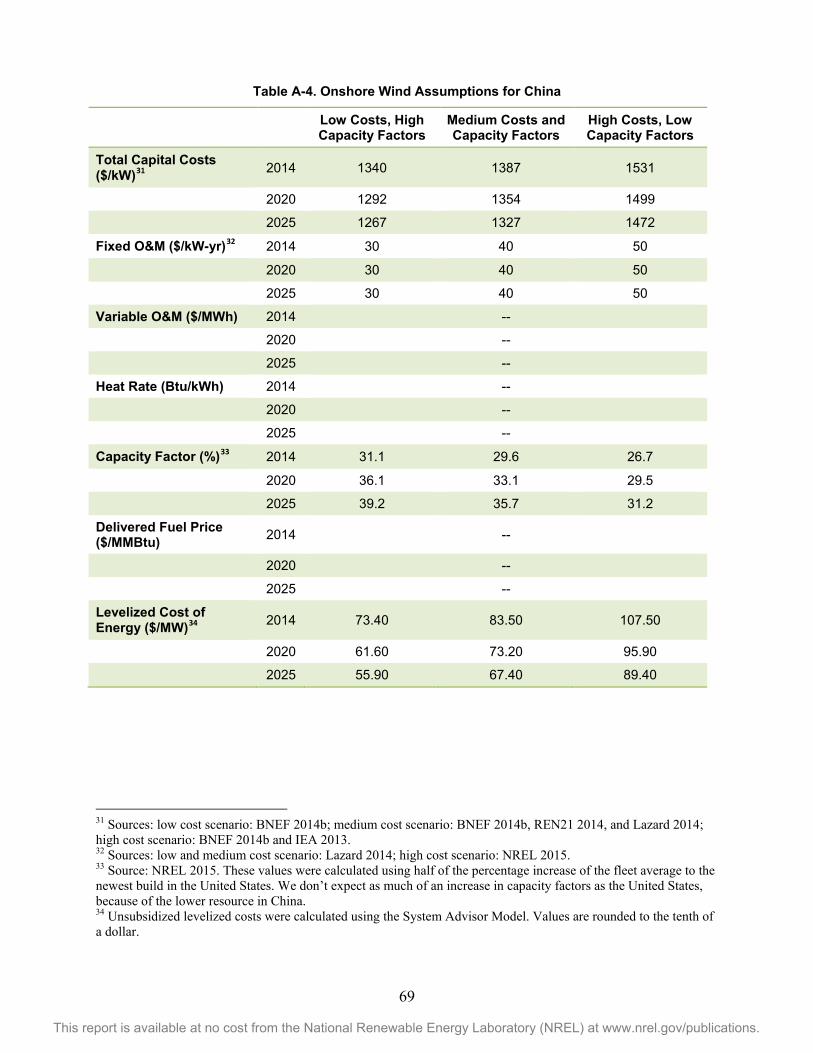
69
This report is available at no cost from the National Renewable Energy Laboratory (NREL) at www.nrel.gov/publications.
Table A-4. Onshore Wind Assumptions for China
Low Costs, High Capacity Factors
Medium Costs and Capacity Factors
High Costs, Low Capacity Factors
Total Capital Costs ($/kW)31 2014 1340 1387 1531
2020 1292 1354 1499
2025 1267 1327 1472
Fixed O&M ($/kW-yr)32 2014 30 40 50
2020 30 40 50
2025 30 40 50
Variable O&M ($/MWh) 2014 --
2020 --
2025 --
Heat Rate (Btu/kWh) 2014 --
2020 --
2025 --
Capacity Factor (%)33 2014 31.1 29.6 26.7
2020 36.1 33.1 29.5
2025 39.2 35.7 31.2
Delivered Fuel Price ($/MMBtu) 2014 --
2020 --
2025 --
Levelized Cost of Energy ($/MW)34 2014 73.40 83.50 107.50
2020 61.60 73.20 95.90 2025 55.90 67.40 89.40
31 Sources: low cost scenario: BNEF 2014b; medium cost scenario: BNEF 2014b, REN21 2014, and Lazard 2014; high cost scenario: BNEF 2014b and IEA 2013. 32 Sources: low and medium cost scenario: Lazard 2014; high cost scenario: NREL 2015. 33 Source: NREL 2015. These values were calculated using half of the percentage increase of the fleet average to the newest build in the United States. We don’t expect as much of an increase in capacity factors as the United States, because of the lower resource in China. 34 Unsubsidized levelized costs were calculated using the System Advisor Model. Values are rounded to the tenth of a dollar.
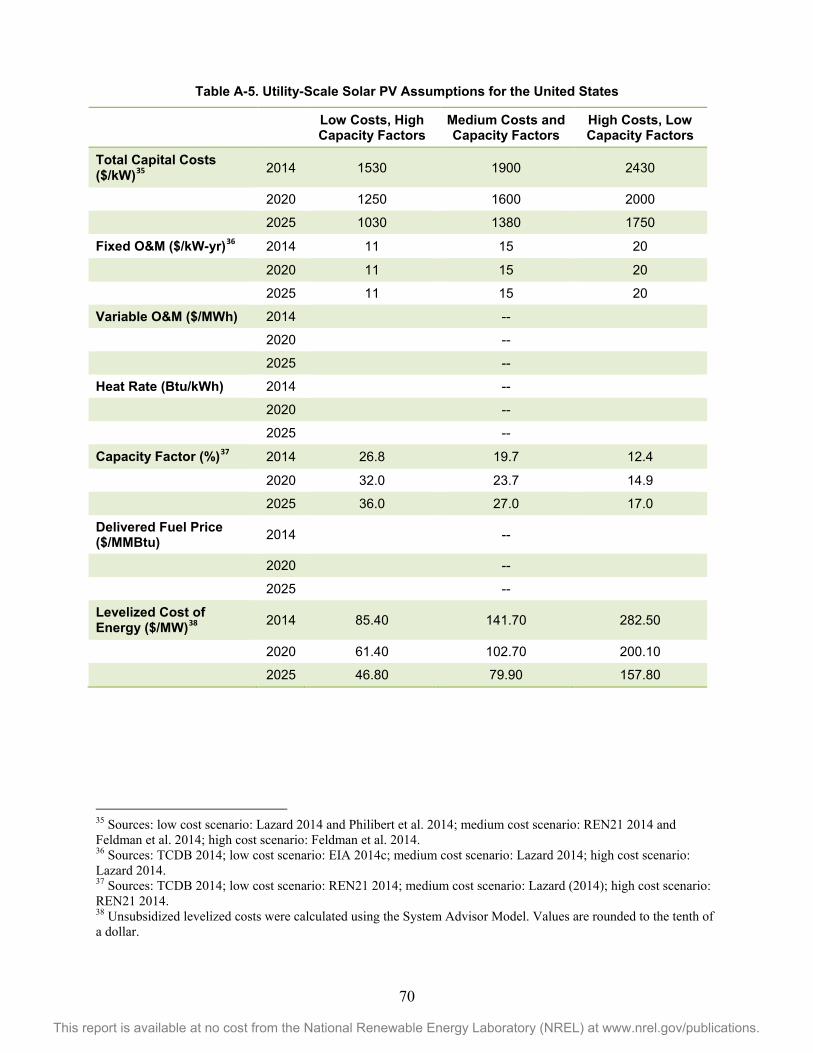
70
This report is available at no cost from the National Renewable Energy Laboratory (NREL) at www.nrel.gov/publications.
Table A-5. Utility-Scale Solar PV Assumptions for the United States
Low Costs, High Capacity Factors
Medium Costs and Capacity Factors
High Costs, Low Capacity Factors
Total Capital Costs ($/kW)35 2014 1530 1900 2430
2020 1250 1600 2000
2025 1030 1380 1750
Fixed O&M ($/kW-yr)36 2014 11 15 20
2020 11 15 20
2025 11 15 20
Variable O&M ($/MWh) 2014 --
2020 --
2025 --
Heat Rate (Btu/kWh) 2014 --
2020 --
2025 --
Capacity Factor (%)37 2014 26.8 19.7 12.4
2020 32.0 23.7 14.9
2025 36.0 27.0 17.0
Delivered Fuel Price ($/MMBtu) 2014 --
2020 --
2025 --
Levelized Cost of Energy ($/MW)38 2014 85.40 141.70 282.50
2020 61.40 102.70 200.10
2025 46.80 79.90 157.80
35 Sources: low cost scenario: Lazard 2014 and Philibert et al. 2014; medium cost scenario: REN21 2014 and Feldman et al. 2014; high cost scenario: Feldman et al. 2014. 36 Sources: TCDB 2014; low cost scenario: EIA 2014c; medium cost scenario: Lazard 2014; high cost scenario: Lazard 2014. 37 Sources: TCDB 2014; low cost scenario: REN21 2014; medium cost scenario: Lazard (2014); high cost scenario: REN21 2014. 38 Unsubsidized levelized costs were calculated using the System Advisor Model. Values are rounded to the tenth of a dollar.
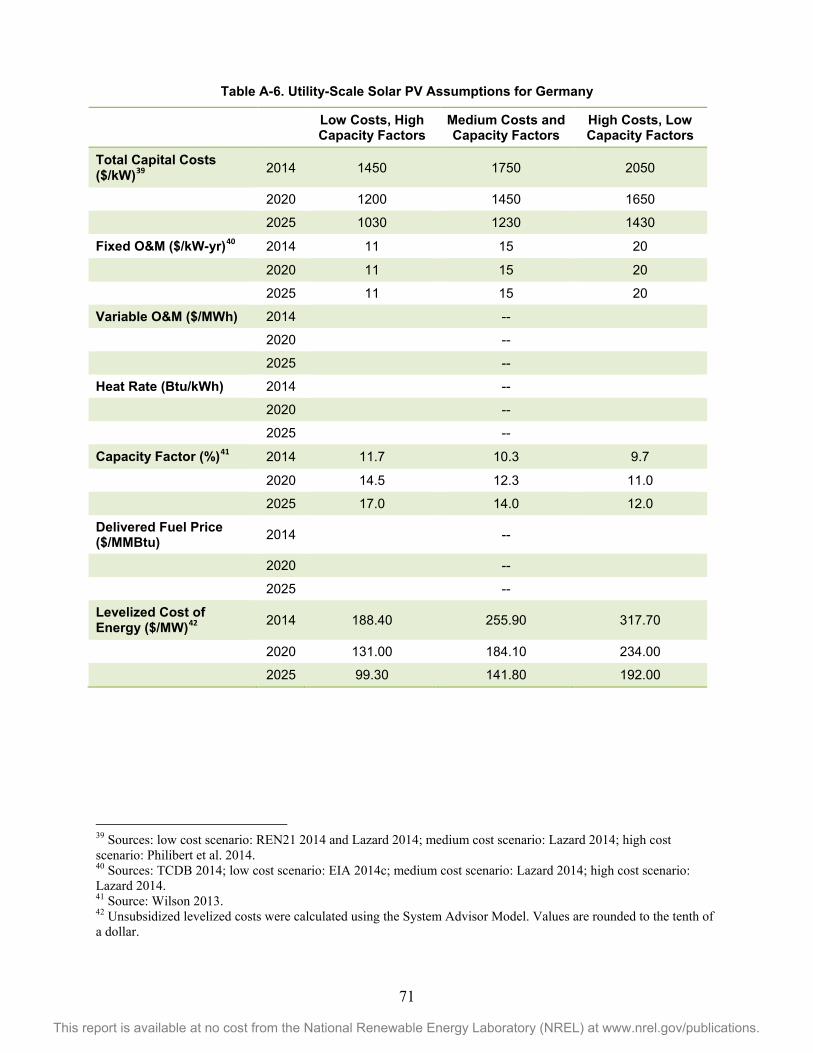
71
This report is available at no cost from the National Renewable Energy Laboratory (NREL) at www.nrel.gov/publications.
Table A-6. Utility-Scale Solar PV Assumptions for Germany
Low Costs, High Capacity Factors
Medium Costs and Capacity Factors
High Costs, Low Capacity Factors
Total Capital Costs ($/kW)39 2014 1450 1750 2050
2020 1200 1450 1650
2025 1030 1230 1430
Fixed O&M ($/kW-yr)40 2014 11 15 20
2020 11 15 20
2025 11 15 20
Variable O&M ($/MWh) 2014 --
2020 --
2025 --
Heat Rate (Btu/kWh) 2014 --
2020 --
2025 --
Capacity Factor (%)41 2014 11.7 10.3 9.7
2020 14.5 12.3 11.0
2025 17.0 14.0 12.0
Delivered Fuel Price ($/MMBtu) 2014 --
2020 --
2025 --
Levelized Cost of Energy ($/MW)42 2014 188.40 255.90 317.70
2020 131.00 184.10 234.00
2025 99.30 141.80 192.00
39 Sources: low cost scenario: REN21 2014 and Lazard 2014; medium cost scenario: Lazard 2014; high cost scenario: Philibert et al. 2014. 40 Sources: TCDB 2014; low cost scenario: EIA 2014c; medium cost scenario: Lazard 2014; high cost scenario: Lazard 2014. 41 Source: Wilson 2013. 42 Unsubsidized levelized costs were calculated using the System Advisor Model. Values are rounded to the tenth of a dollar.
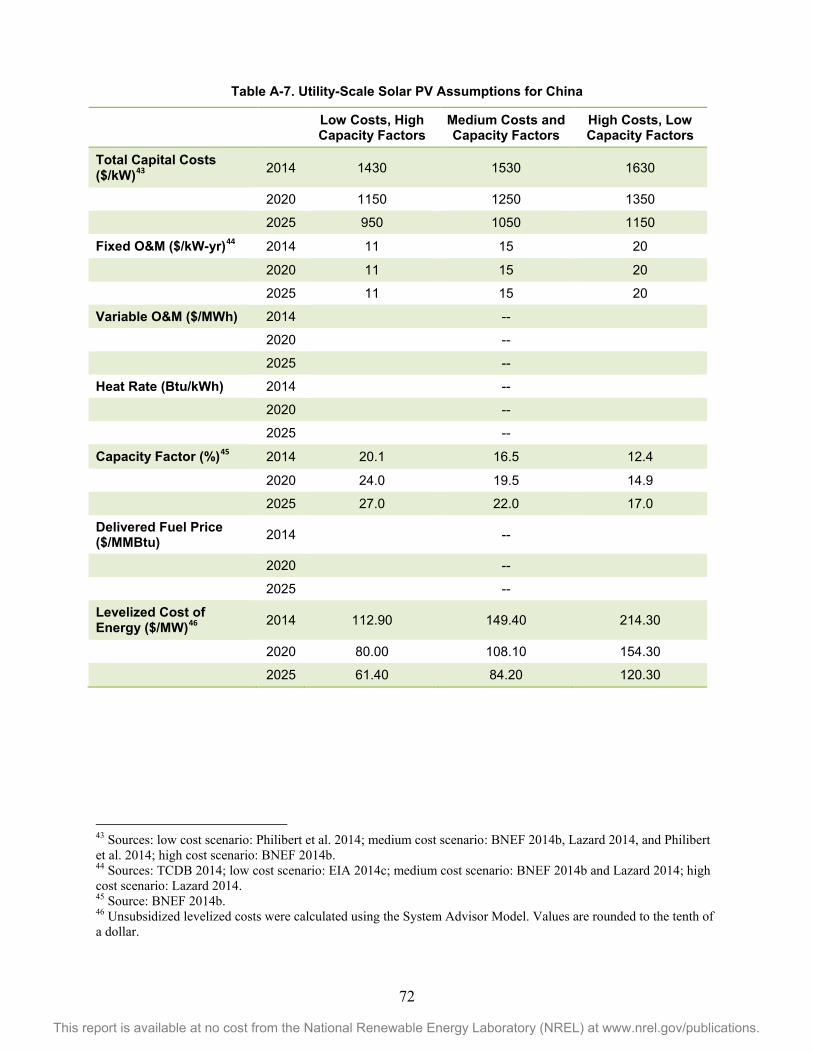
72
This report is available at no cost from the National Renewable Energy Laboratory (NREL) at www.nrel.gov/publications.
Table A-7. Utility-Scale Solar PV Assumptions for China
Low Costs, High Capacity Factors
Medium Costs and Capacity Factors
High Costs, Low Capacity Factors
Total Capital Costs ($/kW)43 2014 1430 1530 1630
2020 1150 1250 1350
2025 950 1050 1150
Fixed O&M ($/kW-yr)44 2014 11 15 20
2020 11 15 20
2025 11 15 20
Variable O&M ($/MWh) 2014 --
2020 --
2025 --
Heat Rate (Btu/kWh) 2014 --
2020 --
2025 --
Capacity Factor (%)45 2014 20.1 16.5 12.4
2020 24.0 19.5 14.9
2025 27.0 22.0 17.0
Delivered Fuel Price ($/MMBtu) 2014 --
2020 --
2025 --
Levelized Cost of Energy ($/MW)46 2014 112.90 149.40 214.30
2020 80.00 108.10 154.30
2025 61.40 84.20 120.30
43 Sources: low cost scenario: Philibert et al. 2014; medium cost scenario: BNEF 2014b, Lazard 2014, and Philibert et al. 2014; high cost scenario: BNEF 2014b. 44 Sources: TCDB 2014; low cost scenario: EIA 2014c; medium cost scenario: BNEF 2014b and Lazard 2014; high cost scenario: Lazard 2014. 45 Source: BNEF 2014b. 46 Unsubsidized levelized costs were calculated using the System Advisor Model. Values are rounded to the tenth of a dollar.
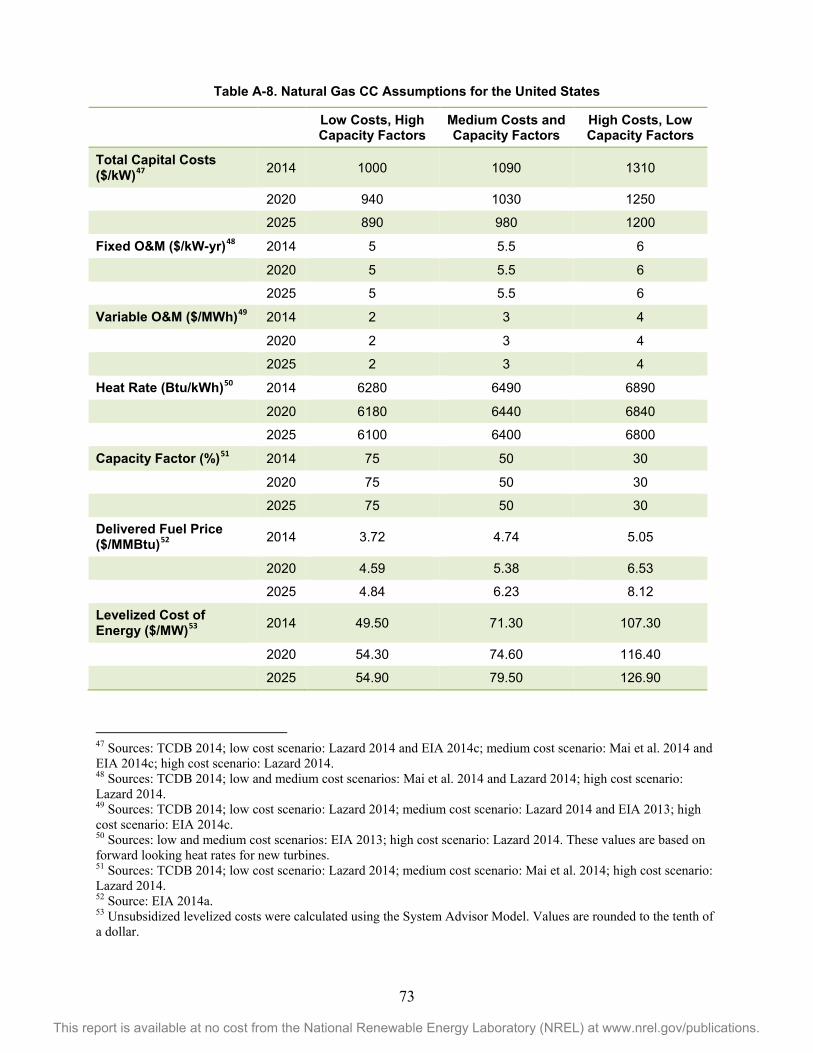
73
This report is available at no cost from the National Renewable Energy Laboratory (NREL) at www.nrel.gov/publications.
Table A-8. Natural Gas CC Assumptions for the United States
Low Costs, High Capacity Factors
Medium Costs and Capacity Factors
High Costs, Low Capacity Factors
Total Capital Costs ($/kW)47 2014 1000 1090 1310
2020 940 1030 1250
2025 890 980 1200
Fixed O&M ($/kW-yr)48 2014 5 5.5 6
2020 5 5.5 6
2025 5 5.5 6
Variable O&M ($/MWh)49 2014 2 3 4
2020 2 3 4
2025 2 3 4
Heat Rate (Btu/kWh)50 2014 6280 6490 6890
2020 6180 6440 6840
2025 6100 6400 6800
Capacity Factor (%)51 2014 75 50 30
2020 75 50 30
2025 75 50 30
Delivered Fuel Price ($/MMBtu)52 2014 3.72 4.74 5.05
2020 4.59 5.38 6.53
2025 4.84 6.23 8.12
Levelized Cost of Energy ($/MW)53 2014 49.50 71.30 107.30
2020 54.30 74.60 116.40
2025 54.90 79.50 126.90
47 Sources: TCDB 2014; low cost scenario: Lazard 2014 and EIA 2014c; medium cost scenario: Mai et al. 2014 and EIA 2014c; high cost scenario: Lazard 2014. 48 Sources: TCDB 2014; low and medium cost scenarios: Mai et al. 2014 and Lazard 2014; high cost scenario: Lazard 2014. 49 Sources: TCDB 2014; low cost scenario: Lazard 2014; medium cost scenario: Lazard 2014 and EIA 2013; high cost scenario: EIA 2014c. 50 Sources: low and medium cost scenarios: EIA 2013; high cost scenario: Lazard 2014. These values are based on forward looking heat rates for new turbines. 51 Sources: TCDB 2014; low cost scenario: Lazard 2014; medium cost scenario: Mai et al. 2014; high cost scenario: Lazard 2014. 52 Source: EIA 2014a. 53 Unsubsidized levelized costs were calculated using the System Advisor Model. Values are rounded to the tenth of a dollar.
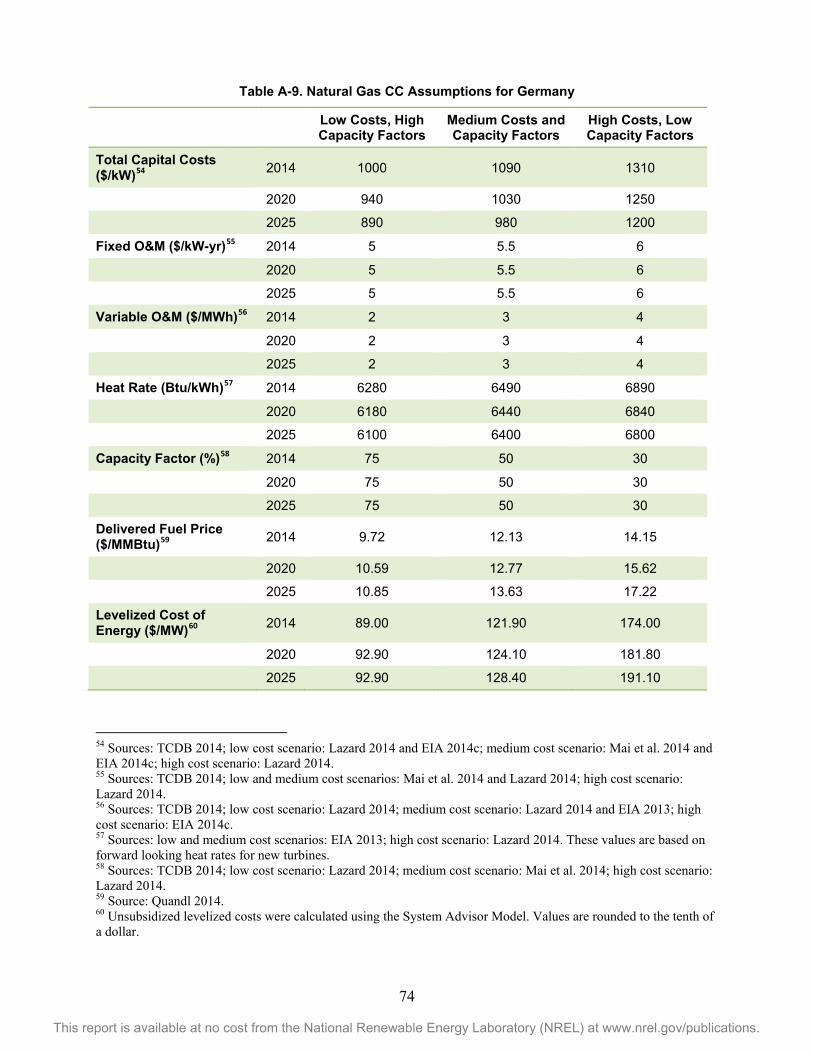
74
This report is available at no cost from the National Renewable Energy Laboratory (NREL) at www.nrel.gov/publications.
Table A-9. Natural Gas CC Assumptions for Germany
Low Costs, High Capacity Factors
Medium Costs and Capacity Factors
High Costs, Low Capacity Factors
Total Capital Costs ($/kW)54 2014 1000 1090 1310
2020 940 1030 1250
2025 890 980 1200
Fixed O&M ($/kW-yr)55 2014 5 5.5 6
2020 5 5.5 6
2025 5 5.5 6
Variable O&M ($/MWh)56 2014 2 3 4
2020 2 3 4
2025 2 3 4
Heat Rate (Btu/kWh)57 2014 6280 6490 6890
2020 6180 6440 6840
2025 6100 6400 6800
Capacity Factor (%)58 2014 75 50 30
2020 75 50 30
2025 75 50 30
Delivered Fuel Price ($/MMBtu)59 2014 9.72 12.13 14.15
2020 10.59 12.77 15.62
2025 10.85 13.63 17.22
Levelized Cost of Energy ($/MW)60 2014 89.00 121.90 174.00
2020 92.90 124.10 181.80
2025 92.90 128.40 191.10
54 Sources: TCDB 2014; low cost scenario: Lazard 2014 and EIA 2014c; medium cost scenario: Mai et al. 2014 and EIA 2014c; high cost scenario: Lazard 2014. 55 Sources: TCDB 2014; low and medium cost scenarios: Mai et al. 2014 and Lazard 2014; high cost scenario: Lazard 2014. 56 Sources: TCDB 2014; low cost scenario: Lazard 2014; medium cost scenario: Lazard 2014 and EIA 2013; high cost scenario: EIA 2014c. 57 Sources: low and medium cost scenarios: EIA 2013; high cost scenario: Lazard 2014. These values are based on forward looking heat rates for new turbines. 58 Sources: TCDB 2014; low cost scenario: Lazard 2014; medium cost scenario: Mai et al. 2014; high cost scenario: Lazard 2014. 59 Source: Quandl 2014. 60 Unsubsidized levelized costs were calculated using the System Advisor Model. Values are rounded to the tenth of a dollar.
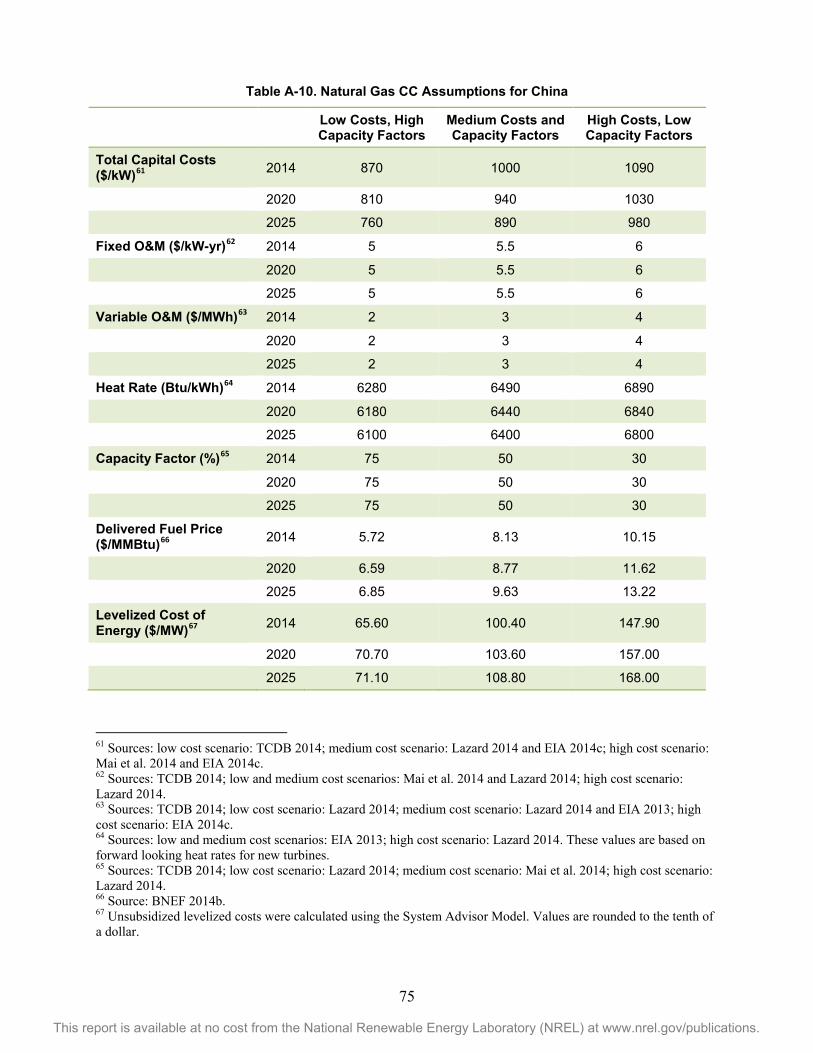
75
This report is available at no cost from the National Renewable Energy Laboratory (NREL) at www.nrel.gov/publications.
Table A-10. Natural Gas CC Assumptions for China
Low Costs, High Capacity Factors
Medium Costs and Capacity Factors
High Costs, Low Capacity Factors
Total Capital Costs ($/kW)61 2014 870 1000 1090
2020 810 940 1030
2025 760 890 980
Fixed O&M ($/kW-yr)62 2014 5 5.5 6
2020 5 5.5 6
2025 5 5.5 6
Variable O&M ($/MWh)63 2014 2 3 4
2020 2 3 4
2025 2 3 4
Heat Rate (Btu/kWh)64 2014 6280 6490 6890
2020 6180 6440 6840
2025 6100 6400 6800
Capacity Factor (%)65 2014 75 50 30
2020 75 50 30
2025 75 50 30
Delivered Fuel Price ($/MMBtu)66 2014 5.72 8.13 10.15
2020 6.59 8.77 11.62
2025 6.85 9.63 13.22
Levelized Cost of Energy ($/MW)67 2014 65.60 100.40 147.90
2020 70.70 103.60 157.00
2025 71.10 108.80 168.00
61 Sources: low cost scenario: TCDB 2014; medium cost scenario: Lazard 2014 and EIA 2014c; high cost scenario: Mai et al. 2014 and EIA 2014c. 62 Sources: TCDB 2014; low and medium cost scenarios: Mai et al. 2014 and Lazard 2014; high cost scenario: Lazard 2014. 63 Sources: TCDB 2014; low cost scenario: Lazard 2014; medium cost scenario: Lazard 2014 and EIA 2013; high cost scenario: EIA 2014c. 64 Sources: low and medium cost scenarios: EIA 2013; high cost scenario: Lazard 2014. These values are based on forward looking heat rates for new turbines. 65 Sources: TCDB 2014; low cost scenario: Lazard 2014; medium cost scenario: Mai et al. 2014; high cost scenario: Lazard 2014. 66 Source: BNEF 2014b. 67 Unsubsidized levelized costs were calculated using the System Advisor Model. Values are rounded to the tenth of a dollar.

76
This report is available at no cost from the National Renewable Energy Laboratory (NREL) at www.nrel.gov/publications.
Table A-11. Coal Assumptions for the United States
Low Costs, High Capacity Factors
Medium Costs and Capacity Factors
High Costs, Low Capacity Factors
Total Capital Costs ($/kW)68 2014 1920 2930 3780
2020 1900 2910 3760
2025 1880 2890 3740
Fixed O&M ($/kW-yr)69 2014 40 50 60
2020 40 50 60
2025 40 50 60
Variable O&M ($/MWh)70 2014 4 5 7
2020 4 5 7
2025 4 5 7
Heat Rate (Btu/kWh)71 2014 8750 9750 10750
2020 8750 9750 10750
2025 8750 9750 10750
Capacity Factor (%)72 2014 85 75 65
2020 85 75 65
2025 85 75 65
Delivered Fuel Price ($/MMBtu)73 2014 2.20 2.63 3.01
2020 2.22 2.98 3.76
2025 2.13 3.14 4.31
Levelized Cost of Energy ($/MW)74 2014 62.80 93.60 129.60
2020 62.70 97.30 139.10
2025 61.40 98.80 145.60
68 Sources: low cost scenario: TCDB 2014; medium cost scenario: TCDB 2014, Lazard 2014, and EIA 2013; high cost scenario: EIA 2013. 69 Sources: TCDB 2014; low cost scenario: EIA 2013 and Lazard 2014; medium cost scenario: EIA 2013; high cost scenario: EIA 2013. 70 Sources: TCDB 2014; low cost scenario: EIA 2013 and Lazard 2014; medium cost scenario: EIA 2013, Mai et al. 2014, and Lazard 2014; high cost scenario: EIA 2013 and Mai et al. 2014. 71 Sources: low cost scenario: EIA 2013 and Lazard 2014; medium cost scenario: EIA 2013; high cost scenario: EIA 2013 and Lazard 2014. 72 Sources: TCDB 2014; low cost scenario: EIA 2014c; medium cost scenario: Mai et al. 2014; high cost scenario: Mai et al. 2014. 73 Source: EIA 2014a. 74 Unsubsidized levelized costs were calculated using the System Advisor Model. Values are rounded to the tenth of a dollar.
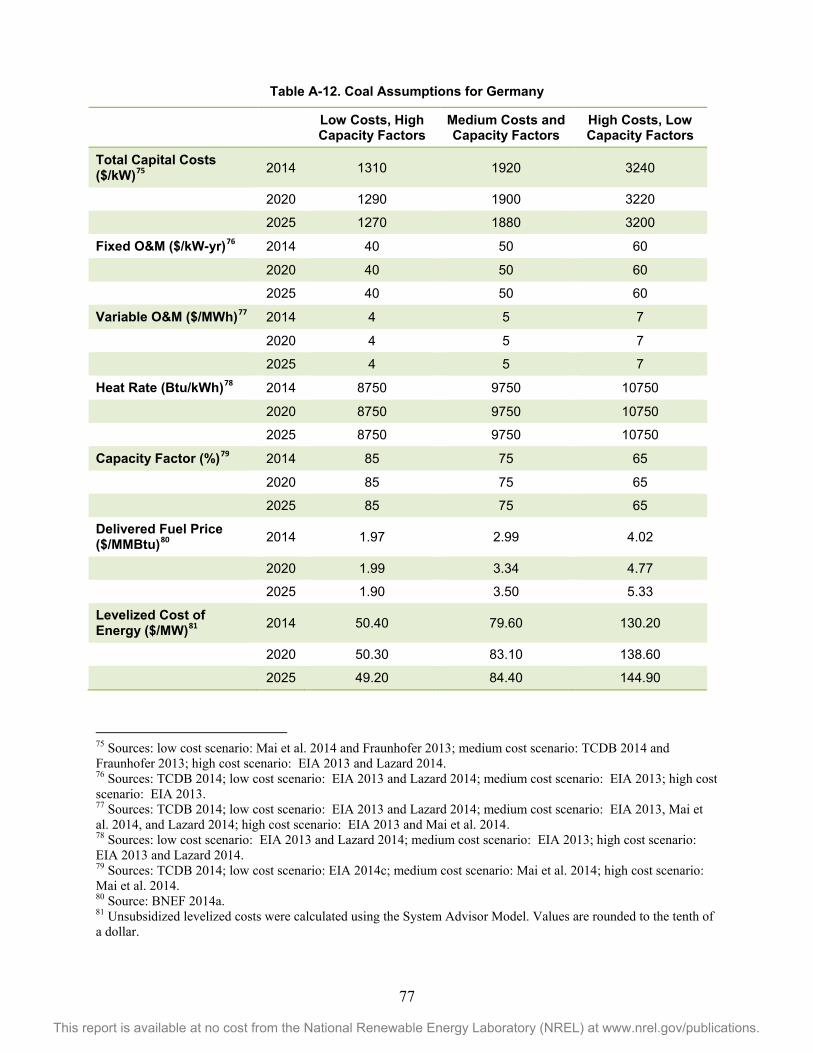
77
This report is available at no cost from the National Renewable Energy Laboratory (NREL) at www.nrel.gov/publications.
Table A-12. Coal Assumptions for Germany
Low Costs, High Capacity Factors
Medium Costs and Capacity Factors
High Costs, Low Capacity Factors
Total Capital Costs ($/kW)75 2014 1310 1920 3240
2020 1290 1900 3220
2025 1270 1880 3200
Fixed O&M ($/kW-yr)76 2014 40 50 60
2020 40 50 60
2025 40 50 60
Variable O&M ($/MWh)77 2014 4 5 7
2020 4 5 7
2025 4 5 7
Heat Rate (Btu/kWh)78 2014 8750 9750 10750
2020 8750 9750 10750
2025 8750 9750 10750
Capacity Factor (%)79 2014 85 75 65
2020 85 75 65
2025 85 75 65
Delivered Fuel Price ($/MMBtu)80 2014 1.97 2.99 4.02
2020 1.99 3.34 4.77
2025 1.90 3.50 5.33
Levelized Cost of Energy ($/MW)81 2014 50.40 79.60 130.20
2020 50.30 83.10 138.60
2025 49.20 84.40 144.90
75 Sources: low cost scenario: Mai et al. 2014 and Fraunhofer 2013; medium cost scenario: TCDB 2014 and Fraunhofer 2013; high cost scenario: EIA 2013 and Lazard 2014. 76 Sources: TCDB 2014; low cost scenario: EIA 2013 and Lazard 2014; medium cost scenario: EIA 2013; high cost scenario: EIA 2013. 77 Sources: TCDB 2014; low cost scenario: EIA 2013 and Lazard 2014; medium cost scenario: EIA 2013, Mai et al. 2014, and Lazard 2014; high cost scenario: EIA 2013 and Mai et al. 2014. 78 Sources: low cost scenario: EIA 2013 and Lazard 2014; medium cost scenario: EIA 2013; high cost scenario: EIA 2013 and Lazard 2014. 79 Sources: TCDB 2014; low cost scenario: EIA 2014c; medium cost scenario: Mai et al. 2014; high cost scenario: Mai et al. 2014. 80 Source: BNEF 2014a. 81 Unsubsidized levelized costs were calculated using the System Advisor Model. Values are rounded to the tenth of a dollar.
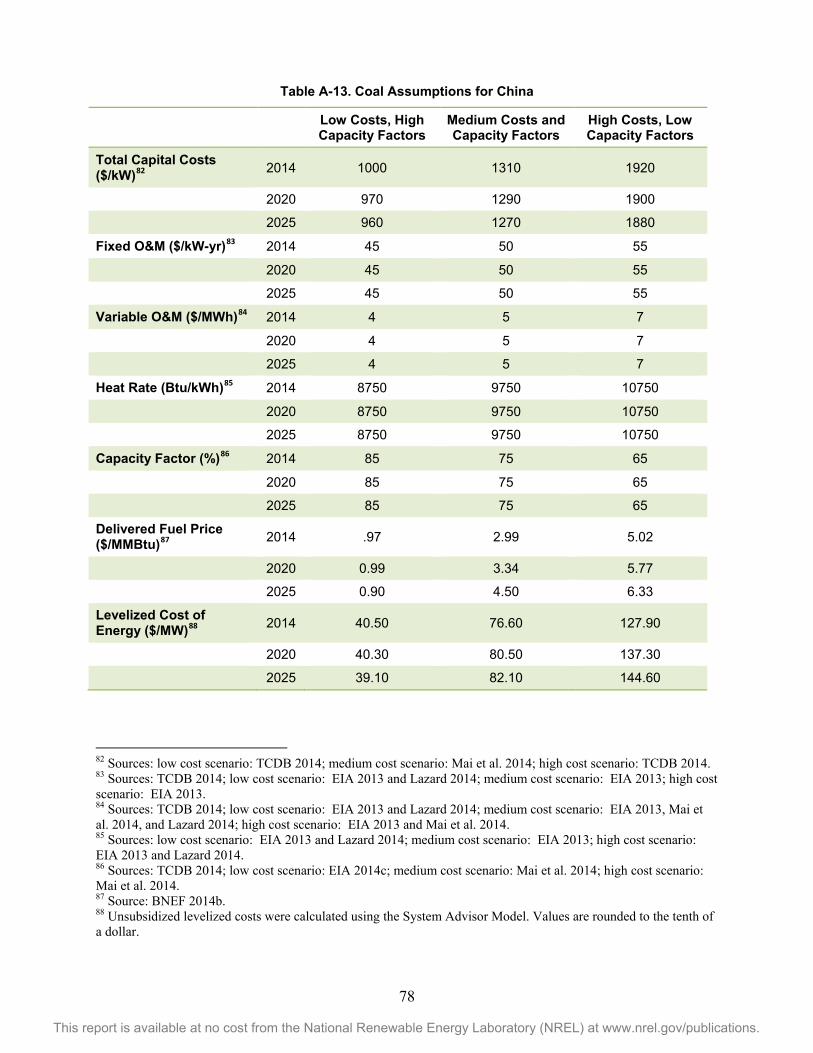
78
This report is available at no cost from the National Renewable Energy Laboratory (NREL) at www.nrel.gov/publications.
Table A-13. Coal Assumptions for China
Low Costs, High Capacity Factors
Medium Costs and Capacity Factors
High Costs, Low Capacity Factors
Total Capital Costs ($/kW)82 2014 1000 1310 1920
2020 970 1290 1900
2025 960 1270 1880
Fixed O&M ($/kW-yr)83 2014 45 50 55
2020 45 50 55
2025 45 50 55
Variable O&M ($/MWh)84 2014 4 5 7
2020 4 5 7
2025 4 5 7
Heat Rate (Btu/kWh)85 2014 8750 9750 10750
2020 8750 9750 10750
2025 8750 9750 10750
Capacity Factor (%)86 2014 85 75 65
2020 85 75 65
2025 85 75 65
Delivered Fuel Price ($/MMBtu)87 2014 .97 2.99 5.02
2020 0.99 3.34 5.77
2025 0.90 4.50 6.33
Levelized Cost of Energy ($/MW)88 2014 40.50 76.60 127.90
2020 40.30 80.50 137.30
2025 39.10 82.10 144.60
82 Sources: low cost scenario: TCDB 2014; medium cost scenario: Mai et al. 2014; high cost scenario: TCDB 2014. 83 Sources: TCDB 2014; low cost scenario: EIA 2013 and Lazard 2014; medium cost scenario: EIA 2013; high cost scenario: EIA 2013. 84 Sources: TCDB 2014; low cost scenario: EIA 2013 and Lazard 2014; medium cost scenario: EIA 2013, Mai et al. 2014, and Lazard 2014; high cost scenario: EIA 2013 and Mai et al. 2014. 85 Sources: low cost scenario: EIA 2013 and Lazard 2014; medium cost scenario: EIA 2013; high cost scenario: EIA 2013 and Lazard 2014. 86 Sources: TCDB 2014; low cost scenario: EIA 2014c; medium cost scenario: Mai et al. 2014; high cost scenario: Mai et al. 2014. 87 Source: BNEF 2014b. 88 Unsubsidized levelized costs were calculated using the System Advisor Model. Values are rounded to the tenth of a dollar.
79
This report is available at no cost from the National Renewable Energy Laboratory (NREL) at www.nrel.gov/publications.
Appendix B: Supplemental References Wind Energy American Wind Energy Association (AWEA). (2015). U.S. Wind Industry Fourth Quarter 2014 Market Report. Accessed January 2015: http://awea.files.cms-plus.com/4Q2014%20AWEA%20Market%20Report%20Public%20Version.pdf.
Global Wind Energy Council (GWEC). (2013). “Global Wind Statistics 2013.” Accessed December 2014: http://www.gwec.net/global-figures/graphs/.
GWEC. (2014). Global Wind Energy Outlook 2014. Accessed December 2014: http://www.gwec.net/wp-content/uploads/2014/10/GWEO2014_WEB.pdf.
Musial, W.; Ram, B. (2010). Large-Scale Offshore Wind Power in the United States: Assessment of Opportunities and Barriers. NREL/TP-500-40745. Accessed May 2013: http://www.nrel.gov/docs/fy10osti/40745.pdf.
Navigant Consulting Co. (2014). Offshore Wind Market and Economic Analysis: 2014 Annual Market Assessment. Chicago, IL: Navigant. Accessed December 2014: http://energy.gov/sites/prod/files/2014/09/f18/2014%20Navigant%20Offshore%20Wind%20Market%20&%20Economic%20Analysis.pdf
Singh, M.; Santoso, S. (2011). Dynamic Models for Wind Turbines and Wind Power Plants. NREL/SR-5500-52780. Golden, CO: NREL. Accessed December 2014: http://www.nrel.gov/docs/fy12osti/52780.pdf.
Solar Photovoltaic Energy Parida, B.; Iniyan, S.; Goic, R. (2011). “A Review of Solar Photovoltaic Technologies.” Renewable and Sustainable Energy Reviews 15(3); pp. 1625-1636.
Razykov, T.M.; Ferekides, C.S.; Morel, D.; Stefanakos, E.; Ullal, H.S.; Upadhyaya, H.M. (2011). “Solar photovoltaic electricity: Current status and future prospects.” Solar Energy 85(8); pp. 1580-1608.
Tyagi, V.V.; Rahim, N.A.; Rahim, N.A.; Jeyraj, A.; Selvaraj, L. (2013). “Progress in solar PV technology: research and achievement.” Renewable and Sustainable Energy Reviews 20; pp. 443-461. Accessed December 2014: http://www.sciencedirect.com/science/article/pii/S1364032112005291.
El Chaar, L.; El Zein, N. (2011). “Review of photovoltaic technologies.” Renewable and Sustainable Energy Reviews 15(5); pp. 2165-2175. Accessed May 2013: http://www.sciencedirect.com/science/article/pii/S1364032111000050.
Concentrating Solar Power Stekli, J.; Irwin, L.; Pitchumani, R. (2013). “Technical Challenges and Opportunities for Concentrating Solar Power with Thermal Energy Storage.” Journal of Thermal Science and Engineering Application 5(2).
80
This report is available at no cost from the National Renewable Energy Laboratory (NREL) at www.nrel.gov/publications.
Kolb, G.J. (2011). An Evaluation of Possible Next-Generation High-Temperature Molten-Salt Power Towers. SAND2011-9320. Albuquerque, NM: SNL. Accessed May 2013: http://prod.sandia.gov/techlib/access-control.cgi/2011/119320.pdf.
Baharoon, D.A.; Rahman, H.A.; Omar, W.Z.W.; Fadhl, S.O. (2015). “Historical development of concentrating solar power technologies to generate clean electricity efficiently – A review.” Renewable and Sustainable Energy Reviews 41; pp. 996–1027.
Geothermal Energy Massachusetts Institute of Technology (MIT). (2006). The Future of Geothermal Energy: Impact of Enhanced Geothermal Systems (EGS) on the United States in the 21st Century. MIT for the Idaho National Laboratory and the U.S. Department of Energy. INL/EXT-06-11746. Cambridge, MA: MIT. Accessed May 2013: https://mitei.mit.edu/system/files/geothermal-energy-full.pdf.
Geothermal Energy Association (GEA). (2014). Geothermal 101: Basics of Geothermal Energy. Washington, D.C.: GEA. Accessed December 2014: http://geo-energy.org/reports/Geo101-Binder1.pdf.
U.S. Department of Energy (DOE) Energy Efficiency & Renewable Energy (EERE). (2010). A History of Geothermal Energy Research and Development in the United States: Exploration 1976-2006. Washington, D.C.: DOE. Accessed May 2013: http://energy.gov/sites/prod/files/2014/02/f7/geothermal_history_1_exploration.pdf.
DOE – EERE. (2010). A History of Geothermal Energy Research and Development in the United States: Drilling 1976-2006. Washington, D.C.: DOE. Accessed May 2013: http://energy.gov/sites/prod/files/2014/02/f7/geothermal_history_2_drilling_0.pdf.
DOE – EERE. (2010). A History of Geothermal Energy Research and Development in the United States: Reservoir Engineering 1976-2006. Washington, D.C.: DOE. Accessed May 2013: http://energy.gov/sites/prod/files/2014/02/f7/geothermal_history_3_engineering.pdf.
DOE – EERE. (2010). A History of Geothermal Energy Research and Development in the United States: Energy Conversion 1976-2006. Washington, D.C.: DOE. Accessed May 2013: http://energy.gov/sites/prod/files/2014/02/f7/geothermal_history_4_conversion.pdf.
Bio-power Kumar, A.; Jones, D.D.; Hanna, M.A. (2009). “Thermochemical biomass gasification: a review of the current status of the technology.” Energies 2(3); pp. 556-581.
Peterson, D.; Haase, S. (2009). Market Assessment of Biomass Gasification and Combustion Technology for Small- and Medium-Scale Applications. NREL/TP-7A2-46190. Golden, CO: NREL. Accessed May 2013: http://www.nrel.gov/docs/fy09osti/46190.pdf.
Bain, R.L.; Amos, W.P.; Downing, M.; Perlack, R.L. (2003). Biopower Technical Assessment: State of the Industry and the Technology. NREL/TP-510-33123. Golden, CO: NREL. Accessed May 2013: http://www.nrel.gov/docs/fy03osti/33123.pdf.
81
This report is available at no cost from the National Renewable Energy Laboratory (NREL) at www.nrel.gov/publications.
Ocean Energy Augustine, C.; Bain, R.; Chapman, J.; Denholm, P.; Drury, E.; Hall, D.G.; Lantz, E.; Margolis, R.; Thresher, R.; Sandor, D.; Bishop, N.A.; Brown, S.R.; Cada, G.F.; Felker, F.; Fernandez, S.J.; Goodrich, A.C.; Hagerman, G.; Heath, G.; O’Neil, S.; Paquette, J.; Tegen, S.; Young, K. (2012). Renewable Electricity Futures Study. Volume 2: Renewable Electricity Generation and Storage Technologies. (Volume 2 of 4). NREL/TP-6A20-52409-2. Golden, CO: NREL. (Chapter 9 reviews the technical status of Ocean Energy). Accessed December 2014: http://www.nrel.gov/docs/fy12osti/52409-2.pdf.
Grid Integration Chakraborty, S.; Kramer, B.; Kroposki, B. (2009). “A review of power electronics interfaces for distributed energy systems towards achieving low-cost modular design.” Renewable and Sustainable Energy Reviews 13(9); pp. 2323-2335.
Cochran, J.; Bird, L.; Heeter, J.; Arent, D.J. (2012). Integrating Variable Renewable Energy in Electric Power Markets: Best Practices from International Experience, Summary for Policymakers. NREL/TP-6A20-53730. Golden, CO: NREL. Accessed May 2013: http://www.nrel.gov/docs/fy12osti/53730.pdf.
Lew, D.; Brinkman, G.; Ibanez, E.; Florita, A.; Heaney, M.; Hodge, B. M.; Hummon, M.; Stark, G.; King, J.; Lefton, S. A.; Kumar, N.; Agan, D.; Jordan, G.; Venkataraman, S. (2013). Western Wind and Solar Integration Study Phase 2. NREL/TP-5500-55588. Golden, CO: NREL. Accessed December 2014: http://www.nrel.gov/docs/fy13osti/55588.pdf.
National Renewable Energy Laboratory (NREL). (2011). Eastern Wind Integration and Transmission Study (EWITS) (Revised). NREL/SR-5500-47078. Golden, CO: NREL. Accessed December 2013: http://www.nrel.gov/docs/fy11osti/47078.pdf.
NREL. (2012). Renewable Electricity Futures Study. Hand, M.M.; Baldwin, S.; DeMeo, E.; Reilly, J.M.; Mai, T.; Arent, D.; Porro, G.; Meshek, M.; Sandor, D., eds. 4 vols. NREL/TP-6A20-52409. Golden, CO: NREL. Accessed December 2013: http://www.nrel.gov/analysis/re_futures/.
Ruth, M.F.; Kroposki, B. (2014). “Energy Systems Integration: An Evolving Energy Paradigm.” The Electricity Journal 27(6); pp. 36-47.