report commuter costs potential savings report
TRANSCRIPT
8/9/2019 REPORT Commuter Costs Potential Savings Report
http://slidepdf.com/reader/full/report-commuter-costs-potential-savings-report 1/44
The Costs ofCommuting: An
Analysis of Potential
Commuter SavingsJanuary 2015

8/9/2019 REPORT Commuter Costs Potential Savings Report
http://slidepdf.com/reader/full/report-commuter-costs-potential-savings-report 2/44
2
THE COSTS OF COMMUTING: AN ANALYSIS OF POTENTIAL COMMUTER SAVINGS
8/9/2019 REPORT Commuter Costs Potential Savings Report
http://slidepdf.com/reader/full/report-commuter-costs-potential-savings-report 3/44
3
THE COSTS OF COMMUTING: AN ANALYSIS OF POTENTIAL COMMUTER SAVINGS
TABLE OF CONTENTS
FOREWORD .......................................................................................................................................................... 5
EXECUTIVE SUMMARY ........................................................................................................................................... 7
INTRODUCTION .................................................................................................................................................... 9
Australia ............................................................................................................................................................ 9
New Zealand ...................................................................................................................................................... 9
Australasia ....................................................................................................................................................... 10
METHODOLOGY .................................................................................................................................................. 11
Commuters Areas Travelled To and From .......................................................................................................... 11
Distance Travelled ............................................................................................................................................ 11
Car Type.......................................................................................................................................................... 11
Fixed and Running Costs .................................................................................................................................. 12
Public Transport Costs and Ticketing ................................................................................................................. 12
Parking Costs ................................................................................................................................................... 13
Currencies ....................................................................................................................................................... 13
Costs not included ............................................................................................................................................ 13
Savings scenarios ............................................................................................................................................. 14
KEY FINDINGS .................................................................................................................................................... 14
Australia .......................................................................................................................................................... 14
New Zealand .................................................................................................................................................... 17
Key Findings at a Glance................................................................................................................................... 19 MELBOURNE ....................................................................................................................................................... 19
Statistical Snapshot .......................................................................................................................................... 20
Public Transport Snapshot ................................................................................................................................ 20
Driving Costs ................................................................................................................................................... 20
Transport Costs ................................................................................................................................................ 21
Potential Savings .............................................................................................................................................. 21
SYDNEY .............................................................................................................................................................. 23
8/9/2019 REPORT Commuter Costs Potential Savings Report
http://slidepdf.com/reader/full/report-commuter-costs-potential-savings-report 4/44
4
THE COSTS OF COMMUTING: AN ANALYSIS OF POTENTIAL COMMUTER SAVINGS
Statistical Snapshot .......................................................................................................................................... 23
Public Transport Snapshot ................................................................................................................................ 23
Driving Costs ................................................................................................................................................... 24 Transport Costs ................................................................................................................................................ 24
Potential Savings .............................................................................................................................................. 24
BRISBANE........................................................................................................................................................... 26
Statistical snapshot .......................................................................................................................................... 26
Public Transport Snapshot ................................................................................................................................ 26
Driving Costs ................................................................................................................................................... 27
Transport Costs ................................................................................................................................................ 27
Potential Savings .............................................................................................................................................. 27
ADELAIDE ........................................................................................................................................................... 28
Statistical Snapshot .......................................................................................................................................... 28
Public Transport Snapshot ................................................................................................................................ 29
Driving Costs ................................................................................................................................................... 29
Transport Costs ................................................................................................................................................ 30
Potential Savings .............................................................................................................................................. 30
PERTH ................................................................................................................................................................ 31
Statistical Snapshot .......................................................................................................................................... 31
Public Transport Snapshot ................................................................................................................................ 31
Driving Costs ................................................................................................................................................... 31
Transport Costs ................................................................................................................................................ 32
Potential Savings .............................................................................................................................................. 32
HOBART ............................................................................................................................................................. 34
Statistical Snapshot .......................................................................................................................................... 34
Public Transport Snapshot ................................................................................................................................ 34
Driving Costs ................................................................................................................................................... 34
Transport Costs ................................................................................................................................................ 35
Potential Savings .............................................................................................................................................. 35
8/9/2019 REPORT Commuter Costs Potential Savings Report
http://slidepdf.com/reader/full/report-commuter-costs-potential-savings-report 5/44
5
THE COSTS OF COMMUTING: AN ANALYSIS OF POTENTIAL COMMUTER SAVINGS
CANBERRA.......................................................................................................................................................... 35
Statistical Snapshot .......................................................................................................................................... 35
Public Transport Snapshot ................................................................................................................................ 36 Driving Costs ................................................................................................................................................... 36
Transport Costs ................................................................................................................................................ 37
Potential Savings .............................................................................................................................................. 37
AUCKLAND ......................................................................................................................................................... 38
Statistical Snapshot .......................................................................................................................................... 38
Public Transport Snapshot ................................................................................................................................ 38
Driving Costs ................................................................................................................................................... 39
Transport Costs ................................................................................................................................................ 39
Potential Savings .............................................................................................................................................. 39
WELLINGTON ..................................................................................................................................................... 41
Statistical Snapshot .......................................................................................................................................... 41
Public Transport Snapshot ................................................................................................................................ 41
Driving Costs ................................................................................................................................................... 41
Transport Costs ................................................................................................................................................ 42
Potential Savings .............................................................................................................................................. 42
CONLUSION ........................................................................................................................................................ 43
REFERENCE LIST ................................................................................................................................................ 44
FOREWORDThis report identifies and quantifies, where possible, the potential savings that commuters working in the CBDs of
Australian and New Zealand capital cities could achieve by converting to public transport and leaving their cars at
home or deciding not to purchase a second car, or not owning a car at all.
It is acknowledged that in real life scenarios, the commuter costs and potential savings identified in this report might
be influenced by a range of other factors in addition to vehicle types and distance driven.
The intention of this report is to highlight the potential costs of commuting and in doing so, add to the public debateabout the benefits of greater utilisation of public transport.
8/9/2019 REPORT Commuter Costs Potential Savings Report
http://slidepdf.com/reader/full/report-commuter-costs-potential-savings-report 6/44
6
THE COSTS OF COMMUTING: AN ANALYSIS OF POTENTIAL COMMUTER SAVINGS
This paper has been prepared and published by the Australasian Railway Association using publically available data
sources as outlined in the methodology and reference list.

8/9/2019 REPORT Commuter Costs Potential Savings Report
http://slidepdf.com/reader/full/report-commuter-costs-potential-savings-report 7/44
7
THE COSTS OF COMMUTING: AN ANALYSIS OF POTENTIAL COMMUTER SAVINGS
EXECUTIVE SUMMARYThis report estimates the potential savings that Australian and New Zealand commuters can achieve if they decide to
use public transport rather than a private vehicle to commute to work. These estimates are based on the potential
savings commuters can achieve in Melbourne, Sydney, Brisbane, Adelaide, Perth, Hobart and Canberra as well as
Auckland and Wellington.
After identifying the potential costs to commute by car in Australian and New Zealand cities, this report uses two
scenarios to examine potential commuter savings. The first scenario estimates the potential savings that can be made
from leaving the car at home and using public transport to commute to work. The second scenario estimates the
potential savings that can be made by selling the car (similarly, choosing not to buy an additional car) and using
public transport to commute to work. To investigate the potential commuter savings that can be made from these
scenarios, information has been gathered on car running costs, public transport fares, parking costs and also
population data that illustrates labour force size and movement in each capital city.
The report makes the following key findings:
The average Australian commuter pays $11,996.39 per annum in car ownership and running costs.
The average New Zealander commuter pays $11,852.98 per annum in car ownership and running costs.
For those that decide to not own a car and commute with public transport instead, Australians on average can
potentially save $9,973.66 per annum.
For those that decide to not own a car and commute with public transport instead, New Zealand commuters
on average can potentially save $9,065.78 each year.
On average, if an Australian car owner decides to leave their vehicle at home and use public transport to
commute to work, they can potentially save $1,724.59 a year.
On average, if a New Zealand car owner decides to leave their vehicle at home and use public transport to
commute to work, they can potentially save $2,119.03 a year.
The above potential savings increase further when additional costs not included in this study are incorporated.
A conservative estimate of $1,000 per year for parking is included in the car costs. However, it must be noted that the
cost of parking can vary significantly depending on location. The report found that parking costs in Australia can range
from $180 to $750 a month in Australia’s capital cities or $2,160 to $9,000 per year while institutions such as
universities offer significantly cheaper parking rates ranging between $190 and $950 for an annual parking permit.
According to Auckland Transport, monthly parking costs can vary from $100 to $410 per month meaning parking costs
in Auckland can range from $1,200 to over $4,920 per year. i
Other costs such as toll road fees, non-compulsory car insurance, environmental and congestion costs were not
included in the analysis. It must be highlighted that the use of toll roads, non-compulsory insurance and the
environment costs associated with driving a private car to work every day can be substantial. Over the course of a
8/9/2019 REPORT Commuter Costs Potential Savings Report
http://slidepdf.com/reader/full/report-commuter-costs-potential-savings-report 8/44
8
THE COSTS OF COMMUTING: AN ANALYSIS OF POTENTIAL COMMUTER SAVINGS
year, toll roads to commute to work can cost anywhere between $855.60 and $2,893.40. Thus, it can be assumed
that the potential annual costs and therefore savings of a commuter who uses toll roads to commute to work could be
significantly higher than identified in this study. Likewise, as non-compulsory car insurance rates vary significantly
according to driver history, location and other factors, the report does not include this cost which also adds to the
potential savings commuters that switch to public transport can achieve. Environmental costs are difficult to quantify
and are an aspect which individuals should personally consider when deciding on their method of daily commute.
While not quantified in this paper, the broader benefits of travelling by public transport, should also be considered as
a potential saving – the ability to use mobile technologies to work or read and the freedom to sleep or socialise while
travelling by public transport provide an added benefit in productivity or “use of time” that is not achievable driving.
This report does not comment on the current stock of public transport infrastructure or services. It must be noted that
a commuter’ s transport mode of choice will be greatly influenced by the services provided by public transport
operators. Shifting from private vehicle use to public transport is made more feasible when the public transport
services provided are efficient, cost effective, safe and comfortable. Complementary services such as park-and-ride
services can also play an important role in providing quality public transport alternatives. By providing high quality
cost effective services, public transport can not only serve as a cheaper alternative for commuting, but can also be the
method of choice for commuters.
8/9/2019 REPORT Commuter Costs Potential Savings Report
http://slidepdf.com/reader/full/report-commuter-costs-potential-savings-report 9/44
9
THE COSTS OF COMMUTING: AN ANALYSIS OF POTENTIAL COMMUTER SAVINGS
INTRODUCTION
Australia A large proportion of the Australian labour force is heavily centred in Australia’s capital cities. Of a workforce totalling
approximately 9.8 million, around 56 per cent of Australian workers are based in capital cities. Sydney and Melbourne
are home to a large share of Australia’s workforce totalling 1,747,388 in Sydney and 1,621,070 in Melbourne or
combined, almost 35 per cent of Australia’s total workforce.ii
For many workers in Australia, getting to and from work means commuting and the car remains the most favoured
method of commuting to work in Australia. Of the 9.8 million workforce, 60 per cent (5,943,948) drive to work (this
does not include those that carpool to work, which amounts to 523,749). In all cities, the most populous commuting
destination is the central business district (CBD), or areas nearby. For car drivers in the larger cities in particular,
these commutes can be time-consuming and costly. These frustrations continue to grow in the larger cities as the
cities themselves grow closer to capacity, causing gridlock on the roads and longer commute times. According to the
Bureau of Infrastructure, Transport and Regional Economics (BITRE ), by 2020, road congestion will cost Australia
$20.4 billion annually through lost productivity as a result of time wasted in traffic.iii Furthermore, fuel costs have
increased substantially over last two decades, placing greater pressure on individual living costs.
Collectively, Sydney, Melbourne, Perth, Brisbane and Adelaide CBDs produce 12.3 per cent of Australia’s total
economic output by employing 10.6 per cent of the population.iv With only 0.6 per cent of the population living in
these CBDs, public transport links in to, out of and within city centres is vital to maintaining and improving Australia’s
national productivity.
New ZealandNew Zealand has a total workforce of 2.3 million.v Like Australian cities, New Zealand has a strong commuter
population. Auckland’s CBD has low employment self -sufficiency, with workers residing in their area of work making
up only 10 per cent of the total numbers employed. As a result, flows into the CBD from other parts of the region are
high, placing pressure on the transport network, particularly on the immediate approaches to the CBD.
Wellington exhibits a strong culture of public transport use. Indeed, Wellington has New Zealand’s highest number of
public transport boardings per person per year – 72 trips per capita were made on public transport in Wellington in
2013, compared with 47 in Auckland and 20 in Canterbury.vi Despite these figures, like Australian cities, the most
popular method of getting to work is the car, with 39,756 workers driving a car to work. However, this figure is 3 per
cent lower than in 2006. Interestingly, walking or jogging to work is becoming more popular, with greater proportions
of the working population choosing these methods to get to work. The use of trains and buses has remained relatively
steady since 2006.
8/9/2019 REPORT Commuter Costs Potential Savings Report
http://slidepdf.com/reader/full/report-commuter-costs-potential-savings-report 10/44
10
THE COSTS OF COMMUTING: AN ANALYSIS OF POTENTIAL COMMUTER SAVINGS
AustralasiaIt is no surprise then that across the major cities of Australia and New Zealand we are witnessing a growing interest in
improving mass transport networks, as commuters attempt to minimise living costs and avoid over congested roads.
Over the last 10 years, the state governments of Australia have invested in planning and construction to improve
passenger transport networks in capital cities. Growth in Australasian passenger networks is consistent with
international trends which show passenger networks becoming vital pieces of city infrastructure across the world. In
Europe, 65 cities built new or expanded light rail systems between 1980 and 2007 and 160 European cities now have
light rail. In Asia, India is building metros in 14 cities, while China is building light rail in 82 cities. (Newman et al.
2012).vii
8/9/2019 REPORT Commuter Costs Potential Savings Report
http://slidepdf.com/reader/full/report-commuter-costs-potential-savings-report 11/44
11
THE COSTS OF COMMUTING: AN ANALYSIS OF POTENTIAL COMMUTER SAVINGS
METHODOLOGY
Commuters Areas Travelled To and FromIn an attempt to identify the number of commuters in any given city, this report classifies commuters as those that
travel outside their statistical area of residence to work.
For Australian cities, statistical areas have been defined by the Australian Bureau of Statistics (ABS). This report uses
the ABS’ Greater Capital City Area (GCCSA) to determine areas of residence and work. It is understood that this
approach will overlook those that travel large distances within their statistical area.
This report localises its analysis by using specific areas in which workers commute to and from to get from their home
to work. This report uses data from the ABS 2011 national census to identify popular commuter routes within
Australia’s capital cities. The report uses this information to estimate the potential costs and savings based on these
popular commuter routes.
Specific information on commuter journeys in New Zealand could not be sourced. To accommodate, this report uses
the rail networks as a guide for commuter journeys to and from work. We compare the costs of driving to the costs of
using public transport from various points on the rail networks in Auckland and Wellington.
Distance TravelledDistance travelled refers to the distance travelled by car. To calculate this, Google Maps has been used to identify the
most direct route and quantify the kilometres required to travel to work by car.
Car TypeThe car types chosen for this study represent a range of sizes. The sizes are roughly split into four groups; small,
sedan, SUV and 4WD. The top cars of these categories as identified by drive.com.au have been used. These models
include:
Small Car - Mazda 2;
Sedan – Mazda 6, Holden Commodore;
SUV – Ford Territory; and
4WD –Toyota Land Cruiser.
The New Zealand Automobile Association do not specify the costs of individual car models, instead estimate costs of
car categories such as small cars, compacts cars, mediums cars and large cars.
8/9/2019 REPORT Commuter Costs Potential Savings Report
http://slidepdf.com/reader/full/report-commuter-costs-potential-savings-report 12/44
12
THE COSTS OF COMMUTING: AN ANALYSIS OF POTENTIAL COMMUTER SAVINGS
Fixed and Running CostsTo identify and analyse the fixed and running costs of cars, reports produced by the automobile clubs or associations
of each jurisdiction have been used. These include the National Roads and Motorists’ Association (NRMA) for New
South Wales, the Royal Automobile Club of Victoria (RACV), the Royal Automobile Club of Queensland (RACQ), the
Royal Automobile Association of South Australia (RAA), the Royal Automobile Club (RAC), the Royal Automobile Club
of Tasmania (RACT) and the New Zealand Automobile Association (AA).
With the exception of the NRMA, car operating cost calculations are all very similar. The overall car operating costs are
separated into fixed costs and running costs. The fixed costs include elements such as registration, CTP insurance,
stamp duty, depreciation and forgone interest (the interest that could have been earned without the purchase of a
vehicle), and is presented as a weekly cost. Running costs incorporate the items which increase in cost as the distance
driven increases and includes fuel costs, tyre costs, and service/repair costs.
This study assumes that commuters work full time, which is 5 days a week for 46 weeks. For this reason the weekly
fixed car ownership costs are multiplied by 52 weeks and the running costs are multiplied by 46 weeks. We
acknowledge that four weeks annual leave is not an absolute representation of the workforce, with occupations such
as teaching allowing for more annual leave. Furthermore, assuming that everyone works full-time and travels to work
every day is not entirely robust, however, it provides a consistent measure to identify the potential annual commuting
costs and savings for this study.
Whole of Life Cost (WOL) (NSW-NRMA) As noted above, NSW differs from other jurisdictions in its costings. The NRMA uses a cost method labelled the Whole
of Life cost (WOL) of a car. This method does not separate fixed costs from running costs, instead it estimates the
WOL cost of a car based on a car travelling 15,000km annually. This is problematic as the WOL cost estimation for
cars travelling long distances produces some unrealistic numbers, suggesting the cost of a car is far more than it really
is. To overcome this, the report separates annual fuel costs from the WOL costs, and estimates fuel consumption
based on distanced travelled. It must be noted that the results provided for NSW may still over estimate actual car
costs. It is for this reason that the analysis provided will have to be used with caution, as some costs may not reflect
actual costs.
Public Transport Costs and TicketingPublic transport costs have been estimated drawing information from passenger rail websites in each capital city. For
cities that do not operate a passenger rail network, such as Hobart and Canberra, prices from the relevant bus service
providers has been used. Where available, the cost of an annual public transport ticket has been used, such as
V/Line’s services in Victoria. For states that use a zonal system, such as Transport for NSW’s ‘Opal’ system or
Transperth’s SmartRider system, weekly costs were estimated, keeping in mind that these initiatives often offer
bonuses such as discounted fares or free travel after a certain amount of trips. More information on the price of public
transport is explained within the analysis of the individual cities.

8/9/2019 REPORT Commuter Costs Potential Savings Report
http://slidepdf.com/reader/full/report-commuter-costs-potential-savings-report 13/44
13
THE COSTS OF COMMUTING: AN ANALYSIS OF POTENTIAL COMMUTER SAVINGS
Parking CostsFor those who pay for their own parking, parking costs can add immensely to the overall cost of driving to work. Using
an online private and commercial parking website, namely findapark.com.au, parking costs can range from $180 to
$750 a month in Australia’s capital cities for a monthly lease. Similar prices for monthly parking leases were exhibited
in Auckland. According to Auckland Transport, monthly parking can range from $100 to $410 per month meaning
parking costs in Auckland can range from $1,200 to over $4,920 per annum. Institutions such as universities, on the
other hand, price parking at a cheaper rate and can range between $190 and $950 for an annual parking permit. viii
Taking a conservative figure we estimate a cost of $1,000 per year for parking. This annual amount is added to the
total cost of commuting to work by car.
CurrenciesThis report does not seek to compare costs between cities or countries, rather it is an analysis of potential savings
commuters in each city can make by using public transport. As such, cost information for Australian cities is in
Australian Dollars and cost information for New Zealand cities is in New Zealand Dollars.
Costs not included Additional commuter costs such as tolls costs have not been accounted for in this study.
Toll Road CostsToll costs have been excluded as it is not reasonable to assume that all drivers pay for tolls. Instead, these costs
should be applied by the individual to evaluate their personal costs in driving to work.
Similar to parking costs however, toll road fees can add immensely to the cost of driving to work. Using Sydney
Motorways as an example, toll fees for roads such as the M2 Motorway can range from $1.86 to $6.29 each way,
depending on the destination. Other roads such as the Eastern Distributor can result in a fee of $6.36 each way, and
crossing the Sydney Harbour Bridge during peak times will cost $4.00 each way ix. Similarly, Auckland’s Northern
Gateway Toll Road charges car drivers $2.20 each way. Over the course of a year, using toll roads to get to work can
result in an annual cost of anywhere between $855.60 and $2,893.40. These costs also needs to be factored in for
those that have to pay road toll fees.
Non-compulsory Car Insurance CostsThe report acknowledges that many car owners opt to buy additional insurance for their vehicle. However, given that
additional insurance is not compulsory and vary significantly according to a number of factors, these costs have not
been included in this study. Those who purchase additional vehicle cover should consider these costs when analysing
their annual commuting costs.

8/9/2019 REPORT Commuter Costs Potential Savings Report
http://slidepdf.com/reader/full/report-commuter-costs-potential-savings-report 14/44
14
THE COSTS OF COMMUTING: AN ANALYSIS OF POTENTIAL COMMUTER SAVINGS
Environmental and Congestion CostsThere are significant external costs to society associated with driving a car to work. These costs are not added to the
costs of commuting analysis, however, one should give reasonable thought to these costs when choosing to drive to
work.
According to the True Value of Rail Report (2011), road travel produces 40 per cent more carbon pollution than rail
travel per passenger kilometre. Further, road transport generates almost eight times the amount of accident costs as
rail transport does. For society as a whole, every passenger journey made on rail rather than road in Australia’s four
largest cities, between $3 and $8.50 can be saved in congestion, safety and carbon emission costs. At an individual
commuter level, a 25km commute will produce up to 3.1 tonnes of greenhouse gases over the course of a year. In
other words, every litre of petrol saved reduces greenhouse emissions by 2.5kg.x
Savings scenariosTo calculate the potential savings commuters can achieve, this report uses two scenarios.
First, this report estimates the potential savings of someone who decides to keep the car at home and use public
transport to commute to work every day. This scenario is relevant to those who currently drive every day and wish to
understand the potential savings of keeping the car at home and commuting to work via public transport instead.
The second scenario estimates the potential savings of someone who does not own a vehicle, and only travels to work
by public transport. This scenario is relevant to commuters who may be considering purchasing a car to drive to work,purchasing an additional household car, or selling their current car in order to use public transport instead.
KEY FINDINGS
AustraliaPublic transport offers Australians great potential to save on their commuting costs over the course of a year. Figures
1 and 2 below, which have been obtained using the results of individual cities, show that the general Australiancommuter has the potential to make considerable savings by using public transport to travel to work.
8/9/2019 REPORT Commuter Costs Potential Savings Report
http://slidepdf.com/reader/full/report-commuter-costs-potential-savings-report 15/44
15
THE COSTS OF COMMUTING: AN ANALYSIS OF POTENTIAL COMMUTER SAVINGS
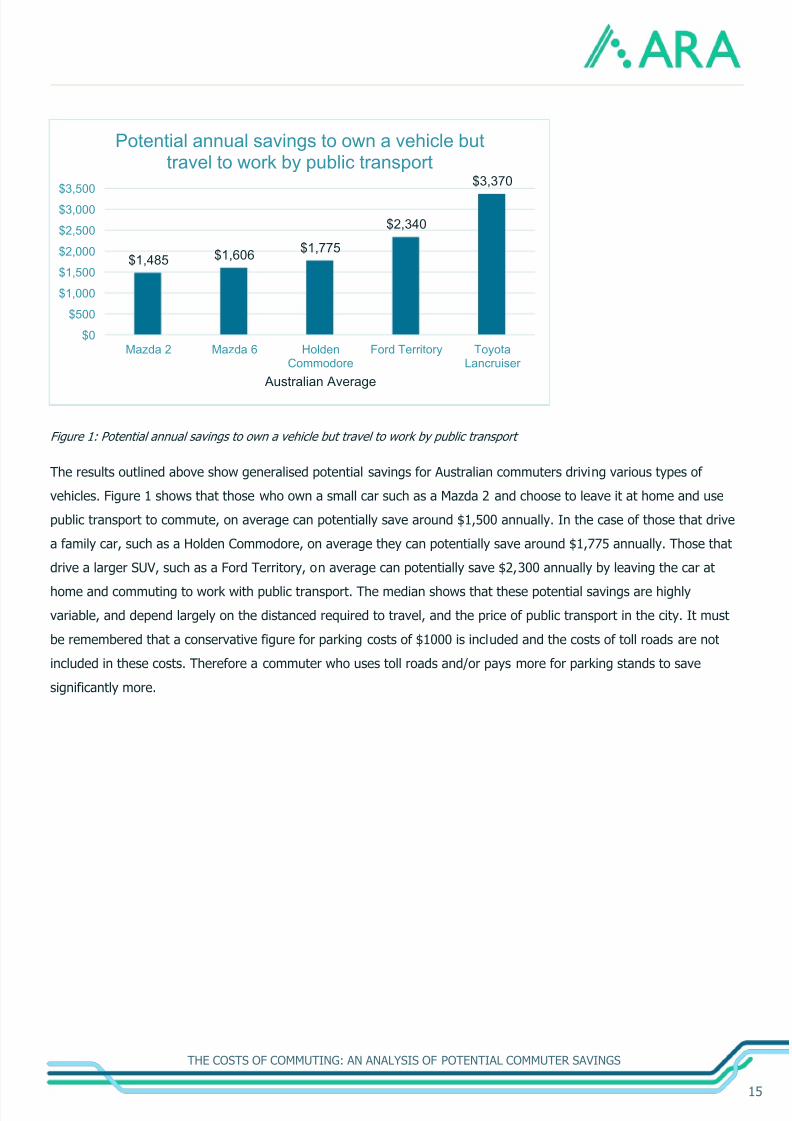
Figure 1: Potential annual savings to own a vehicle but travel to work by public transport
The results outlined above show generalised potential savings for Australian commuters driving various types of
vehicles. Figure 1 shows that those who own a small car such as a Mazda 2 and choose to leave it at home and use
public transport to commute, on average can potentially save around $1,500 annually. In the case of those that drive
a family car, such as a Holden Commodore, on average they can potentially save around $1,775 annually. Those that
drive a larger SUV, such as a Ford Territory, on average can potentially save $2,300 annually by leaving the car at
home and commuting to work with public transport. The median shows that these potential savings are highly
variable, and depend largely on the distanced required to travel, and the price of public transport in the city. It must
be remembered that a conservative figure for parking costs of $1000 is included and the costs of toll roads are not
included in these costs. Therefore a commuter who uses toll roads and/or pays more for parking stands to save
significantly more.
$1,485 $1,606$1,775
$2,340
$3,370
$0
$500
$1,000
$1,500
$2,000
$2,500
$3,000
$3,500
Mazda 2 Mazda 6 HoldenCommodore
Ford Territory ToyotaLancruiser
Australian Average
Potential annual savings to own a vehicle buttravel to work by public transport

8/9/2019 REPORT Commuter Costs Potential Savings Report
http://slidepdf.com/reader/full/report-commuter-costs-potential-savings-report 16/44
16
THE COSTS OF COMMUTING: AN ANALYSIS OF POTENTIAL COMMUTER SAVINGS
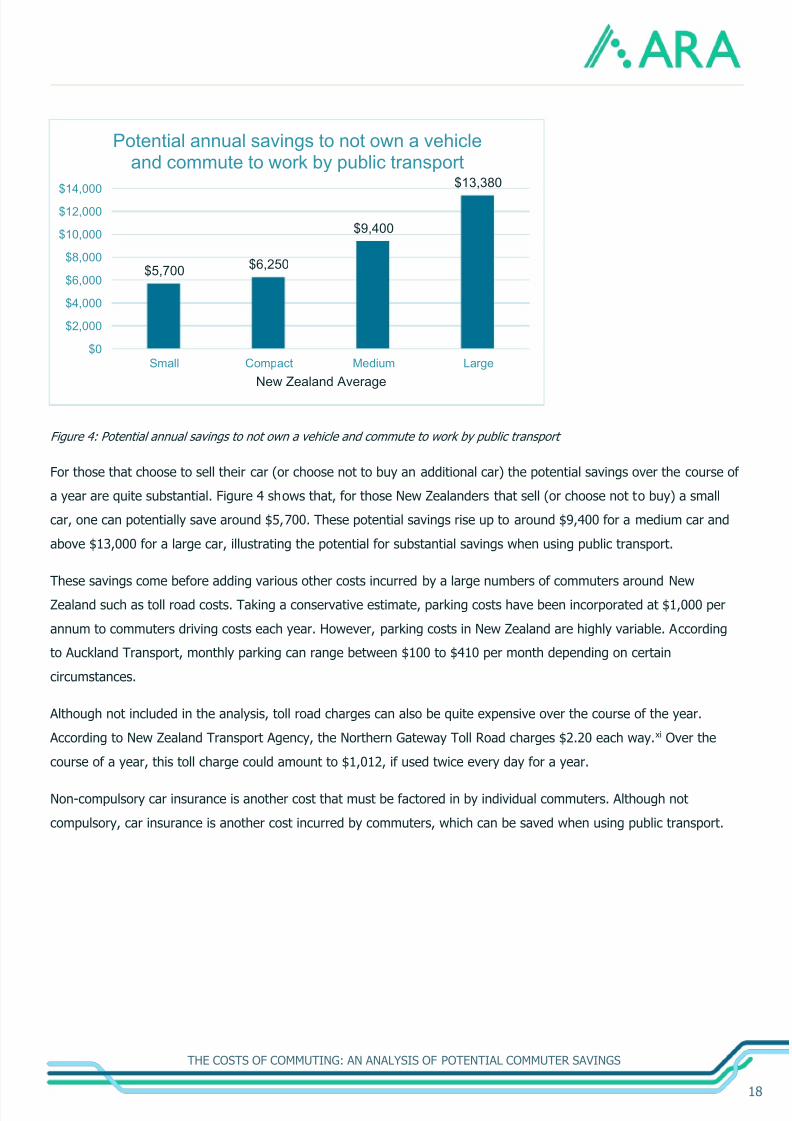
Figure 2: Potential annual savings to not own a vehicle and commute to work by public transport
Figure 2 shows that those who choose not to own a car, and use public transport entirely to commute, the potential
savings can be substantial. On average, those that sell (or choose not to buy) a Mazda 2, and instead use public
transport to commute can potential save $6,400 annually. This figure increases with larger sized cars. For example the
potential savings from selling a family car, such as a Holden Commodore, and using public transport can potentially be
around $11,000 annually, or $12,600 for a larger SUV, such as a Ford Territory. The median shows very similar results
for the potential savings when selling a car (or choosing not to buy an additional car) and using public transport
commute to work.
As outlined in the methodology, these savings come before adding various other costs incurred by a large number of
commuters around Australia such as toll road costs. Parking costs in Australia are highly variable and can range from
$180-$750 per month, depending on certain circumstances. Taking a conservative estimate, a $1,000 parking cost has
been incorporated to the cost for commuters driving each year.
Although not included in the analysis, toll road charges can also be quite expensive for those that use them to get to
work. Although this report does not explicitly include toll costs, these costs should be taken into consideration by
those that travel on toll roads to get to work. For Sydney commuters, toll road charges can range from $1.86 each
way to $6.19 each way, depending on the road. These costs can potentially add up to annual toll road costs ranging
from $856 to above $2,800.
Non-compulsory car insurance is another cost that must be factored in by individual commuters. Although not
compulsory, car insurance is another cost incurred by commuters, which can be saved when using public transport.
The various added costs mentioned above make using a private vehicle to get to work even more expensive. Public
transport provides commuters with a cost effective method to get to work, one that provides considerable potentialsavings to everyday commuters.
$6,400
$11,055 $11,232$12,690
$19,750
$0$2,000$4,000$6,000$8,000
$10,000$12,000$14,000$16,000
$18,000$20,000
Mazda 2 Mazda 6 HoldenCommodore
Ford Territory ToyotaLancruiser
Australian Average
Potential annual savings to not own a vehicleand commute to work by public transport

8/9/2019 REPORT Commuter Costs Potential Savings Report
http://slidepdf.com/reader/full/report-commuter-costs-potential-savings-report 17/44
17
THE COSTS OF COMMUTING: AN ANALYSIS OF POTENTIAL COMMUTER SAVINGS
New ZealandCommuters in New Zealand also stand to make considerable savings by using public transport to commute to work.
The potential savings are shown in Figures 3 and 4 below.
Figure 3: Potential annual savings to own a vehicle by transport to work by public transport
The results above show a generalised calculation of potential savings for New Zealand commuters. Figure 3 highlights
the potential savings commuters can make when they leave the car at home and use public transport to commute towork. New Zealand commuters that own a small car can potentially save an average of $1,174 annually, if they
choose to leave the car at home and commute by public transport. For those that own medium and large cars, the
potential savings a commuter can make exceeds $2,000 annually, and can even reach $3,000 for large car owners.
The median highlights a high variability of potential savings.
$1,170$1,610
$2,150
$3,000
$0
$500
$1,000
$1,500
$2,000
$2,500
$3,000
$3,500
Small Compact Medium Large
New Zealand Average
Potential annual savings to own a vehicle buttravel to work by public transport
8/9/2019 REPORT Commuter Costs Potential Savings Report
http://slidepdf.com/reader/full/report-commuter-costs-potential-savings-report 18/44

8/9/2019 REPORT Commuter Costs Potential Savings Report
http://slidepdf.com/reader/full/report-commuter-costs-potential-savings-report 19/44
19
THE COSTS OF COMMUTING: AN ANALYSIS OF POTENTIAL COMMUTER SAVINGS
Key Findings at a GlanceThe results in Table 1 below show the annual average costs and potential savings this study identifies for each city,
and also at the national level.
Figure 5: Key Findings at a Glance
The results shown in Table 1 highlight the national average potential saving that Australian and New Zealand
commuters can achieve. The results were obtained by estimating the commuting costs of various commuter routes
within the capital cities of Australia and New Zealand. For brevity, the report will only illustrate the costs of two
commuter routes per capital city.
Australians as a whole stand to save, on average, $1,7254.59 if they leave the car at home and use public transport to
commute to work. Similarly, the average New Zealand commuter can potentially save $2,119.03.
For those that decide to not own a car and use public transport instead, Australians on average stand to save
$11,736.55. New Zealand commuters who decide not to own a car and instead to public transport could potentially
save $9,065.78.
Not counted in these costs are the costs using toll roads and also the environment costs associated with driving a
private car to work on a daily basis. As highlighted in the methodology, commuters who regularly incur the costs of
toll roads and parking stand to make higher savings by switching to public transport.
MELBOURNE
LOCATIONS
COMMUTER COSTS POTENTIAL SAVINGS
Average total Annual
Car Costs (Fixed and
variable)
Average annual
Public Transport
Costs
Scenario 1:
Own a vehicle but
travel to work by
public transport
Scenario 2:
Do not own a vehicle
and commute to work
by public transport
Australia $11,996.39 $2,022.73 $1,724.59 $9,973.66
Melbourne $12,661.39 $1,882.97 $3,667.98 $10,778.42
Sydney $12,611.64 $1,840.00 $1,791.63 $10,771.64Brisbane $14,003.74 $3,628.08 $1,735.21 $10,375.66
Adelaide $12,359.14 $1,762.80 $1,840.71 $10,596.34
Perth $12,419.76 $2,283.84 $1,514.32 $10,135.92
Hobart $9,711.93 $1,398.40 $788.61 $8,313.53
Canberra $10,207.10 $1,363.00 $733.66 $8,844.10
New Zealand $11,852.98 $1,659.50 $2,119.03 $9,065.78
Auckland $11,227.79 $1,427.00 $1,199.04 $9,800.79
Wellington $12,478.17 $1,892.00 $3,039.02 $10,586.17
8/9/2019 REPORT Commuter Costs Potential Savings Report
http://slidepdf.com/reader/full/report-commuter-costs-potential-savings-report 20/44
20
THE COSTS OF COMMUTING: AN ANALYSIS OF POTENTIAL COMMUTER SAVINGS
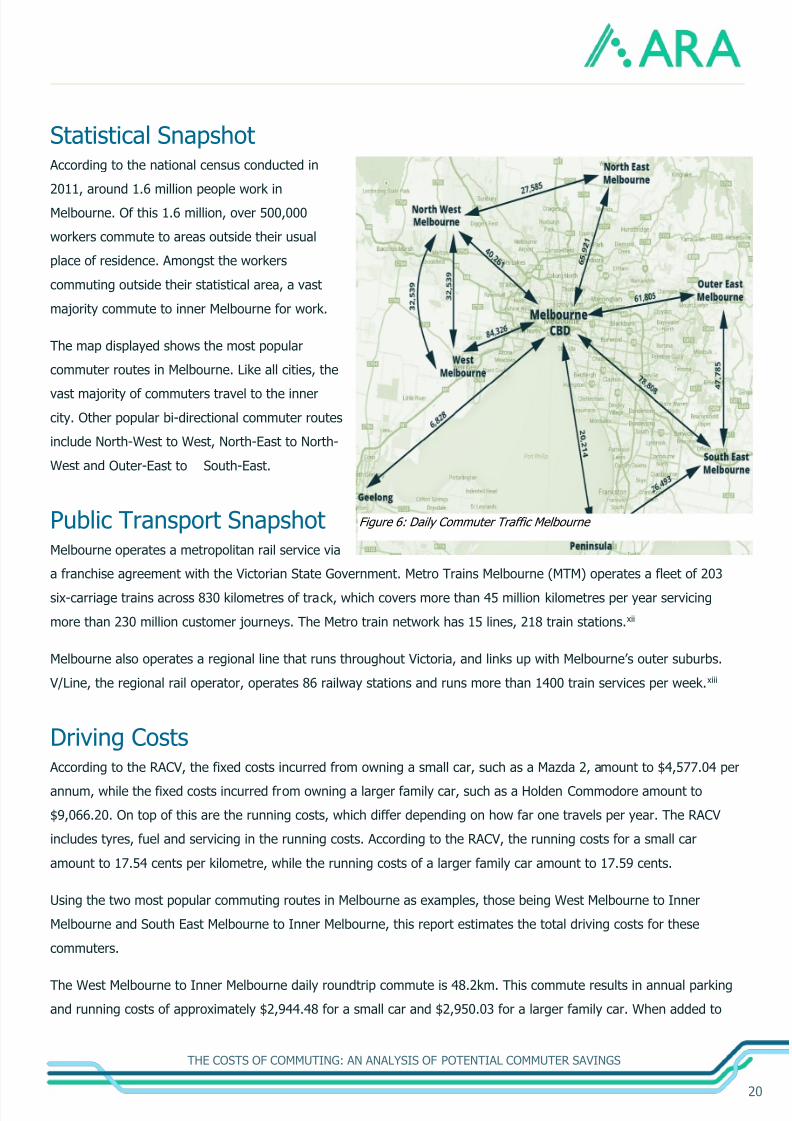
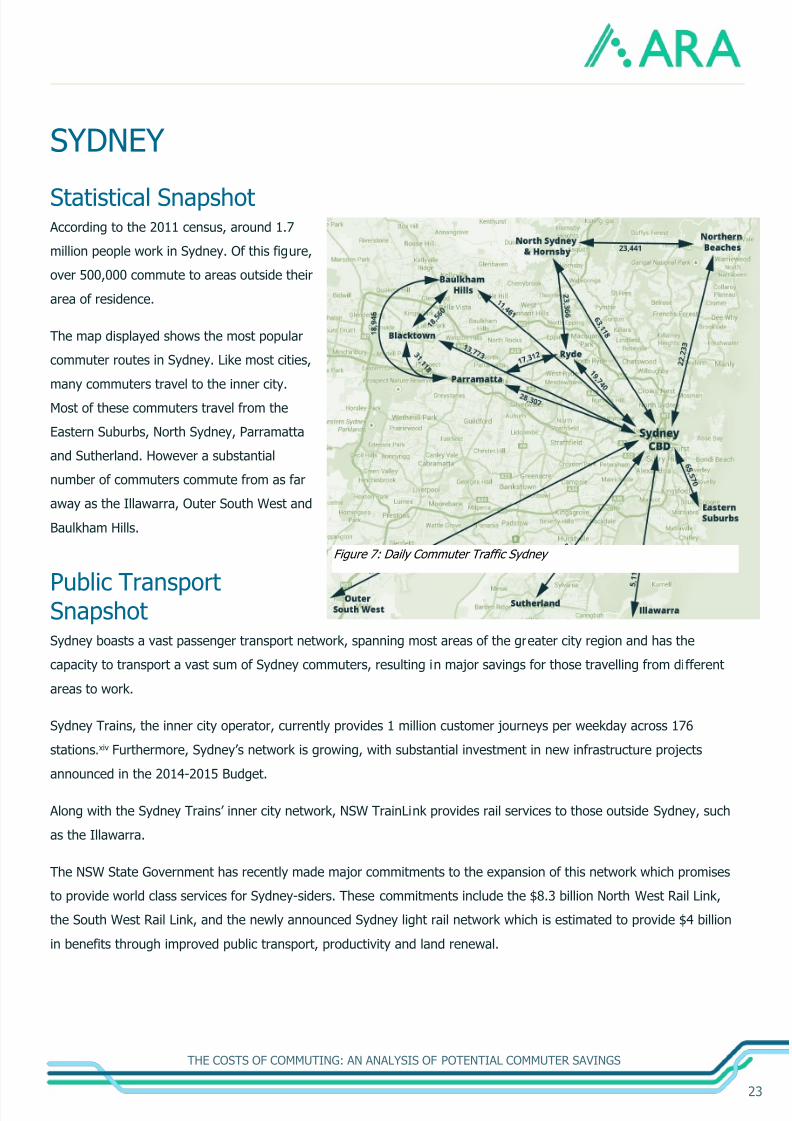
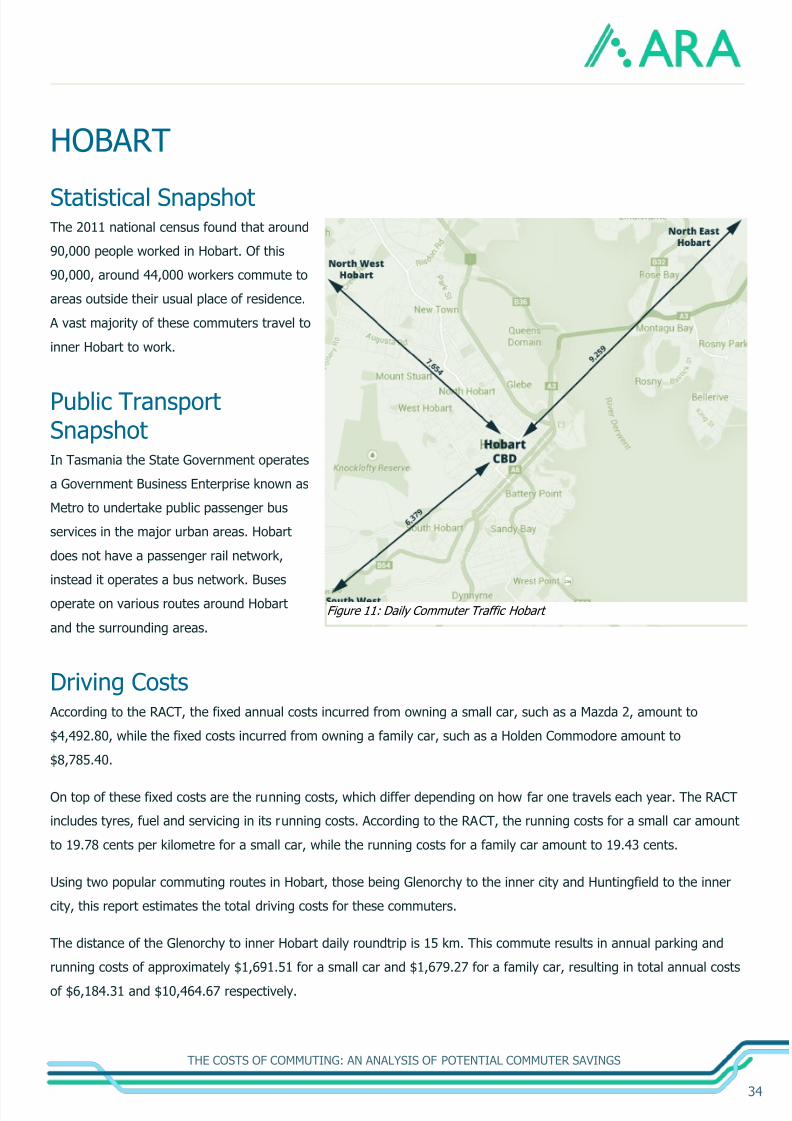
Statistical Snapshot According to the national census conducted in
2011, around 1.6 million people work in
Melbourne. Of this 1.6 million, over 500,000
workers commute to areas outside their usual
place of residence. Amongst the workers
commuting outside their statistical area, a vast
majority commute to inner Melbourne for work.
The map displayed shows the most popular
commuter routes in Melbourne. Like all cities, the
vast majority of commuters travel to the inner
city. Other popular bi-directional commuter routes
include North-West to West, North-East to North-
West and Outer-East to South-East.
Public Transport SnapshotMelbourne operates a metropolitan rail service via
a franchise agreement with the Victorian State Government. Metro Trains Melbourne (MTM) operates a fleet of 203
six-carriage trains across 830 kilometres of track, which covers more than 45 million kilometres per year servicing
more than 230 million customer journeys. The Metro train network has 15 lines, 218 train stations.xii
Melbourne also operates a regional line that runs throughout Victoria, and links up with Melbourne’s outer suburbs.
V/Line, the regional rail operator, operates 86 railway stations and runs more than 1400 train services per week.xiii
Driving Costs According to the RACV, the fixed costs incurred from owning a small car, such as a Mazda 2, amount to $4,577.04 per
annum, while the fixed costs incurred from owning a larger family car, such as a Holden Commodore amount to
$9,066.20. On top of this are the running costs, which differ depending on how far one travels per year. The RACV
includes tyres, fuel and servicing in the running costs. According to the RACV, the running costs for a small car
amount to 17.54 cents per kilometre, while the running costs of a larger family car amount to 17.59 cents.
Using the two most popular commuting routes in Melbourne as examples, those being West Melbourne to Inner
Melbourne and South East Melbourne to Inner Melbourne, this report estimates the total driving costs for these
commuters.
The West Melbourne to Inner Melbourne daily roundtrip commute is 48.2km. This commute results in annual parking
and running costs of approximately $2,944.48 for a small car and $2,950.03 for a larger family car. When added to
Figure 6: Daily Commuter Traffic Melbourne

8/9/2019 REPORT Commuter Costs Potential Savings Report
http://slidepdf.com/reader/full/report-commuter-costs-potential-savings-report 21/44
21
THE COSTS OF COMMUTING: AN ANALYSIS OF POTENTIAL COMMUTER SAVINGS
the fixed car ownership costs along with the costs of parking, the total annual driving costs are $7,521.52 and
$12,016.23 respectively.
The distance of the South East Melbourne to Inner Melbourne daily roundtrip is 125.6km. This commute results inannual parking and running costs of approximately $6,066.96 for a small car and $6,081.40 for a larger family car.
Adding in parking costs, annual driving costs are $10,644.00 and $15,147.60 respectively.
Transport CostsThe public transport costs used in this report are derived from the annual ticket prices provided by V/Line. Using the
commuter examples of West Melbourne and South East Melbourne to the inner city, the price of an annual train ticket
is approximately $1,666.00 and $1,700.00 respectively.
Potential SavingsUsing the commuter examples of West Melbourne and South East Melbourne to the inner city, the potential savings
are as follows. A commuter travelling from West Melbourne to the city who leaves the car at home and uses public
transport will incur only the fixed cost of the car, that being $4,577.04 for a small car and $9,066.20 for a larger
family car, plus the costs of buying an annual train ticket, which is approximately $1,666.00. Therefore, by leaving the
car at home and using public transport, the total cost incurred will be $6,243.04 for a small car and $10,732.20 for a
larger family car. The potential savings for those that use public transport from West Melbourne to inner Melbourne
and leave the car at home would be $1,278.48 for a small car and $1,284.03 for larger family car each year.
A commuter travelling from South East Melbourne to the inner city who leaves the car at home and uses public
transport will incur the cars fixed cost, plus the cost of purchasing an annual train ticket which is approximately
$1,700.00 therefore, by leaving the car at home and using public transport, the total cost incurred will be $6,277.04
for a small car and $10,766.20 for a larger family car. The potential savings for those that choose to use public
transport from South East Melbourne to the inner city and leave the car at home would be $4,366.96 for a small car
and $4,381.40 for a larger family car.
The savings for those that sell their car, or choose not to buy an additional car, are more substantial. Those
commuting from West Melbourne to the inner city can potentially save $5,855.52 in one year by selling or not buying
a small car, or $10,350.23 by selling or not buying a family car.
Those commuting from South East Melbourne to the inner city can potentially save $8,944.00 per annum by selling or
not buying a small car, or $13,477.60 by selling or not buying a family car.
In all circumstances examined, commuters can potentially save by choosing to use public transport to commute to
work. The potential for savings depends on one’s circumstances such as the vehicle they own and the distance they
travel to work.

8/9/2019 REPORT Commuter Costs Potential Savings Report
http://slidepdf.com/reader/full/report-commuter-costs-potential-savings-report 22/44
22
THE COSTS OF COMMUTING: AN ANALYSIS OF POTENTIAL COMMUTER SAVINGS
8/9/2019 REPORT Commuter Costs Potential Savings Report
http://slidepdf.com/reader/full/report-commuter-costs-potential-savings-report 23/44
8/9/2019 REPORT Commuter Costs Potential Savings Report
http://slidepdf.com/reader/full/report-commuter-costs-potential-savings-report 24/44
8/9/2019 REPORT Commuter Costs Potential Savings Report
http://slidepdf.com/reader/full/report-commuter-costs-potential-savings-report 25/44
25
THE COSTS OF COMMUTING: AN ANALYSIS OF POTENTIAL COMMUTER SAVINGS
only the fixed costs of the car, that being $5,464.16 for a small car and $9,643.92 for a family car, plus the costs of
buying an annual train ticket, which is approximately $1,729.60. By leaving the car at home and using public
transport, the total cost incurred will be $7,193.76 for a small car and $11,373.52 for a family car. This results in
savings of $898.26 for small car drivers and $1,401.37 for larger car drivers.
A commuter travelling from North Sydney to the inner city who leaves the car at home and uses public transport will
incur the car’ s fixed cost, plus the cost of purchasing an annual train ticket which is approximately $1,214.40. By
leaving the car at home and using public transport, the total cost incurred will be $6,678.56 for a small car and
$10,858.32 for a family car. This results in savings of $721.89 for small car drivers and $1,011.25 for larger car
drivers.
The savings for those that sell their car, or choose not to buy an additional car, can be even more substantial. Those
commuting from Sutherland to the inner city can potentially save $6,362.42 annually by selling or not buying a small
car, or $11,045.29 by selling or choosing not to buy a family car.
Those commuting from North Sydney can potentially save $6,186.05 by selling or not buying a small car, or
$10,655.17 by selling or not buying a family car.
8/9/2019 REPORT Commuter Costs Potential Savings Report
http://slidepdf.com/reader/full/report-commuter-costs-potential-savings-report 26/44
26
THE COSTS OF COMMUTING: AN ANALYSIS OF POTENTIAL COMMUTER SAVINGS
BRISBANE
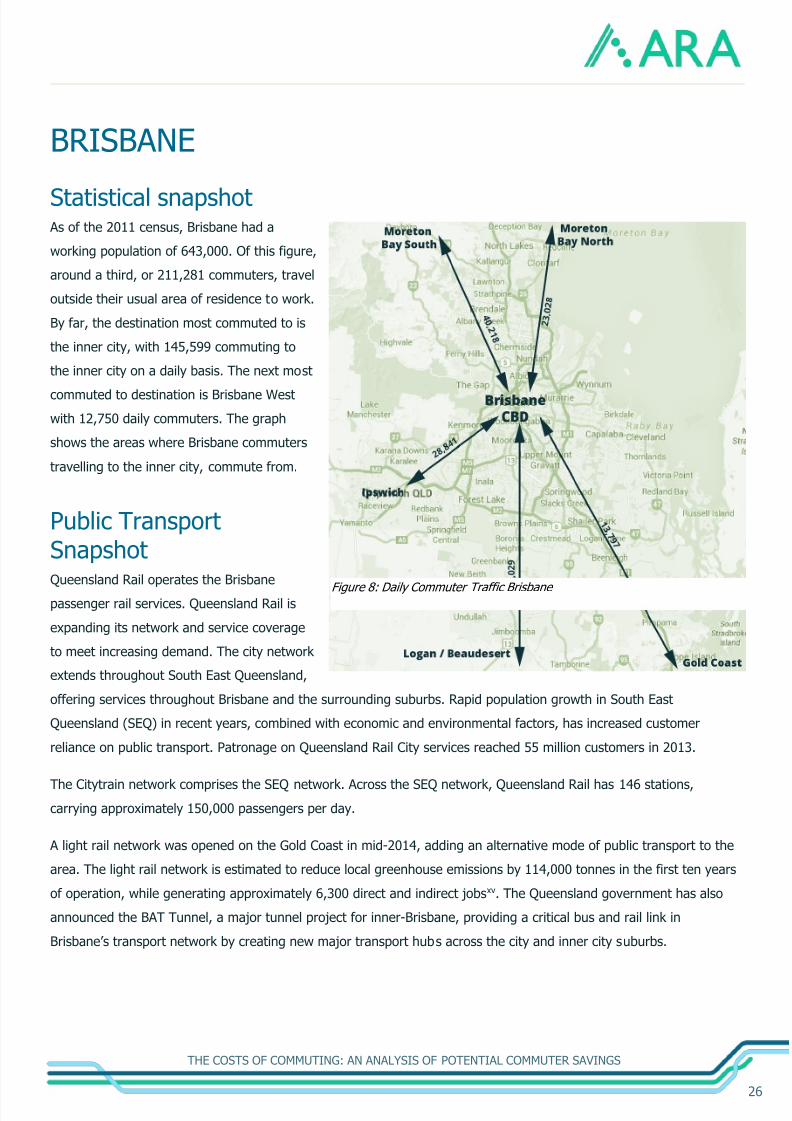
Statistical snapshot As of the 2011 census, Brisbane had a
working population of 643,000. Of this figure,
around a third, or 211,281 commuters, travel
outside their usual area of residence to work.
By far, the destination most commuted to is
the inner city, with 145,599 commuting to
the inner city on a daily basis. The next most
commuted to destination is Brisbane West
with 12,750 daily commuters. The graph
shows the areas where Brisbane commuters
travelling to the inner city, commute from.
Public TransportSnapshotQueensland Rail operates the Brisbane
passenger rail services. Queensland Rail is
expanding its network and service coverage
to meet increasing demand. The city network
extends throughout South East Queensland,
offering services throughout Brisbane and the surrounding suburbs. Rapid population growth in South East
Queensland (SEQ) in recent years, combined with economic and environmental factors, has increased customer
reliance on public transport. Patronage on Queensland Rail City services reached 55 million customers in 2013.
The Citytrain network comprises the SEQ network. Across the SEQ network, Queensland Rail has 146 stations,
carrying approximately 150,000 passengers per day.
A light rail network was opened on the Gold Coast in mid-2014, adding an alternative mode of public transport to the
area. The light rail network is estimated to reduce local greenhouse emissions by 114,000 tonnes in the first ten years
of operation, while generating approximately 6,300 direct and indirect jobsxv. The Queensland government has also
announced the BAT Tunnel, a major tunnel project for inner-Brisbane, providing a critical bus and rail link in
Brisbane’s transport network by creating new major transport hubs across the city and inner city suburbs.
Figure 8: Daily Commuter Traffic Brisbane
8/9/2019 REPORT Commuter Costs Potential Savings Report
http://slidepdf.com/reader/full/report-commuter-costs-potential-savings-report 27/44
27
THE COSTS OF COMMUTING: AN ANALYSIS OF POTENTIAL COMMUTER SAVINGS
Driving Costs According to the RACQ, the annual fixed costs incurred from owning a small car, such as a Mazda 2, amount to
$4,916.60, while the annual fixed costs incurred from owning a larger family car, such as a Holden Commodore
amount to $9,471.28.
On top of this are the running costs, which differ depending on how far one travels per year. The RACQ includes
tyres, fuel and servicing in the running costs. According to the RACQ, the running costs for a small car amount to
17.55 cents per kilometre, while the running costs of a larger family car amount to 19.87 cents.
Using the two most popular commuting routes in Brisbane as examples, those being Logan to Inner Brisbane and
Moreton Bay South to Inner Brisbane, this report estimates the total driving costs for these commuters.
The Logan to Inner Brisbane daily roundtrip commute is 137.4km. This commute results in annual parking and
running costs of approximately $6,546.15 for a small car and $7,277.76 for a larger family car. Added to the annual
fixed costs along with parking costs, these commuters spend $11,462.75 and $16,749.04 for a small car and larger
family car respectively.
The distance of the Moreton Bay South to Inner Brisbane daily roundtrip is 120km. This commute results in annual
parking and running costs of approximately $6,843.80 for a small car and $7,482.56 for a larger family car, resulting
in total annual costs of $10,760.40 and $15,953.84 respectively.
Transport CostsPublic transport costs in Brisbane vary, depending on where one commutes to and from. Brisbane operates on a swipe
card system which prices journeys using a zonal system, where the further the destination, the greater the number of
zones one has to travel through and therefore pay for.
Using the commuter examples of Logan and Moreton Bay South to the inner city, the price of an annual train ticket is
approximately $3,836.16 and $2,712.96 respectively.
Potential SavingsThere are two avenues in which a commuter can save on commuting costs. The first is by leaving the car at home,
and using public transport. The second is by selling the car, or choosing to not buy an additional car, and using public
transport exclusively.
Again using the commuter examples of Logan and Moreton Bay South to the inner city, the potential savings are as
follows.
A commuter travelling from Logan to the inner city who leaves the car at home and uses public transport will incuronly the fixed cost of the car, that being $4,916.60 for a small car and $9,471.28 for a larger family car, plus the costs
8/9/2019 REPORT Commuter Costs Potential Savings Report
http://slidepdf.com/reader/full/report-commuter-costs-potential-savings-report 28/44
28
THE COSTS OF COMMUTING: AN ANALYSIS OF POTENTIAL COMMUTER SAVINGS
of buying an annual train ticket, which is approximately $3,836.16. Therefore, by leaving the car at home and using
public transport, the total cost incurred will be $8,752.76 for a small car and $13,305.88 for a larger family car. The
potential savings for those that use public transport from Logan to the inner city and leave the car at home would be
$2,709.99 for a small car and $3,443.16 for a larger family car.
A commuter travelling from Moreton Bay South to the inner city who leaves the car at home and uses public transport
will incur only the fixed cost of the car, that being $4,916.60 for a small car and $9,471.28 for a larger family car, plus
the costs of buying an annual train ticket, which is approximately $2,712.96. Therefore, by leaving the car at home
and using public transport, the total cost incurred will be $7,629.56 for a small car and $12,182.68 for a larger family
car. The potential savings for those that use public transport from Moreton Bay South to the inner city and leave the
car at home would be $3,130.84 for a small car and $3,771.16 for a larger family car.
The savings for those that sell their car, or choose not to purchase a second car and use public transport instead can
potentially save on the fixed costs of owning a car less the cost of annual transport. Those commuting from Logan to
the inner city can potentially save $7,626.59 by selling or not buying a small household car, or $12,912.88 by selling
or not buying a larger family car.
Those commuting from Moreton Bay South to the inner city can potentially save $8,047.44 by selling or not buying a
small car, or $13,240.88.
ADELAIDE
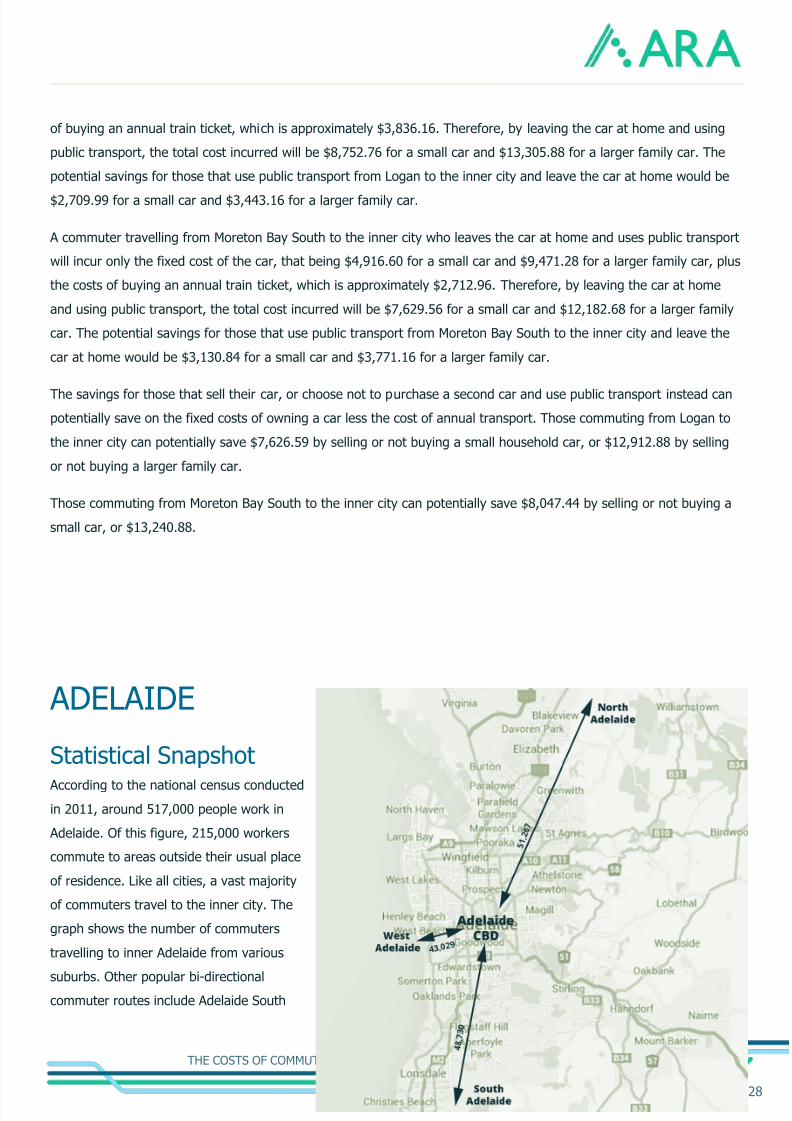
Statistical Snapshot
According to the national census conducted
in 2011, around 517,000 people work in
Adelaide. Of this figure, 215,000 workers
commute to areas outside their usual place
of residence. Like all cities, a vast majority
of commuters travel to the inner city. The
graph shows the number of commuters
travelling to inner Adelaide from various
suburbs. Other popular bi-directionalcommuter routes include Adelaide South

8/9/2019 REPORT Commuter Costs Potential Savings Report
http://slidepdf.com/reader/full/report-commuter-costs-potential-savings-report 29/44
29
THE COSTS OF COMMUTING: AN ANALYSIS OF POTENTIAL COMMUTER SAVINGS
to/from Adelaide West and Adelaide North to/from Adelaide West.
Public Transport SnapshotThe South Australian Department of
Planning, Transport and Infrastructure
operates the passenger rail network in
Adelaide. Four Rail Lines are operated in the Adelaide Metro Network:
Gawler Central Line – servicing Northern suburbs
Outer Harbor/Grange Line – servicing North Western suburbs
Belair Line – servicing South Eastern suburbs
Seaford Line – servicing Southern suburbs
Public transport growth is being supported by significant investment in public transport revitalisation with $2.6 billion
planned to be invested between 2008-9 and 2017-18 on train, tram and bus infrastructure. Rail Revitalisation is the
centrepiece of the 10-year, $2.6 billion investment in public transport.
Driving Costs According to the RAA South Australia, the annual fixed costs incurred from owning a small car, such as a Mazda 2,
amount to $4,897.36, while the annual fixed costs incurred from owning a larger family car, such as a Holden
Commodore amount to $9,922.92.
Added to this cost are running costs, which vary depending on how far one travels per year, and also the parking
costs. The RAA includes fuel, tyres and servicing costs in its total running costs. According to the RAA, the running
costs for a small car equals $18.38 per km and $20.70 per km for a larger car.
Using the two most popular commuting routes in Adelaide; Adelaide south (Seaford) to Adelaide Central and Hills, and
Adelaide North (Salisbury) to Adelaide Central and Hills, this report estimates the total running costs for these
commuters.
The distance of the Salisbury to Inner Adelaide daily roundtrip is 43.2 km. This commute results in annual parking and
running costs of approximately $2,826.24 for a small car and $2,858.03 for a larger car. Adding the running costs and
parking costs to the fixed car ownership costs results in total annual car commuter costs of $7,723.60 and $12,780.67
respectively.
The Seaford to Inner Adelaide daily roundtrip is 71.8 km. This commute results in annual parking and running costs of
approximately $4,035.27 for a small car and $4,088.12 for larger car, resulting in total annual costs of $8,932.63 and
$14,010.76 respectively, with parking costs included.
Figure 9: Daily Commuter Traffic Adelaide

8/9/2019 REPORT Commuter Costs Potential Savings Report
http://slidepdf.com/reader/full/report-commuter-costs-potential-savings-report 30/44
30
THE COSTS OF COMMUTING: AN ANALYSIS OF POTENTIAL COMMUTER SAVINGS
Transport Costs Adelaide has a flat fare ticketing system. As a result, commuters in Adelaide pay $1,762.80 for an annual commuter
pass for the train network regardless of the distance they travel.
Potential SavingsUsing the commuter examples of Seaford and Salisbury to the inner city, the potential savings are as follows. A
commuter travelling from Seaford to the inner city who leaves their car at home and uses public transport will incur
only the fixed cost of the car plus the costs of buying an annual train ticket. For someone who owns a small car this
cost will be $6,660.16, whilst the owner of a family car will incur a cost of around $11,685.44. The potential savings
made from leaving the car at home and commuting to work would be approximately $2,272.47 for the driver of a
small car, or $2,325.32 for the driver of a family car.
The costs incurred for those leaving the car at home and commuting from Salisbury to the inner city are
approximately $6,660.16 for small car owners and $11,685.44 for family car owners. Therefore, those that leave the
car at home can make the potential savings of around $1,063.44 if owning a small car, or $1,095.23 if owning a family
car.
The savings that can be potentially made by those that sell their car, or similarly choose not to purchase an additional
car can be even more substantial. For someone from Seaford who sells their small car and uses public transport
instead to get to the inner city for work, a potential saving of $7,169.83 could be made, or $12,247.96 if owning a
family car. For those that commute from Salisbury, these savings could potentially amount to $5,960.80 for small car
owners, or $11,017.87 for family car owners.
8/9/2019 REPORT Commuter Costs Potential Savings Report
http://slidepdf.com/reader/full/report-commuter-costs-potential-savings-report 31/44
31
THE COSTS OF COMMUTING: AN ANALYSIS OF POTENTIAL COMMUTER SAVINGS
PERTH
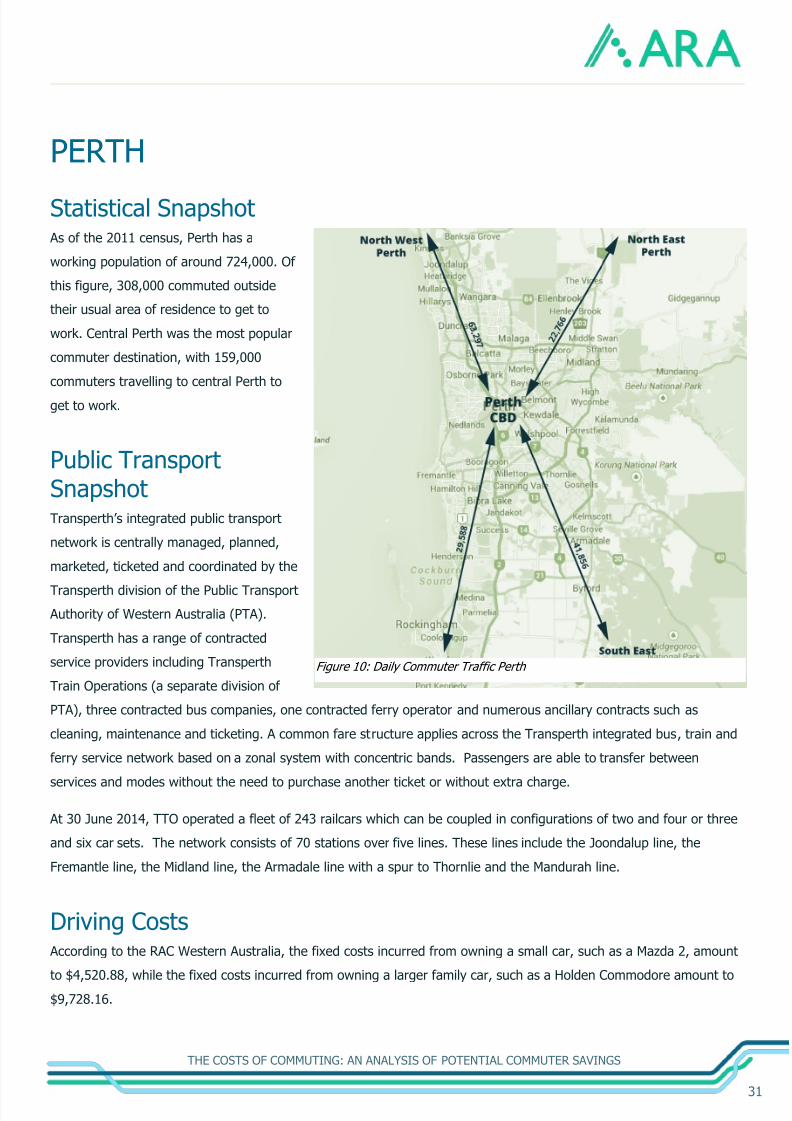
Statistical Snapshot As of the 2011 census, Perth has a
working population of around 724,000. Of
this figure, 308,000 commuted outside
their usual area of residence to get to
work. Central Perth was the most popular
commuter destination, with 159,000
commuters travelling to central Perth to
get to work.
Public TransportSnapshotTransperth’s integrated public transport
network is centrally managed, planned,
marketed, ticketed and coordinated by the
Transperth division of the Public Transport
Authority of Western Australia (PTA).
Transperth has a range of contracted
service providers including Transperth
Train Operations (a separate division of
PTA), three contracted bus companies, one contracted ferry operator and numerous ancillary contracts such as
cleaning, maintenance and ticketing. A common fare structure applies across the Transperth integrated bus, train and
ferry service network based on a zonal system with concentric bands. Passengers are able to transfer between
services and modes without the need to purchase another ticket or without extra charge.
At 30 June 2014, TTO operated a fleet of 243 railcars which can be coupled in configurations of two and four or three
and six car sets. The network consists of 70 stations over five lines. These lines include the Joondalup line, the
Fremantle line, the Midland line, the Armadale line with a spur to Thornlie and the Mandurah line.
Driving Costs According to the RAC Western Australia, the fixed costs incurred from owning a small car, such as a Mazda 2, amount
to $4,520.88, while the fixed costs incurred from owning a larger family car, such as a Holden Commodore amount to$9,728.16.
Figure 10: Daily Commuter Traffic Perth
8/9/2019 REPORT Commuter Costs Potential Savings Report
http://slidepdf.com/reader/full/report-commuter-costs-potential-savings-report 32/44
32
THE COSTS OF COMMUTING: AN ANALYSIS OF POTENTIAL COMMUTER SAVINGS
On top of this are the running costs and parking costs. The RAC includes fuel, tyres, and servicing in the running
costs. According to the RAC, the running costs for a small car amount to 17.13 cents per kilometre, while the running
costs of a larger family car amount to 19.22 cents per kilometre.
Using the two most popular commuting routes in Perth as examples, those being South West to Central Perth and
North West to Central Perth, this report estimates the total running costs for these commuters.
The distance of the South West to Central Perth daily roundtrip is 30.2 km. This commute results in annual parking
and running costs of approximately $2,189.71 for a small car and $2,334.73 for a larger family, resulting in total
annual costs of $6,710.59 and $12,062.89 respectively when parking costs are included.
The distance of the North West to Central Perth daily roundtrip is 39.4 km. This commute results in annual parking
and running costs of approximately $2,552.14 for a small car and $2,741.34 for a larger family car, resulting in total
annual costs of $7,073.02 and $12,469.50 respectively when parking costs are included.
Transport CostsPublic transport costs in Perth vary depending on where one commutes to and from.
Using the above examples of South West Perth and North West Perth, the price of an annual train ticket is
approximately $1,584.00 and $2,270.40 respectively.
Potential SavingsUsing the two commuter examples of South West Perth to the inner city and North West Perth to the inner city, the
potential savings are as follows. A commuter travelling from South West Perth to the inner city who leaves the car
home and uses public transport will incur only the fixed cost of the car, that being $4,520.88 for a small car and
$9,728.16 for a family car, plus the cost of buying an annual train ticket, which is approximately $1,584.00. Therefore,
by leaving the car at home and using public transport, the total cost incurred will be $6,104.88 for a small car and
$11,312.16 for a family car. This results in potential savings of $605.71 for small car drivers and $750.73 for larger car
drivers.
A commuter travelling from North West Perth to the inner city who leaves the car at home and uses public transport
will incur only the fixed cost of the car, that being $4,520.88 for a small car and $9,728.16 for a family car, plus the
cost of buying an annual train ticket, which is approximately $2,270.40. Therefore, by leaving at home and using
public transport, the total cost incurred will be $6,791.28 for a small car and $11,998.56 for a family car. This results
in potential savings of $281.74 for small car drivers and $750.73 for larger car drivers.
The savings for those that sell their car, or similarly choose not to buy an additional car, are substantial. Those
commuting from South West Perth to the inner city can potentially save $4,126.59 annually by selling or choosing notto buy a small car, or $9,478.89 annually by selling or choosing not to buy a family car.
8/9/2019 REPORT Commuter Costs Potential Savings Report
http://slidepdf.com/reader/full/report-commuter-costs-potential-savings-report 33/44
33
THE COSTS OF COMMUTING: AN ANALYSIS OF POTENTIAL COMMUTER SAVINGS
Those commuting from North West Perth to the inner city can potentially save $3,802.62 annually by selling or
choosing not to buy a small car, or $9,199.10 annually by selling or choosing not to buy a family car.
Again, it must be noted that other costs that are specific to an individual such as, toll costs and car repair costs shouldbe added in order to calculate the true potential savings of using public transport to commute to work.
8/9/2019 REPORT Commuter Costs Potential Savings Report
http://slidepdf.com/reader/full/report-commuter-costs-potential-savings-report 34/44
8/9/2019 REPORT Commuter Costs Potential Savings Report
http://slidepdf.com/reader/full/report-commuter-costs-potential-savings-report 35/44
35
THE COSTS OF COMMUTING: AN ANALYSIS OF POTENTIAL COMMUTER SAVINGS
The distance of the Huntingfield to inner Hobart daily roundtrip is 29 km. This commute results in annual parking and
running costs of approximately $2,301.13 for a small car and $2,278.11 for a family car, resulting in total annual costs
of $6,793.93 and $10,063.51 respectively.
Transport CostsUsing the commuter examples of Glenorchy and Huntingfield to inner Hobart, the annual cost of bus fares is
approximately $1,104.00 and $1,545.60 respectively.
Potential Savings A commuter travelling from Glenorchy to the inner city who leaves the car home and uses public transport will incur
only the fixed cost of the car, that being $4,492.80 for a small car and $8,785.40 for a family car, plus the annual cost
of buying bus tickets ticket, which is approximately $1,104.00. Therefore, by leaving the car at home and using public
transport, the total cost incurred will be $5,596.80 for a small car and $9,889.40 for a family car. This results in
potential savings of $587.51 for small car drivers and $575.27 for larger car drivers.
A commuter travelling from Huntingfield to the inner city who leaves the car at home and uses public transport will
incur only the fixed cost of the car, that being $4,492.80 for a small car and $8,785.40 for a family car, plus the
annual cost of buying bus tickets, which is approximately $1,545.60. Therefore, by leaving the car at home and using
public transport will incur a total cost of $6,038.40 for a small car and $10,331.00 for a family car. This results in
potential savings of $755.53 for small car drivers and $732.51 for larger car drivers.
The savings for those that sell their car, or choose not to buy an additional car, can be substantial. Those commuting
from Glenorchy to the inner city can potentially save $5,080.31 annually by selling or choosing not to buy a small car,
or $9,360.67 annually by selling or choosing not to buy a family car and commuting by bus.
Those commuting from Huntingfield to the inner city can potentially save $5,248.33 annually by selling or choosing
not to buy a small car, or $9,517.91 annually by selling or choosing not to buy a family car.
CANBERRA
Statistical Snapshot
8/9/2019 REPORT Commuter Costs Potential Savings Report
http://slidepdf.com/reader/full/report-commuter-costs-potential-savings-report 36/44
36
THE COSTS OF COMMUTING: AN ANALYSIS OF POTENTIAL COMMUTER SAVINGS
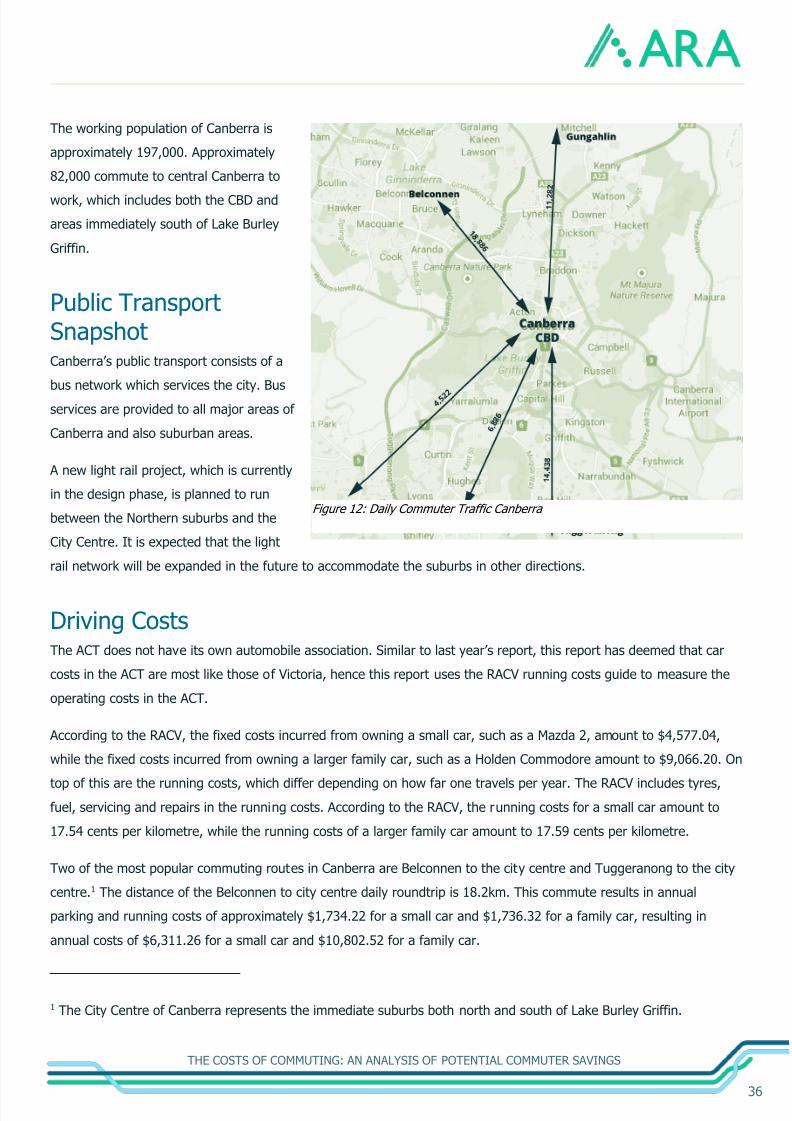
The working population of Canberra is
approximately 197,000. Approximately
82,000 commute to central Canberra to
work, which includes both the CBD and
areas immediately south of Lake Burley
Griffin.
Public TransportSnapshotCanberra’s public transport consists of a
bus network which services the city. Bus
services are provided to all major areas of
Canberra and also suburban areas.
A new light rail project, which is currently
in the design phase, is planned to run
between the Northern suburbs and the
City Centre. It is expected that the light
rail network will be expanded in the future to accommodate the suburbs in other directions.
Driving CostsThe ACT does not have its own automobile association. Similar to last year’s report, this report has deemed that car
costs in the ACT are most like those of Victoria, hence this report uses the RACV running costs guide to measure the
operating costs in the ACT.
According to the RACV, the fixed costs incurred from owning a small car, such as a Mazda 2, amount to $4,577.04,
while the fixed costs incurred from owning a larger family car, such as a Holden Commodore amount to $9,066.20. On
top of this are the running costs, which differ depending on how far one travels per year. The RACV includes tyres,fuel, servicing and repairs in the running costs. According to the RACV, the running costs for a small car amount to
17.54 cents per kilometre, while the running costs of a larger family car amount to 17.59 cents per kilometre.
Two of the most popular commuting routes in Canberra are Belconnen to the city centre and Tuggeranong to the city
centre.1 The distance of the Belconnen to city centre daily roundtrip is 18.2km. This commute results in annual
parking and running costs of approximately $1,734.22 for a small car and $1,736.32 for a family car, resulting in
annual costs of $6,311.26 for a small car and $10,802.52 for a family car.
1 The City Centre of Canberra represents the immediate suburbs both north and south of Lake Burley Griffin.
Figure 12: Daily Commuter Traffic Canberra
8/9/2019 REPORT Commuter Costs Potential Savings Report
http://slidepdf.com/reader/full/report-commuter-costs-potential-savings-report 37/44
37
THE COSTS OF COMMUTING: AN ANALYSIS OF POTENTIAL COMMUTER SAVINGS
The distance of the Tuggeranong to city centre daily roundtrip is 43.8km. This commute results in annual parking and
running costs of approximately $2,766.98 for a small car and $2772.02 for a family car, resulting in annual costs of
$7,344.02 for a small car and $11,838.22 for a family car.
Transport CostsCanberra’s public transport network currently consists of a bus system only, which transports passengers around
Canberra’s suburbs. The bus system runs on a swipe card system called ‘MyWay’. A commuter can expect to pay
$2.84 per trip under 90 minutes (which includes all direct trips). Subsequently, the annual public transport cost for a
commuter would be approximately $1,363.20.
Potential SavingsUsing the two commuter examples of Belconnen and Tuggeranong to the city centre, the potential savings are as
follows. A commuter travelling from Belconnen to the inner city who leaves the car at home and uses public transport
will incur only the fixed cost of the car, that being $4,577.04 for a small car and $9,066.20 for a family car, plus the
costs of buying an annual bus ticket, which is approximately $1,363.00. Therefore, by leaving the car at home and
using public transport, the total cost incurred will be $5,940.04 for a small car and $10,429.20 for a family car. This
results in potential savings of $371.22 for small car drivers and $373.32 for larger car drivers.
A commuter travelling from Tuggeranong to the inner city who leaves the car at home and uses public transport will
incur the car’ s fixed costs, plus the cost of purchasing an annual bus ticket which is approximately $1,363.00.
Therefore, by leaving the car at home and using public transport, the total cost incurred will be $5,940.04 for a small
car and $10,429.20 for a family car. This results in potential savings of $1,403.98 for small car drivers and $1,409.02
for larger car drivers.
The savings for those that sell their car, or similarly choose not to buy an additional car, can be far more substantial.
Those commuting from Belconnen to the inner city can potentially save $4,948.26 annually by selling or not buying a
small car, or $9,439.52 annually by selling or choosing not to buy a family car.
Those commuting from Tuggeranong to the inner city can potentially save $5,981.02 annually by selling or not buying
a small car, or $10,475.22 annually by selling or choosing not to buy a family car.
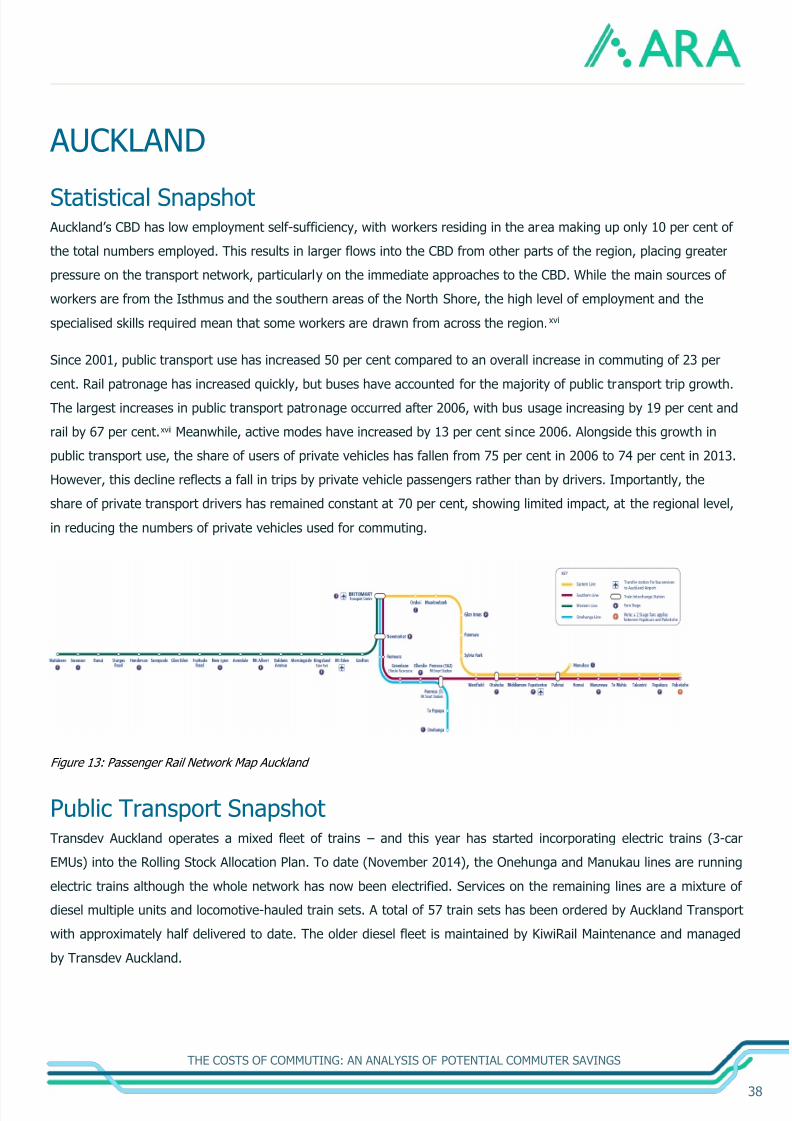
8/9/2019 REPORT Commuter Costs Potential Savings Report
http://slidepdf.com/reader/full/report-commuter-costs-potential-savings-report 38/44
38
THE COSTS OF COMMUTING: AN ANALYSIS OF POTENTIAL COMMUTER SAVINGS
AUCKLAND
Statistical Snapshot Auckland’s CBD has low employment self-sufficiency, with workers residing in the area making up only 10 per cent of
the total numbers employed. This results in larger flows into the CBD from other parts of the region, placing greater
pressure on the transport network, particularly on the immediate approaches to the CBD. While the main sources of
workers are from the Isthmus and the southern areas of the North Shore, the high level of employment and the
specialised skills required mean that some workers are drawn from across the region.xvi
Since 2001, public transport use has increased 50 per cent compared to an overall increase in commuting of 23 per
cent. Rail patronage has increased quickly, but buses have accounted for the majority of public transport trip growth.
The largest increases in public transport patronage occurred after 2006, with bus usage increasing by 19 per cent and
rail by 67 per cent.xvii Meanwhile, active modes have increased by 13 per cent since 2006. Alongside this growth in
public transport use, the share of users of private vehicles has fallen from 75 per cent in 2006 to 74 per cent in 2013.
However, this decline reflects a fall in trips by private vehicle passengers rather than by drivers. Importantly, the
share of private transport drivers has remained constant at 70 per cent, showing limited impact, at the regional level,
in reducing the numbers of private vehicles used for commuting.
Figure 13: Passenger Rail Network Map Auckland
Public Transport SnapshotTransdev Auckland operates a mixed fleet of trains – and this year has started incorporating electric trains (3-car
EMUs) into the Rolling Stock Allocation Plan. To date (November 2014), the Onehunga and Manukau lines are running
electric trains although the whole network has now been electrified. Services on the remaining lines are a mixture of
diesel multiple units and locomotive-hauled train sets. A total of 57 train sets has been ordered by Auckland Transport
with approximately half delivered to date. The older diesel fleet is maintained by KiwiRail Maintenance and managed
by Transdev Auckland.
8/9/2019 REPORT Commuter Costs Potential Savings Report
http://slidepdf.com/reader/full/report-commuter-costs-potential-savings-report 39/44
39
THE COSTS OF COMMUTING: AN ANALYSIS OF POTENTIAL COMMUTER SAVINGS
Driving Costs According to the New Zealand Automobile Association (AA), the fixed costs of owning a small car amount to
$4,532.00, while the fixed costs incurred from owning a large car amount to $10,367.00
On top of this are the running costs, which differ depending on how far one travels per year. The New Zealand AA
includes fuel, tyres, servicing and maintenance in its running costs. According to the New Zealand AA, the running
costs for a small car amount to 20.6 cents per kilometre, while the running costs of a large car amount to 33.2 cents
per kilometre.
Using two commuter routes of Waitakere to inner Auckland and Pukekohe to inner Auckland, this report estimates the
total driving costs for these commuters.
The distance of the Waitakere to inner Auckland daily roundtrip is 48 kilometres. This commute results in annual
parking and running costs of approximately $3,274.24 for a small car and $4,667.28 for a large car, resulting in total
annual costs of $7,806.24 and $15,032.28 respectively when added to the fixed car ownership costs.
The distance of the Pukekohe to inner Auckland daily roundtrip is 100 kilometres. This commute results in annual
parking and running costs of approximately $5,766.43 for a small car and $8,681.82 for a large car, resulting in total
annual costs of $10,298.43 and $19,048.82 respectively.
Transport Costs Auckland operates on a zoned system to charge for public transport use, where the more zones a passenger travels
through the greater the transport fare. Using the two commuter examples of Waitakere and Pukekohe to the city
centre, the annual costs of commuting via public transport would be $3,128.00 and $3,864.00 respectively.
Potential Savings A commuter travelling from Waitakere to the inner city who leaves the car at home and uses public transport will incur
only the fixed cost of the car, that being $4,532 for a small car and $10,367 for a large car, plus the costs of buying
an annual train ticket, which is approximately $3,128.00. Therefore, by leaving the car at home and using public
transport, the total cost incurred will be $7,660.00 for a small car and $13,495.00 for a large car. This results in
potential savings of $146.24 for small car drivers and $1,537.28 for large car drivers.
A commuter travelling from Pukekohe to the inner city who leaves the car at home and uses public transport will incur
the car’ s fixed costs, plus the cost of purchasing an annual train ticket which is approximately $3,864.00. Therefore,
by leaving the car at home and using public transport, the total cost incurred will be $8,396.00 for a small car and
$14,231.00 for a large car. This results in potential savings of $1,902.43 for small car drivers and $4,817.82 for large
car drivers.

8/9/2019 REPORT Commuter Costs Potential Savings Report
http://slidepdf.com/reader/full/report-commuter-costs-potential-savings-report 40/44
40
THE COSTS OF COMMUTING: AN ANALYSIS OF POTENTIAL COMMUTER SAVINGS
The savings for those that sell their car, or similarly choose not to buy an additional household car, can be far more
substantial. Those commuting from Waitakere to the inner city can potentially save $4,678.24 annually by selling or
not buying a small car, or $11,904.28 annually by selling or choosing not to buy a large car.
Those commuting from Pukekohe to the inner city can potentially save $6,434.43 annually by selling or not buying a
small car, or $15,184.82 annually by selling or choosing not to buy a large car.

8/9/2019 REPORT Commuter Costs Potential Savings Report
http://slidepdf.com/reader/full/report-commuter-costs-potential-savings-report 41/44
41
THE COSTS OF COMMUTING: AN ANALYSIS OF POTENTIAL COMMUTER SAVINGS
WELLINGTON
Statistical SnapshotIn Wellington, the most popular method of getting to work is the car, with 39,756 workers driving a car to work.
However, this figure is 3 per cent lower than in 2006. Interestingly, walking or jogging to work is becoming more
popular, with greater proportions of the working population choosing these methods to get to work. The use of trains
and buses has remained relatively steady since 2006.
Figure 14: Passenger Rail Network Map Wellington
Public Transport SnapshotTranz Metro provides urban passenger rail operations and maintenance services in Wellington New Zealand under
contract to Greater Wellington Regional Council. Tranz Metro operates four lines and carries over 11 million
passengers per annum, running over 2,100 services per week.
Driving Costs According to the New Zealand Automobile Association (AA), the fixed costs of owning a small car amount to
$4,532.00, while the fixed costs incurred from owning a large car amount to $10,367.00. On top of this are the
running costs, which differ depending on how far one travels per year. The New Zealand AA includes fuel, tyres and
servicing and maintenance in its running costs. According to the New Zealand AA, the running costs for a small car
amount to 20.6 cents per kilometre, while the running costs of a large car amount to 33.2 cents.
8/9/2019 REPORT Commuter Costs Potential Savings Report
http://slidepdf.com/reader/full/report-commuter-costs-potential-savings-report 42/44
42
THE COSTS OF COMMUTING: AN ANALYSIS OF POTENTIAL COMMUTER SAVINGS
Using two commuter routes of Wakanae to inner Wellington and Johnsonville to inner Wellington, this report
estimates the total driving costs for these commuters.
The distance of the Wakanae to inner Wellington daily roundtrip is 131 kilometres. This commute results in annualparking and running costs of approximately $7,456.86 for a small car and $11,406.21 for a large car. Added to the
fixed costs identified above, this results in total annual costs of $10,989.86 and $21,773.21 respectively.
The distance of Johnsonville to inner Wellington daily roundtrip is 19 kilometres. This commute results in annual
parking and running costs of approximately $1,939.360 for a small car and $2,513.92 for a large car, resulting in total
annual costs of $6,471.36 and $12,880.92 respectively.
Transport CostsThe annual cost of public transport from Wakanae and Johnsonville to inner Wellington is approximately $3,585.60
and $1,306.80 respectively.
Potential SavingsUsing the two commuter examples of Wakanae and Johnsonville to the city centre, the potential savings are as
follows. A commuter travelling from Wakanae to the inner city who leaves the car at home and uses public transport
will incur only the fixed cost of the car, that being $4,532 for a small car and $10,367 for a large car, plus the costs of
buying an annual train ticket, which is approximately $3,585.60. Therefore, by leaving the car at home and usingpublic transport, the total cost incurred will be $8,117.60 for a small car and $13,952.60 for a large car. This results in
potential savings of $3,871.26 for small car drivers and $7,820.61.
A commuter travelling from Johnsonville to the inner city who leaves the car at home and uses public transport will
incur the car’ s fixed costs, plus the cost of purchasing an annual train ticket which is approximately $1,306.80.
Therefore, by leaving the car at home and using public transport, the total cost incurred will be $5,838.80 for a small
car and $11,673.80 for a large car. This results in potential savings of $632.56 for small car drivers and $1,207.12 for
large car drivers.
The savings for those that sell their car, or similarly choose not to buy an additional car, can be far more substantial.
Those commuting from Wakanae to the inner city can potentially save $8,403.26 annually by selling or not buying a
small car, or $18,187.61 annually by selling or choosing not to buy a large car.
Those commuting from Johnsonville to the inner city can potentially save $5,164.56 annually by selling or not buying
a small car, or $11,574.12 annually by selling or choosing not to buy a large car.
8/9/2019 REPORT Commuter Costs Potential Savings Report
http://slidepdf.com/reader/full/report-commuter-costs-potential-savings-report 43/44
43
THE COSTS OF COMMUTING: AN ANALYSIS OF POTENTIAL COMMUTER SAVINGS
CONLUSIONIn estimating the costs of commuting and the potential savings that can be made from using public transport as an
alternative, the report found the following potential savings:
The average Australian commuter pays $11,996.39 per annum in car ownership and running costs.
The average New Zealander commuter pays $11,852.98 per annum in car ownership and running costs.
For those that decide to not own a car and commute with public transport instead, Australians on average can
potentially save $9,973.66 per annum.
For those that decide to not own a car and commute with public transport instead, New Zealand commuters
on average can potentially save $9,065.78 each year.
On average, if an Australian car owner decides to leave their vehicle at home and use public transport to
commute to work, they can potentially save $1,724.59 a year.
On average, if a New Zealand car owner decides to leave their vehicle at home and use public transport to
commute to work, they can potentially save $2,119.03 a year.
These findings show that many commuters from Australia and New Zealand stand to save considerably if they switch
between driving a private vehicle to work and using public transport. These savings will play a large role in easing the
economic strain on Australian and New Zealand household living costs. Further, these savings allow workers to spend
their income on activities they enjoy, rather than having to pay large amounts of money to simply get to and from
work daily.
Not only can commuters save immensely from using public transport, the surrounding community stands to benefit
greatly. Using public transport helps lower environmental damage substantially. It also plays a major role in alleviating
inner city congestion. In weighing up how to commute to work, commuters should be aware of these benefits and the
improvements to the community they bring.

8/9/2019 REPORT Commuter Costs Potential Savings Report
http://slidepdf.com/reader/full/report-commuter-costs-potential-savings-report 44/44
REFERENCE LIST
i Auckland Transport 2014, Monthly Parking Leases, https://at.govt.nz/driving-parking/monthly-parking-leases/ii ABS 2011, Australian National Census.iii BITRE 2014, ‘Estimating Urban Traffic and Congestion Cost Trends for Australian Cities’,www.bitre.gov.au/publications/2007/files/wp_071.pdfiv Tourism and Transport Forum 2014, www.ttf.org.au/Content/bprreport181114.aspxv Statistics New Zealand 2014, Key Labour Force Measures by Qualification, Age and SexMeasurehttp://nzdotstat.stats.govt.nz/wbos/Index.aspx?DataSetCode=TABLECODE7080vi Greater Wellington Regional Council 2014, ‘Wellington Regional Public Transport Plan’http://www.gw.govt.nz/assets/Transport/Regional-transport/RPTP/draft-RPTP-2014.PDFvii Newman, P, Glazebrook, G, Kenworthy, J 2012, ‘All Aboard: the growth of global rail and our future cities’, TheConversation, <http://theconversation.com/all-aboard-the-growth-of-global-rail-and-our-future-cities-10377>viii
Monash University http://www.monash.edu.au/people/transport-parking/permits/purchase/, Australian NationalUniversity, http://facilities.anu.edu.au/services/transport/parking-fees, Sydney Universityhttp://sydney.edu.au/visitors_community/getting_here/parking-prices.shtmlix Sydney Motorways 2014, http://sydneymotorways.com/assets/sydney-motorways-toll-charges.pdfx Australian Government 2014, Department of Infrastructure and Regional Development,www.greenvehicleguide.gov.auxi New Zealand Transport Agency 2014, http://www.tollroad.govt.nz/Tariffsxii Metro Trains Melbourne 2014, http://www.metrotrains.com.au/who-we-are/xiii V/Line 2014, http://www.vline.com.au/about/ourcompany/Intro.htmlxiv Transport Sydney Trains 2014, http://www.sydneytrains.info/about/factsxv Gold Coast Light Rail 2014, http://www.goldcoastlightrail.com.au/xvi http://www.transport.govt.nz/assets/Uploads/Research/Documents/Richard-Paling-report-Transport-Patterns-in-the-Auckland-Region-Executive-Summary.pdfxvii (http://www.transport.govt.nz/assets/Uploads/Research/Documents/Richard-Paling-report-Transport-Patterns-in-the-Auckland-Region-Executive-Summary.pdf)