report guide client reportsholdings by investor 23 holdings by investor detail 24 holdings by net...
TRANSCRIPT

Client ReportsREPORT GUIDE

Contents
Introduction 3
Batch Reporting 3
Report Packages 4
Account Performance 5
Account Performance Detail 6
Account Summary 7
Account Value and Performance 8
Accrual Detail 9
Asset Allocation 10
Asset Class Performance 11
Comparative Holdings by Classification 12
Comparative Holdings by Investor 13
Comparative Holdings by Net Worth 14
Comparative Holdings with Detail 15
Contributions and Withdrawals 16
Estimated Cash Flow 17
Estimated Cash Flow by Security 18
Fixed Income by Maturity 19
Fixed Income Snapshot 20
Gain/Loss by Investor 21
Holdings by Classification 22
Holdings by Investor 23
Holdings by Investor Detail 24
Holdings by Net Worth 25
Holdings by Portfolio 26
Income and Expense 27
Major Indices Performance 28
Model Comparison 29
Multi-Period Performance 30
Multi-Period Portfolio Detail 31
Portfolio Monitor 32
Portfolio Performance 33
Portfolio Risk and Return 34
Portfolio Snapshot 35
Portfolio Snapshot Summary 36
Portfolio Summary 37
Portfolio Summary with Transactions 38
Portfolio Value and Benchmark 39
Security Performance 40
Tax Lot Gain/Loss by Investor 41
Tax Lot Realized Gain/Loss by Investor 42
Tax Lot Unrealized Gain/Loss by Investor 43
Transactions by Investor 44
Transactions by Portfolio 45
UMA Model Comparison 46
UMA Performance 47
Yield by Investor 48
Yield by Portfolio 49
Compliance Disclosure 50
3
IntroductionFor more than 20 years, Wealth Reporting and Insights has helped advisors demonstrate their value with consolidated performance reporting. A commitment to data quality and resiliency gives our client reports an accurate, single view of portfolio information that help build trusted relationships. These versatile reports display information for individual clients or user-defined portfolios, which are households that can represent any combination of clients or accounts.
Consisting of holdings, transactions and performance reports, the client reports are available in three formats: a Web-based on-screen display, Adobe Acrobat PDF or comma-separated value (csv), for use in spreadsheet applications. You can quickly and easily produce these reports to have the critical information available to create holistic financial plans and report on portfolio performance. All reports can be generated for a specific date or time period. Available time periods are as follows:
Month-to-Date 1 Month Trailing
Quarter-to-Date 1 Quarter Trailing
Year-to-Date 1 Year Trailing
Last Month 3 Year Trailing
Last Quarter 5 Year Trailing
Last Year 10 Year Trailing
Since Start Date 1 Year Trailing Latest Month-End
Since Start Date to Latest Month-End 3 Year Trailing Latest Month-End
Since Start Date to Latest Quarter-End 5 Year Trailing Latest Month-End
Since Start Date to Latest Year End 10 Year Trailing Latest Month-End
Year-to-Date Latest Month-End 1 Year Trailing Latest Quarter-End
Quarter-to-Date Latest Month-End 3 Year Trailing Latest Quarter-End
Start Day to End Day 5 Year Trailing Latest Quarter-End
BATCH REPORTINGAlbridge’s easy-to-use batch reporting automates the preparation and distribution of report packages to clients. Reports can be set to automatically print or be distributed to clients via email monthly, quarterly or yearly, to keep them informed on how they are progressing toward their financial goals.
4
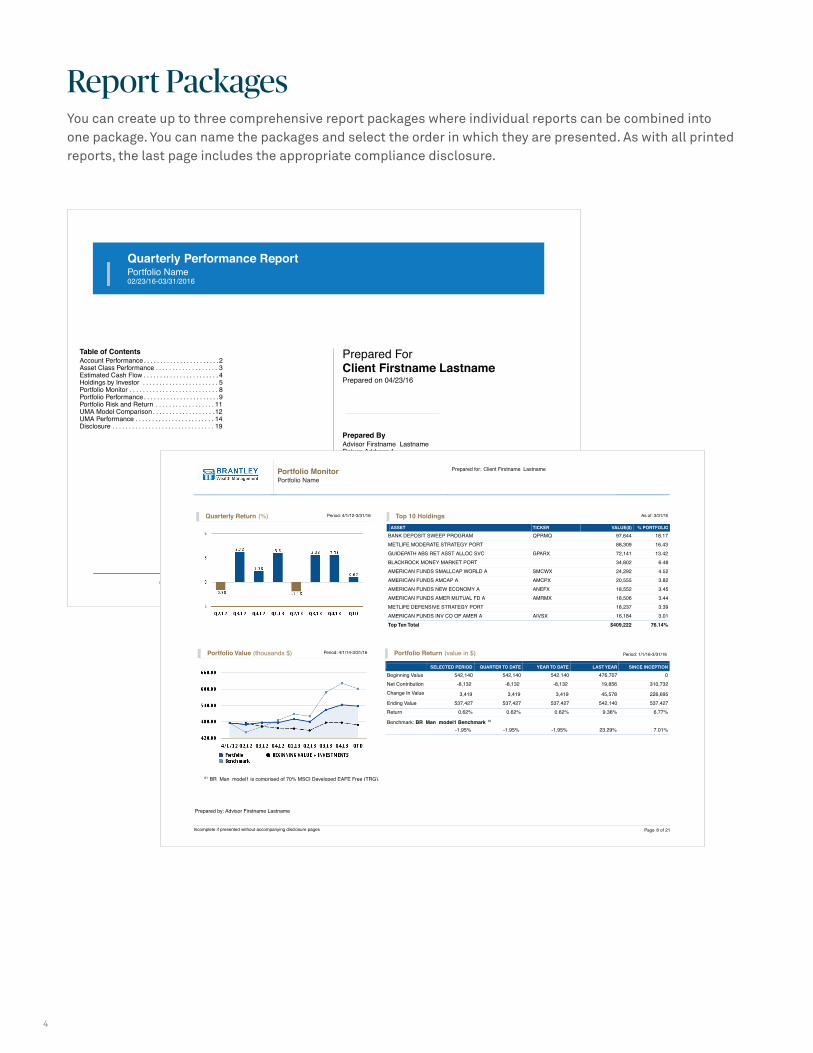
Report PackagesYou can create up to three comprehensive report packages where individual reports can be combined into one package. You can name the packages and select the order in which they are presented. As with all printed reports, the last page includes the appropriate compliance disclosure.
© 2016 Albridge Solutions, Inc. Albridge Solutions, Inc. is an affiliate of Pershing LLC, member FINRA, NYSE, SIPC, a wholly owned subsidiary of The Bank of New York Mellon Corporation (BNY Mellon).
Prepared ForClient Firstname Lastname Prepared on 04/23/16
Prepared ByAdvisor Firstname LastnameReturn Address 1Return Address 2Advisor City, NY [email protected]
Quarterly Performance ReportPortfolio Name02/23/16-03/31/2016
Table of ContentsAccount Performance . . . . . . . . . . . . . . . . . . . . . . .2Asset Class Performance . . . . . . . . . . . . . . . . . . . 3Estimated Cash Flow . . . . . . . . . . . . . . . . . . . . . . . 4Holdings by Investor . . . . . . . . . . . . . . . . . . . . . . . 5Portfolio Monitor . . . . . . . . . . . . . . . . . . . . . . . . . . . 8Portfolio Performance . . . . . . . . . . . . . . . . . . . . . . .9Portfolio Risk and Return . . . . . . . . . . . . . . . . . . 11UMA Model Comparison . . . . . . . . . . . . . . . . . . . 12UMA Performance . . . . . . . . . . . . . . . . . . . . . . . . 14Disclosure . . . . . . . . . . . . . . . . . . . . . . . . . . . . . . . 19
Portfolio MonitorPortfolio Name
Prepared for:
Client Firstname Lastname
Quarterly Return (%) Period: 4/1/12-3/31/16
Top 10 Holdings As of: 3/31/16
ASSET TICKER VALUE($) % PORTFOLIO
BANK DEPOSIT SWEEP PROGRAM QPRMQ 97,644 18.17METLIFE MODERATE STRATEGY PORT 88,309 16.43GUIDEPATH ABS RET ASST ALLOC SVC GPARX 72,141 13.42BLACKROCK MONEY MARKET PORT 34,802 6.48AMERICAN FUNDS SMALLCAP WORLD A SMCWX 24,292 4.52AMERICAN FUNDS AMCAP A AMCPX 20,555 3.82AMERICAN FUNDS NEW ECONOMY A ANEFX 18,552 3.45AMERICAN FUNDS AMER MUTUAL FD A AMRMX 18,506 3.44METLIFE DEFENSIVE STRATEGY PORT 18,237 3.39AMERICAN FUNDS INV CO OF AMER A AIVSX 16,184 3.01Top Ten Total $409,222 76.14%
Portfolio Value (thousands $) Period: 4/1/14-3/31/16
Portfolio Return (value in $) Period: 1/1/16-3/31/16
SELECTED PERIOD QUARTER TO DATE YEAR TO DATE LAST YEAR SINCE INCEPTION
Beginning Value 542,140 542,140 542,140 476,707 0Net Contribution -8,132 -8,132 -8,132 19,856 310,732Change In Value 3,419 3,419 3,419 45,578 226,695Ending Value 537,427 537,427 537,427 542,140 537,427Return 0.62% 0.62% 0.62% 9.36% 6.77%
Benchmark: BR_Man_model1 Benchmark 61 -1.95% -1.95% -1.95% 23.29% 7.01%
61 BR_Man_model1 is comprised of 70% MSCI Developed EAFE Free (TRG).
Prepared by: Advisor Firstname Lastname
Incomplete if presented without accompanying disclosure pages Page 8 of 21
5
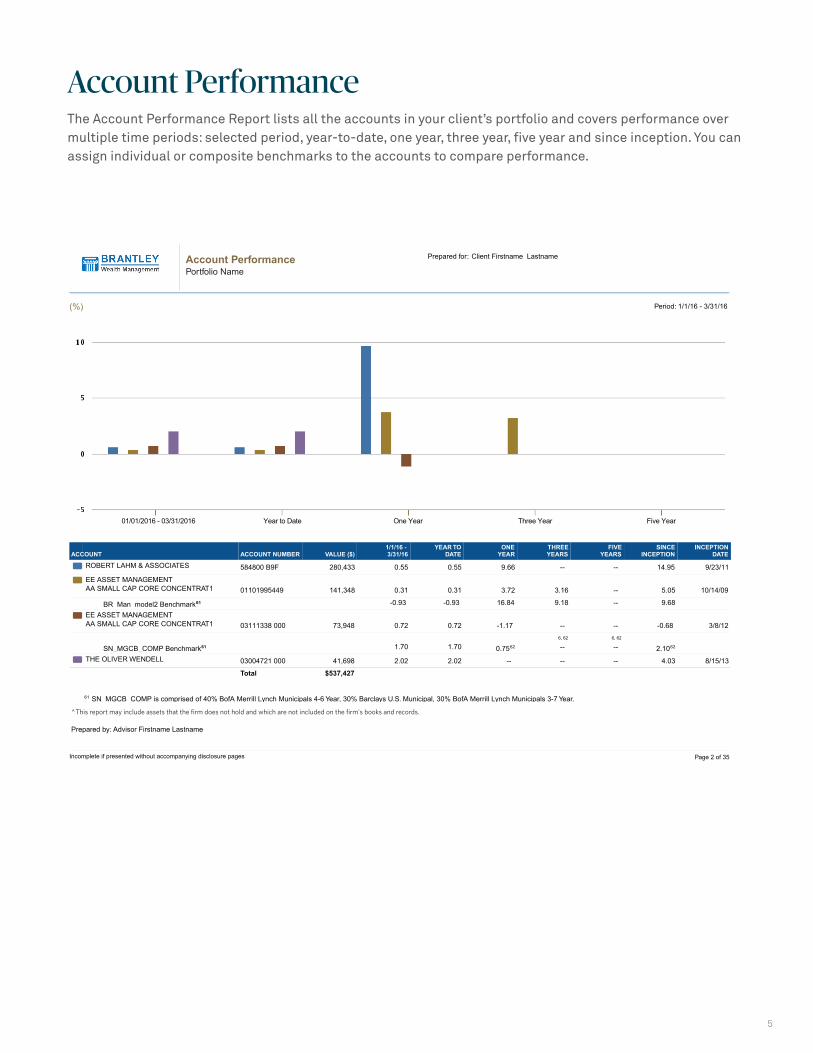
Account PerformanceThe Account Performance Report lists all the accounts in your client’s portfolio and covers performance over multiple time periods: selected period, year-to-date, one year, three year, five year and since inception. You can assign individual or composite benchmarks to the accounts to compare performance.
Account PerformancePortfolio Name
Prepared for: Client Firstname Lastname
(%) Period: 1/1/16 - 3/31/16
ACCOUNT ACCOUNT NUMBER VALUE ($)1/1/16 -3/31/16
YEAR TODATE
ONEYEAR
THREEYEARS
FIVEYEARS
SINCEINCEPTION
INCEPTIONDATE
ROBERT LAHM & ASSOCIATES 584800 B9F 280,433 0.55 0.55 9.66 -- -- 14.95 9/23/11
EE ASSET MANAGEMENT AA SMALL CAP CORE CONCENTRAT1 01101995449 141,348 0.31 0.31 3.72 3.16 -- 5.05 10/14/09
BR_Man_model2 Benchmark61 -0.93 -0.93 16.84 9.18 -- 9.68
EE ASSET MANAGEMENT AA SMALL CAP CORE CONCENTRAT1 03111338 000 73,948 0.72 0.72 -1.17 -- -- -0.68 3/8/12
SN_MGCB_COMP Benchmark61 1.70 1.70 0.7562
6, 62
--6, 62
-- 2.1062
THE OLIVER WENDELL 03004721 000 41,698 2.02 2.02 -- -- -- 4.03 8/15/13
Total $537,427
61 SN_MGCB_COMP is comprised of 40% BofA Merrill Lynch Municipals 4-6 Year, 30% Barclays U.S. Municipal, 30% BofA Merrill Lynch Municipals 3-7 Year.
Prepared by: Advisor Firstname Lastname
Incomplete if presented without accompanying disclosure pages
01/01/2016 - 03/31/2016 Year to Date One Year Three Year Five Year
Page 2 of 35
A This report may include assets that the firm does not hold and which are not included on the firm's books and records.

6
Account Performance DetailThe Account Performance Detail Report displays the bar chart return of each account along with the starting balance, net contributions, change in value, and ending balance.
Quarterly Report Package
Incomplete if presented without accompanying disclosure pages
Prepared for: Sample Investor
Prepared by: Sample Advisor
Page 2 of 21
Not intended for use with the client.
Account Performance DetailCombined Account Portfolio
Period: 12/22/16 - 3/21/17
A This report may include assets that the firm does not hold and which are not included on the firm's books and records.
% OF TOTAL ACCOUNT NAME BEGINNINGVALUE ($)
ENDINGVALUE ($)
NET CONTRIBUTIONS ($) RETURN (%)CHANGE INVALUE ($)
ACCOUNT ACCOUNT NUMBER
Performance (%)
12
8
4
0
-4
-8
-12
-6.48
9.21
6.78
1.81
-0.77
Core Accounts
4/11/13 FRANKLIN INCOME FUND - CLASS A 25.09
3/28/13 VANGUARD WELLESLEY INCOME INV 19.56
3/12/13 FRANKLIN INCOME FUND - CLASS A 25.20
2/10/13 FRANKLIN INCOME FUND - CLASS A 24.97
12/18/12 VANGUARD WELLESLEY INCOME INV 22.47
12/17/12 IVY ASSET STRATEGY I 14.45
12/17/12 IVY ASSET STRATEGY I 24.56
10/12/12 INVESCO BALANCED-RISK ALLOCATION - A 500.80
10/12/12 INVESCO BALANCED-RISK ALLOCATION - A 352.15
9/28/12 VANGUARD WELLESLEY INCOME INV 19.88
6/29/12 VANGUARD WELLESLEY INCOME INV 21.58
6/28/12 YACKTMAN FUND 22.86
6/28/12 YACKTMAN FUND 23.12
6/28/12 YACKTMAN FUND 43.56
3/30/12 VANGUARD WELLESLEY INCOME INV 20.54
12/30/11 YACKTMAN FUND 37.59
12/16/11 SUNAMERICA ALTERNATIVE STRATEGIES FUND CL A 25.19
12/13/11 INVESCO BALANCED-RISK ALLOCATION - A 190.95
12/13/11 INVESCO BALANCED-RISK ALLOCATION - A 344.97
12/12/11 IVY ASSET STRATEGY I 53.02
8/12/11 PERMANENT PORTFOLIO FUND 82.55
8/12/11 PERMANENT PORTFOLIO FUND 140.49
8/12/11 PERMANENT PORTFOLIO FUND 35.80
Dividends Total: $2,071.35
Income Total: $3,690.06
Rushmore Investment Advisors Large Cap Growth XXXXX5927 4,13,567 0 38,060 4,51,627 9.21
AllianceBernstein L.P. US Large Cap Growth XXXXX9763 3,38,790 -19,500 22,052 3,41,342 6.78
Delaware Investments Large Cap Growth XXXXX2062 1,40,351 4,720 2,580 1,47,651 1.81
Eaton Vance Management 7 - Year Municipal Bond XXXXX1919 5,81,622 -9,125 -4,515 5,67,981 -0.77
AllianceBernstein L.P. US Large Cap Growth XXXXX1839 1,90,632 0 -12,347 1,78,284 -6.48
Portfolio Total: $1,664,963 -$23,904 $45,829 $1686,888 2.78%

7
Account SummaryThe Account Summary Report displays all of the client accounts included in the report with identifying information such as tax status and market value.
Quarterly Report Package
Incomplete if presented without accompanying disclosure pages
Prepared for: Sample Investor
Prepared by: Sample Advisor
Page 2 of 19
Not intended for use with the client.
Account SummaryCombined Account Portfolio
As of: 2/1/17
A This report may include assets that the firm does not hold and which are not included on the firm's books and records.
% OF TOTAL ACCOUNT NAME
3.05
4.99
6.87
3.58
--6
--6
8.13
5.18
4.89
3.22
ESTIMATEDANNUAL YIELD (%)
ESTIMATEDANNUAL INCOME ($)
216
648
4,887
--6
--6
2,225
2,632
1,452
1,684
765
$6,874
% OF TOTAL
36.27
16.81
6.95
3.00
2.90
0.24
12.78
9.65
6.71
4.69
100%
VALUE ($)
67,528
31,302
12,945
5,580
5,409
456
23,796
17,968
12,494
8,725
$186,207
TAX STATUS
Qualified
Qualified
Qualified
Qualified
Non-Qualified
Non-Qualified
Non-Qualified
Non-Qualified
Non-Qualified
Undefined
Investor Retirement
Investor Roth IRA
Investor Roth IRA
Investor Tax-Deferred IRAs
Investor 15754212
Investor 12354564
Investor 13754212
Investor 47774212
Investor 45754212
Investors 1 and 2
ACCOUNT NAME
2FG329357
2FG329357
2FG329357
2NC021390
2NC027365
2NC027365
2NC031391
2NC031391
2NC031391
772525589
ACCOUNT NUMBER
Sample Investor 1
% OF TOTAL ACCOUNT NAME
3.01
4.99
6.69
--6
--6
--6
ESTIMATEDANNUAL YIELD (%)
ESTIMATEDANNUAL INCOME ($)
216
648
4,887
--6
--6
2,225
$7,976
$14,850
% OF TOTAL
45.46
21.07
8.71
5.10
3.64
16.02
100%
VALUE ($)
67,528
31,302
12,945
7,580
5,409
23,796
$186,207
$275,588
TAX STATUS
Qualified
Qualified
Qualified
Qualified
Non-Qualified
Undefined
Investor Retirement M
Investor Roth IRA
Investor Roth IRA
Investor Tax-Deferred IRAs
Investor 15754212
Investor 12354564
ACCOUNT NAME
2FG329357
2FG329357
2FG329357
2NC021390
2NC027365
2NC027365
ACCOUNT NUMBER
Sample Investor 2
M This account represents a Manual Account.
Sample Investor 2 Total:
Total:
Sample Investor 1 Total:

8
Account Value and PerformanceThe Account Value and Performance Report provides account-level performance information on daily, monthly, quarterly and yearly periods. The report is configurable within the Report Settings screen.
Quarterly Report PackageQuarterly Report Package
Incomplete if presented without accompanying disclosure pages
Prepared for: Sample Investor
Prepared by: Sample Advisor
Page 2 of 11
Not intended for use with the client.Account Value and PerformanceCombined Account Portfolio
A This report may include assets that the firm does not hold and which are not included on the firm's books and records.
2013* 390491 5000 14508 410000 5.00
Q3, 13: 9/19/13-9/30/13* 374757 1000 4603 380360 1.50
Q4, 13: 10/1/13-12/31/13 380360 1000 28639 410000 7.79
2014 410000 5000 9317 424317 3.49
Q1, 14: 1/1/14-3/31/14 410000 1000 1360 412360 0.58
Q2, 14: 4/1/14-6/30/14 412360 1500 3031 416891 1.10
Q3, 14: 7/1/14-9/30/14 416891 1000 2289 420180 0.79
Q4, 14: 10/1/14-12/31/14 420180 1500 2636 424317 0.98
2015 424317 -25000 6581 405898 -4.34
Q1, 15: 1/1/15-3/31/15 424317 0 1043 425360 0.25
Q2, 15: 4/1/15-6/30/15 425360 0 2531 427891 0.60
Q3, 15: 7/1/15-9/30/15 427891 -25000 -710 402180 -6.01
Q4, 15: 10/1/15-12/31/15 402180 0 3717 405898 0.92
2016 405898 2000 -59141 348757 -14.08
Q1, 16: 1/1/16-3/31/16 405898 2000 -538 407360 0.36
Q2, 16: 4/1/16-6/30/16 407360 2000 -18468 390891 -4.04
Q3, 16: 7/1/16-9/30/16 390891 0 -35710 355180 -9.14
Q4, 16: 10/1/16-12/31/16 355180 -2000 -4423 348757 -1.81
2017* 348757 8000 -8975 347782 -0.28
Jan, 17 348757 1000 -17396 332360 -4.70
Feb, 17 332360 1000 -4468 328891 -1.04
Mar, 17 328891 1000 13289 343180 4.34
Apr, 17 343180 1000 -517 343663 0.14
May, 17 343663 1000 -2147 342516 -0.33
Account Name: Sample Account 1
Account Number: XXXXX2945 Account Type: IRA
Sample Investor 1
Program: Sample Program Manager: Spectrum Advisor Managed Account Type: Sample Account
% OF TOTAL ACCOUNT NAME CHANGE IN VALUE ($) ENDING VALUE ($) RETURN (%)BEGINNING VALUE ($) NET CONTRIBUTION ($)PERIOD
Period: 9/19/13 - 8/20/17
Jun, 17 343664 1000 -2147 342516 -0.33
Jun, 17 342516 1000 -2639 340876 -0.48
Jul, 17 340876 1000 5379 347255 1.87
Aug, 17* 347255 1000 -473 347782 0.15
8/1/2017 347255 0 21 347277 0.01
8/2/2017 347277 0 21 347298 0.01
8/3/2017 347298 0 20 347318 0.01
8/4/2017 347318 0 19 347338 0.01
8/5/2017 347338 0 18 347356 0.01
8/6/2017 347356 0 -14473 332883 0.05
8/7/2017 332883 0 620 333504 0.19
8/8/2017 333504 0 594 334099 0.18
8/9/2017 334099 0 570 334669 0.17
8/10/2017 347255 0 21 347277 0.01
8/11/2017 347277 0 21 347298 0.01
8/12/2017 347298 0 20 347318 0.01
8/13/2017 347318 0 19 347338 0.01
8/14/2017 347338 0 18 347356 0.01
8/15/2017 347356 0 -14473 332883 -0.13
8/16/2017 332883 0 620 333504 0.19
8/17/2017 333504 0 594 334099 0.18
8/18/2017 334099 0 570 334669 0.17
8/19/2017 347277 0 21 347298 0.01
8/20/2017 347298 0 20 347318 0.19
9/19/13-8/20/17 $390,491 -$5,000 -$37,709 $347316 1.78%
Core Accounts
9
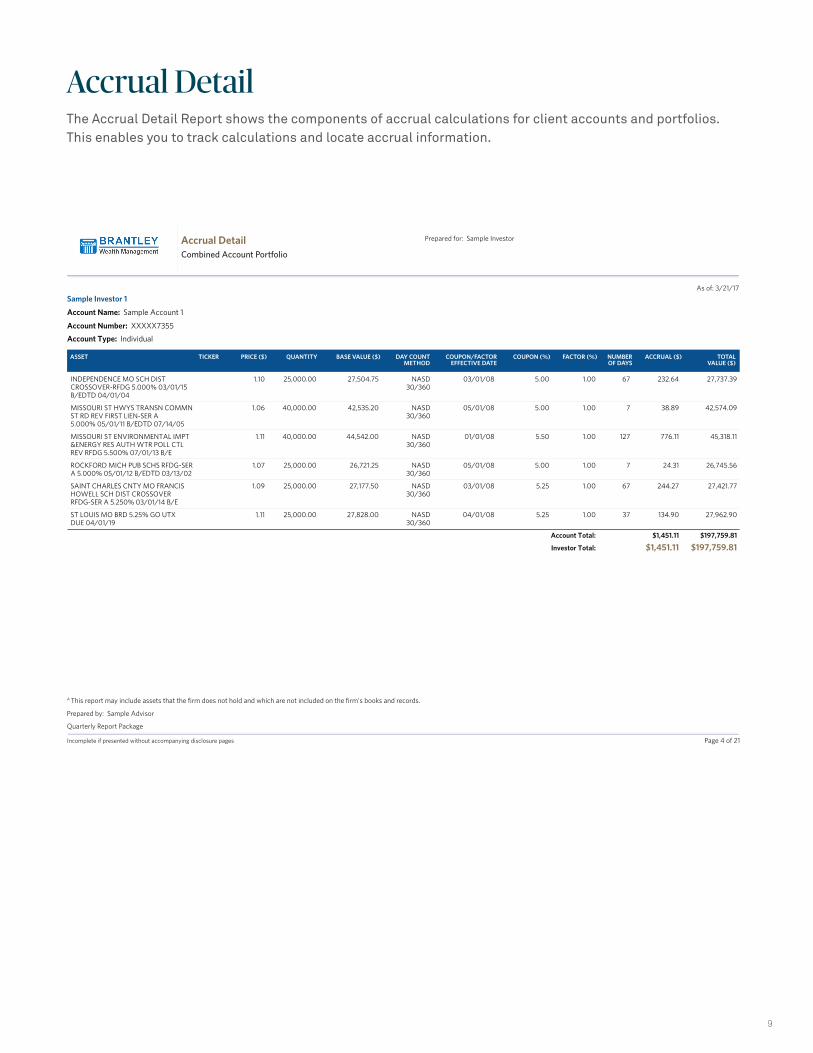
Accrual DetailThe Accrual Detail Report shows the components of accrual calculations for client accounts and portfolios. This enables you to track calculations and locate accrual information.
Not intended for use with the client.
Quarterly Report Package
Incomplete if presented without accompanying disclosure pages
Prepared for: Sample Investor
Prepared by: Sample Advisor
Page 4 of 21
INDEPENDENCE MO SCH DIST 1.10 25,000.00 27,504.75 NASD 03/01/08 5.00 1.00 67 232.64 27,737.39CROSSOVER-RFDG 5.000% 03/01/15 30/360B/EDTD 04/01/04
MISSOURI ST HWYS TRANSN COMMN 1.06 40,000.00 42,535.20 NASD 05/01/08 5.00 1.00 7 38.89 42,574.09ST RD REV FIRST LIEN-SER A 30/3605.000% 05/01/11 B/EDTD 07/14/05
MISSOURI ST ENVIRONMENTAL IMPT 1.11 40,000.00 44,542.00 NASD 01/01/08 5.50 1.00 127 776.11 45,318.11&ENERGY RES AUTH WTR POLL CTL 30/360REV RFDG 5.500% 07/01/13 B/E
ROCKFORD MICH PUB SCHS RFDG-SER 1.07 25,000.00 26,721.25 NASD 05/01/08 5.00 1.00 7 24.31 26,745.56A 5.000% 05/01/12 B/EDTD 03/13/02 30/360
SAINT CHARLES CNTY MO FRANCIS 1.09 25,000.00 27,177.50 NASD 03/01/08 5.25 1.00 67 244.27 27,421.77HOWELL SCH DIST CROSSOVER 30/360RFDG-SER A 5.250% 03/01/14 B/E
ST LOUIS MO BRD 5.25% GO UTX 1.11 25,000.00 27,828.00 NASD 04/01/08 5.25 1.00 37 134.90 27,962.90DUE 04/01/19 30/360
Account Total: $1,451.11 $197,759.81
Investor Total: $1,451.11 $197,759.81
TOTALVALUE ($)
BASE VALUE ($) DAY COUNTMETHOD
NUMBEROF DAYS
PRICE ($) QUANTITYTICKER COUPON/FACTOREFFECTIVE DATE
COUPON (%) FACTOR (%) ACCRUAL ($)ASSET
Accrual DetailCombined Account Portfolio
A This report may include assets that the firm does not hold and which are not included on the firm's books and records.
Account Name: Sample Account 1
Account Number: XXXXX7355
Account Type: Individual
Sample Investor 1
Program: Chase Strategic Portfolio IRA Accounts
Manager: Chase Strategic Portfolio
As of: 3/21/17
4/11/13 FRANKLIN INCOME FUND - CLASS A 25.09
3/28/13 VANGUARD WELLESLEY INCOME INV 19.56
3/12/13 FRANKLIN INCOME FUND - CLASS A 25.20
2/10/13 FRANKLIN INCOME FUND - CLASS A 24.97
12/18/12 VANGUARD WELLESLEY INCOME INV 22.47
12/17/12 IVY ASSET STRATEGY I 14.45
12/17/12 IVY ASSET STRATEGY I 24.56
10/12/12 INVESCO BALANCED-RISK ALLOCATION - A 500.80
10/12/12 INVESCO BALANCED-RISK ALLOCATION - A 352.15
9/28/12 VANGUARD WELLESLEY INCOME INV 19.88
6/29/12 VANGUARD WELLESLEY INCOME INV 21.58
6/28/12 YACKTMAN FUND 22.86
6/28/12 YACKTMAN FUND 23.12
6/28/12 YACKTMAN FUND 43.56
3/30/12 VANGUARD WELLESLEY INCOME INV 20.54
12/30/11 YACKTMAN FUND 37.59
12/16/11 SUNAMERICA ALTERNATIVE STRATEGIES FUND CL A 25.19
12/13/11 INVESCO BALANCED-RISK ALLOCATION - A 190.95
12/13/11 INVESCO BALANCED-RISK ALLOCATION - A 344.97
12/12/11 IVY ASSET STRATEGY I 53.02
8/12/11 PERMANENT PORTFOLIO FUND 82.55
8/12/11 PERMANENT PORTFOLIO FUND 140.49
8/12/11 PERMANENT PORTFOLIO FUND 35.80
Dividends Total: $2,071.35
Income Total: $3,690.06
10
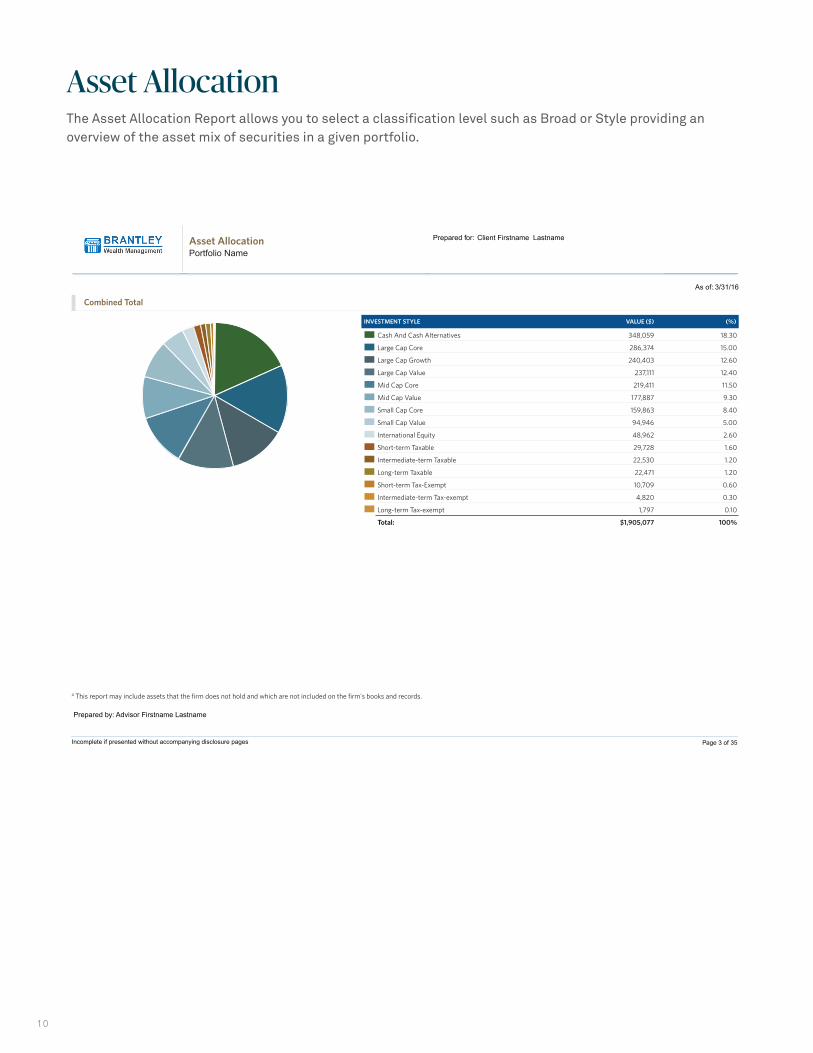
Asset AllocationThe Asset Allocation Report allows you to select a classification level such as Broad or Style providing an overview of the asset mix of securities in a given portfolio.
Asset AllocationPortfolio Name
Prepared for: Client Firstname Lastname
Prepared by: Advisor Firstname Lastname
Incomplete if presented without accompanying disclosure pages
As of: 3/31/16
Combined Total
INVESTMENT STYLE VALUE ($) (%)
Cash And Cash Alternatives
Large Cap Core
Large Cap Growth
Large Cap Value
Mid Cap Core
Mid Cap Value
Small Cap Core
Small Cap Value
International Equity
Short-term Taxable
Intermediate-term Taxable
Long-term Taxable
Short-term Tax-Exempt
Intermediate-term Tax-exempt
Long-term Tax-exempt
Total:
348,059
286,374
240,403
237,111
219,411
177,887
159,863
94,946
48,962
29,728
22,530
22,471
10,709
4,820
1,797
$1,905,077
18.30
15.00
12.60
12.40
11.50
9.30
8.40
5.00
2.60
1.60
1.20
1.20
0.60
0.30
0.10
100%
A This report may include assets that the firm does not hold and which are not included on the firm's books and records.
Page 3 of 35
11
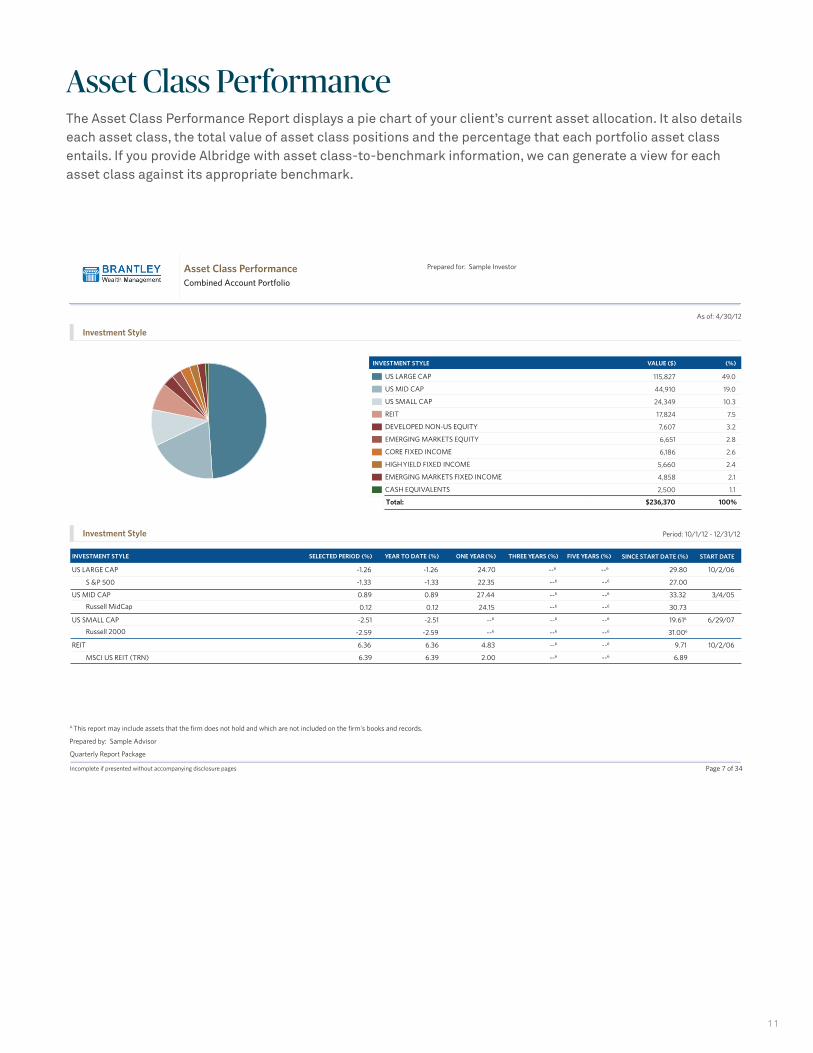
Asset Class PerformanceThe Asset Class Performance Report displays a pie chart of your client’s current asset allocation. It also details each asset class, the total value of asset class positions and the percentage that each portfolio asset class entails. If you provide Albridge with asset class-to-benchmark information, we can generate a view for each asset class against its appropriate benchmark.
Quarterly Report Package
Incomplete if presented without accompanying disclosure pages
Prepared for: Sample Investor
Prepared by: Sample Advisor
Page 7 of 34
INVESTMENT STYLE VALUE ($) (%)
US LARGE CAP
US MID CAP
US SMALL CAP
REIT
DEVELOPED NON-US EQUITY
EMERGING MARKETS EQUITY
CORE FIXED INCOME
HIGH YIELD FIXED INCOME
EMERGING MARKETS FIXED INCOME
CASH EQUIVALENTS
Total: $236,370 100%
US LARGE CAP --6 29.80
S &P 500 --6 27.00
US MID CAP --6 33.32
Russell MidCap --6 30.73
US SMALL CAP --6 19.616
Russell 2000 --6 31.006
REIT --6 9.71
MSCI US REIT (TRN) --6 6.89
Investment Style
Investment Style
--6
--6
--6
--6
--6
--6
--6
--6
Asset Class PerformanceCombined Account Portfolio
24.70
22.35
27.44
24.15
--6
--6
4.83
2.00
-1.26
-1.33
0.89
0.12
-2.51
-2.59
6.36
6.39
-1.26
-1.33
0.89
0.12
-2.51
-2.59
6.36
6.39
INVESTMENT STYLE THREE YEARS (%) FIVE YEARS (%) SINCE START DATE (%)ONE YEAR (%)YEAR TO DATE (%)SELECTED PERIOD (%)
Period: 10/1/12 - 12/31/12
As of: 4/30/12
115,827
44,910
24,349
17,824
7,607
6,651
6,186
5,660
4,858
2,500
49.0
19.0
10.3
7.5
3.2
2.8
2.6
2.4
2.1
1.1
10/2/06
3/4/05
6/29/07
10/2/06
START DATE
A This report may include assets that the firm does not hold and which are not included on the firm's books and records.

12
Comparative Holdings by ClassificationThe Comparative Holdings by Classification Report displays asset level performance by asset type and investment objective. With this report, you can show clients both the individual and overall performance of the holdings and asset classes in their portfolios.
Not intended for use with the client.
Quarterly Report Package
Incomplete if presented without accompanying disclosure pages
Prepared for: Sample Investor
Prepared by: Sample Advisor
Page 3 of 19
LVIP MONEY MARKET - SV CL 91,213.09 -1,949.01 110.90 89,379.97 0.12
Cash Total: $91,213.09 $-1,949.01 $110.90 $89,379.97 0.12%
Period: 10/1/16 - 12/31/16
Account Type: Cash
Investment Objective: Cash
RETURN (%)NET CONTRIBUTION ($)BEGINNING VALUE ($) CHANGE IN VALUE ($) ENDING VALUE ($)ASSET
Comparative Holdings by ClassificationCombined Account Portfolio
AWR MUTUAL FUND (30%) 22,420.10 -22,500.00 94.69 14.79 --7
INTEGRATED DATA CORP COM 0.30 0.00 0.05 0.35 16.67
ON2 TECHNOLOGIES INC COM 223.19 0.00 -6.99 216.20 -3.13
LARGE CAP - BLEND Total: $ 22,643.59 -$ 22,500.00 $ 87.75 $ 231.34 6.46%
Account Type: US Stocks
Investment Objective: Large Cap - Blend
RETURN (%)NET CONTRIBUTION ($)BEGINNING VALUE ($) CHANGE IN VALUE ($) ENDING VALUE ($)ASSET
DIVIDEND CAPITAL 11,075.10 0.00 174.45 11,249.55 1.58
JENNISON NATURAL RESOURCES FD CLC 24,278.43 0.00 4,439.54 28,717.97 18.29
SMALL CAP - GROWTH Total: $ 35,353.53 $0.00 $ 4,613.99 $ 39,967.53 13.05%
US STOCKS Total: $ 57,997.13 -$ 22,500.00 $ 4,701.74 $ 40,198.87 10.17% Total: $ 149,215.21 -$ 24,449.01 $ 4,812.64 $ 129,578.84 3.51%
Investment Objective: Small Cap - Growth
RETURN (%)NET CONTRIBUTION ($)BEGINNING VALUE ($) CHANGE IN VALUE ($) ENDING VALUE ($)ASSET
A This report may include assets that the firm does not hold and which are not included on the firm's books and records.

13
Comparative Holdings by InvestorThe Comparative Holdings by Investor Report displays detailed information of the performance of individual holdings and the return of the entire portfolio. It also provides an easy way to conduct performance analysis on a subaccount level.
Quarterly Report Package
Incomplete if presented without accompanying disclosure pages
Prepared for: Sample Investor
Prepared by: Sample Advisor
Page 4 of 19
Comparative Holdings by InvestorCombined Account Portfolio
A This report may include assets that the firm does not hold and which are not included on the firm's books and records.
Sample Investor 1
Account Name: Sample Account 1
Account Number: XXXXX0112
Account Type: Brokerage IRA
Managed Account Type: SMA (Separately Managed Account)Manager: Adelante Capital Management LLC
Total Return Strategy
Program: Lockwood Financial
ASSET PRICE ($) VALUE ($)
END DATE 12/31/16
PRIME FUND CAPITALRESERVES CLASS
RUSSELL EMERGINGMARKETS S
RUSSELL GLBL REAL ESTATESECURITIES S
RUSSELL INT’LDEVELOPED MARKETSFUND CLASS S
RUSSELL INVT CO GBL CRSTRG S
RUSSELL TAX MAGD USMID SM CAP S
RUSSELL TAX MANAGEDLARGE CAP S
2,947.22
652.37
246.80
1,479.21
569.69
730.08
4,091.41
QUANTITY
1.00
19.32
39.53
31.12
10.52
17.31
23.07
2,947.22
12,603.85
9,755.96
46,032.89
5,993.10
12,637.72
94,388.92
$184,359.66
$184,359.66
$184,359.66
0.00
8.45
6.90
6.90
3.34
2.73
1.36
3.52%
3.52%3.52%
PRICE ($) VALUE ($)
START DATE 10/1/16
3,058.29
645.99
237.22
1,449.90
554.94
727.91
4,064.90
QUANTITY
1.00
17.99
38.47
29.70
10.45
16.90
22.91
3,058.29
11,621.36
9,125.93
43,062.09
5,799.16
12,301.65
93,126.95
$178,095.43
$178,095.43
$178,095.43
% RETURN
Sample Account 1 Total:
Sample Investor 1 Total:
Total:
Period: 10/1/16 - 12/31/16

14
Comparative Holdings by Net WorthThis Comparative Holdings by Net Worth Report displays client holdings by assets and liabilities. It also calculates asset-level performance so you can show your clients the overall performance of their assets. Each account is sorted by asset/liability and tax status (non-qualified, qualified or undefined).
Quarterly Report Package
Incomplete if presented without accompanying disclosure pages
Prepared for: Sample Investor
Prepared by: Sample Advisor
Page 6 of 19
Not intended for use with the client.
XXXX3893 CASH -- 232.62 232.62 -- --7
XXXX3893 SEI INST. MANAGEDLARGE 12,726.59 -39.57 415.97 13,102.99 3.27 CAP VALUE FUND
XXXX3893 SEI INSTITUTIONALLY MANAGED 21,547.72 -67.07 -130.46 21,350.19 -0.60 CORE FIXED INCOME FUND
XXXX3893 SEI INSTITUTIONALLY MANAGED 1,654.27 -5.22 53.05 1,702.09 3.21 HIGH-YIELD BOND FUND
XXXX3893 SEI INSTITUTIONALLY MANAGED 2,406.29 -7.61 117.75 2,516.43 4.90 SMALL-CAP VALUE FUND
XXXX3893 SEI INSTL MANAGED TR-LG CAP GR A 13,289.21 -42.70 1,013.85 14,260.36 7.64
XXXX3893 SEI INSTL MANAGED TR-SM CAP GR A 1,622.28 -4.91 29.27 1,646.63 1.81
XXXX3893 SEI INTERNATIONAL EMERGING 4,169.39 -13.34 56.54 4,212.58 1.36 MARKETS DEBT FUND
XXXX3893 SEI INTERNATIONAL EMERGING 4,673.85 -15.64 508.71 5,166.92 10.89 MARKETS FUND
XXXX3893 SEI INTERNATIONAL EQUITY FUND 7,377.54 -24.74 858.22 8,211.03 11.64
XXXX3893 SEI INTL TR-INTL FIXD INCOME TRUST 3,753.98 -11.68 -37.83 3,704.48 -1.01
XXXX3893 SEI LIQUID ASSET PRIME OBL FUND 0.14 -0.14 0.00 -- 0.006
Non-Qualified Total: $73,221.26 $0.00 $2,652.46 $75,873.72 3.62%
Period: 10/1/16 - 12/31/16
Asset: Non-Qualified
% RETURNBEGINNING VALUE ($)ASSET NET CONTRIBUTIONS ($) ENDING VALUE ($)CHANGE IN VALUE ($)ACCT NUMBER
Comparative Holdings by Net WorthCombined Account Portfolio
XXXXX1304 LVIP MONEY MARKET -SV CL 91,218.09 -1,949.01 110.90 89,379.97 0.12
Undefined Total: $91,218.09 -$1,949.01 $110.90 $89,379.97 0.12%
Portfolio Total: $164,439.35 -$1,949.01 $2,763.35 $165,253.69 1.69%
Asset: Undefined
% RETURNBEGINNING VALUE ($)ASSET NET CONTRIBUTIONS ($) ENDING VALUE ($)CHANGE IN VALUE ($)ACCT NUMBER
Assets
A This report may include assets that the firm does not hold and which are not included on the firm's books and records.
15
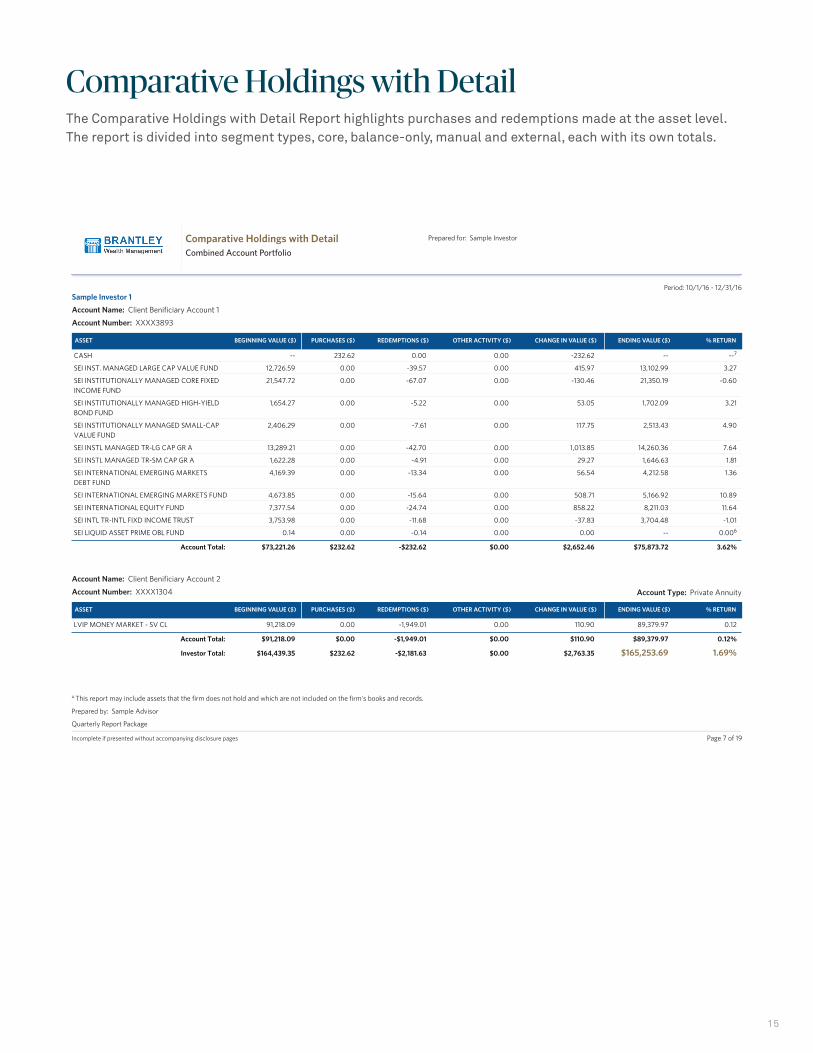
Comparative Holdings with DetailThe Comparative Holdings with Detail Report highlights purchases and redemptions made at the asset level. The report is divided into segment types, core, balance-only, manual and external, each with its own totals.
Quarterly Report Package
Incomplete if presented without accompanying disclosure pages
Prepared for: Sample Investor
Prepared by: Sample Advisor
Page 7 of 19
CASH -- 232.62 0.00 0.00 -232.62 -- --7
SEI INST. MANAGED LARGE CAP VALUE FUND 12,726.59 0.00 -39.57 0.00 415.97 13,102.99 3.27
SEI INSTITUTIONALLY MANAGED CORE FIXED 21,547.72 0.00 -67.07 0.00 -130.46 21,350.19 -0.60INCOME FUND
SEI INSTITUTIONALLY MANAGED HIGH-YIELD 1,654.27 0.00 -5.22 0.00 53.05 1,702.09 3.21BOND FUND
SEI INSTITUTIONALLY MANAGED SMALL-CAP 2,406.29 0.00 -7.61 0.00 117.75 2,513.43 4.90 VALUE FUND
SEI INSTL MANAGED TR-LG CAP GR A 13,289.21 0.00 -42.70 0.00 1,013.85 14,260.36 7.64
SEI INSTL MANAGED TR-SM CAP GR A 1,622.28 0.00 -4.91 0.00 29.27 1,646.63 1.81
SEI INTERNATIONAL EMERGING MARKETS 4,169.39 0.00 -13.34 0.00 56.54 4,212.58 1.36DEBT FUND
SEI INTERNATIONAL EMERGING MARKETS FUND 4,673.85 0.00 -15.64 0.00 508.71 5,166.92 10.89
SEI INTERNATIONAL EQUITY FUND 7,377.54 0.00 -24.74 0.00 858.22 8,211.03 11.64
SEI INTL TR-INTL FIXD INCOME TRUST 3,753.98 0.00 -11.68 0.00 -37.83 3,704.48 -1.01
SEI LIQUID ASSET PRIME OBL FUND 0.14 0.00 -0.14 0.00 0.00 -- 0.006
Account Total: $73,221.26 $232.62 -$232.62 $0.00 $2,652.46 $75,873.72 3.62%
Sample Investor 1
Account Name: Client Benificiary Account 1
Account Number: XXXX3893
Account Type: Brokerage IRA
Managed Account Type: Mutual Fund AdvisoryManager: Asset Dedication
Moderate Growth
Program: Asset MarkASSET % RETURNBEGINNING VALUE ($) PURCHASES ($) REDEMPTIONS ($) OTHER ACTIVITY ($) CHANGE IN VALUE ($) ENDING VALUE ($)
Comparative Holdings with DetailCombined Account Portfolio
Period: 10/1/16 - 12/31/16
LVIP MONEY MARKET - SV CL 91,218.09 0.00 -1,949.01 0.00 110.90 89,379.97 0.12
Account Total: $91,218.09 $0.00 -$1,949.01 $0.00 $110.90 $89,379.97 0.12%
Investor Total: $164,439.35 $232.62 -$2,181.63 $0.00 $2,763.35 $165,253.69 1.69%
Account Name: Client Benificiary Account 2
Account Number: XXXX1304
Account Type: Brokerage IRA
Managed Account Type: Mutual Fund AdvisoryManager: Asset Dedication
Moderate Growth
Program: Asset MarkASSET % RETURNBEGINNING VALUE ($) PURCHASES ($) REDEMPTIONS ($) OTHER ACTIVITY ($) CHANGE IN VALUE ($) ENDING VALUE ($)
Account Type: Private Annuity
A This report may include assets that the firm does not hold and which are not included on the firm's books and records.

16
Contributions and WithdrawalsThe Contributions and Withdrawals report shows a breakdown by portfolio and account of the various activity categories. The report offers an option for calendar or annualized reporting periods for the firm and an option for advisors, for portfolio and/or account expand or collapse.
Information Classification: Confidential5
SELECTED PERIOD ($) YEAR TO DATE ($) ONE YEAR ($) THREE YEARS ($) FIVE YEARS ($)SINCE START DATE ($)
1/1/07
Beginning Value
Net Contributions
Cash In
Transfers In
Net Withdrawals
Cash Out
Transfers Out
Investment Activity
Capital Gains Not Reinvested
Dividends Not Reinvested
Interest Not Reinvested
Net Purchase/Sales
Change in Value
Ending Value
Period: 12/22/15 – 3/21/16
Page 1 of 3
All Accounts
126,199 178,940 186,564 170,988 159,332 0
0 0 0 15,000 25,000 186,788
0 0 0 15,000 25,000 25,000
0 0 0 0 0 161,788
0 -52,000 -62,000 -62,000 -62,000 -62,000
0 -52,000 -52,000 -52,000 -52,000 -52,000
0 0 -10,000 -10,000 -10,000 -10,000
0 -2,150 -5,080 -15,885 -24,285 -24,285
0 0 -2,500 -7,500 -11,750 -11,750
0 -150 -215 -520 -1,8700 -1,900
0 -2,000 -2,350 -7,850 -10,650 -10,650
0 0 -15 -15 -15 -15
-873 536 5,842 17,223 27,279 24,823
125,326 125,326 125,326 125,326 125,326 125,326
17
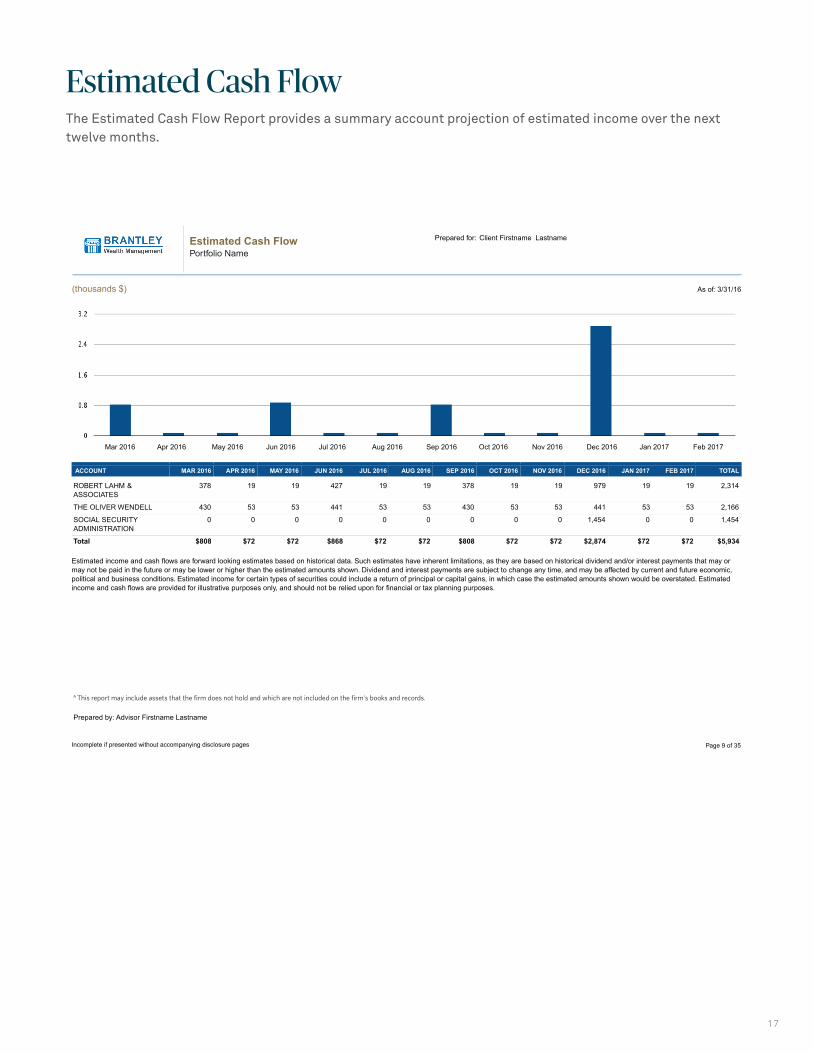
Estimated Cash FlowThe Estimated Cash Flow Report provides a summary account projection of estimated income over the next twelve months.
Estimated Cash FlowPortfolio Name
Prepared for: Client Firstname Lastname
Estimated income and cash flows are forward looking estimates based on historical data. Such estimates have inherent limitations, as they are based on historical dividend and/or interest payments that may ormay not be paid in the future or may be lower or higher than the estimated amounts shown. Dividend and interest payments are subject to change any time, and may be affected by current and future economic,political and business conditions. Estimated income for certain types of securities could include a return of principal or capital gains, in which case the estimated amounts shown would be overstated. Estimatedincome and cash flows are provided for illustrative purposes only, and should not be relied upon for financial or tax planning purposes.
(thousands $) As of: 3/31/16
ACCOUNT MAR 2016 APR 2016 MAY 2016 JUN 2016 JUL 2016 AUG 2016 SEP 2016 OCT 2016 NOV 2016 DEC 2016 JAN 2017 FEB 2017 TOTAL
ROBERT LAHM &ASSOCIATES
378 19 19 427 19 19 378 19 19 979 19 19 2,314
THE OLIVER WENDELL 430 53 53 441 53 53 430 53 53 441 53 53 2,166
SOCIAL SECURITYADMINISTRATION
0 0 0 0 0 0 0 0 0 1,454 0 0 1,454
Total $808 $72 $72 $868 $72 $72 $808 $72 $72 $2,874 $72 $72 $5,934
Prepared by: Advisor Firstname Lastname
Incomplete if presented without accompanying disclosure pages
Mar 2016 Apr 2016 May 2016 Jun 2016 Jul 2016 Aug 2016 Sep 2016 Oct 2016 Nov 2016 Dec 2016 Jan 2017 Feb 2017
Page 9 of 35
A This report may include assets that the firm does not hold and which are not included on the firm's books and records.

18
Estimated Cash Flow by SecurityThe Estimated Cash Flow by Seucirty Report displays the monthly projected cash flows for securities in a portfolio for up to one year.
Estimated Cash Flow by SecurityPortfolio Name
Prepared for: Client Firstname Lastname
Prepared by: Advisor Firstname Lastname
Incomplete if presented without accompanying disclosure pages
Mutual Fund ($)
As of: 3/31/16
Cash or Equivalents ($)
SECURITY TOTAL
AMERICAN CENTURY MID CAP VALUE 3 3 3 3 14FUND INVESTOR CLASS
COHEN & STEERS REALTY SHARES FUND 6 6 6 6 26
DELAWARE VALUE FUND CLASS I 35 35 35 35 35
INVESCO SMALL CAP GROWTH A 1 1
MAINSTAY EPOCH GLOBAL EQUITYYIELD FUND CLASS I 12 12 12 12 12
OPPENHEIMER DEVELOPINGMARKETS CLASS A 1 1
OPPENHEIMER DEVELOPINGMARKETS FUND Y 4 4
OPPENHEIMER INTERNATIONAL GROWTHFUND CLASS Y 31 31
OPPENHEIMER INTL GROWTHCLASS A 18 18
PRUDENTIAL JENNISON MIDCAPGROWTH FUND, INC. CLAS 0 0
T ROWE PRICE INTERNATIONALDISCOVERY 2 2
Mutual Fund Total: $56 $56 $56 $113 $257
SECURITY
FIDELITY ADVISOR PRIME FUND 0 0 0 0 0 0 0 0 0 0 0 0 0
FIDELITY ADVISOR PRIME FUND 0 0 0 0 0 0 0 0 0 0 0 0 0
Cash or Equivalents Total: $0 $0 $0 $0 $0 $0 $0 $0 $0 $0 $0 $0 $0
A This report may include assets that the firm does not hold and which are not included on the firm's books and records.
FEB 15 MAR 15 APR 15 MAY 15 JUN 15 JUL 15 AUG 15 SEP 15 OCT 15 NOV 15 DEC 15 JAN 16
TOTALFEB 15 MAR 15 APR 15 MAY 15 JUN 15 JUL 15 AUG 15 SEP 15 OCT 15 NOV 15 DEC 15 JAN 16
Page 7 of 35

19
Fixed Income by MaturityThe Fixed Income by Maturity Report lists fixed income securities in ascending order of maturity date as follows: 0-3 Months, 3-6 Months, 6-12 Months, 1-4 Years, 4-8 Years, 8-13 Years, 13-20 Years and Over 20 Years. A pie chart showing the percentage allocation in each maturity period detailed is also displayed.
Quarterly Report Package
Incomplete if presented without accompanying disclosure pages
Prepared by: Sample Advisor
Prepared for: Sample Investor
Page 5 of 6
Quarterly Report Package
Incomplete if presented without accompanying disclosure pages
Prepared for: Sample Investor
Prepared by: Sample Advisor
Fixed Income by MaturityCombined Account Portfolio
A This report may include assets that the firm does not hold and which are not included on the firm's books and records.
2/1/09 MISSOURI ST HWYS TRANSN 5.25 25,959.00 1.65 0.81 COMMN ST RD REV SER A 5.250% 02/01/09 B/EDTD 06/20/02
As of: 6/7/08
MATURITY DATE SECURITY COUPON RATE (%) MARKET VALUE ($)YIELD TO
MATURITY (%)YIELD TOCALL (%)
YIELD TOPUT (%)
DURATIONTO CALL (%)
DURATIONTO PUT (%)
DURATION TOMATURITY
5/1/11 MISSOURI ST HWYS TRANSN 5.00 43,627.73 2.63 2.82 COMMN ST RD REV FIRST LIEN- SER A 5.000% 05/01/11 B/EDTD 07/14/05
MATURITY DATE SECURITY COUPON RATE (%) MARKET VALUE ($)YIELD TO
MATURITY (%)YIELD TOCALL (%)
YIELD TOPUT (%)
DURATIONTO CALL (%)
DURATIONTO PUT (%)
DURATION TOMATURITY
6 - 12 Months
1 - 4 Years
MATURITY MARKET VALUE ($) (%)
Allocation by Maturity
6-12 Months 25,959 10.78
1-4 Years 43,627 18.12
4-8 Years 127,432 52.91
8-13 Years 43,810 18.19
20
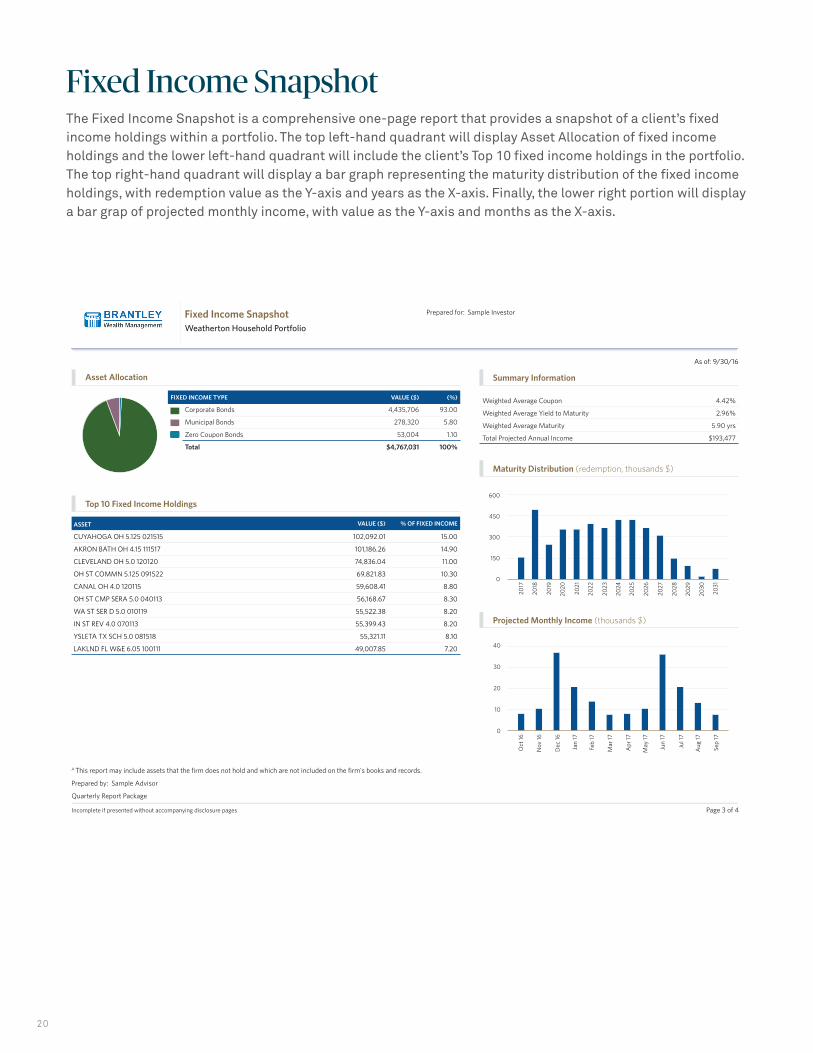
Fixed Income SnapshotThe Fixed Income Snapshot is a comprehensive one-page report that provides a snapshot of a client’s fixed income holdings within a portfolio. The top left-hand quadrant will display Asset Allocation of fixed income holdings and the lower left-hand quadrant will include the client’s Top 10 fixed income holdings in the portfolio. The top right-hand quadrant will display a bar graph representing the maturity distribution of the fixed income holdings, with redemption value as the Y-axis and years as the X-axis. Finally, the lower right portion will display a bar grap of projected monthly income, with value as the Y-axis and months as the X-axis.
Quarterly Report Package
Incomplete if presented without accompanying disclosure pages
Prepared for: Sample Investor
Prepared by: Sample Advisor
Page 3 of 4
As of: 9/30/16
Fixed Income SnapshotWeatherton Household Portfolio
A This report may include assets that the firm does not hold and which are not included on the firm's books and records.
ASSET VALUE ($) % OF FIXED INCOME
CUYAHOGA OH 5.125 021515
AKRON BATH OH 4.15 111517
CLEVELAND OH 5.0 120120
OH ST COMMN 5.125 091522
CANAL OH 4.0 120115
OH ST CMP SERA 5.0 040113
WA ST SER D 5.0 010119
IN ST REV 4.0 070113
YSLETA TX SCH 5.0 081518
LAKLND FL W&E 6.05 100111
102,092.01
101,186.26
74,836.04
69,821.83
59,608.41
56,168.67
55,522.38
55,399.43
55,321.11
49,007.85
15.00
14.90
11.00
10.30
8.80
8.30
8.20
8.20
8.10
7.20
Top 10 Fixed Income Holdings
Weighted Average Coupon
Weighted Average Yield to Maturity
Weighted Average Maturity
Total Projected Annual Income
4.42%
2.96%
5.90 yrs
$193,477
Summary Information
FIXED INCOME TYPE VALUE ($) (%)
Corporate Bonds
Municipal Bonds
Zero Coupon Bonds
Total
4,435,706
278,320
53,004
$4,767,031
93.00
5.80
1.10
100%
Asset Allocation
Maturity Distribution (redemption, thousands $)
Projected Monthly Income (thousands $)
40
30
20
10
0
600
450
300
150
0
2017
2018
2019
2020
2022
2025
2021
2023
2024
2026
2027
2028
2029
2030
2031
Oct
16
Nov
16
Dec
16
Jan
17
Feb
17
Mar
17
Apr
17
May
17
Jun
17
Jul 1
7
Aug
17
Sep
17

21
Gain/Loss by InvestorThe Gain/Loss by Investor Report provides unrealized and realized gain/loss reporting in a selected portfolio.
Quarterly Report Package
Incomplete if presented without accompanying disclosure pages
Prepared for: Sample Investor
Prepared by: Sample Advisor
Page 4 of 11
Combined Account Portfolio
As of: 6/7/12
ASSET INITIAL DATE UNITS TOTAL COST($) CURRENT VALUE($) REALIZED YTD UNREALIZED TOTAL
$90.26 $466.09 $556.35Account Total: $2,129.02
ACCENTURE PLC IRELAND SHS CLASS A 10/23/12 1.27 86.27 105.27 1.47 19.00 20.47
ACE LTD SHS 5/31/11 1.35 98.93 133.84 0.44 34.91 35.35
ACTAVIS PLC SHS 7/14/10 0.66 28.72 137.54 16.11 108.82 124.93
ADVANCE AUTO PARTS INC COM 1/10/14 0.26 30.44 32.74 0.04 2.30 2.34
ADVENT SOFTWARE INC COM 8/2/11 2.50 78.61 75.90 0.23 -2.71 -2.48
AFLAC INC COM 8/16/13 2.06 125.02 129.61 0.21 4.58 4.79
ALASKA AIR GROUP INC COM 7/10/12 1.24 114.77 112.17 -2.60 -2.60
ALBEMARLE CORP COM 8/2/11 1.77 97.19 114.30 22.24 17.11 39.35
ALEXANDER & BALDWIN HLDGS IN COM 0.00 -70.75
ALEXANDER & BALDWIN INC NEW COM 7/2/12 1.39 37.27 61.65 0.29 24.37 24.66
ALLIANT TECHSYSTEMS INC COM 4/16/13 1.05 78.34 142.79 1.52 64.44 65.96
ALTRIA GROUP INC COM 1/21/14 3.01 111.65 109.70 -1.95 -1.95
AMERICAN AIRLS GROUP INC COM 1/24/14 0.67 20.30 24.26 3.96 3.96
AMERICAN EXPRESS CO COM 11/17/09 4.73 279.17 432.74 15.71 153.57 169.28
AMGEN INC COM 11/17/09 0.53 44.63 65.56 1.41 20.92 22.33
ANSYS INC COM 11/17/09 1.53 113.93 112.54 -1.39 -1.39
AOL INC COM 0.00 0.00 0.00 11.95 11.95
APPLE INC COM 11/17/09 0.31 160.89 163.46 18.03 2.58 20.61
AT&T INC COM 11/17/09 7.16 227.51 245.70 0.61 18.18 18.79
Core Accounts
Sample Investor 1Account Name: Sample Account 1Account Number: XXXXX600N
Gain/Loss by Investor
GAIN/LOSS ($)
A This report may include assets that the firm does not hold and which are not included on the firm's books and records.

22
Holdings by ClassificationThe Holdings by Classification Report breaks out holdings by asset type. It includes asset type, investment objective, asset name, ticker symbol, management name, quantity, price, value, allocation percentages and portfolio total.
Holdings by ClassificationPortfolio Name
Prepared for: Client Firstname Lastname
Prepared by: Advisor Firstname Lastname
Incomplete if presented without accompanying disclosure pages
Asset Type: Cash
Investment Objective: Cash
ASSET (% OF HOLDING) MGT. NAMETICKER QUANTITY PRICE ($) VALUE ($) ALLOCATION (%)
LVIP MONEY MARKET - SV CL LINCOLN FINANCIAL 8,666.09 10.31 89,379.97 69.00GROUP
Cash Total: $89,379.97 69.00%
Asset Type: US Stocks
Investment Objective: Large Cap - Blend
ASSET (% OF HOLDING) MGT. NAMETICKER QUANTITY PRICE ($) VALUE ($) ALLOCATION (%)
CASH 14.79 1.00 14.79 0.01
INTEGRATED DATA CORP COM ITDDE 1.00 0.35 0.35 0.00
ON2 TECHNOLOGIES INC COM ONT 230.00 0.94 216.20 0.20
Large Cap - Blend Total: $231.34 0.20%
Investment Objective: Small Cap - Growth
ASSET (% OF HOLDING) MGT. NAMETICKER QUANTITY PRICE ($) VALUE ($) ALLOCATION (%)
DIVIDEND CAPITAL DIVIDEND CAPITAL TRUST 1,124.96 10.00 11,249.55 8.70
JENNISON NATURAL RESOURCES FD CL C PNRCX PRUDENTIAL FUNDS 496.59 57.83 28,717.97 22.20
Small Cap - Growth Total: $39,967.53 30.80%
US Stocks Total: $40,198.87 31.00%
Total: $129,578.84 100%
A This report may include assets that the firm does not hold and which are not included on the firm's books and records.
As of: 3/31/16
Page 10 of 35

23
Holdings by InvestorThe Holdings by Investor Report displays individual investor account information including account name, account number and holdings information such as asset name, ticker symbol, asset type, management name, quantity, price and total value.
Holdings by Investor Portfolio Name
Prepared for: Client Firstname Lastname
Client Firstname Lastname As of: 3/31/16
Account Name: SOCIAL SECURITY ADMINISTRATION
Account Number: 03111338 000 Managed Account Type: 101ST DISTRICT COURT
Account Type: Gftc Custodial IRA Program: A SMALL-MID CAP1
Manager:EE ASSET MANAGEMENT
Product: AA SMALL CAP CORE CONCENTRAT1
ASSET TICKER INVESTMENT OBJECTIVE MGT. NAME QUANTITY PRICE ($) VALUE ($)
BLACKROCK LIQUIDITY T-FUND CMS CASH OR EQUIVALENTSGOLDMAN SACHSFUNDS 1,807.33 1.00 1,807.33
GUIDEPATH ABS RET ASST ALLOC SVC GPARX MUTUAL FUND GPS IV FUNDS 7,243.09 9.96 72,141.15
SOCIAL SECURITY ADMINISTRATION Total $73,948.48
Account Name: VICE PRES BUSINESS
Account Number: 01101995449 Managed Account Type: ABBOTT BLDG
Account Type: IRA, Annuity Program: A SMALL-MID CAP1
Manager:EE ASSET MANAGEMENT
Product: AA SMALL CAP CORE CONCENTRAT1
ASSET TICKER INVESTMENT OBJECTIVE MGT. NAME QUANTITY PRICE ($) VALUE ($)
BLACKROCK MONEY MARKET PORT VARIABLE ANNUITY METLIFE USA 3,625.21 9.60 34,802.20
METLIFE DEFENSIVE STRATEGY PORT VARIABLE ANNUITY METLIFE USA 1,318.73 13.83 18,237.12
METLIFE MODERATE STRATEGY PORT VARIABLE ANNUITY METLIFE USA 6,097.92 14.48 88,308.56
VICE PRES BUSINESS Total $141,347.87
Client Firstname Lastname Total $215,296.35
Prepared by: Advisor Firstname Lastname
Incomplete if presented without accompanying disclosure pages Page 11 of 35
A This report may include assets that the firm does not hold and which are not included on the firm's books and records.

24
Holdings by Investor DetailThe Holdings by Investor Detail Report will provide a list of positions grouped by the selected allocation level along with optional Gain/Loss, Yield, and Income data columns.
Quarterly Report Package
Incomplete if presented without accompanying disclosure pages
Prepared for: John & Mary Investor
Prepared by: Sample Advisor
Page 1 of 4
John & Mary Investor
Cash & Cash Alternatives
As of: 6/30/15
Holdings by Investor Details
A This report may include assets that the firm does not hold and which are not included on the firm's books and records.
Account Name: Div. Strategy
Account Number: 12345678
Account Type: Joint
Manager: Recommended Mgr - Schafer Cullen Capital Mgmt-Large Cap Value
BROKERAGE MONEY MARKET 0.31 7,318.06 1.00 7,318.06
Cash & Cash Alternatives Total: 0.31% $7,318.06
Equities
ABBOTT LABORATORIES ABT 1.29 600.00 50.94 30,564.00 16,029.01 14,534.99 1.88 576.00
AIR PRODUCTS & CHEMICALS INC APD 1.12 200.00 132.82 26,564.00 14,344.14 12,219.86 2.44 648.00
ALLISON TRANSMISSION HLDGS INC ALSN 0.62 500.00 29.36 14,680.00 13,583.70 1,096.30 2.04 300.00
APIGEE CORP APIC 0.36 1,000.00 8.54 8,540.00 10,722.30 -2,182.30 2.43 125.43
APPLE INC AAPL 1.46 280.00 123.38 34,546.40 20,996.80 13,549.60 1.69 582.40
ARMSTRONG WORLD INDUSTRIES INC NEW AWI 0.92 400.00 54.76 21,904.00 21,606.92 297.08 2.44 306.00
AUTOMATIC DATA PROCESSING INC ADP 0.68 200.00 80.58 16,116.00 6,286.78 9,829.22 2.43 392.00
AVIS BUDGET GROUP INC CAR 0.61 350.00 41.35 14,472.50 18,553.99 -4,081.49 1.20 125.43
AVNET INC AVT 0.86 500.00 40.72 20,360.00 20,943.05 -583.05 1.57 320.00
BAIRD MID CAP INSTL CL BMDIX 0.21 308.18 16.46 5,078.81 2,800.50 2,278.31 2.03 576.00
BLOOMIN BRANDS INC BLMN 0.93 1,000.00 22.03 22,030.00 22,893.80 -863.80 3.97 57.68
CALL BAXTER INTL INC $39 EXP 08/21/15 0.07 1,000.00 1.61 1,610.00 1,297.54 312.46 2.03 184.00
CERUS CORP CERS 0.91 4,000.00 5.40 21,600.00 17,599.60 4,000.40 3.97 784.00
CONOCOPHILLIPS COP 0.88 400.00 52.24 20,896.00 20,389.26 506.74 5.67 734.97
COPA HOLDINGS S A CLASS A CPA 0.79 250.00 74.72 18,680.00 25,592.43 -6,912.43 4.50 840.00
CROWN CASTLE INTL CORP * NEW CCI 1.21 350.00 82.26 28,791.00 25,007.05 3,783.95 3.99 748.83
DELTA AIRLINES INC NEW DAL 0.66 350.00 44.91 15,718.50 14,975.35 743.15 1.20 189.00
DISCOVER FINANCIAL SVCS DFS 0.46 200.00 55.11 11,022.00 11,944.00 -922.00 2.03 224.00
DOMTAR CORP NEW UFS 1.02 600.00 40.31 24,186.00 22,497.72 1,688.28 3.97 960.00
DU PONT E.I.DE NEMOURS & COMPANY DD 0.71 300.00 55.90 16,770.00 7,295.17 9,474.83 2.72 456.00
EATON CORP PLC ETN 0.58 225.00 61.49 13,835.25 14,092.02 -256.77 3.58 495.00
EUROPACIFIC GROWTH CL A AEPGX 1.99 933.71 50.48 47,133.53 40,397.98 6,735.55 2.03 300.00
EXACT SCIENCES CORP EXAS 2.03 2,000.00 24.07 48,140.00 38,748.00 9,392.00 3.97 547.00
EXPRESS SCRIPTS HLDG COMPANY ESRX 0.78 200.00 92.38 18,476.00 16,950.32 1,525.68 5.67 467.57
FASTENAL COMPANY FAST 0.86 500.00 40.85 20,422.50 17,108.89 3,313.61 2.74 560.00
FIRST TRUST BIOTECHNOLOGY 28 SA RE 3.51 8,039.00 10.36 83,292.88 78,309.30 4,983.58 2.03 184.00
FIRST TRUST RB ADV TACT MRG ACQ 15-1 SA RE 3.12 8,068.05 9.18 74,027.62 68,637.97 5,389.65 3.97 784.00
FUNDAMENTAL INVESTORS CL A ANCFX 2.39 1,057.86 53.59 56,690.50 47,890.34 8,800.16 5.67 734.97
GABELLI HEALTHCARE & * WELLNESS TRUST GRX 11.70 24,486.92 11.34 2,77,791.82 1,25,767.58 1,52,024.24 2.03 840.00
GABELLI MULTIMEDIA TR INC GGT 14.72 38,851.12 8.99 3,49,271.55 1,29,867.58 2,19,403.97 3.97 738.00
GENERAL ELECTRIC COMPANY GE 0.55 500.00 26.10 13,050.00 7,990.00 5,060.00 5.67 460.00
GENTEX CORP GNTX 0.95 1,400.00 16.08 22,512.00 20,541.43 1,970.57 2.11 476.00
GENUINE PARTS COMPANY GPC 1.10 300.00 87.09 26,127.00 10,591.76 15,535.24 2.82 738.00
GOOGLE INC CL C GOOG 1.06 40.00 628.00 25,120.00 20,901.92 4,218.08 3.97 467.57
GRAINGER W W INC GWW 0.95 100.00 225.95 22,595.00 23,096.00 -501.00 2.07 560.00
H & E EQUIPMENT SERVICES INC HEES 0.41 700.00 13.92 9,744.00 15,425.41 -5,681.41 3.18 700.00
HALYARD HEALTH INC HYH 0.86 500.00 40.78 20,390.00 18,999.80 1,390.20 3.03 467.57
HMS HOLDINGS CORP HMSY 0.71 1,500.00 11.28 16,920.00 26,333.70 -9,413.70 2.34 560.00
HOME DEPOT INC HD 0.97 200.00 114.84 22,968.00 5,516.00 17,452.00 2.06 472.00
INTERNATIONAL PAPER COMPANY IP 0.82 400.00 48.73 19,492.00 18,495.71 996.29 3.28 640.00
INVESCO BUYOUT OPPTY 2015-1 QT RE 2.97 7,900.00 8.93 70,556.48 68,637.97 1,918.51 3.03 750.00
INVESCO INSIDER BUY STRAT 2015-2 QT RE 3.15 7,576.00 9.87 74,772.09 66,607.20 8,164.89 2.34 624.00
ITC HOLDINGS CORP ITC 0.64 450.00 33.90 15,255.00 13,848.75 1,406.25 1.92 292.50
JOHNSON & JOHNSON JNJ 1.04 250.00 99.02 24,755.00 15,980.00 8,775.00 3.03 750.00
JOHNSON CONTROLS INC JCI 1.12 600.00 44.44 26,664.00 16,038.00 10,626.00 2.34 624.00
KFORCE INC KFRC 0.97 1,000.00 22.92 22,920.00 18,748.20 4,171.80 1.92 440.00
LAMAR ADVERTISING * COMPANY NEW CL A LAMR 0.74 300.00 58.65 17,595.00 17,549.61 45.39 4.71 828.00
LANNETT COMPANY LCI 0.61 250.00 58.04 14,510.00 15,057.38 -547.38 1.80 25.00
LATTICE SEMICONDUCTOR CORP LSCC 0.41 2,000.00 4.84 9,680.00 12,681.20 -3,001.20 0.67 132.00
MANITOWOC COMPANY INC MTW 0.50 700.00 16.84 11,788.00 14,401.52 -2,613.52 0.48 56.00
MANPOWERGROUP INC MAN 0.75 200.00 88.90 17,780.00 13,910.10 3,869.90 1.80 320.00
MASTERCARD INC CLASS A MA 1.20 300.00 95.16 28,548.00 23,167.41 5,380.59 0.67 192.00
MERCK & COMPANY INC NEW MRK 1.21 500.00 57.52 28,760.00 21,009.60 7,750.40 3.13 900.00
METLIFE INC MET 0.71 300.00 56.27 16,881.00 15,100.56 1,780.44 2.67 450.00
MICRON TECHNOLOGY INC MU 0.58 700.00 19.75 13,825.00 13,195.00 630.00 0.87 55.00
MICROSOFT CORP MSFT 1.15 600.00 45.34 27,204.00 15,383.88 11,820.12 2.73 744.00
NCR CORP NEW NCR 0.49 400.00 29.32 11,728.00 13,715.44 -1,987.44 1.80 325.00
PROMEGA CORP 1.68 154.00 259.00 39,886.00 47,890.34 -8,004.34 0.67 78.00
QUALCOMM INC QCOM 0.80 300.00 63.10 18,930.00 20,071.71 -1,141.71 3.04 576.00
QUALYS INC QLYS 0.86 550.00 37.13 20,421.50 21,151.02 -729.52 2.99 125.00
ROCKWELL AUTOMATION INC ROK 1.00 200.00 119.23 23,846.00 21,319.62 2,526.38 2.18 520.00
RYDER SYSTEM INC R 0.84 225.00 88.98 20,020.50 19,981.80 38.70 1.84 369.00
SANOFI SPON ADR SNY 0.68 300.00 53.81 16,143.00 9,686.01 6,456.99 2.99 482.79
SWIFT TRANSPORTATION COMPANY CL A SWFT 0.84 900.00 22.25 20,025.00 21,991.41 -1,966.41 0.87 100.00
TOTAL S A SPONSORED ADR TOT 0.61 300.00 48.09 14,427.00 14,462.39 -35.39 5.03 725.40
TRACTOR SUPPLY COMPANY TSCO 1.55 400.00 91.72 36,688.00 26,607.20 10,080.80 0.87 320.00
TUPPERWARE BRANDS CORP TUP 0.74 300.00 58.20 17,460.00 22,157.52 -4,697.52 4.67 816.00
UNILEVER PLC SPONSORED ADR NEW UL 1.13 600.00 44.77 26,862.00 23,938.50 2,923.50 0.73 196.92
UNITED RENTALS INC URI 0.42 150.00 66.93 10,039.50 14,691.81 -4,652.31 2.82 576.00
URBAN OUTFITTERS INC URBN 0.85 600.00 33.66 20,196.00 21,054.00 -858.00 1.50 320.00
VERIZON COMMUNICATIONS INC VZ 0.77 400.00 45.89 18,356.00 11,480.61 6,875.39 4.79 880.00
VIACOM INC CL B NEW VIAB 0.48 200.00 56.69 11,338.00 12,878.40 -1,540.40 2.82 320.00
WALGREENS BOOTS ALLIANCE INC WBA 1.62 400.00 96.22 38,488.00 24,773.16 13,714.84 1.50 576.00
WASTE MANAGEMENT INC DEL WM 0.74 350.00 50.16 17,556.00 10,349.25 7,206.75 3.07 539.00
Equities Total: 99.69% $2,366,032.93 17,80,537.39 $5,85,495.54 1.10% $35,349.03
Div. Strategy Total: $2,373,350.99
John & Mary Investor Total: $2,373,350.99 ASSET
TICKER COST ($) UNREALIZED
GAIN/LOSS ($) CURRENT
YIELD (%)
ESTIMATEDANNUAL
INCOME ($) QUANTITY PRICE ($) VALUE ($)
ASSET
TICKER COST ($) UNREALIZED
GAIN/LOSS ($) CURRENT
YIELD (%)
ESTIMATEDANNUAL
INCOME ($) QUANTITY PRICE ($) VALUE ($)
% OFACCOUNT
% OFACCOUNT
25
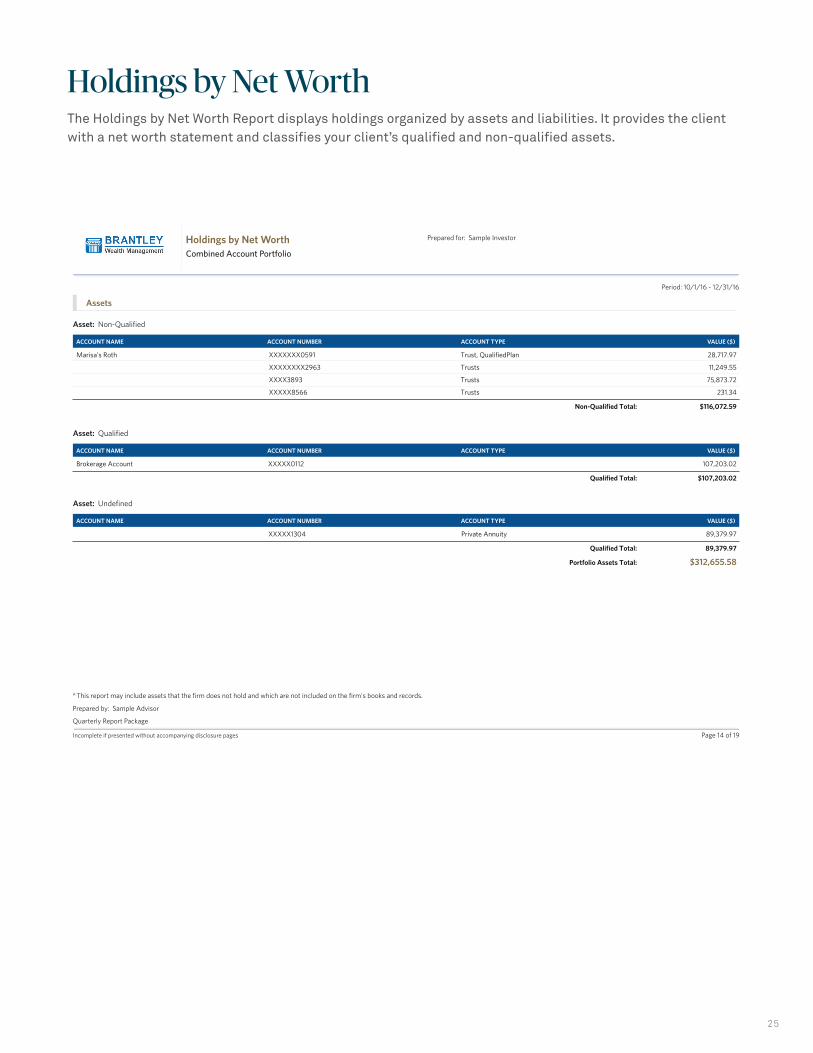
Holdings by Net WorthThe Holdings by Net Worth Report displays holdings organized by assets and liabilities. It provides the client with a net worth statement and classifies your client’s qualified and non-qualified assets.
Quarterly Report Package
Incomplete if presented without accompanying disclosure pages
Prepared for: Sample Investor
Prepared by: Sample Advisor
A This report may include assets that the firm does not hold and which are not included on the firm's books and records.
Page 14 of 19
Not intended for use with the client.
Marisa’s Roth XXXXXXX0591 Trust, QualifiedPlan 28,717.97
XXXXXXXX2963 Trusts 11,249.55
XXXX3893 Trusts 75,873.72
XXXXX8566 Trusts 231.34
Non-Qualified Total: $116,072.59
Period: 10/1/16 - 12/31/16
Asset: Non-Qualified
VALUE ($)ACCOUNT NUMBERACCOUNT NAME ACCOUNT TYPE
Brokerage Account XXXXX0112 107,203.02
Qualified Total: $107,203.02
Asset: Qualified
VALUE ($)ACCOUNT NUMBERACCOUNT NAME ACCOUNT TYPE
XXXXX1304 Private Annuity 89,379.97
Qualified Total: 89,379.97
Portfolio Assets Total: $312,655.58
Asset: Undefined
VALUE ($)ACCOUNT NUMBERACCOUNT NAME ACCOUNT TYPE
Holdings by Net WorthCombined Account Portfolio
Assets

26
Holdings by PortfolioThe Holdings by Portfolio Report displays the aggregate of the holdings across all accounts in the portfolio.
Quarterly Report Package
Incomplete if presented without accompanying disclosure pages
Prepared for: Sample Investor
Prepared by: Sample Advisor
Page 6 of 21
Combined Account Portfolio
A This report may include assets that the firm does not hold and which are not included on the firm's books and records.
4/11/13 FRANKLIN INCOME FUND - CLASS A 25.09
3/28/13 VANGUARD WELLESLEY INCOME INV 19.56
3/12/13 FRANKLIN INCOME FUND - CLASS A 25.20
2/10/13 FRANKLIN INCOME FUND - CLASS A 24.97
12/18/12 VANGUARD WELLESLEY INCOME INV 22.47
12/17/12 IVY ASSET STRATEGY I 14.45
12/17/12 IVY ASSET STRATEGY I 24.56
10/12/12 INVESCO BALANCED-RISK ALLOCATION - A 500.80
10/12/12 INVESCO BALANCED-RISK ALLOCATION - A 352.15
9/28/12 VANGUARD WELLESLEY INCOME INV 19.88
6/29/12 VANGUARD WELLESLEY INCOME INV 21.58
6/28/12 YACKTMAN FUND 22.86
6/28/12 YACKTMAN FUND 23.12
6/28/12 YACKTMAN FUND 43.56
3/30/12 VANGUARD WELLESLEY INCOME INV 20.54
12/30/11 YACKTMAN FUND 37.59
12/16/11 SUNAMERICA ALTERNATIVE STRATEGIES FUND CL A 25.19
12/13/11 INVESCO BALANCED-RISK ALLOCATION - A 190.95
12/13/11 INVESCO BALANCED-RISK ALLOCATION - A 344.97
12/12/11 IVY ASSET STRATEGY I 53.02
8/12/11 PERMANENT PORTFOLIO FUND 82.55
8/12/11 PERMANENT PORTFOLIO FUND 140.49
8/12/11 PERMANENT PORTFOLIO FUND 35.80
Dividends Total: $2,071.35
Income Total: $3,690.06
Holdings by Portfolio
As of: 2/28/13
ASSET TICKER PRICE ($) VALUE ($)QUANTITYMANAGEMENT NAMEASSET TYPE
SEI INST. MANAGED LARGE CAP VALUE FUND TRMVX US STOCKS SEI ASSET MANAGEMENT PROGRAMS 688.91 19.02 13,102.99
SEI INSTITUTIONALLY MANAGED CORE FIXED INCOME FUND TRLVX BONDS SEI ASSET MANAGEMENT PROGRAMS 2,120.18 10.07 21,350.19
SEI INSTITUTIONALLY MANAGED HIGH-YIELD BOND FUND SHYAX BONDS SEI ASSET MANAGEMENT PROGRAMS 223.37 7.62 1,702.09
SEI INSTITUTIONALLY MANAGED SMALL-CAP VALUE FUND SESVX US STOCKS SEI ASSET MANAGEMENT PROGRAMS 150.78 16.69 2,516.43
SEI INSTL MANAGED TR-LG CAP GR A SELCX US STOCKS SEI ASSET MANAGEMENT PROGRAMS 632.95 22.53 14,260.36
SEI INSTL MANAGED TR-SM CAP GR A SSCGX US STOCKS SEI ASSET MANAGEMENT PROGRAMS 97.78 16.84 1,646.63
SEI INTERNATIONAL EMERGING MARKETS DEBT FUND SITEX BONDS SEI ASSET MANAGEMENT PROGRAMS 404.67 10.41 4,212.58
SEI INTERNATIONAL EMERGING MARKETS FUND SIEMX NON-US STOCKS SEI ASSET MANAGEMENT PROGRAMS 03.76 17.01 5,166.92
SEI INTERNATIONAL EQUITY FUND SEITX NON-US STOCKS SEI ASSET MANAGEMENT PROGRAMS 634.06 12.95 8,211.03
SEI INTL TR-INTL FIXD INCOME TRUST SEFIX BONDS SEI ASSET MANAGEMENT PROGRAMS 342.06 10.83 3,704.48
LVIP MONEY MARKET-SV CL CASH LINCOLN FINANCIAL GROUP 8,666.09 10.31 89,379.97
Portfolio Total: $165,253.69

27
Income and ExpenseThe Income and Expense Report lists a selected portfolio’s transactions subtotaled by type and grouped into income and expenses. It also lists the account’s net income for a selected time period. You can customize this report by turning off the display of transaction types.
Quarterly Report Package
Incomplete if presented without accompanying disclosure pages
Prepared for: Sample Investor
Prepared by: Sample Advisor
Page 9 of 21
Combined Account PortfolioCombined Account Portfolio
A This report may include assets that the firm does not hold and which are not included on the firm's books and records.
Income and Expenses
As of: 2/28/13
4/11/13 FRANKLIN INCOME FUND - CLASS A 25.09
3/28/13 VANGUARD WELLESLEY INCOME INV 19.56
3/12/13 FRANKLIN INCOME FUND - CLASS A 25.20
2/10/13 FRANKLIN INCOME FUND - CLASS A 24.97
12/18/12 VANGUARD WELLESLEY INCOME INV 22.47
12/17/12 IVY ASSET STRATEGY I 14.45
12/17/12 IVY ASSET STRATEGY I 24.56
10/12/12 INVESCO BALANCED-RISK ALLOCATION - A 500.80
10/12/12 INVESCO BALANCED-RISK ALLOCATION - A 352.15
9/28/12 VANGUARD WELLESLEY INCOME INV 19.88
6/29/12 VANGUARD WELLESLEY INCOME INV 21.58
6/28/12 YACKTMAN FUND 22.86
6/28/12 YACKTMAN FUND 23.12
6/28/12 YACKTMAN FUND 43.56
3/30/12 VANGUARD WELLESLEY INCOME INV 20.54
12/30/11 YACKTMAN FUND 37.59
12/16/11 SUNAMERICA ALTERNATIVE STRATEGIES FUND CL A 25.19
12/13/11 INVESCO BALANCED-RISK ALLOCATION - A 190.95
12/13/11 INVESCO BALANCED-RISK ALLOCATION - A 344.97
12/12/11 IVY ASSET STRATEGY I 53.02
8/12/11 PERMANENT PORTFOLIO FUND 82.55
8/12/11 PERMANENT PORTFOLIO FUND 140.49
8/12/11 PERMANENT PORTFOLIO FUND 35.80
Dividends Total: $2,071.35
Income Total: $3,690.06
8/18/05 MFS GROWTH FUND B 15.00
8/05/04 MFS GROWTH FUND B 15.00
8/11/03 MFS GROWTH FUND B 15.00
Fee Adjustment Details Total: $45.00
VALUE ($)ASSETDATE
Fee Adjustment Details
3/3/11 CASH 75.00
8/17/09 INVESCO GLOBAL HEALTH CARE B 202.47
8/17/09 INVESCO GLOBAL HEALTH CARE B 10.00
11/4/08 MFS GLOBAL EQUITY FUND A 25.00
10/21/08 IVY FUND-ASSET STRATEGY C 15.00
5/12/08 INVESCO SMALL CAP EQUITY B 10.00
7/12/07 INVESCO BASIC VALUE FUND - CLASS A 10.00
Transaction Fee Total: $347.47
Expenses Total: $402.47
VALUE ($)ASSETDATE
Transaction Fee
EXPENSES
12/13/02 INVESCO CONSTELLATION B 10.00
Advisory Fee Total: $10.00
Advisory Fee
VALUE ($)ASSETDATE

28
Major Indices PerformanceThe Major Indices Performance Report shows major benchmarks and their performance over a selected time period, along with year-to-date, one year, three years, five years and since start date. This report may require you to provide Albridge with third-party information.
Quarterly Report Package
Incomplete if presented without accompanying disclosure pages
Prepared for: Sample Investor
Prepared by: Sample Advisor
Page 11 of 21
Combined Account Portfolio
A This report may include assets that the firm does not hold and which are not included on the firm's books and records.
Major Indices Performance Report
Period: 12/22/16 - 3/21/17
BENCHMARK SELECTED PERIOD (%) YEAR TO DATE (%) ONE YEAR (%) THREE YEARS (%) FIVE YEARS (%) SINCE START DATE (%)3/22/09
4/11/13 FRANKLIN INCOME FUND - CLASS A 25.09
3/28/13 VANGUARD WELLESLEY INCOME INV 19.56
3/12/13 FRANKLIN INCOME FUND - CLASS A 25.20
2/10/13 FRANKLIN INCOME FUND - CLASS A 24.97
12/18/12 VANGUARD WELLESLEY INCOME INV 22.47
12/17/12 IVY ASSET STRATEGY I 14.45
12/17/12 IVY ASSET STRATEGY I 24.56
10/12/12 INVESCO BALANCED-RISK ALLOCATION - A 500.80
10/12/12 INVESCO BALANCED-RISK ALLOCATION - A 352.15
9/28/12 VANGUARD WELLESLEY INCOME INV 19.88
6/29/12 VANGUARD WELLESLEY INCOME INV 21.58
6/28/12 YACKTMAN FUND 22.86
6/28/12 YACKTMAN FUND 23.12
6/28/12 YACKTMAN FUND 43.56
3/30/12 VANGUARD WELLESLEY INCOME INV 20.54
12/30/11 YACKTMAN FUND 37.59
12/16/11 SUNAMERICA ALTERNATIVE STRATEGIES FUND CL A 25.19
12/13/11 INVESCO BALANCED-RISK ALLOCATION - A 190.95
12/13/11 INVESCO BALANCED-RISK ALLOCATION - A 344.97
12/12/11 IVY ASSET STRATEGY I 53.02
8/12/11 PERMANENT PORTFOLIO FUND 82.55
8/12/11 PERMANENT PORTFOLIO FUND 140.49
8/12/11 PERMANENT PORTFOLIO FUND 35.80
Dividends Total: $2,071.35
Income Total: $3,690.06
BLOOMBERG BARCLAYS U.S. MUNICIPAL 2.98 2.97 0.17 5.42 5.70 4.49
CONSUMER PRICE INDEX 0.73 0.74 1.13 1.99 2.04 2.38
BLOOMBERG BARCLAYS U.S. AGGREGATE BOND 1.29 1.60 -0.13 3.54 4.82 4.61
DOW JONES INDUSTRIAL AVERAGE 0.50 -1.65 13.04 10.63 17.49 4.47
NASDAQ COMPOSITE 4.19 2.40 32.71 16.67 24.01 7.66
RUSSELL 1000 3.54 1.77 23.98 15.50 22.59 7.80 3.61 1.86 24.31 15.47 22.86 7.90
DOW JONES U.S. SELECT REIT 9.01 8.92 5.02 10.53 30.45 8.85
RUSSELL 3000 3.61 1.86 24.31 15.47 22.86 7.90
S&P 500 3.19 1.45 23.32 15.33 21.98 7.41
CITIGROUP 3-MONTH CD 0.05 0.04 0.20 0.26 0.33 2.02

29
Model ComparisonThe Model Comparison Report enables you to develop an unlimited number of allocation models for your clients’ needs. You can use this report to track portfolios against these models. It will display comparative charts and provide you with suggested allocations for rebalancing each portfolio.
Model ComparisonPortfolio Name
Prepared for: Client Firstname Lastname
Prepared by: Advisor Firstname Lastname
Incomplete if presented without accompanying disclosure pages
ASSET TYPE
LARGE CAP EQUITY
SMALL CAP EQUITY
INTERNATIONAL EQUITY
FIXED INCOME
CASH INVESTMENTS
OTHER
CURRENT ($)
345,305
306,284
192,649
93,936
18,739
0
$956,915
MODEL ($)
191,383
191,383
191,383
191,383
95,691
95,691
$956,915
CURRENT (%)
36.10
32.00
20.10
9.80
2.00
0.00
100%
MODEL (%)
20.00
20.00
20.00
20.00
10.00
10.00
100%
VARIANCE ($)
-153,921
-114,901
-1,266
97,446
76,952
95,691
VARIANCE (%)
-16.10
-12.00
-0.10
10.20
8.00
10.00
Asset Type Allocation Balanced Portfolio Allocation
Model Allocation
Current Allocation
As of: 3/31/16
A This report may include assets that the firm does not hold and which are not included on the firm's books and records.
Total:
Page 15 of 35

30
Multi-Period PerformanceThe Multi-Period Performance Report shows the performance return for all accounts in a portfolio for a selected period, along with since start date, year-to-date, quarter-to-date, month-to-date, last quarter and last month.
Quarterly Report Package
Incomplete if presented without accompanying disclosure pages
Prepared for: Sample Investor
Prepared by: Sample Advisor
Page 17 of 19
Multi-Period PerformanceCombined Account Portfolio
A This report may include assets that the firm does not hold and which are not included on the firm's books and records.
START DATESINCE START DATE (%)QUARTER TO DATE (%) YEAR TO DATE (%)MONTH TO DATE (%) LAST QUARTER (%)LAST MONTH (%)SELECTED PERIOD (%)
START DATESINCE START DATE (%)QUARTER TO DATE (%) YEAR TO DATE (%)MONTH TO DATE (%) LAST QUARTER (%)LAST MONTH (%)SELECTED PERIOD (%)
START DATESINCE START DATE (%)QUARTER TO DATE (%) YEAR TO DATE (%)MONTH TO DATE (%) LAST QUARTER (%)LAST MONTH (%)SELECTED PERIOD (%)
START DATESINCE START DATE (%)QUARTER TO DATE (%) YEAR TO DATE (%)MONTH TO DATE (%) LAST QUARTER (%)LAST MONTH (%)SELECTED PERIOD (%)
Account Name: Sample Account 1 M
Account Number: XXXX3893
Account Type: Individual
Sample Investor 1
Program: Chase Strategic Portfolio IRA Accounts
Manager: Chase Strategic Portfolio
10/31/110.010.00.000.00 0.000.000.00
Account Name: American Funds IRA
Account Number: XXXX3103
Account Type: CB&T IRA
Sample Investor 2
Program: Chase Strategic Portfolio IRA Accounts
Manager: Chase Strategic Portfolio
12/20/1125.211.471.47-1.62 9.255.293.07
Account Name: Sample Account 2
Account Number: XXXXX1304
Account Type: Retirement Account IRA Program: Chase Strategic Portfolio IRA Accounts
Manager: Chase Strategic Portfolio
10/20/1110.601.031.03-0.37 3.962.521.98
Account Name: Putnam IRA
Account Number: XXXXX1304
Account Type: Putnam IRA Program: Chase Strategic Portfolio IRA Accounts
Manager: Chase Strategic Portfolio
10/31/1117.811.471.47-0.12 8.514.243.07
Sample Investor 1 Total: 10.441.011.01-0.30 4.302.581.99
As of: 2/1/17
M This account represents a Manual Account.

31
Multi-Period Portfolio DetailThe Multi-Period Portfolio Detail Report provides a high-level overview of a portfolio’s performance from a selected period, year-to-date, one year, three year, five year and since start date. Key information on net contribution and change in value is broken out into separate line item amounts to provide greater detail. This report also features an asset allocation chart depicting portfolio holdings by asset type as of the beginning of the reporting period and the end of the reporting period.
Quarterly Report Package
Incomplete if presented without accompanying disclosure pages
Prepared by: Sample Advisor
Prepared for: Sample Investor
Page 15 of 21
Multi Period Portfolio Detail
Period: 3/8/07 - 6/7/07
Combined Account Portfolio
Asset Allocation-Asset Type
ASSET TYPE (%)STARTING VALUE ($)
LARGE BLEND 51,160.39 23.80
DIVERSIFIED EMERGING MKTS 26,478.73 12.30
FOREIGN LARGE BLEND 22,736.56 10.60
LARGE GROWTH 21,802.63 10.10
INTERMEDIATE-TERM BOND 20,095.38 9.30
NONTRADITIONAL BOND 17,758.37 8.20
WORLD STOCK 16,991.45 7.90
MARKET NEUTRAL 11,173.82 5.20
EMERGING MARKETS BOND 8,901.92 4.10
MULTI SECTOR BOND 8,539.36 4.00
MID-CAP GROWTH 6,188.90 2.90
SECTOR TECH/COMMUNICATIONS 3,472.32 1.60
Total: $215,299.83 100%
LARGE BLEND 48,143.93 25.20
LARGE GROWTH 20,289.56 10.60
FOREIGN LARGE BLEND 19,785.12 10.40
INTERMEDIATE-TERM BOND 19,162.46 10.00
DIVERSIFIED EMERGING MKTS 18,493.25 9.70
NONTRADITIONAL BOND 16,452.37 8.60
WORLD STOCK 15,378.66 8.00
MARKET NEUTRAL 9,459.98 5.00
MULTISECTOR BOND 7,069.75 3.70
SECTOR TECH/COMMUNICATIO NS 6,944.64 3.60
EMERGING MARKETS BOND 6,366.87 3.30
MID-CAP GROWTH 3,520.35 1.80
Total: $191,066.94 100%
ASSET TYPE (%)ENDING VALUE ($)
A This report may include assets that the firm does not hold and which are not included on the firm's books and records.

32
Portfolio MonitorThe Portfolio Monitor Report is a comprehensive one-page report that provides a snapshot of a client’s portfolio. The right-hand side includes the client’s Top 10 Holdings by exposure, as well as portfolio returns for the selected time period—quarter-to-date, year-to-date, last year and since start date. The left-hand side shows a bar graph of past performance, as well as a line chart that tracks performance of a portfolio against a benchmark. The report allows the advisor to set the display preference to Quarterly or Yearly for the bar graph and line chart, which can be configured under Administration > Reports Setting Tab.
Portfolio MonitorPortfolio Name
Prepared for: Client Firstname Lastname
Quarterly Return (%) Period: 4/1/12-3/31/16 Top 10 Holdings As of: 3/31/16
ASSET TICKER VALUE($) % PORTFOLIO
BANK DEPOSIT SWEEP PROGRAM QPRMQ 97,644 18.17
METLIFE MODERATE STRATEGY PORT 88,309 16.43
GUIDEPATH ABS RET ASST ALLOC SVC GPARX 72,141 13.42
BLACKROCK MONEY MARKET PORT 34,802 6.48
AMERICAN FUNDS SMALLCAP WORLD A SMCWX 24,292 4.52
AMERICAN FUNDS AMCAP A AMCPX 20,555 3.82
AMERICAN FUNDS NEW ECONOMY A ANEFX 18,552 3.45
AMERICAN FUNDS AMER MUTUAL FD A AMRMX 18,506 3.44
METLIFE DEFENSIVE STRATEGY PORT 18,237 3.39
AMERICAN FUNDS INV CO OF AMER A AIVSX 16,184 3.01
Top Ten Total $409,222 76.14%
Portfolio Value (thousands $) Period: 4/1/14-3/31/16 Portfolio Return (value in $) Period: 1/1/16-3/31/16
SELECTED PERIOD QUARTER TO DATE YEAR TO DATE LAST YEAR SINCE INCEPTION
Beginning Value 542,140 542,140 542,140 476,707 0
Net Contribution -8,132 -8,132 -8,132 19,856 310,732
Change In Value 3,419 3,419 3,419 45,578 226,695
Ending Value 537,427 537,427 537,427 542,140 537,427
Return 0.62% 0.62% 0.62% 9.36% 6.77%
Benchmark: BR_Man_model1 Benchmark 61 -1.95% -1.95% -1.95% 23.29% 7.01%
61 BR_Man_model1 is comprised of 70% MSCI Developed EAFE Free (TRG).
Prepared by: Advisor Firstname Lastname
Incomplete if presented without accompanying disclosure pages Page 16 of 35
A This report may include assets that the firm does not hold and which are not included on the firm's books and records.

33
Portfolio PerformanceThe Portfolio Performance Report provides a high-level overview of a portfolio’s performance for a selected period, year-to-date, one year, three year, five year and since start date. Key net contributions and change in value information is broken out into separate amounts to show greater detail. You can collapse or expand the top portion of this report for a consolidated view. The report features a table that can contain up to five major indices for comparison against your client’s portfolio and can assign a benchmark to your client’s portfolio to view specific performance measures.
Portfolio PerformancePortfolio Name
Prepared for: Client Firstname Lastname
Period: 1/1/16 - 3/31/16
1/1/16 -3/31/16 ($) YEAR TO DATE ($) ONE YEAR ($) THREE YEARS ($) FIVE YEARS ($)
SINCE INCEPTION ($)10/14/09
Beginning Value 542,140 542,140 491,033 136,085 0 0
Capital Gains 0 0 -6,136 -6,839 -6,839 -6,839
Dividends Not Reinvested -116 -116 3,433 3,468 3,468 3,468
Net Cash In/Out -8,015 -8,015 18,347 199,256 319,167 319,167
Net Transfers In/Out 0 0 0 115,989 115,989 115,989
Withholding 0 0 -1,143 -1,143 -1,143 -1,143
Net Contribution -8,132 -8,132 14,502 310,732 430,643 430,643
Capital Gains Reinvested 0 0 348 466 466 466
Dividends Reinvested 492 492 8,457 16,142 16,142 16,142
Fees -348 -348 -2,646 -6,357 -7,364 -7,364
Interest Reinvested 2 2 9 15 15 15
Market Gain/Loss 3,272 3,272 25,724 80,345 97,526 97,526
Change In Value 3,419 3,419 31,892 90,610 106,784 106,784
Ending Value 537,427 537,427 537,427 537,427 537,427 537,427
Portfolio Return 0.62% 0.62% 6.22% 5.69% -- 6.77%
BR_Man_model1 Benchmark61 -1.95% -1.95% 14.88% 6.73% -- 7.01%
61 BR_Man_model1 is comprised of 70% MSCI Developed EAFE Free (TRG).
Common Market Indices Period: 1/1/16 - 3/31/16
BENCHMARKS 1/1/16 -
3/31/16 (%) YEAR TO DATE (%) ONE YEAR (%) THREE YEARS (%) FIVE YEARS (%)SINCE INCEPTION (%)
10/14/09
Barclays U.S. Corporate High Yield 2.65 2.65 7.19 8.87 -- 11.49
Barclays U.S. Credit 2.45 2.45 0.56 5.64 -- 6.18
MSCI Developed EAFE Free (TRG) -1.95 -1.95 14.88 6.73 -- 7.01
S&P 500 1.45 1.45 21.43 14.51 -- 15.15
S&P MidCap 400 3.09 3.09 21.31 13.37 -- 17.64
Prepared by: Advisor Firstname Lastname
Incomplete if presented without accompanying disclosure pages Page 17 of 35
A This report may include assets that the firm does not hold and which are not included on the firm's books and records.

34
Portfolio Risk and ReturnThe Portfolio Risk and Return Report is a roll-up of all accounts in a portfolio and displays risk measures for the overall portfolio. It includes an analysis of rates of return and the elected risk measures for these time periods: three-year, five-year and 10-year and since start date. A graph on the bottom of the report shows a comparison of risk versus return. This report can be run at the portfolio, account or manager level.
Portfolio Risk and Return Portfolio Name
Prepared for: Client Firstname Lastname
Prepared by: Advisor Firstname Lastname
Incomplete if presented without accompanying disclosure pages Page 19 of 35
Period: 1/1/16 - 3/31/16
Return vs. Risk (%)
A This report may include assets that the firm does not hold and which are not included on the firm's books and records.
61 This benchmark is a Composite Benchmark. Please see below for more details.
Balanced Benchmark is comprised of 8% Russell 2000 Value, 8% Russell 2000 Growth, 5% MSCI Emerging Markets (TRN), 3% Citigroup 3 month T-Bill, 17% Barclays U.S. Aggregate Bond, 16% S&P 500,15% MSCI ACWI Ex-USA (TRN), 14% Russell 1000 Growth
Rate Of Return (%)
Risk Free Rate
Citigroup 3-Month US Treasury Bill
Example Portfolio Risk
Mean (%)
Standard Deviation (%)
Sharpe Ratio
TEN YEARS
--6
--6
--6
--6
--6
SELECTED PERIOD
15.89
2.62
11.83
10.27
0.90
THREE YEARS
19.35
3.57
14.53
10.00
1.11
FIVE YEARS
15.89
2.62
11.83
10.27
0.90
SINCE START DATE (%)8/10/01
13.10
3.38
6.40
8.75
0.35
Risk Analysis
RISK (%) RETURN (%)
Pauls Portfolio
Moderate Conservative61
Citigroup 3 Month T-Bill
Short Term61
Conservative61
Moderately Conservative61
Moderately Aggressive61
Aggressive61
7.37
6.86
0.02
1.09
2.53
4.63
9.18
11.01
7.64
7.55
0.06
1.15
3.83
5.91
9.00
9.92
13
10
7
4
1
-2
Risk
51-1 3 7 9 11
Retu
rn
�
�
�
� �
�
�
�
�
�

35
Portfolio SnapshotThe Portfolio Snapshot Report is a comprehensive report, featuring a combination of the most frequently used reports. You can generate the report for a number of specific time periods. It includes a portfolio summary, performance by account, portfolio value and benchmark information. There are asset allocation graphs showing portfolio holdings sorted by investment objective and asset type. Since it provides a one-page snapshot, the number of accounts displayed is limited. The report displays a maximum of 10 accounts.
Portfolio SnapshotPortfolio Name
Prepared for: Client Firstname Lastname
Prepared by: Advisor Firstname Lastname
Incomplete if presented without accompanying disclosure pages
GAIN/LOSS
Realized
Unrealized
$1,500
-$2,187
Portfolio Value (thousands $)
600
500
400
300
200
100Mar 8 Mar 21 Apr 4 Apr 18 May 2 May 16 May 30 Jun 7
As of: 3/31/16Summary
ACCOUNT VALUE ($)
Account Performance
Portfolio Performance
Period: 1/1/16 - 3/31/16
Beginning Value
Net Contributions
Change in Value
Ending Value
Return
0
104,506
406,282
510,789
5.44%
Isabel Brokerage Account
Isabel Brokerage IRA
Isabel Socorro Trust
Client Benificiary Account 50270
John‘s Brokerage
John’s Retirement
210,400
90,000
83,590
36,700
50,099
40,000
% OF TOTAL
41.19
17.62
16.36
7.18
9.81
7.83
SINCE START DATE (%)
SINCE START DATE (%)
LAST YEAR (%)YEAR TO DATE (%)
-3.46
5.00
-4.02
2.28
-2.99
2.25
SELECTED PERIOD (%)
1.98
5.00
0.12
2.28
3.62
2.14
S&P 500 $236,470Portfolio $236,370
PORTFOLIO $510,789
START DATE
8/10/01
5/6/06
2/3/08
5/6/06
2/3/08
2/3/08
12.56
5.00
-7.95
6.98
6.12
3.48
7.06
--
-4.08
4.60
6.97
3.40
14
14
14
14
14
14, 6
18
18
-4.93
5.12
-4.02
1.89
-6.61
2.71
477,739
-84,933
42,242
435,048
-1.32%
381,586
100,129
29,072
510,789
3.53%
381,586
100,129
8,717
490,433
3.82%
326,721
50,000
134,068
510,789
4.20%
QUARTER TO DATE ($)
QUARTER TO DATE (%)
YEAR TO DATE ($) LAST YEAR ($)SELECTED PERIOD ($)
A This report may include assets that the firm does not hold and which are not included on the firm's books and records.
Page 21 of 35

36
Portfolio Snapshot SummaryThe Portfolio Snapshot Summary is a comprehensive one-page report featuring a combination of the most frequently used reports. You can generate the report for a number of specific time periods and it will include a portfolio summary, performance by account, and portfolio value and benchmark information. There is an asset allocation graph showing the portfolio holdings sorted by investment objective or asset type. The report displays a maximum of 10 accounts.

37
Portfolio SummaryThe Portfolio Summary Report provides a high-level overview of a portfolio’s performance over a selected period of time. Key net contributions and change in value information is broken out into separate line items to provide greater detail. It also features a waterfall chart to display your client’s money movement over the report’s time period.
Portfolio SummaryPortfolio Name
Prepared for: Client Firstname Lastname
Prepared by: Advisor Firstname Lastname
Incomplete if presented without accompanying disclosure pages
A This report may include assets that the firm does not hold and which are not included on the firm's books and records.
VALUE ($)
Core Accounts (millions $)
Period: 1/1/16 - 3/31/16
Beginning Value
Net Contribution
Dividends Not Reinvested
Net Cash Activity
Change In Value
Dividend Reinvested
Fees
Market Gain/Loss
Ending Value
2,935,960
-332,258
-3,228
-329,030
45,076
23,606
-74
21,544
2,648,777
-0.5 0 0.5 1.0 1.5 2.0 2.5 3.0
Manual Accounts (thousands $)
-10 -5 0 5 10 15 20 25
Return 1.66 %
VALUE ($)
Beginning Value
Net Contribution
Change In Value
Ending Value
24,999
0
-5,277
19,722
Page 24 of 35
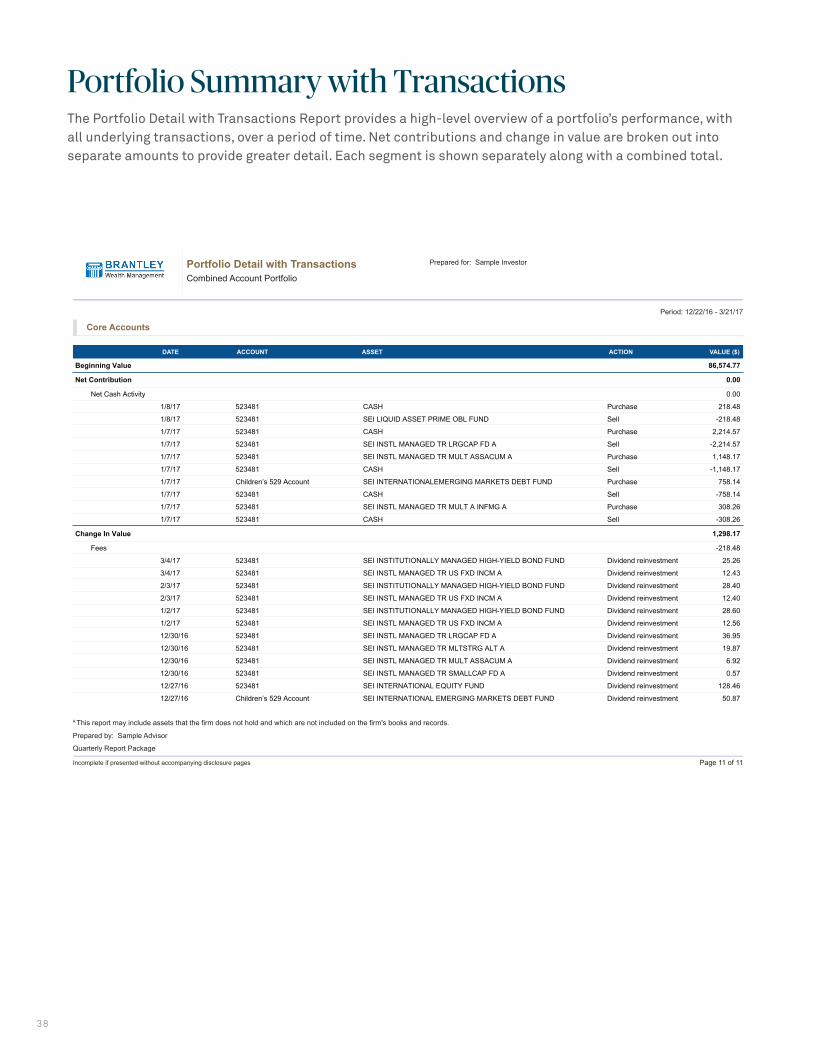
38
Portfolio Summary with TransactionsThe Portfolio Detail with Transactions Report provides a high-level overview of a portfolio’s performance, with all underlying transactions, over a period of time. Net contributions and change in value are broken out into separate amounts to provide greater detail. Each segment is shown separately along with a combined total.
Quarterly Report Package
Incomplete if presented without accompanying disclosure pages
Prepared for: Sample Investor
Prepared by: Sample Advisor
Page 11 of 11
Beginning Value 86,574.77
Net Contribution 0.00
Net Cash Activity 0.00
1/8/17 523481 CASH Purchase 218.48
1/8/17 523481 SEI LIQUID ASSET PRIME OBL FUND Sell -218.48
1/7/17 523481 CASH Purchase 2,214.57
1/7/17 523481 SEI INSTL MANAGED TR LRGCAP FD A Sell -2,214.57
1/7/17 523481 SEI INSTL MANAGED TR MULT ASSACUM A Purchase 1,148.17
1/7/17 523481 CASH Sell -1,148.17
1/7/17 Children’s 529 Account SEI INTERNATIONALEMERGING MARKETS DEBT FUND Purchase 758.14
1/7/17 523481 CASH Sell -758.14
1/7/17 523481 SEI INSTL MANAGED TR MULT A INFMG A Purchase 308.26
1/7/17 523481 CASH Sell -308.26
Change In Value 1,298.17
Fees -218.48
3/4/17 523481 SEI INSTITUTIONALLY MANAGED HIGH-YIELD BOND FUND Dividend reinvestment 25.26
3/4/17 523481 SEI INSTL MANAGED TR US FXD INCM A Dividend reinvestment 12.43
2/3/17 523481 SEI INSTITUTIONALLY MANAGED HIGH-YIELD BOND FUND Dividend reinvestment 28.40
2/3/17 523481 SEI INSTL MANAGED TR US FXD INCM A Dividend reinvestment 12.40
1/2/17 523481 SEI INSTITUTIONALLY MANAGED HIGH-YIELD BOND FUND Dividend reinvestment 28.60
1/2/17 523481 SEI INSTL MANAGED TR US FXD INCM A Dividend reinvestment 12.56
12/30/16 523481 SEI INSTL MANAGED TR LRGCAP FD A Dividend reinvestment 36.95
12/30/16 523481 SEI INSTL MANAGED TR MLTSTRG ALT A Dividend reinvestment 19.87
12/30/16 523481 SEI INSTL MANAGED TR MULT ASSACUM A Dividend reinvestment 6.92
12/30/16 523481 SEI INSTL MANAGED TR SMALLCAP FD A Dividend reinvestment 0.57
12/27/16 523481 SEI INTERNATIONAL EQUITY FUND Dividend reinvestment 128.46
12/27/16 Children’s 529 Account SEI INTERNATIONAL EMERGING MARKETS DEBT FUND Dividend reinvestment 50.87
Portfolio Detail with TransactionsCombined Account Portfolio
Period: 12/22/16 - 3/21/17
ASSETDATE ACCOUNT ACTION VALUE ($) 12/27/16 523481 SEI INTERNATIONAL EMERGING MARKETS FUND Dividend reinvestment 15.84
1/7/17 523481 CASH Management Fee -218.48
Market Gain/Loss 1,137.52
Ending Value 87,872.94
Investment Return 1.50%
A This report may include assets that the firm does not hold and which are not included on the firm's books and records.
Core Accounts

39
Portfolio Value and BenchmarkThe Portfolio Value and Benchmark Report tracks performance of a portfolio against an industry or composite index. You can overlay up to two benchmark indices from a choice of over 100 available indices (including the S&P 500, Dow Jones Industrial Average and Barclays Aggregate Bond Index), or use a custom-blended composite. A display of your client’s portfolio gives a better understanding of relative performance. This report can also be run without any assigned benchmarks to chart the portfolio’s change for a period of time. You may elect to suppress the “legend” or numerical values.
Portfolio Value and BenchmarkPortfolio Name
Prepared for: Client Firstname Lastname
Prepared by: Advisor Firstname Lastname
Incomplete if presented without accompanying disclosure pages
S&P 500 $250,268
Period: 1/1/16 - 3/31/16
240
235
230
225
220
Jan 13 Q1, 13 Q2, 13 Q3, 13 Q4, 13 Feb 14*
Portfolio $236.370
Portfolio Value (thousands $)
A This report may include assets that the firm does not hold and which are not included on the firm's books and records.
Portfolio Performance
PERIOD CHANGE IN VALUE ($)NET CONTRIBUTION ($)ENDING VALUE ($) PORTFOLIO (%) PERFORMANCE (%) DIFF (%)S&P 500 (%)
Start 376,463
Q1, 13 1/1/13 - 3/31/13 237,741 0 10,388 0.20 1.00 1.00
Q2, 13 4/1/13 - 6/30/13 237,283 0 7,555 -0.19 1.43 0.24
Q3, 13 7/1/13 - 9/30/13 234,644 0 -6,073 -1.11 3.72 0.73
Q4, 13 10/1/13 - 12/31/13 233,189 -893 21,716 -0.62 1.43 1.58
Q1, 14 1/1/14 - 2/1/14* 236,370 0 1,116 1.30 -1.70 -0.39
1/1/13 - 2/1/14 $ 236,370 -$893 $ 1,116 -0.38% 5.88% 3.16%
*Represents partial period
Page 26 of 35

40
Security PerformanceThe Security Performance Report shows the multi-period performance for all clients at the asset, account, investor and portfolio levels.
Security PerformancePortfolio Name
Prepared for: Client Firstname Lastname
Prepared by: Advisor Firstname Lastname
Incomplete if presented without accompanying disclosure pages
Account Name: Sample Account 1
Account Number: XXXX6226
Account Type: Non-ERISA Retirement
ASSET VALUE ($) YEAR TO DATE (%) ONE YEAR (%) THREE YEARS (%) FIVE YEARS (%)
**BLACKROCK FDS II U S OPPORTUNITIES PRTFLIO INSTL CL 0 --14
**COHEN & STEERS REALTY INCOME FUND CL I 1,404 6.36 4.98
**DELAWARE GROUP EMERGING MARKETS FUND-INSTL CL 1,240 -5.35 4.76
**SHORT DURATION BONDFD SELECT CL 12,596 0.38 0.37
**TR I EMERGING MKTS EQUITY FD INSTL 2,406 -6.12
**TR I INTL VALUE FD INSTL CL 2,634 -2.93 --6
**TR I MID CAP EQUITY FD SELECT CL 2,729 0.89 27.80
**TR II CORE BD FD SELECT CL 8,996 1.43 -0.18
**MFS RESEARCH INTERNATIONAL FD CL I 3,268 -2.28 --6
**OAKMARK FUND 6,841 -2.11 24.72
**PIMCO SHORT TERM FUND INSTL CL 17,461 0.39 --6
**THORNBURG INTL VALUE FUND CL I 2,630 -3.77 7.09
BLACKROCK FDS HIGH YIELD BD PORTFOLIO INSTL 4,607 1.77 --6
DREYFUS EMERGING MARKETS DEBT LOCAL CURRENCY FUND CL I 0 --14 --6
FEDERATED INSTITUTIONAL HIGHYIELD BOND FUND 3,941 1.76 7.60
GOLDMAN SACHS EMERGING MKTS DEBT FD INSTL CL 1,582 0.51 -4.51
ISHARES MSCI EAFE ETF 1,452 -1.57 --6
ISHARES RUSSELL 2000 ETF 3,486 -2.51
--14
6.36
-5.35
0.38
-6.12
-2.93
0.89
1.43
-2.28
-2.11
0.39
-3.77
1.77
--14
1.76
0.51
-1.57
-2.51
SAMPLE INVESTOR 1
Program: Strategic Portfolio IRA Accounts
--6
--6
--6
--6
--6
--6
--6
--6
--6
--6
--6
--6
--6
--6
--6
--6
--6
--6
--6
--6
--6
--6
--6
--6
--6
--6
--6
--6
--6
--6
--6
--6
--6
--6
--6
--6
--6
--6
--6
--6
--6
--6
--6
--6
--6
--6
--6
--6
--6
--6
--6
--6
--6
--6
--6
--6
--6
Manager: Strategic Portfolio Managed Account Type: SMA (Separately Managed Account)
SELECTED PERIOD (%)SINCE START DATE (%)
6/22/11
Period: 1/1/16 - 3/31/16
--6
--6
--6
JOHN HANCOCK INCOME FUND CL I 2,609 1.40
TR I EMERGING MKTS EQUITY FD SELECT 0 --14
TR I INTL VALUE FD SELECT CL 0 --14
1.40
--14
--14
--6
--6
--6
--6
--6
--6
--6
--6
--6
--6
--6
TR I U S EQUITY FD INSTL CL 7,050 -1.13
TR I U S EQUITY FD SELECT CL 0 --14
-1.13
--14
--6
--6
--6
--6
--6
--6
A This report may include assets that the firm does not hold and which are not included on the firm's books and records.
Page 27 of 35

41
Tax Lot Gain/Loss by InvestorThe Tax Lot Gain/Loss by Investor Report provides unrealized and realized gain/loss reporting for assets within selected portfolio reflecting the cost basis you assign through the application. You can choose from several methodologies to assign cost basis, including average cost (single and double category) and assigned lot matching.
Quarterly Report PackageQuarterly Report Package
Incomplete if presented without accompanying disclosure pages
Prepared for: Sample Investor
Prepared by: Sample Advisor
Page 2 of 6
Not intended for use with the client.Tax Lot Gain/Loss by InvestorCombined Account Portfolio
Period: 12/22/16 - 3/21/17
A This report may include assets that the firm does not hold and which are not included on the firm's books and records.
Account Name: Sample Account 1
Account Number: XXXXX3893
Sample Investor 1
ASSET REALIZED TOTALGAIN/LOSS ($)
UNREALIZEDCLOSED VALUE ($)TOTAL COST ($)UNITS
SEI INST. MANAGED LARGE CAP VALUE FUND 1,613.95 25,567.90 37,298.48 11,730.58 208.75 11,939.33
SEI INSTITUTIONALLY MANA GED CORE FIXED INCOME FUND 4,670.18 49,375.12 48,289.68 −1,085.44 −14.64 −1,100.08
SEI INSTITUTIONALLY MANAGED HIGH−YIELD BOND FUND 826.53 6,650.75 7,108.16 457.44 7.85 465.29
SEI INSTITUTIONALLY MANAGED SMALL−CAP VALUE FUND 316.28 5,315.57 6,891.68 1,576.10 21.07 1,597.17
SEI INSTL MANAGED TR−LG CAP GR A 1,676.54 23,291.37 35,593.03 12,301.65 192.01 12,493.66
SEI INSTL MANAGED TR−SM CAP GR A 274.66 3,095.72 5,663.49 2,567.77 40.97 2,608.74
SEI INTERNATIONAL EMERGING MARKETSDEBT FUND 854.59 8,481.39 9,409.01 927.64 13.24 940.88
SEI INTERNATIONAL EMERGING MARKETS FUND 830.99 7,239.32 14,185.05 6,945.74 87.60 7,033.34
SEI INTERNATIONAL EQUITY FUN 1,767.18 13,205.40 26,560.70 13,355.30 712.61 14,067.91
SEI INTL TR−INTL FIXD INCOME TRUST 1,078.79 12,182.01 11,650.92 −531.08 −7.34 −538.4A2
Account Subtotal: $154,404.55 $202,650.20 $48,245.70 $1,262.11 $49,507.81
Account Other Holdings/Liabilities Total: $0.00
Account Total: $202,650.20
Investor Subtotal: $154,404.55 $202,650.20 $48,245.70 $1,262.11 $49,507.81
In vestor Other Holdings/LiabilitiesTotal: $0.00
Investor Total: $202,650.20
Portfolio Subtotal: $154,404.55 $202,650.20 $48,245.70 $1,262.11 $49,507.81
Portfolio Other Holdings/Liabilities Total: $0.00
Portfolio Total: $202,650.20
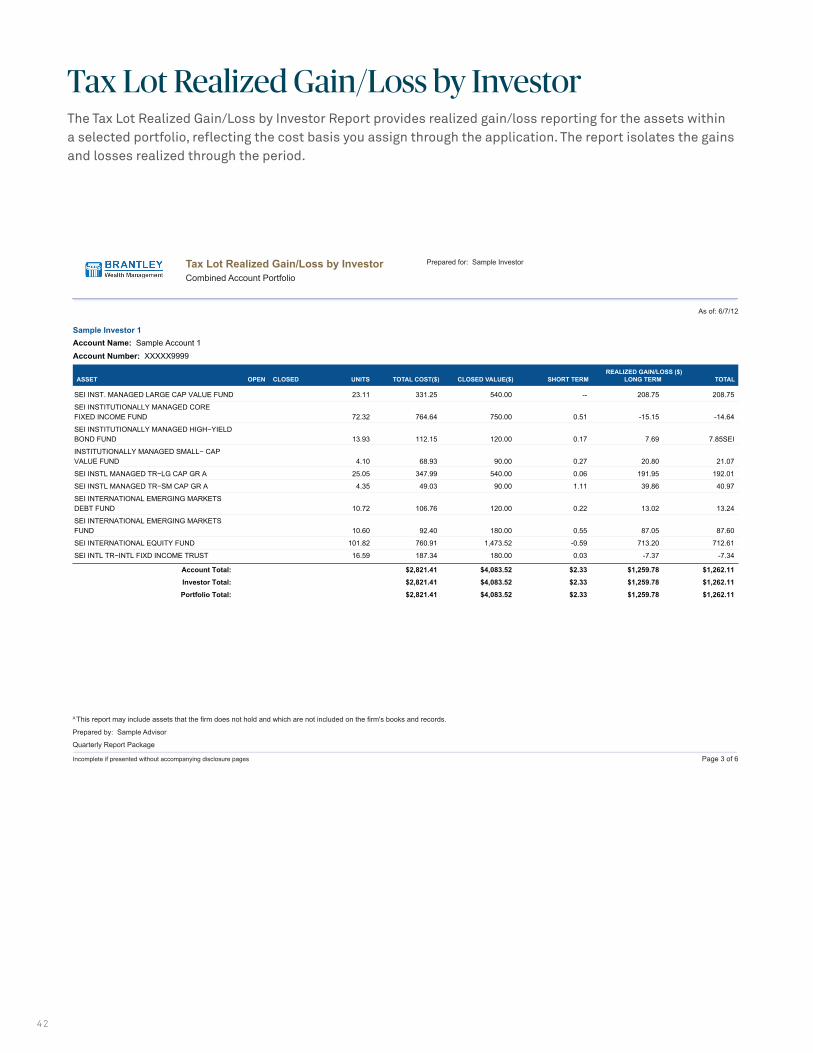
42
Tax Lot Realized Gain/Loss by InvestorThe Tax Lot Realized Gain/Loss by Investor Report provides realized gain/loss reporting for the assets within a selected portfolio, reflecting the cost basis you assign through the application. The report isolates the gains and losses realized through the period.
Quarterly Report Package
Incomplete if presented without accompanying disclosure pages
Prepared by: Sample Advisor
Prepared for: Sample Investor
Page 3 of 6
Not intended for use with the client.Tax Lot Realized Gain/Loss by InvestorCombined Account Portfolio
A This report may include assets that the firm does not hold and which are not included on the firm's books and records.
SEI INST. MANAGED LARGE CAP VALUE FUND 23.11 331.25 540.00 -- 208.75 208.75
SEI INSTITUTIONALLY MANAGED COREFIXED INCOME FUND 72.32 764.64 750.00 0.51 -15.15 -14.64
SEI INSTITUTIONALLY MANAGED HIGH−YIELDBOND FUND 13.93 112.15 120.00 0.17 7.69 7.85SEI
INSTITUTIONALLY MANAGED SMALL− CAPVALUE FUND 4.10 68.93 90.00 0.27 20.80 21.07
SEI INSTL MANAGED TR−LG CAP GR A 25.05 347.99 540.00 0.06 191.95 192.01
SEI INSTL MANAGED TR−SM CAP GR A 4.35 49.03 90.00 1.11 39.86 40.97
SEI INTERNATIONAL EMERGING MARKETSDEBT FUND 10.72 106.76 120.00 0.22 13.02 13.24
SEI INTERNATIONAL EMERGING MARKETSFUND 10.60 92.40 180.00 0.55 87.05 87.60
SEI INTERNATIONAL EQUITY FUND 101.82 760.91 1,473.52 -0.59 713.20 712.61
SEI INTL TR−INTL FIXD INCOME TRUST 16.59 187.34 180.00 0.03 -7.37 -7.34
Account Total: $2,821.41 $4,083.52 $2.33 $1,259.78 $1,262.11
Investor Total: $2,821.41 $4,083.52 $2.33 $1,259.78 $1,262.11
Portfolio Total: $2,821.41 $4,083.52 $2.33 $1,259.78 $1,262.11
As of: 6/7/12
Sample Investor 1Account Name: Sample Account 1Account Number: XXXXX9999
ASSET OPEN CLOSED UNITS TOTAL COST($) CLOSED VALUE($) SHORT TERM LONG TERM TOTALREALIZED GAIN/LOSS ($)
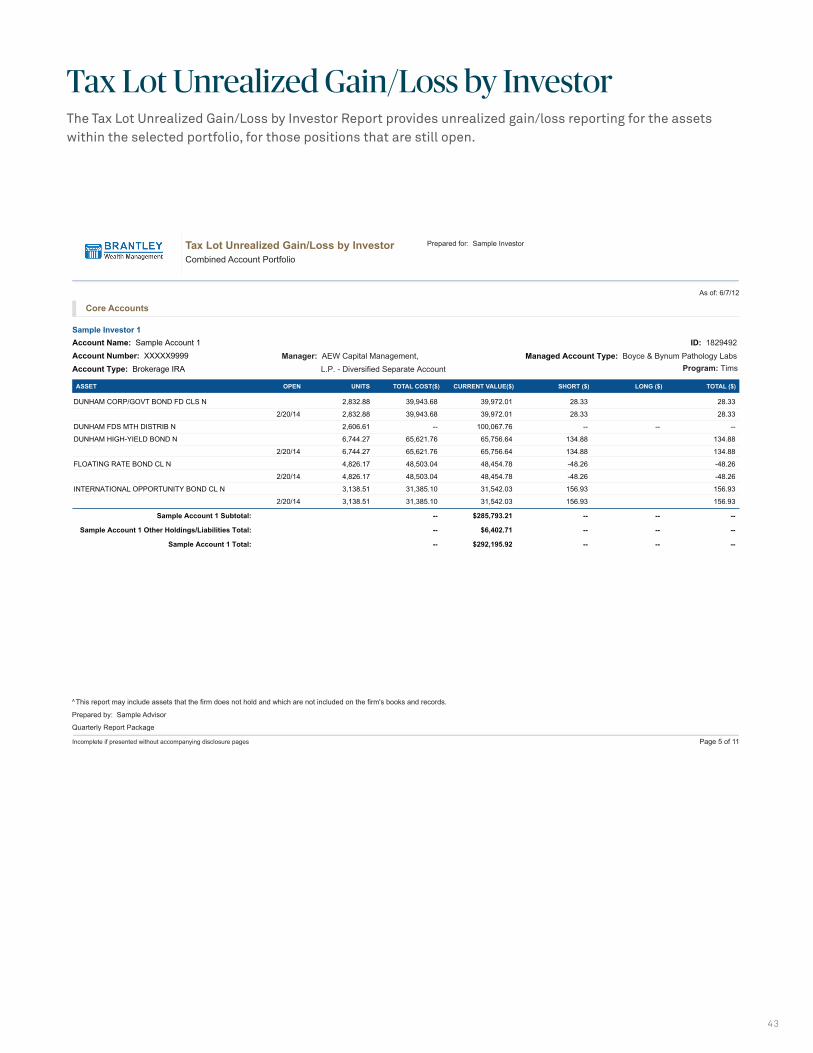
43
Tax Lot Unrealized Gain/Loss by InvestorThe Tax Lot Unrealized Gain/Loss by Investor Report provides unrealized gain/loss reporting for the assets within the selected portfolio, for those positions that are still open.
Not intended for use with the client.
Quarterly Report Package
Incomplete if presented without accompanying disclosure pages
Prepared for: Sample Investor
Prepared by: Sample Advisor
Page 5 of 11
DUNHAM CORP/GOVT BOND FD CLS N 2,832.88 39,943.68 39,972.01 28.33 28.33
2/20/14 2,832.88 39,943.68 39,972.01 28.33 28.33
DUNHAM FDS MTH DISTRIB N 2,606.61 -- 100,067.76 -- -- --
DUNHAM HIGH-YIELD BOND N 6,744.27 65,621.76 65,756.64 134.88 134.88
2/20/14 6,744.27 65,621.76 65,756.64 134.88 134.88
FLOATING RATE BOND CL N 4,826.17 48,503.04 48,454.78 -48.26 -48.26
2/20/14 4,826.17 48,503.04 48,454.78 -48.26 -48.26
INTERNATIONAL OPPORTUNITY BOND CL N 3,138.51 31,385.10 31,542.03 156.93 156.93
2/20/14 3,138.51 31,385.10 31,542.03 156.93 156.93
Sample Account 1 Subtotal: -- $285,793.21 -- -- --
Sample Account 1 Other Holdings/Liabilities Total: -- $6,402.71 -- -- --
Sample Account 1 Total: -- $292,195.92 -- -- --
Tax Lot Unrealized Gain/Loss by InvestorCombined Account Portfolio
As of: 6/7/12
Core Accounts
Sample Investor 1Account Name: Sample Account 1Account Number: XXXXX9999Account Type: Brokerage IRA
Managed Account Type: Boyce & Bynum Pathology Labs
ID: 1829492
Manager: AEW Capital Management, L.P. - Diversified Separate Account Program: Tims
ASSET OPEN UNITS TOTAL COST($) CURRENT VALUE($) SHORT ($) LONG ($) TOTAL ($)
A This report may include assets that the firm does not hold and which are not included on the firm's books and records.
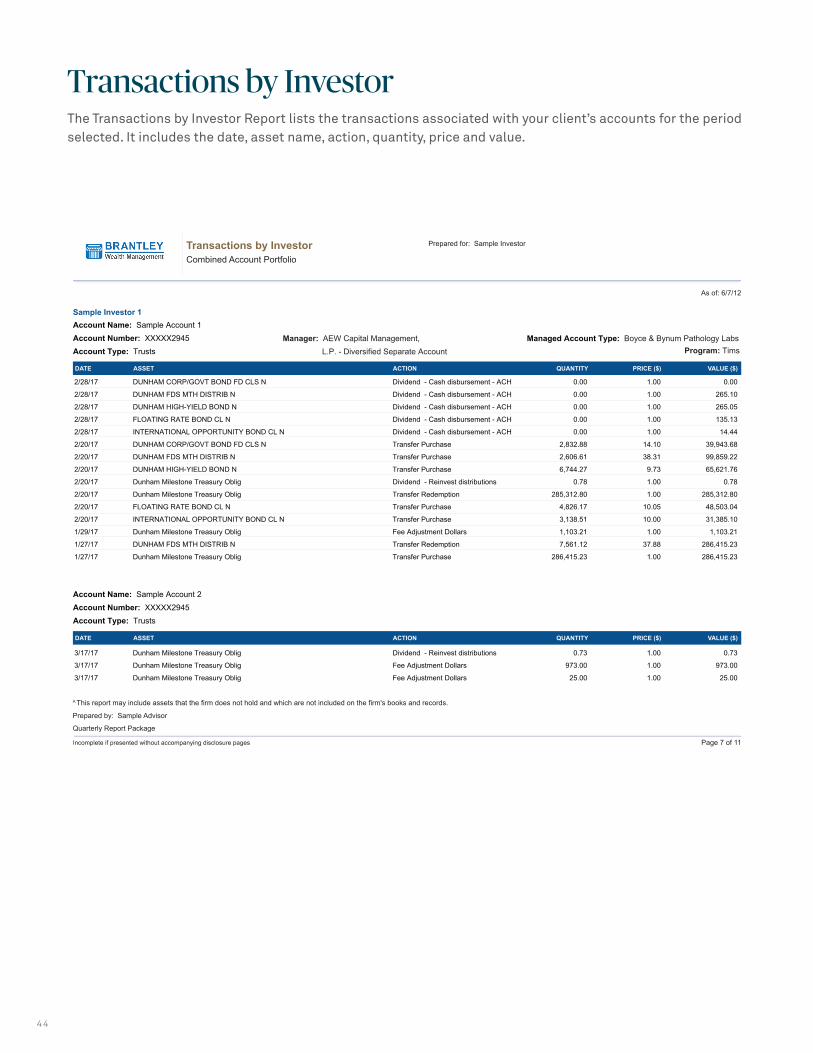
4 4
Transactions by InvestorThe Transactions by Investor Report lists the transactions associated with your client’s accounts for the period selected. It includes the date, asset name, action, quantity, price and value.
Quarterly Report Package
Incomplete if presented without accompanying disclosure pages
Prepared for: Sample Investor
Prepared by: Sample Advisor
Transactions by InvestorCombined Account Portfolio
Page 7 of 11
Sample Investor 1Account Name: Sample Account 1Account Number: XXXXX2945Account Type: Trusts
Account Name: Sample Account 2Account Number: XXXXX2945Account Type: Trusts
Managed Account Type: Boyce & Bynum Pathology Labs
ID: 1829492
Manager: AEW Capital Management, L.P. - Diversified Separate Account Program: Tims
ASSETDATE ACTION QUANTITY PRICE ($) VALUE ($)
ASSETDATE ACTION QUANTITY PRICE ($) VALUE ($)
2/28/17 DUNHAM CORP/GOVT BOND FD CLS N Dividend - Cash disbursement - ACH 0.00 1.00 0.00
2/28/17 DUNHAM FDS MTH DISTRIB N Dividend - Cash disbursement - ACH 0.00 1.00 265.10
2/28/17 DUNHAM HIGH-YIELD BOND N Dividend - Cash disbursement - ACH 0.00 1.00 265.05
2/28/17 FLOATING RATE BOND CL N Dividend - Cash disbursement - ACH 0.00 1.00 135.13
2/28/17 INTERNATIONAL OPPORTUNITY BOND CL N Dividend - Cash disbursement - ACH 0.00 1.00 14.44
2/20/17 DUNHAM CORP/GOVT BOND FD CLS N Transfer Purchase 2,832.88 14.10 39,943.68
2/20/17 DUNHAM FDS MTH DISTRIB N Transfer Purchase 2,606.61 38.31 99,859.22
2/20/17 DUNHAM HIGH-YIELD BOND N Transfer Purchase 6,744.27 9.73 65,621.76
2/20/17 Dunham Milestone Treasury Oblig Dividend - Reinvest distributions 0.78 1.00 0.78
2/20/17 Dunham Milestone Treasury Oblig Transfer Redemption 285,312.80 1.00 285,312.80
2/20/17 FLOATING RATE BOND CL N Transfer Purchase 4,826.17 10.05 48,503.04
2/20/17 INTERNATIONAL OPPORTUNITY BOND CL N Transfer Purchase 3,138.51 10.00 31,385.10
1/29/17 Dunham Milestone Treasury Oblig Fee Adjustment Dollars 1,103.21 1.00 1,103.21
1/27/17 DUNHAM FDS MTH DISTRIB N Transfer Redemption 7,561.12 37.88 286,415.23
1/27/17 Dunham Milestone Treasury Oblig Transfer Purchase 286,415.23 1.00 286,415.23
3/17/17 Dunham Milestone Treasury Oblig Dividend - Reinvest distributions 0.73 1.00 0.73
3/17/17 Dunham Milestone Treasury Oblig Fee Adjustment Dollars 973.00 1.00 973.00
3/17/17 Dunham Milestone Treasury Oblig Fee Adjustment Dollars 25.00 1.00 25.00
A This report may include assets that the firm does not hold and which are not included on the firm's books and records.
As of: 6/7/12

45
Transactions by PortfolioThe Transactions by Portfolio Report lists all of the transactions associated with the portfolio for the period selected and displays transaction date, account name, action, asset name, quantity, price and value for any period.
Quarterly Report Package
Incomplete if presented without accompanying disclosure pages
Prepared by: Sample Advisor
Prepared for: Sample Investor
Page 9 of 11
Transactions by PortfolioCombined Account Portfolio
ASSETDATE ACTION QUANTITY PRICE ($) VALUE ($)
3/18/17 BROKERAGE MONEY MARKET Initial Position 8,011.65 1.00 8,011.65
3/17/17 Dunham Milestone Treasury Oblig Fee Adjustment Dollars 973.00 1.00 973.00
3/17/17 Dunham Milestone Treasury Oblig Direct Redemption 314,098.24 1.00 314,098.24
3/17/17 Dunham Milestone Treasury Oblig Fee Adjustment Dollars 25.00 1.00 25.00
3/17/17 Dunham Milestone Treasury Oblig Dividend - Reinvest distributions 0.73 1.00 0.73
3/3/17 PHILLIPS EDISON ARC SHOPPING CNTR REIT Dividend - Cash disbursement - ACH 0.00 1.00 102.76
2/28/17 DUNHAM FDS MTH DISTRIB N Dividend - Cash disbursement - ACH 0.00 1.00 265.10
2/28/17 INTERNATIONAL OPPORTUNITY BOND CL N Dividend - Cash disbursement - ACH 0.00 1.00 14.44
2/28/17 DUNHAM HIGH-YIELD BOND N Dividend - Cash disbursement - ACH 0.00 1.00 265.05
2/28/17 FLOATING RATE BOND CL N Dividend - Cash disbursement - ACH 0.00 1.00 135.13
2/28/17 DUNHAM CORP/GOVT BOND FD CLS N Dividend - Cash disbursement - ACH 0.00 1.00 0.00
2/20/17 DUNHAM FDS MTH DISTRIB N Transfer Purchase 2,606.61 38.31 99,859.22
2/20/17 DUNHAM HIGH-YIELD BOND N Transfer Purchase 6,744.27 9.73 65,621.76
2/20/17 FLOATING RATE BOND CL N Transfer Purchase 4,826.17 10.05 48,503.04
2/20/17 INTERNATIONAL OPPORTUNITY BOND CL N Transfer Purchase 3,138.51 10.00 31,385.10
2/20/17 DUNHAM CORP/GOVT BOND FD CLS N Transfer Purchase 2,832.88 14.10 39,943.68
2/20/17 Dunham Milestone Treasury Oblig Dividend - Reinvest distributions 0.78 1.00 0.78
2/20/17 Dunham Milestone Treasury Oblig Transfer Redemption 285,312.80 1.00 285,312.80
2/3/17 PHILLIPS EDISON ARC SHOPPING CNTR REIT Dividend - Cash disbursement - ACH 0.00 1.00 113.77
1/29/17 Dunham Milestone Treasury Oblig Fee Adjustment Dollars 1,103.21 1.00 1,103.21
1/29/17 Dunham Milestone Treasury Oblig Fee Adjustment Dollars 1,202.64 1.00 1,202.64
1/27/17 DUNHAM HIGH-YIELD BOND N Transfer Redemption 7,547.09 9.67 72,980.39
1/27/17 DUNHAM HIGH-YIELD BOND N Account Liquidation Adjustment 7,547.09 9.67 72,980.39
1/27/17 DUNHAM FDS MTH DISTRIB N Transfer Redemption 2,902.86 37.88 109,960.37
1/27/17 DUNHAM FDS MTH DISTRIB N Account Liquidation Adjustment 2,902.86 37.88 109,960.37
1/27/17 INTERNATIONAL OPPORTUNITY BOND CL N Account Liquidation Adjustment 3,514.49 9.95 34,969.21
1/27/17 INTERNATIONAL OPPORTUNITY BOND CL N Transfer Redemption 3,514.49 9.95 34,969.21
1/27/17 FLOATING RATE BOND CL N Transfer Redemption 5,360.95 10.05 53,877.55
1/27/17 FLOATING RATE BOND CL N Account Liquidation Adjustment 5,360.95 10.05 53,877.55
1/27/17 DUNHAM CORP/GOVT BOND FD CLS N Transfer Redemption 3,174.80 14.02 44,510.63
1/27/17 DUNHAM CORP/GOVT BOND FD CLS N Account Liquidation Adjustment 3,174.80 14.02 44,510.63
1/27/17 Dunham Milestone Treasury Oblig Transfer Purchase 316,298.15 1.00 316,298.15
1/27/17 Dunham Milestone Treasury Oblig Transfer Purchase 286,415.23 1.00 286,415.23
1/27/17 DUNHAM FDS MTH DISTRIB N Transfer Redemption 7,561.12 37.88 286,415.23
1/2/17 PHILLIPS EDISON ARC SHOPPING CNTR REIT Dividend - Cash disbursement - ACH 0.00 1.00 113.77
12/31/16 FLOATING RATE BOND CL N Dividend - Cash disbursement - ACH 0.00 1.00 48.01
12/31/16 INTERNATIONAL OPPORTUNITY BOND CL N Dividend - Cash disbursement - ACH 0.00 1.00 22.86
Period: 12/22/16 - 3/21/17
A This report may include assets that the firm does not hold and which are not included on the firm's books and records.
Core Accounts
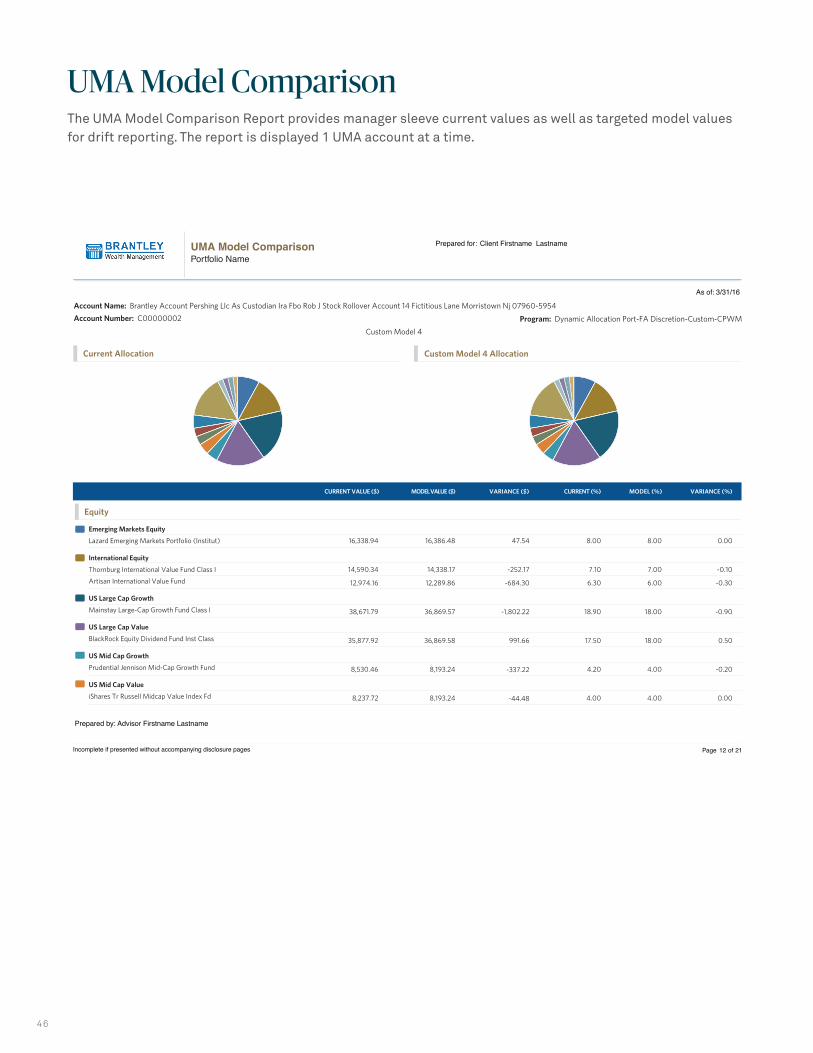
46
UMA Model ComparisonThe UMA Model Comparison Report provides manager sleeve current values as well as targeted model values for drift reporting. The report is displayed 1 UMA account at a time.
UMA Model ComparisonPortfolio Name
Prepared for:
Client Firstname Lastname
Prepared by: Advisor Firstname Lastname
Incomplete if presented without accompanying disclosure pages Page 12 of 21
Emerging Markets Equity
Lazard Emerging Markets Portfolio (Institut)
International Equity
Thornburg International Value Fund Class I
Artisan International Value Fund
US Large Cap Growth
Mainstay Large-Cap Growth Fund Class I
US Large Cap Value
BlackRock Equity Dividend Fund Inst Class
US Mid Cap Growth
Prudential Jennison Mid-Cap Growth Fund
US Mid Cap Value
iShares Tr Russell Midcap Value Index Fd
CURRENT VALUE ($) CURRENT (%) MODEL (%) VARIANCE (%)VARIANCE ($)MODEL VALUE ($)
16,338.94
14,590.34
12,974.16
38,671.79
35,877.92
8,530.46
8,237.72
16,386.48
14,338.17
12,289.86
36,869.57
36,869.58
8,193.24
8,193.24
47.54
-252.17
-684.30
-1,802.22
991.66
-337.22
-44.48
8.00
7.10
6.30
18.90
17.50
4.20
4.00
8.00
7.00
6.00
18.00
18.00
4.00
4.00
0.00
-0.10
-0.30
-0.90
0.50
-0.20
0.00
Current Allocation
Custom Model 4
Custom Model 4 Allocation
Equity
As of: 3/31/16
Program: Dynamic Allocation Port-FA Discretion-Custom-CPWM
Account Name: Brantley Account Pershing Llc As Custodian Ira Fbo Rob J Stock Rollover Account 14 Fictitious Lane Morristown Nj 07960-5954
Account Number: C00000002
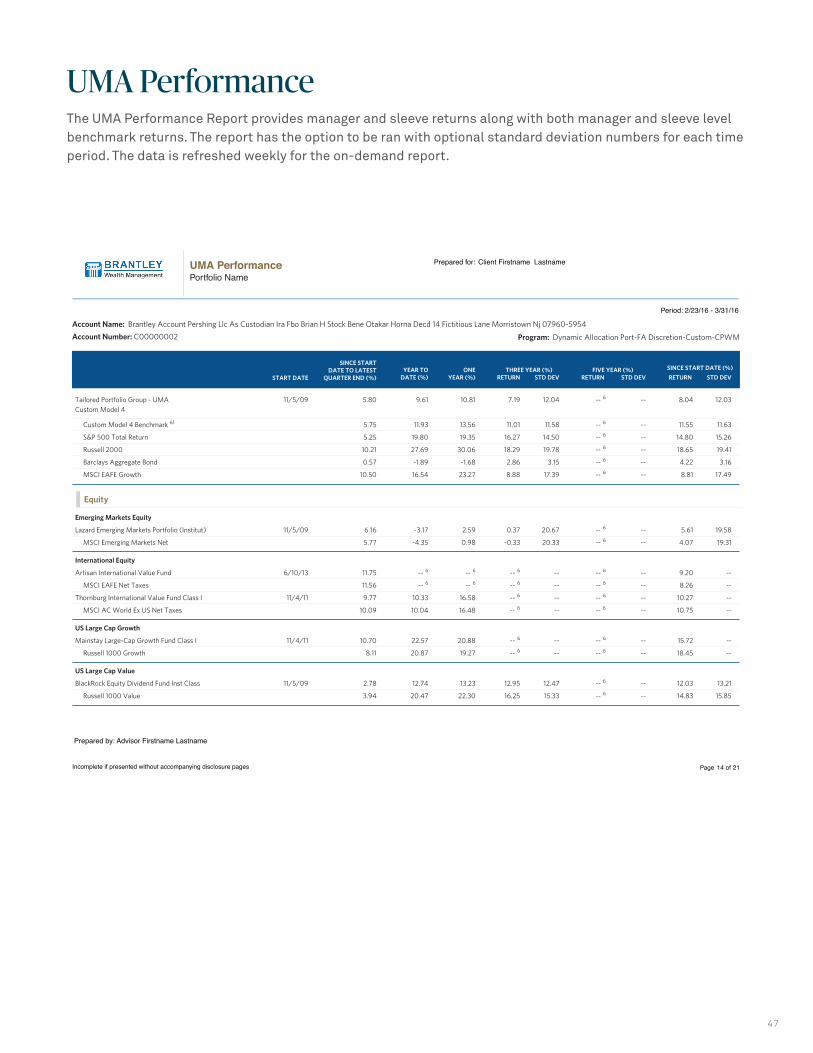
47
UMA PerformanceThe UMA Performance Report provides manager and sleeve returns along with both manager and sleeve level benchmark returns. The report has the option to be ran with optional standard deviation numbers for each time period. The data is refreshed weekly for the on-demand report.
UMA PerformancePortfolio Name
Prepared for:
Client Firstname Lastname
Period: 2/23/16 - 3/31/16
Prepared by: Advisor Firstname Lastname
Incomplete if presented without accompanying disclosure pages Page 14 of 21
--
--
--
--
--
--
--
--
--
--
--
--
--
--
--
--
Tailored Portfolio Group - UMACustom Model 4
Custom Model 4 Benchmark 61
S&P 500 Total Return
Russell 2000
Barclays Aggregate Bond
MSCI EAFE Growth
Emerging Markets Equity
Lazard Emerging Markets Portfolio (Institut)
MSCI Emerging Markets Net
International Equity
Artisan International Value Fund
MSCI EAFE Net Taxes
Thornburg International Value Fund Class I
MSCI AC World Ex US Net Taxes
US Large Cap Growth
Mainstay Large-Cap Growth Fund Class I
Russell 1000 Growth
US Large Cap Value
BlackRock Equity Dividend Fund Inst Class
Russell 1000 Value
8.04
11.55
14.80
18.65
4.22
8.81
5.61
4.07
9.20
8.26
10.27
10.75
15.72
18.45
12.03
14.83
12.03
11.63
15.26
19.41
3.16
17.49
19.58
19.31
--
--
--
--
--
--
13.21
15.85
-- 6
-- 6
-- 6
-- 6
-- 6
-- 6
-- 6
-- 6
-- 6
-- 6
-- 6
-- 6
-- 6
-- 6
-- 6
-- 6
7.19
11.01
16.27
18.29
2.86
8.88
0.37
-0.33
-- 6
-- 6
-- 6
-- 6
-- 6
-- 6
12.95
16.25
12.04
11.58
14.50
19.78
3.15
17.39
20.67
20.33
--
--
--
--
--
--
12.47
15.33
10.81
13.56
19.35
30.06
-1.68
23.27
2.59
0.98
-- 6
-- 6
16.58
16.48
20.88
19.27
13.23
22.30
9.61
11.93
19.80
27.69
-1.89
16.54
-3.17
-4.35
-- 6
-- 6
10.33
10.04
22.57
20.87
12.74
20.47
5.80
5.75
5.25
10.21
0.57
10.50
6.16
5.77
11.75
11.56
9.77
10.09
10.70
8.11
2.78
3.94
Program: Dynamic Allocation Port-FA Discretion-Custom-CPWMAccount Number: C00000002
Account Name: Brantley Account Pershing Llc As Custodian Ira Fbo Brian H Stock Bene Otakar Horna Decd 14 Fictitious Lane Morristown Nj 07960-5954
11/5/09
11/5/09
6/10/13
11/4/11
11/4/11
11/5/09
START DATE
SINCE STARTDATE TO LATEST
QUARTER END (%)YEAR TO
DATE (%)ONE
YEAR (%)FIVE YEAR (%)
RETURN STD DEV
SINCE START DATE (%)
RETURN STD DEVTHREE YEAR (%)
RETURN STD DEV
Equity
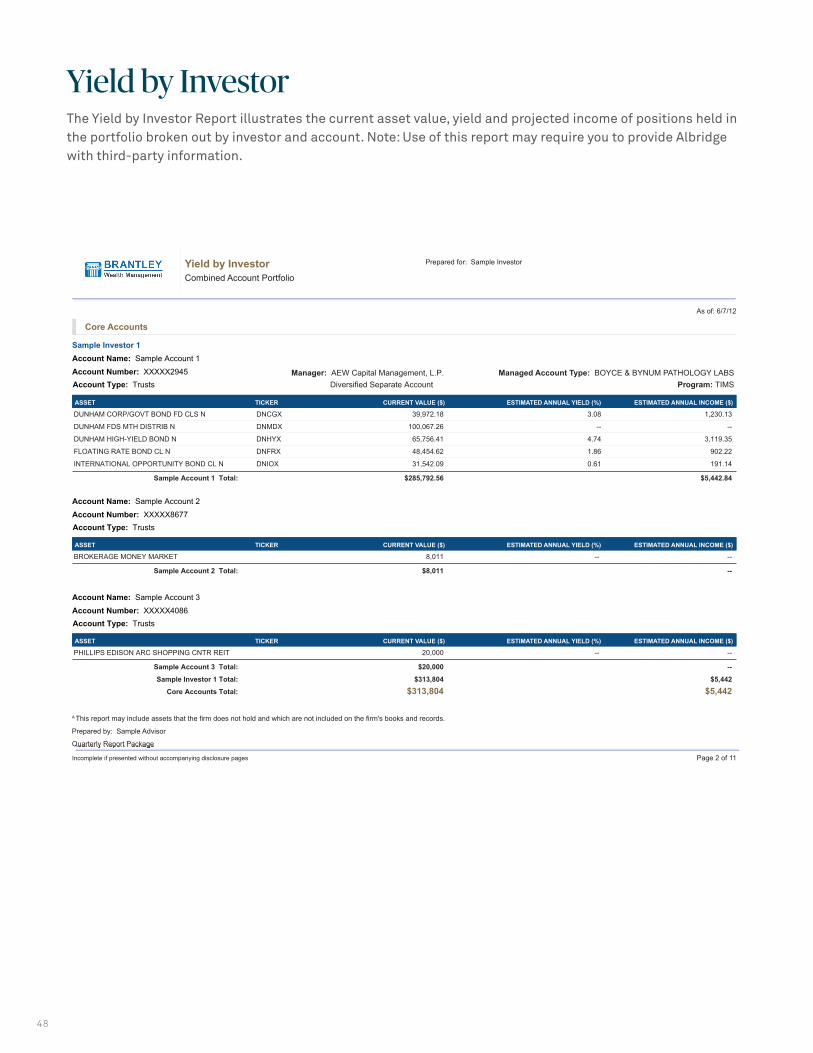
48
Yield by InvestorThe Yield by Investor Report illustrates the current asset value, yield and projected income of positions held in the portfolio broken out by investor and account. Note: Use of this report may require you to provide Albridge with third-party information.
Quarterly Report PackageQuarterly Report Package
Incomplete if presented without accompanying disclosure pages
Prepared for: Sample Investor
Prepared by: Sample Advisor
Page 2 of 11
Not intended for use with the client.Yield by InvestorCombined Account Portfolio
A This report may include assets that the firm does not hold and which are not included on the firm's books and records.
Core Accounts
DUNHAM CORP/GOVT BOND FD CLS N DNCGX 39,972.18 3.08 1,230.13
DUNHAM FDS MTH DISTRIB N DNMDX 100,067.26 -- --
DUNHAM HIGH-YIELD BOND N DNHYX 65,756.41 4.74 3,119.35
FLOATING RATE BOND CL N DNFRX 48,454.62 1.86 902.22
INTERNATIONAL OPPORTUNITY BOND CL N DNIOX 31,542.09 0.61 191.14
Sample Account 1 Total: $285,792.56 $5,442.84
Account Name: Sample Account 1
Account Number: XXXXX2945 Account Type: Trusts
Account Name: Sample Account 2
Account Number: XXXXX8677 Account Type: Trusts
Sample Investor 1
Program: TIMS Manager: AEW Capital Management, L.P.
Diversified Separate AccountManaged Account Type: BOYCE & BYNUM PATHOLOGY LABS
% OF TOTAL ACCOUNT NAME ESTIMATED ANNUAL YIELD (%) ESTIMATED ANNUAL INCOME ($)CURRENT VALUE ($)TICKER ASSET
BROKERAGE MONEY MARKET 8,011 -- --
Sample Account 2 Total: $8,011 --
% OF TOTAL ACCOUNT NAME ESTIMATED ANNUAL YIELD (%) ESTIMATED ANNUAL INCOME ($)CURRENT VALUE ($)TICKER ASSET
Account Name: Sample Account 3
Account Number: XXXXX4086 Account Type: Trusts
PHILLIPS EDISON ARC SHOPPING CNTR REIT 20,000 -- --
Sample Account 3 Total: $20,000 --
Sample Investor 1 Total: $313,804 $5,442
Core Accounts Total: $313,804 $5,442
% OF TOTAL ACCOUNT NAME ESTIMATED ANNUAL YIELD (%) ESTIMATED ANNUAL INCOME ($)CURRENT VALUE ($)TICKER ASSET
As of: 6/7/12
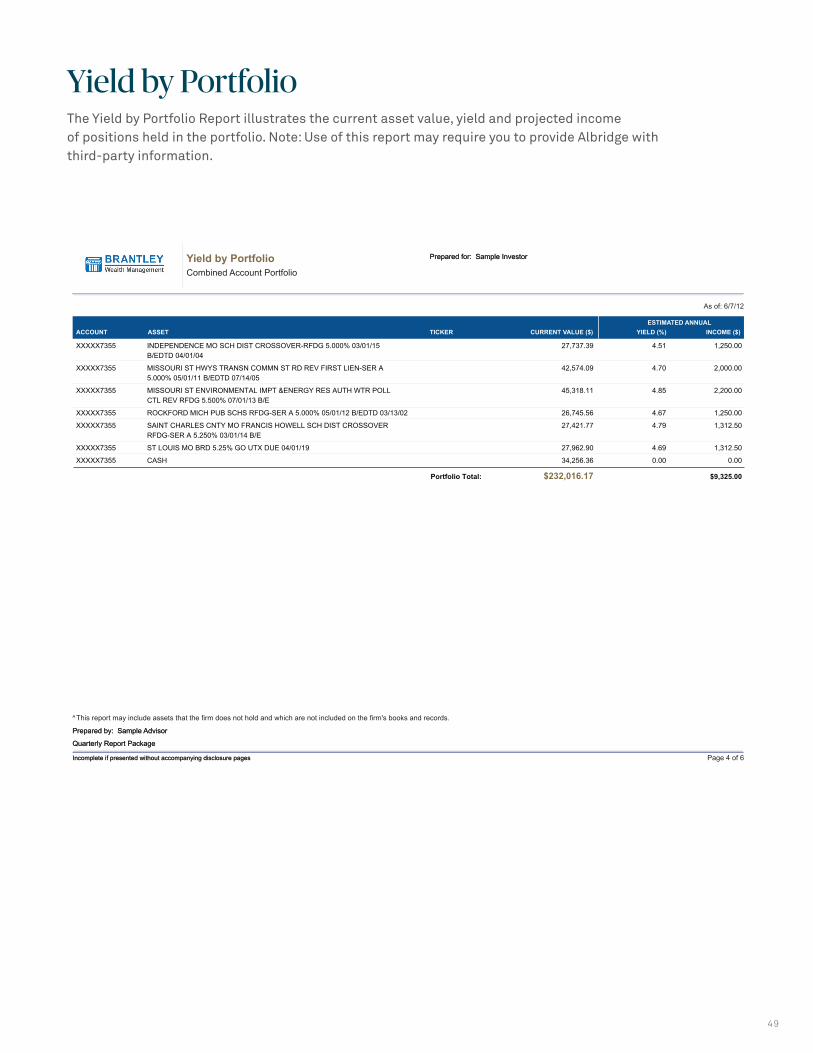
49
Yield by PortfolioThe Yield by Portfolio Report illustrates the current asset value, yield and projected income of positions held in the portfolio. Note: Use of this report may require you to provide Albridge with third-party information.
Quarterly Report Package
Incomplete if presented without accompanying disclosure pages
Prepared for: Sample Investor
Prepared by: Sample Advisor
Page 4 of 6
Not intended for use with the client.
Quarterly Report Package
Incomplete if presented without accompanying disclosure pages
Prepared for: Sample Investor
Prepared by: Sample Advisor
Yield by PortfolioCombined Account Portfolio
As of: 6/7/12
A This report may include assets that the firm does not hold and which are not included on the firm's books and records.
XXXXX7355 INDEPENDENCE MO SCH DIST CROSSOVER-RFDG 5.000% 03/01/15 27,737.39 4.51 1,250.00 B/EDTD 04/01/04
XXXXX7355 MISSOURI ST HWYS TRANSN COMMN ST RD REV FIRST LIEN-SER A 42,574.09 4.70 2,000.00 5.000% 05/01/11 B/EDTD 07/14/05
XXXXX7355 MISSOURI ST ENVIRONMENTAL IMPT &ENERGY RES AUTH WTR POLL 45,318.11 4.85 2,200.00 CTL REV RFDG 5.500% 07/01/13 B/E
XXXXX7355 ROCKFORD MICH PUB SCHS RFDG-SER A 5.000% 05/01/12 B/EDTD 03/13/02 26,745.56 4.67 1,250.00
XXXXX7355 SAINT CHARLES CNTY MO FRANCIS HOWELL SCH DIST CROSSOVER 27,421.77 4.79 1,312.50 RFDG-SER A 5.250% 03/01/14 B/E
XXXXX7355 ST LOUIS MO BRD 5.25% GO UTX DUE 04/01/19 27,962.90 4.69 1,312.50
XXXXX7355 CASH 34,256.36 0.00 0.00
Portfolio Total: $232,016.17 $9,325.00
ACCOUNT ASSET TICKER CURRENT VALUE ($) YIELD (%)ESTIMATED ANNUAL
INCOME ($)

50
Compliance DisclosureCompliance disclosure language can be customized for your firm. If a report has manually entered or external accounts, an additional disclosure is included. In online versions, the disclosure appears near the bottom of the page. On PDF versions, it is the last page of the report. Also, on PDF versions, there is a footer on each page that states the report is, “incomplete if presented without the accompanying disclosure page.”
Lynn C Scardina 89506 Carlin Circle Suite 14 Piedmont, CA 94620
James A Smart Investment Advisors Inc 13508 East 151St Avenue Willard, KY 41181 1(350)235-3875
Combined Account PortfolioDate: 09/30/2009Created: 09/30/2009
Incomplete if presented without accompanying disclosure page Page 1 of 2
Quarterly Performance Report
Disclosure:
Securities and investment advisory services are offered through Brantley Wealth Management Securities LLC.
The following disclosures are applicable to the Performance Report included herein. The strategies and asset classes discussed herein may not be suitable for all investors.
Please note that the Security Performance included within this report is reported gross of fees as described above. The Selected Period within this report reflects the calendar quarter for which this report was run.
This report is for informational purposes only and is not an official account statement. We urge you to compare this Performance Review with the account statements you receive from the custodian of your account assets, Brantley Wealth Management Clearing Corp. In doing so, please remember that in measuring performance in a way that conforms to investment management industry practice, using daily time− weighted rate of return as noted above, your Quarterly Performance Review may differ slightly from your monthly account statement. For example, the Quarterly Performance Review is prepared on a trade date basis, reflecting holdings as of the day transactions are executed, while your monthly statement reports holdings on a settlement date basis, which is typically three business days (or less) after the trade date.
Performance returns reflect a daily time−weighted rate of return. Performance returns are presented net of fees and calculated based upon actual fees paid out of the account. The performance data included herein was derived by geometrically−linking daily returns. Periods greater than one year are annualized.
Net of Fees: If performance is reported net of fees, the results reflect the deduction of the management or advisory fees applicable to the account.
Gross of Fees: If performance is reported gross of fees, the results do not reflect the deduction of the management or advisory fees applicable to the account. However, please note mutual fund performance figures reflect internal mutual fund fees and expenses.
For complete information on any of the funds in your portfolio, including management fees and expenses, please consult the prospectus you received. You should always read the prospectus carefully to obtain the most current and complete redemption fee policy information. Always consider the funds´ investment objectives, risk factors and charges and expenses before investing.
Past performance is not indicative of future results. Asset allocation/diversification does not guarantee a profit or protect against a loss. There may be a potential tax implication with a rebalancing strategy, so please consult your tax advisor before implementing such a strategy. JPMorgan Chase Bank, N.A. and its affiliates do not offer legal, tax or accounting advice. Clients are urged to consult their own legal, tax and accounting advisors with respect to their specific situations.
6 For Portfolio and/or Account Performance , the return cannot be calculated because during the period indicated the account(s) was not open. For Asset Class Performance and/or Security Performance, the return cannot be calculated for periods before the account(s) was open, or for periods before 1/1/2013, whichever is later.
45 The performance prior to 1/1/2013 was calculated using historical monthly performance. Performance for periods after 1/1/2013 w as calculated based on a daily time−weight rate of return.
Indices are unmanaged and intended only to provide a hypothetical representation for use as a benchmark for the portfolio allocation. They were chosen for their general relevance to the asset classes represented and are provided for comparative purposes only. There may be material differences between the historical returns of an index versus those in the actual asset class or classes it represents, based upon the makeup of the actual investment portfolio of the mutual funds, ETFs or SMAs it represents.The performance of an index does not reflect the deduction of fees or expenses that are associated with a mutual fund, ETF, SMA or an advisory account, such as investment management fees. Indices are not actually securities, so you cannot invest directly in an index or achieve its exact portfolio returns. Client accounts may hold far fewer securities which could represent a greater level of volatility and risk than an index.

51
AlbridgeManage Your Business, Not Your Data
Call Us: (877) 252-9963
Email Us: [email protected]
Visit Us: Albridge.com

ABOUT US
Albridge Solutions, Inc. is a leading provider of enterprise data management solutions that deliver a single view of an investor’s broad range of assets. Our proprietary technology consolidates and reconciles client account and transaction data from hundreds of data sources representing banking, brokerage, insurance, retirement, managed accounts and more. Albridge provides the foundation for financial organizations to leverage a single source of information to power a number of mission-critical technology applications. Albridge Solutions, Inc. is an affiliate of Pershing LLC, a BNY Mellon company.
Pershing and its affiliates provide global financial business solutions to advisors, asset managers, broker-dealers, family offices, financial organizations, fund managers and registered investment advisory firms. A financial services market leader located in 23 offices worldwide, we are uniquely positioned to provide advisors and firms global insights into industry trends, regulatory changes and best practices, as well as shifts in investor sentiment and expectations. Pershing provides solutions—including innovative programs and business consulting—that help create a competitive advantage for our clients.
BNY Mellon is a global investments company dedicated to helping its clients manage and service their financial assets throughout the investment lifecycle. Whether providing financial services for institutions, corporations or individual investors, BNY Mellon delivers informed investment management and investment services in 35 countries and more than 100 markets. BNY Mellon can act as a single point of contact for clientslooking to create, trade, hold, manage, service, distribute or restructure investments. BNY Mellon is the corporate brand of The Bank of New York Mellon Corporation.
©2020 Albridge Solutions, Inc. Albridge Solutions, Inc. is an affiliate of Pershing LLC, member FINRA, NYSE, SIPC, a wholly owned subsidiary of The Bank of New York Mellon Corporation (BNY Mellon).
Trademark(s) belong to their respective owners. For professional use only. Not for distribution to the public.
albridge.com
1800 American Boulevard, Suite 300, Pennington, NJ 08534
1155-ALB-CLIENT REPORT GUIDE-04-20