report no. 7438-ph philippines: toward sustaining the...
TRANSCRIPT
Report No. 7438-PH
Philippines: Toward Sustaining the EconomicRecoveryCountry Economic MemorandumJInuary 30,1989
Country Operations DivisionAsia Country Department II
FOR OFFICIAL USE ONLY
Document of the World Bank
This document has a restricted distribution and may be used by recipientsonly in the performance of their official duties. Its contents may not otherwisebe disclosed without World Bank authorization.
Pub
lic D
iscl
osur
e A
utho
rized
Pub
lic D
iscl
osur
e A
utho
rized
Pub
lic D
iscl
osur
e A
utho
rized
Pub
lic D
iscl
osur
e A
utho
rized

CURRENCY EQUIVALENTS
Average 1988 - US$1.0 - 21.1- P1.0 0.047
Average 1987 - US$1.0 = 20.6- P1.0 0.049
Average 1986 - US$1.0 = 20.4- P1.0 - 0.049
Average 1985 - US$1.0 - 18.6- P1.0 0.054
ACRONYMS
APT - Asset Privatization TrustBOI - Board of InvestmentsCB - Central BankCARP - Comprehensive Agarian Reform ProgramCPI - Consumer Price IndexDA - Department of AgricultureDAR - Department of Agarian ReformDBP - Development Bank of the PhilippinesDENR - Department of Environment
DPWH - Department of Public Works and High aysDTI - Department of Trade and IndustryEPR - Effective Protection RateGDP - Gross Domestic ProductGFI - Government Financial Institutiongnfs - Goods and non-factor servicesGNP - Gross National ProduccGRT - Gross Receipts Taxha - hectareHYV - High Yielding VarietiesICOR - Incremental Capital Output RatioIGLF - Industrial Guarantee & Loan FundIMF - International Monetary FundLBP - Land Band of the PhilippinesLIBOR - London Inter-Bank Offer RateMRR - Manila Reference RateMT - metric tonsNEDA - National Economic and Development AuthorityNFA - National Food AuthorityNIA - National Irrigation AdministrationNPA - Non-performing AccountsNPC - National Power CorporationO&M - Operation and MaintenancePCA - Philippine National BankPNOC - Philippine National Oil CompanyWPI - Wholesale Price Index
FOR OFmFCIAL USE ONLY
Preface
This report presents the work of a mission which visited thePhilippines in May/June 1988. The mission members included Norman Hicks(leader), Thanos Catsambas (macro), Zdenek Drabek (industry), Guillermo Hakim(balance of payments), Judy Lu (statistics, projections), Gerry Sicat (publicfinance), and Tom Wiens (agriculture, natural resources). The report wassubsequently updated during a mission which visited the Philippines inNovember/December 1988. In addition, the report draws on recent economic andsector work of other Bank missions, including "Philippines: The Challenge ofPoverty" Report No. 7144-PH (October, 1988), "Transport Sector Review" ReportNo. 7098-PH, (March 1988), "Selected Issues in Public Rescu:ce Management"Report No. 6887-PH (April, 1988), "Financial Sector Study", Report No. 7177-PH(August, 1988), and "Forestry, Fisheries, and Agricultural kes!urce ManagementStudy" Report No. 7388-PH (January 1989).
The mission would like to express its appreciation for the coopera-tion received from various government departments and agencies, including theNational Economic and Development Authority, the Central Bank the Office ofBudget and Management, and the Departments of Trade and Industry, Agricul-ture, Natural Resources, Finance, and Labo,r and Employment.
This document has a restricted distribution and may be used by recipients only in the performance |of their official duties. Its contents may not otherwise be disclosed without World Bank authorization.
Page 1
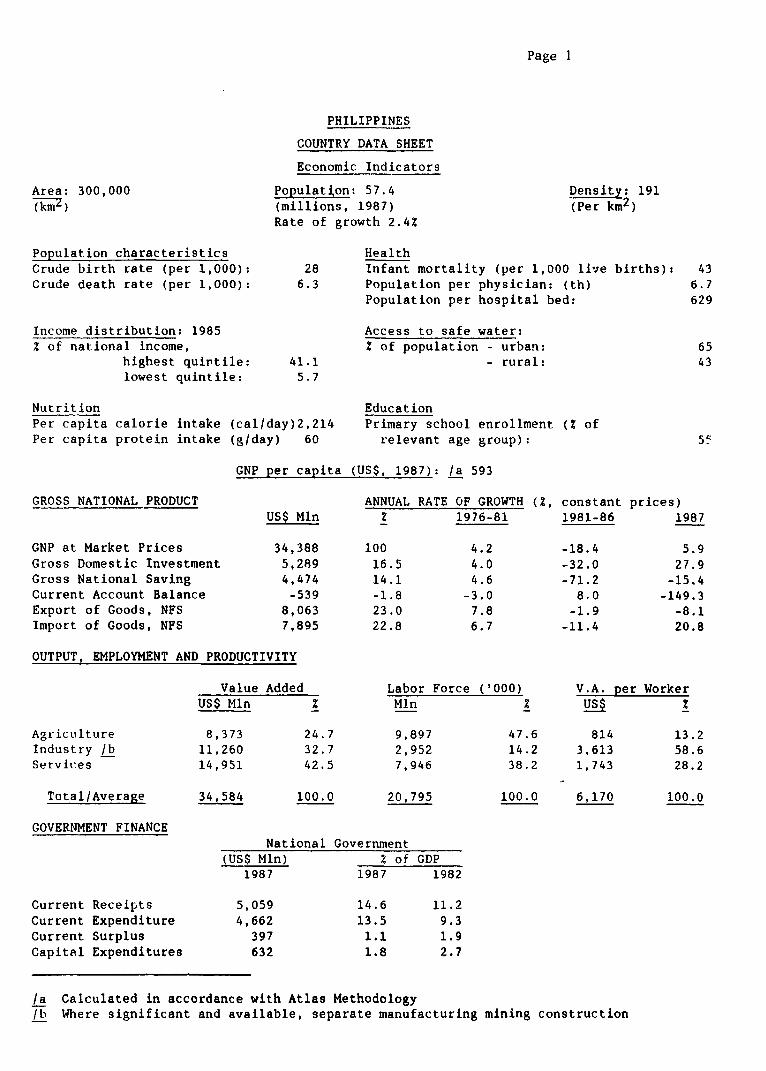
PHILIPPINES
COUNTRY DATA SHEET
Economic Indicators
Area: 300,000 Population: 57.4 Density: 191
(kmZ) (millions, 1987) (Per km2)
Rate of growth 2.4Z
Population characteristics HealthCrude birth rate (per 1,000): 28 Infant mortality (per 1,000 live births): 43
Crude death rate (per 1,000): 6.3 Population per physician: (th) 6.7Population per hospital bed: 629
Income distribution: 1985 Access to safe water:Z of national income, Z of population - urban: 65
highest quintile: 41.1 - rural: 43lowest quintile: 5.7
Nutrition EducationPer capita calorie intake (cal/day)2,214 Primary school enrollment (Z ofPer capita protein intake (g/day) 60 relevant age group): 55
GNP per capita (US$, 1987): /a 593
GROSS NATIONAL PRODUCT ANNUAL RATE OF GROWTH (%, constant prices)US$ Mln Z 1976-81 1981-86 1987
GNP at Market Prices 34,388 100 4.2 -18.4 5.9
Gross Domestic Investment 5,289 16.5 4.0 -32.0 27.9
Gross National Saving 4,474 14.1 4.6 -71.2 -15.4
Current Account Balance -539 -1.8 -3.0 8.0 -149.3
Export of Goods, NFS 8,063 23.0 7.8 -1.9 -8.1
Import of Goods, NFS 7,895 22.8 6.7 -11.4 20.8
OUTPUT, EMPLOYMENT AND PRODUCTIVITY
Value Added Labor Force ('000) V.A. per Worker
US$ Mln Z Mln z US$ z
Agricutlture 8,373 24.7 9,897 47.6 814 13.2
Industry /b 11,260 32.7 2,952 14.2 3,613 58.6
Services 14,951 42.5 7,946 38.2 1,743 28.2
Total/Average 34,584 100.0 20,795 100.0 6,170 100.0
GOVERNMENT FINANCENational Government
CUS$ Mln) % of GDP1987 1987 1982
Current Receipts 5,059 14.6 11.2Current Expenditure 4,662 13.5 9.3
Current Surplus 397 1.1 1.9Capital Expenditures 632 1.8 2.7
/a Calculated in accordance with Atlas Methodology/b Where significant and available, separate manufacturing mining construction
Page 2
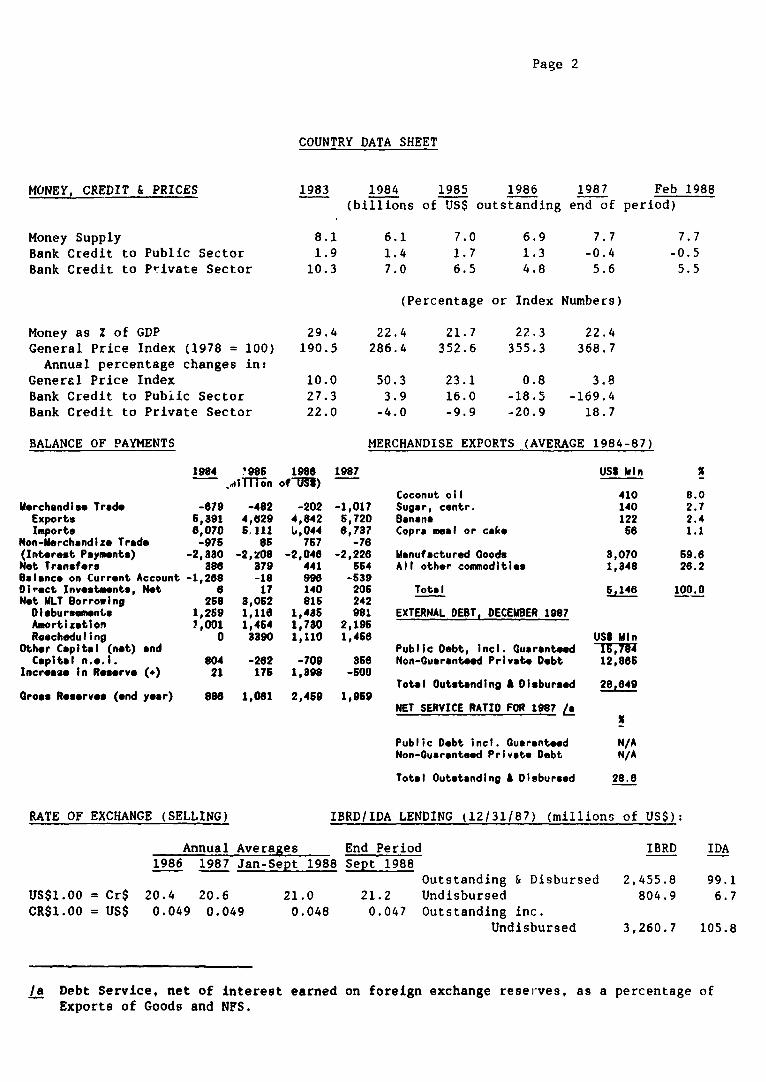
COUNTRY DATA SHEET
MONEY, CREDIT & PRICES 1983 1984 1985 1986 1987 Feb 1988(billions of US$ outstanding end of period)
Money Supply 8.1 6.1 7.0 6.9 7.7 7.7Bank Credit to Public Sector 1.9 1.4 1.7 1.3 -0.4 -0.5Bank Credit to Private Sector 10.3 7.0 6.5 4.8 5.6 5.5
(Percentage or Index Numbers)
Money as Z of GDP 29.4 22.4 21.7 22.3 22.4General Price Index (1978 = 100) 190.5 286.4 352.6 355.3 368.7Annual percentage changes in:
General Price Index 10.0 50.3 23.1 0.8 3.8Bank Credit to Pubiic Sector 27.3 3.9 16.0 -18.5 -169.4Bank Credit to Private Sector 22.0 -4.0 -9.9 -20.9 18.7
BALANCE OF PAYMENTS MERCHANDISE EXPORTS (AVERAGE 1984-87)
1984 1985 1986 1987 USS Pun.,1ilTTin of U-U)
Coconut oil 410 8.0Merchandi.e Trade -679 -482 -202 -1,017 Sugar, centr. 140 2.7Exports 5,391 4,629 4,842 6,720 Banana 122 2.4Imports 6,070 65111 6,044 6,787 Copra meal or cake 66 1.1
Non-Merchandize Trade -976 86 767 -76(Interest Payments) -2,380 -2,Z0O -2,046 -2,228 Manufactured Goods 3,070 59.6Net Transfers asf 379 441 564 All other commodities 1,348 28.2Balance on Current Account -1,268 -18 996 -639Direct Investments, Net 6 17 140 206 Total 6,146 100.0Net MLT Borrowing 268 3,062 815 242Disbursements 1,269 1,118 1,436 981 EXTERNAL DEBT, DECESBER 1987Amortization 1,001 1,464 1,780 2,196Rescheduling 0 8390 1,110 1,468 USt MIn
Other Capital (not) and Public Debt, incl. Guaranteed IK,7IlCapital n.e.i. 804 -262 -709 ase Non-Guaranteed Private Debt 12,886
Increase in Roserve (.) 21 176 1,398 -600Total Outstanding A Disbursed 28,649
Gross R.serves (end year) 886 1,081 2,459 1,959NET SERVICE RATIO FOR 1987 L
Public Debt incl. Guaranteed N/ANon-Guaranteed Private Debt N/A
Total Outstanding A Disbursed 28.8
RATE OF EXCHANGE (SELLING) IBRD/IDA LENDING (12/31/87) (millions of US$):
Annual Averages End Period IBRD IDA1986 1987 Jan-Sept 1988 Sept 1988
Outstanding & Disbursed 2,455.8 99.1US$1.00 = Cr$ 20.4 20.6 21.0 21.2 Undisbursed 804.9 6.7CR$1.00 = US$ 0.049 0.049 0.048 0.047 Outstanding inc.
Undisbursed 3,260.7 105.8
/a Debt Service, net of interest earned on foreign exchange reserves, as a percentage ofExports of Goods and NFS.

PHILIPPINES: TOWARD SUSTAINING THE ECONOMIC RECOVERY
COUNTRY ECONOMIC MEMORANDUM
Table of Contents
Page No.
PREFACE
EXECUTIVE SUMMARY ...................................................... i-xi
INTRODUCTION ........................................................... 1
Chapter I: Recent Performance and Issues in Macro-Management ....... 3A. Recent Economic Performance ................................ 3
Savings and Investment ..................................... 4Monetary Policy and Interest Rates ......................... 6Reserves and the Exchange Rates ............................ 7The Interface Between Monetary and Exchange
Rate Policies ........................................... 8The Banking Sector ......................................... 9
B. Balance of Payments ........................................ 10The Trade Balance .......................................... 11Merchandise Imports ........................................ 12Terms of Trade ............................................. 13The Balance of Payments .................................... 14Debt Relief ................................................ 15Reserves ................................................... 16
Chapter II: The Public Sector ...................................... 18A. Tax and Revenue Effort ..................................... 18
The Tax Reform Package of 1n86-87 .......................... 20B. Public Expenditure ......................................... 22
Expenditures ............................................... 22Public Debt ................................................ 23Personnel Services ......................................... 24Public Investment .......................................... 25Administrative Improvements ................................ 26Future Public Investment ................................... 27Public Non-Financial Corporations .......................... 29The Public Sector Fiscal Deficit ........................... 32Decentralization and Regional Development .................. 33Conclusion ................................................. 34Annex - The Value Added Tax ................................ 35
Chapter III: Growth Debt and Aid Requirements ...................... 40Background ................................................. 40Constraints on Growth ...................................... 40Growth Scenarios ........................................... 41Capital Flows .............................................. 45Alternative Scena-ios ..................................... 46The Debt Problem ........................................... 47Aid Issues ................................................. 49
Chapter IV: Poverty and Unemployment ............................... 52The Nature of Poverty .................... 52The Causes of Poverty .................... ...... 53Income Distribution ........................................ 57Toward a Poverty Alleviation Strategy ...................... 57Annex - Progress in Land Reform ............................ 61
Chapter V: Agricultural and Natural Resources ...................... 64Recent Performance ................ 64Future Prospects ........................................... 68Credit: REform and Rehabilitation ......................... 69Public Services: Decentralization, Reform and
Redeployment ............................................ 71Natural Resource Management ................................ 74
Chapter VI: Issues in the Industrial Sector ........................... 79A. Industry's Competitiveness ................................. 82B. Industrial Policies ........................................ 87
Omnibus Investment Code .................................... 87Development Programs ....................................... 89Restructuring of Private Firms ............................. 91
C. Trade Policies ............................................. 92External Trade Barriers .................................... 98Participation in the Uruguay Round Negotiation ............. 100
Economic Indicators..................................................... 102
Statistical Appendix................................................... 105
Map i
SUMMARY AND CONCLUSIONS
Recent Progress
In recent years, the Philippines has undergone a traumatic adjustmentprocess, which has fundamentally altered many parts of the economy. The patternof development followed prior to 1983 had resulted in an economy with a dis-torted incentive structure, an inefficient pattern of investment, and a heavydependence on foreign resources. As a result, the ecot.viny did not adjust well
to external shocks, and could not sustain the momentum of development.
Since 1983, and particularly since the change of government in early1986, a series of reforms have been undertaken which have eliminated most ofthe major distortions, and reduced the fundamental imbalances in the foreignaccounts. As a result, the exchange rate has been brought more in line withmarket conditions, interest rates are competitively determined, and a largenumber of import restrictions have been eliminated. Monopolistic marketingarrangements for agricultural outputs and inputs have been eliminated, andexport taxes on agricultural goods abolished. The major government banks,which were often a convenient conduit for easy credit to weak projects, have
been restructured and put on a sound financial and managerial basis. Thepublic investment program has been reduced in scope, and refocused on priorityitems in infrastructure and the social sectors. The tax system has beensimplified and made more efficient and equitable.
As a result of these reforms, and of prudent fiscal and monetarymanagement, the economy has staged a remarkable recovery. The growth rate fGDP, which had been negative in 1984 and 1985, reached 4.7% in 1987 despitepoor performance in agriculture. Growth in 1988 is estimated to have been
about to 6.6%. The balance of payments current account has shown only a smalldeficit in 1987, and public sector deficits have been held to about 3-4% ofGNP, compared to 8-9% in the past. Inflation, which hit 50% in 1984, was lessthan 4% in 1987 and while increasing, is still running on the order of 7-9%.In general, the pattern of recovery, and the focus of reform efforts, has beenconsistent with the expectations of previous Bank reports which focused on theneed for a major economic reorientation and recovery.!/
This report provides an update of progress made in the recovery effort
to date on a variety of fronts. Its particular focus is to provide an overviewof the outstanding problems that remain to be tackled, and the requirements forexternal assistance.
Remaining Problems
The Government needs to be given maximum credit for undertaking a
series of politically difficult reforms in recent years. However, despiterecent progress, the economy is still encumbered by many problems that limitthe sustainability of the recovery effort, and prevent the economy from
/ "The Philippines: An Agenda for Adjustment and Growth," Report No. 5258PH (November 1984) and "The Philippines: A Framework for EconomicRecovery," Report No. 6350 PH (November 1986).
- ii -
sustainability of the recovery effort, and prevent the economy from reachingits full potential. The remaining problems go beyond the simple removal ofcontrols and policies that distort factor and commodity prices, or the disman-tling of inefficient or restrictive government entities. The task bei-ore theGovernment is one of reforming basic institutions and structures, and tacklingfundamental problems, some of which have plagued the growth process fordecades.
The overall goal must be to increase the overall efficiency of theeconomy, i.a agriculture, industry and the publi- sectors, while ensuring thatthe benefits from growth are distributed more 1,jitably within the populationand among regions. The distorted price and investment incentives of the pasthave produced an economy marked by a low level of productivity in many sectors.AS the economy expands, new investments will hopefully respond to a morerational set of incentives which should produce a more efficient pattern ofinvestment, and one that provides for greater output and generates moreemployment. Some additional reforms of the incentive system are r.eeded whichwill help this process. At the same time, the Government is faced with majorchallenges of overall macro-economic management, including a growing publicsector deficit, a heavy external debt burden, and the need to keep realinterest rates within tolerable limits. The high levels of poverty,unemployment, and rapid population growth are concrete obstacles to raisingliving levels and achieving social stability.
Thus, the focus of future Government efforts should be on:
- finding ways to improve the external debt position andrestoring creditworthiness;
- increasing the level and productivity of private investment, aswell as the level of domestic savings;
- increasing the efficiency of the public sector, both in terms ofraising revenues and improving its capacity to provide essentialinfrastructure and services;
- addressing in a meaningful way the deep-seated problems ofpoverty, population growth, and unemployment, including thedevelopment of expanded programs for the social sectors, and aneffective program of family planning; and
- improving efficiency in agriculture and indust.y, both to serveas a basis for exports and for increased labor incomes.
These issues are clearly of concern to the Government. The recentlyissued Updated Development Plan places particular emphasis on decentralizationand regionalization efforts as a means of improving local participation andGovernment effectiveness in the implementation of programs. 2/ In addition,much emphasis is given to expanding social sector programs and land reform as ameans of addressing the poverty problem.
2/ National Economic and Development Authority, "Highlights of the UpdatedPhilippine Development Plan, 1988-89", July 1988.
- iii-
Debt and Creditworthiness
The Philippines is one of the world's most heavily indebted developingcountries with a total debt of over $28 billion. The restoration of credit-worthiness remains a critical goal for the future, if sustainable growth is tobe achieved. While past reschedulings have reduced amortization payments inthe immediate future, they do not represent a permanent solution to theproblem. Interest on the external debt will average about $2.6 billion a yearover the next four years, or about 19% of exports of goods and services. Thetotal debt service ratio is projected to be only about 28% over the sameperiod, largely because most of the payments on private and commercial debthave been rescheduled and fall due during the period after 1992. The countrywill not be creditworthy so long as the external debt problem remainsunresolved, and there are requirements for additional reschedulings and newborrowings.
There is no panacea for the debt problem. At best, growth will reducethevelative burden over time. However, there are a number of steps that car,be taken which can move the country toward a solution.
The Exchange Rate. Rapid growth of output and exports will befundamental to both reducing the relative burden of the debt andproviding the foreign exchange for debt service and criticalimport needs for the recovery. The maintenance of a viableexchange rate will be essential to any attempt to accelerateexport growth. In the past year, the Government reduced reservesand tightened monetary policy in order to discourage capital o, t-flows and thereby support the exchange rate. The result has beena dwindling level of reserves and, at times, an overly tightmonetary policy. Foreign exchange reserves of the Central Bankhave dropped to less than two months of imports. The Governmentneeds to build a more adequate level of reserves and ensure thatthe exchange rate remains competitive, in order to avoid under-mining the recovery.
Debt Management. More needs to be done to encourage privatepurchases of debt and transfers to the Philippines, in order totake advantage of the fact that Philippine external debt sells ata discount of 45-50% in the market. The present debt-equityprogram has been limited by the Central Bank because of itsmonetary implications. The Central Bank should investigate theviability of other schemes that could be instrumental in reducingdebt through conversion to some form of domestic financial or realasset, provided the monetary impact can be kept under control.The guidelines for the use of the present debt-equity programshould be clarified.
Investment and Savings
While investment has grown in recent months, the overall investmentrate of the economy is low, about 18% of GNP in 1988. Sustainable real percapita income growth will necessitate an investment rate on the order of 22-25%of GNP, however, even given an improvement in investment efficiency. With a
- iv -
rapidly growing population (2.4% per year), ;2 the need to make up for pastdeclines in per capita consumption, the ability to raise domestic savings islimited. For its part, the public sector tends to run deficits which aregreater than its investment rate, meaning that it is a net dissaver; it isusing private savings to fund public sector investment and part of publicsector consumption. On the other hand, the ability of the private sector tomobilize private savings and direct them through the financial system toinvestors is also weak. The banking L.ector is still recovering from theexcesses and trauma of past events, and remains very cautious. If publicsector deficits remain large, and private sector investment continues to grow,there will be competition for available funds that will cause interest rates torise, limit growth, and crowd out efficient private sector investment. Giventhe current external debt position, however, the country has only limitedaccess to foreign capital to finance investment. For the future, therefore,attention must be paid to certain key areas.
Public Deficit. The public sector deficit must be reduced sothere is a net generation of savings from the public sector. Sinceexpenditures for critical programs will probably have to increase,this means major emphasis must be given to increasing revenues,particularly through improved tax collection and enforcement, andmaking public corporations self-sufficient through better pricingand collection policies.
Long Term Credit. There is a general shortage of long-term creditavailable for industry, particularly for small and medium scalefirms. A strong institution is needed that can tap available lcngterm funds (e.g insurance, social security), and channel these tothe private sector for investment. The Development Bank of thePhilippines has undergone an extensive rehabilitation program andis the most likely candidate for this role. Current programs nowadministered by the Central Bank should be turned over to DBP.
Financial Sector Reforms. A number of taxes and other distortionsthat prevent the financial sector from operating efficiently andtend to reduce savings. The gross receipts tax on banks should beeliminated and restrictions on branch banking relaxed. Interestrates on long term loans from foreign sources need to be set atmarket rates, so that concessional foreign loans do not distortthe structure of local interest rates.
Public Sector Efficiency
Past reforms have made major improvement in public sector effective-ness. A tax reform has unified corporate and personal income taxes, raisedexemption levels to eliminate taxation of the poor, dropped export taxes, andintroduced a value-added tax. As a result of both tax reform and a growth inthe tax base, tax revenues have risen from 10% to 12% of GNP between 1986 and198-/. The introduction of the VAT in 1988 was expected to raise this ratiofurther. However, poor collection and enforcement efforts have resulted in adecline in the tax effort to 11% of GNP. On the expenditure side, maintenanceand operating expenditures have been increased in real terms over the past twoyears, making up for past years of budgetary cuts which had adverse effects on
road maintenance, and the performance of the school and health system.Salaries of government workers have also been increased to compensate for pastinflation. A major effort has Laen made to redesign the public investmentprogram to eliminate projects having low economic rates of return, or which canbe better undertaken by the private sector. A program for the disposal orprivatization of over 200 public corporations has been launched, and improvedcontrols over the remaining public corporations have been established.
Despite progress on many fronts, many problems remain. These particu-larly affect the level and composition of the public investment program, andthe Government'J implementation capacity. While the Government's Medium-TermPublic Investment Program calls for an average rate of public investment of5.5% of GNP, the actual rate in 1987 was about 3.2%. While steps have beentaken to improve budget, contract and auditing processes, and to provide moreoversight of project implementation, there has been little improvement in per-formance. As a result, the Philippines' ability to utilize its pipeline ofofficial aid is also lagging, and there is growing evidence of imbalances incritical infrastructure that coula affect the pace of the recovery. Electricpower consumption is growing quickly, and outpacing the capacity build-up ofthe National Power Corporation. In part, this reflects the decision not tooperate the nuclear power plant, which would have provided a considerable addi-tion to total capacity. There is an urgent need to bolster rural infrastruc-ture which will reduce poverty and help raise agricultural productivity.
An additional constraint is the large size of the domestic debt. Alarge element in government current expenditures constitutes interest paymentson public debt. Because of the liabilities assumed in the restructuring of thetwo large government banks, public sector debt has increased by 40% since 1985,and now represents the equivalent of 107% of GNP. For the national government,interest payments now constitute over 30% of total expenditures. The highlevel of domestic debt makes the coordination of monetary and fiscal policydifficult. A one percent irc:rease in interest rates will produce a 20%increase in the budget deficit of the national government. Since over 60% ofthe public debt is externally held, the budgetary debt service burden is alsoaffected by changes in exchange rates and foreign interest rates.
For the future, the Government will need to focus on a number ofcritical areas which will improve public sector efficiency:
Tax Reform. The existing tax system could generate much more thanits present level of revenue. Rather than increase tax rates,more attention needs to be devoted to increasing compliance andenforcement. Eventually, the tax system should move away from itshigh reliance on indirect taxes on trade and energy products, andto a higher degree cof direct income taxation. The presentbalance, however, reflects the comparatively better collectionperformance of indirect taxes. A movement away from indirecttaxes will also reduce the regressivity of the present system,wherein the poor pay a higher share of their income in taxes thanthe rich.
Public Investment. Ihe current level of public investment is toolow to sustain the recovery. Efforts need to be made to raise the
- vi -
investment rate closer to the Plan target of 5.5% of GNP, byspeeding up the implementation of existing projects and identifi-cation and preparation of new projects. A strong publicinvestment program will be essential for a rapid utilization ofexisting aid commitments.
Operating and Maintenance Expenditures. While O&M have beenincreased in recent years, the present level is still only about85% of the real level of 1982. Increases are particularly neededin the social sectors, to provide reliable and effective programsin health, education and nutritiox.
Public Corporations. The operating efficiency of public corpora-tionts is low in many cases, resulting in high cost public servicesin critical areas (power, water supply). These, in turn, raisecosts and reduce competitiveness of industrial and agriculturaloutput. Further steps need to be taken to improve collectionperformance, reduce technical losses, and restructure prices toeliminate cross-subsidies and other distortions.
Decentralization. Efforts have been made to decentralize centralgovernment functions to the regions, in an attempt to make govern-ment more responsive to local needs, and to increase the power ofthe regions over the planning and control of programs. Controlover most resources still rests with the center, however, andlittle effective power has devolved to the regions. While theGovernment needs to move forward with its decentralization/regionalization efforts, progress may be limited by the ability ofmany local governments to assume greater responsibility. Programsneed to be developed that build staff administrative capacity atthe local level, and improve local tax collection efforts.
Poverty and Unemplovment3/
The Philippines continues to be a country with a substantial amount ofpoverty, and high levels of under- and unemployment. At the same time, popula-tion growth remains high (2.4% per year). As the population grows, the pres-sure on rural land mounts, and poor farm families migrate to new upland loca-tions or to the cities, in an attempt to find more remunerative occupations.The result is both a rising level of underemployment in urban centers, and adeterioration of upland forests, as migrants settle land unsuitable for conven-tional farming techniques. The failure of modern sector employment to grow inrecent years reflects the bias of the past incentive system which favoredcapital-intensive, import substituting industries, and the general slow growthof the economy in recent years.
While estimates of poverty are necessarily fragile, in general about52% of all families in the Philippines were classified as "poor" in 1985. Thisis about the same level as that prevailing in 1971. During the interveningyears, it appears that poverty was reduced during the high growth years of the
3/ A fuller treatment of this subject is contained in "Philippines: TheChallenge of Poverty." Report No. 7144-PH (September 1988).
- vii -
1970s, but then increased during the recession and adjustment years up to 1985.Income distribution remains highly skewed; the top 10% of the population has anaverage income 15 times that of the lower 10%. On top of this, there has beena very rapid growth of the labor force. Since 1980, the labor force has grownat an average rate of 4.5% per year. The result has been downward pressure onreal wages and a falling level of output per worker.
While growth is necessary to provide the economic progress so essen-tial to maintaining stability, it is not by itself sufficient. The structureof growth must be oriented to reducing poverty and increasing employment; thebenefits of growth must be spread widely through the population and geograph-ically throughout the country. While reducing poverty is a long term goal, abeginning must be made as soon as possible. Areas of focus include:
Land Reform. Land reform is a high priority, because of itsequity and social stability effects. The recently signed Compre-hensive Agrarian Reform Program (CARP) extends the existing landreform program to crops other than rice and corn, which werecovered under the 1972 legislation. The Government has alreadybegun to expedite transfers in rice and corn areas; it needs tomove faster on other categories of land, including lands whichhave been taken over by foreclose and abandonment, and publiclands in upland areas. The new legislation holds out the promiseof a major change in economic relationships in tha countryside.The Government needs to move quickly to organize itself to carryout the program, which is a massive undertaking.
Pogulation/Family Planning. Rapid growth of population is clearlyoutstripping the country's natural resource base and ability toprovide productive employment. Poor families lack access tofamily planning services, and have higher fertility rates than thegeneral population. Existing programs in family planning need tobe expanded, the level of expenditures significantly increased,and the delivery of services made more effective, and integratedwith health care and nutrition services.
Rural Development. The infrastructure needs in the rural areasshould be expanded. Of particular importance are the developmentof rural roads, rural electrification, and agricultural credit andextension services that reach poor and smaller farmers.
Social Services. Programs in the social sectors need to beaugmented, made more effective and targetted on the poor, andhigh-risk groups within the poor. Health care particularly needsto be expanded in rural areas, integrated with nutrition services,and emphasize preventative as well as curative care. Feestructures need to be adjusted so that the non-poor pay themarginal cost of providing services, reducing the overall cost ofthe program and permitting free services for the poor. In educa-tion, the quality of education in poor and rural areas is low, anddropout rates are high. Steps need to be taken to increase expen-ditures for supplies and teacher training in schools in poor andrural areas.
- viii -
Agriculture
Since 1980, there has been a genieral decline in the growth of agricul-tural productivity. The fertilizer-seed-irrigation technology innovations ofthe 1970s allowed for a rapid growth in rice and corn output. By 1982, thegains from this technology began to be exhausted, and since then total agricul-tural growth has averaged only 1.8% per year, less than population growth.Part of this low growth was due to very adverse weather conditions. However,yields in traditional crops remain low even with good weather, and there is aneed to diversify wherever profitable into minor crops that have betterprospects. In the past few years, the growth of crops such as shrimp andprawns, bananas, coffee, rubber and vegetables has been strong. Governmentresearch efforts, however, have largely concentrated on traditional crops,particularly rice. Another factor affecting farmer productivity is the shortageof agricultural credit, particularly for small farmers. The formal marketsupplies only about one third of the credit needs of the sector, with the restcoming from the informal system (commercial middlemen, landlords, friends,moneylenders). Poor farmers generally lack access to any kind of credit,particularly if they do not have title to their land.
Agricultural productivity is also affected by the gradual deteriora-tion of soil and forest resources, as a result of rapid population growth inupland areas, and weak public sector management. Shifting cultivation inupland areas and poor soil management techniques leads to erosion which reducesfarm productivity and causes siltation of streams, rivers and coral reefs,which also affects the productivity of coastal fishermen. Poor management offorest resources has resulted in over extraction of prime species withoutadequate replanting for future production.
During the past year, the Government has made a major effort to reor-ganize and decentralize agricultural services. Nevertheless, governmentservices remain fragmented over a variety of organizations, many of which donot come under the Department of Agriculture. In addition, government servicestend to be stronger in the lowland areas, and very sparse in upland areasinhabited by the poorer farmers. For the future, programs in agriculture willneed to focus on:
Agricultural Credit. The Government is presently engaged in aprogram to revitalize the rural banking system, which will helpraise the level of formal credit in the sector. There are anumber of regulatory steps that need to be taken to induce morecompetition in rural credit. These include the elimination of therequirement that rural banks retain 75% of their deposits in thearea received; the elimination of the required lending foragriculture and agrarian reform (Agri/Agra); and a more liberalpolicy allowing branch banking in rural areas.
Research! Extension. There is a general need to diversify theresearch effort, and to strengthen the extension service. Whilethe existing service is large relative to the farm population, itis relatively ineffective. The Government needs Lo raise salariesof extension workers, increase limited operating funds, increasetraining of extension workers and establish clear priorities fortheir work.
- ix -
Resource Management. The Government needs to intensify itsmanagement of protected areas; parks, watersheds, wildernessareas, etc. For the rest, incentives should be put in place forbetter local and/or private management. This would includeproviding secure tenure for upland farmers in the form of titleswith conservation-oriented land use restrictions, recognizingcollective land tenure rights, and the organization of commonproperty management schemes at the community level. A majordistortion that should be corrected ic the low prices set by theGovernment for resource extraction, particularly timber. Loggingconcessionaires now pay about 50% of potential economic rent infees, and formerly paid only 10%. Fees based on total volumeremoved also contributes to selective cutting of high valuespecies and large amounts of waste left on the forest floor.
Industry
Rapid growth in the industrial sector is essential for substantialgrowth in the economy, and significant urban employment creation. ThePhilippiiLes is well-positioned to begin a period of significant industrialgrowth for a number oL reasons. It has a large, well-educated and skilledEnglish-speaking labor force, and a large group of modern entrepreneurs whichcan organize and manage industrial activities. Wages are relatively lowcompared to other East Asian countries, and labor-intensive industries movingfrom Japan and other countries should find the Philippines an attractive alter-native. Recent Government actions have liberalized trade, and reducedGovernment interventions in the sector. A new Omnibus Investment Code hasclarified the system of incentives, which are comparable to those of otherASEAN countries. The tax reform has lowered the corporate tax rate to 35%,which is also on a par with other countries. Labor productivity, however, isalso low which offsets the advantages of low wages. Past investments wereoften undertaken under a regime of high protection, and are consequently not ata scale that can compete internationally. In addition, the lack of new invest-ment in recent years means that much of existing industrial capacity is tech-nologically out of date and needs to be replaced. Industrial restructuring isalso needed because of financial reasons; firms often carry an excessive levelof debt which makes it impossible to borrow for productivity enhancing improve-ments. Industrial efficiency is also limited by weak infrastructure, and inef-ficiencies in the delivery of public and publicly regulated services, includingwater, power an' telecommunications. The key areas for improvement are:
Infrastructure. Shortages of power are becoming a major impedi-ment to rapid industrial growth. In addition, electricity pricestend to be extremely high compared with other countries. In partthis is due to system inefficiencies and a policy of cross-subsi-dization which provides households with electricity below cost, atthe expense of industrial users. High distribution losses, and
low collection rates, also add to the costs of paying customers.The Government needs to move ahead with its plans to revise powertariffs and to improve the operating efficiencies of the NationalPower Corporation and Meralco. More investment should be madefor supporting infrastructure, particularly in rural areas. Thisincludes particularly reliable power supplies, adequate road and
- x -
port infrastructure. Deregulation of inter-island shipping, andrationalization of port charges, should be undertaken in order toreduce shipping costs internally.
Trade Policy. Significant progress has been made in recent yearsin reducing the level of quantitative import restrictions. Thisprocess needs to be sustained, and combined with a review oftariff protection. The remaining quantitative restrictions shouldbe removed and replaced by tariffs, which would give theGovernment the revenue benefits of protection. In general, thereshould be an attempt to make effective protection more evenbetween industries. However, future trade reforms need to beconsidered within a program of industrial restructuring thatconsiders all the problems facing the industry, and providesadequate time for industries to undertake necessary adjustments.
Foreign Investment. For foreign investors, the new OmnibusInvestment Code provides a system of incentives which are compar-able to other ASEAN countries. However, the requirement that non-export industries can only be 40% foreign owned is more restric-tive than requirements in other countries, and discourages invest-ment in many sectors. This limit should be raised to allow major-ity control with gradual reduction over time to minority control.The existing debt-equity conversion scheme was designed to attractforeign investment, but the need to limit monetary expansion hasforced the Central Bank to impose administrative restrictions onits use. The present arrangement, therefore, actually impedesprivate investment, since investors queue up, hoping to transferinvestment funds through the scheme rather than proceeding withtheir projects. The operation of the scheme should be made moretransparent and procedures for its use clarified, so that it doesnot become a disincentive to investors.
Growth Prospects and Aid Reguirements
The Bank's projection of future growth is based on an assumption of acontinuation of good policy performance, and assumes an average growth rate of5.9% per annum during the 1988-92 period, based on a 3.5% growth rate foragriculture and 8% for industry. Under these assumptions, the average invest-ment rate would be about 22%, and the current account deficit would average2.8% of GNP. By comparison, the Government's revised plan calls for an averagegrowth rate of 6.5%, an investment rate of 21%, and a current account deficitequal to 2.6% of GNP for the same period.
Under the Bank's projection, the total external debt would rise from$29 billion at the end of 1988 to $34 billion by the end of 1992, but relativegrowth of the debt would be less than GNP growth. Thus, the ratio of debt toGNP would fall from 71% in 1988 to 56% by the end of 1992, and the debt serviceratio would average 28% during the period. The projection assumes, however, alevel of capital inflow from official source of about $1.5 billion per yearduring the period. At this level, there remains a gap to be filled by newmoney from official and private sources of $4.1 billion, or about $1.0 billionper year. Without this additional inflow, it is estimated that the growth rate
- xi -
of the economy would fall from the original estimate of 5.9% to an average ofabout 4%. Because domestic savings would have to increase to finance invest-ment requirements, there would be little scope for consumption increase, and inper capita terms consumption levels would fall.
Conclusion
The Philippines has made considerable progress in recent years inrestructuring its economy and eliminating distortions and abuses. Among thehighly indebted countries, its record is one of the best. The Governmentshould be given full credit for undertaking many difficult reforms. Despitethe considerable progress made so far, there remain many impediments tosustained, long term growth. The external debt burden represents a continuingproblem and a significant drag on the economy. Inefficiencies in industry andagriculture lower output potential, worker productivity and growth. Povertyand unemployment remain critical problems. Public sector revenue performanceis problematic, and as result, the public sector is unable to provide adequateservices to support the recovery or address the poverty problem. It iscritical, therefore, that the Government move forward with a new agenda ofreforms that deals with fundamental structural and institutional issues thataffect the overall efficiency of the economy. At the same time, it must resistpressures to backslide on actions already taken to reduce trade and pricedistortions. Future growth will be sustainable only if it is based on anefficient use of resources, and provides for an equitable distribution ofbenefits within the country.
- 1 -
PHILIPPINES
COUNTRY ECONOMIC MEMORANDUM: TOWARD SUSTAINING THE ECONOMIC RECOVERY
Introduction
1. The Philippines has experienced a remarkable turnaround in economicperformance during the past two years. After a period of declining outputduring 1983-85, output grew by 5Z in 1987, and by over 6Z in 1988.Furthermore, there has been a fundamental restructuring of many institutionsand removal of distortions which limited growth in the past. It seemspossible that the Philippines is on the verge of a period of rapid andsustained growth, based on an economy that has undergone some fundamentalrestructuring during the past few years.
2. Since February, 1986, an impressive number of reforms which have beenput in place, which when combined with those undertaken since 1983, provide anew orientation to the economy. These reforms have reduced or eliminated anumber of distortions in commodity and factor markets, and/or reduced thelevel of public sector control over the economy. Specifically.
- a major tax reform has been introduced, including a value-added tax;- monopolistic marketing arrangements have been eliminated for coconut
products and sugar;- import controls have been reduced or eliminated on a wide variety of
industrial raw materials and capital goods;- price controls and export taxes on agricultural products have been
eliminated;- the two largest government financial institutions, which were
previously bankrupt, have been reorganized, restructured, and reducedin scope;
- the exchange rate remains determined by market conditions, anreflects the opportunity cost of foreign exchange;
- interest rates are market determined;- the public investment program has been restructured, reduced in
scope, and focused on high priority projects designed to provideessential infrastructure;
- a significant number of assets taken over from the two banks havebeen sold, as have a number of taken-over commercial banks;
- the Government has commenced a program for the privatization of over100 public corporations, and has created mechanisms to bring theremaining under better control.
3. These structural changes in the economy have contributed to the paceof economic recovery by reducing price and resource distortions, lowering thegovernment budget deficit, and eliminating much unnecessary governmentintervention in the economy. While much has been done, there remain severalimportant issues yet to be tackled. The issue is not entirely one of "gettingthe prices right," although there are still a number of items that should beaddressed in this area, including further reforms of the trade system andagriculture. With the current system of incentives there is every reason to
- 2-
believe that future growth will be more export-oriented, more labor-intensiveand more efficient than the past. The Government must guard against back-tracking on past reforms, including giving in to special interests that seekprotective barriers, subsidized credit, or the reestablishment of monopolistictrading positions.
4. Overall, the focus must now shift to issues of the management ofeconomy. With adjustment by and large accor ished, attention should shiftfrom short term adjustment policies to the deep-seated structural issues thatare more complex and difficult to resolve.
S. Of prime importance is the issue of general macro-economicmanagement, to insure that the recovery continues into the future at a stablepace, without the recurrence of excessive inflation. Restoring productivegrowth in agriculture and industry remains a substantial challenge. The issueof the outstanding debt, and the need to have adequate access to foreigncredits will continue to be an issue for some time. Finally, the longer-termissues of poverty, population growth and unemployment continue to plague theeconomy, and must be resolved if growti is to be achieved without beingarrested by social and political instability.
6. While the government remains the focal point of actions that willshape future growth, it faces serious impediments. As a new democracy, thereare the inevitable growing pains associated wit1a executive-legislative branchtussles and inter-departmental frictions. What makes these activities socostly, is the absolute necessity for the Philippines to make up lost ground.In this context, lapses between intentions and plans on the one hand andactual implementation on the other are an important issue, impinging on suchdiverse activities as tax collection, investment plans, or industrialregulation. In part, the Government has already recognized these problems andis taking steps. Recent actions to raise government wages and salaries willimprove the level of the civil service, even though they merely restore realwages to 1987 levels. Plans are being made to decentralize Governmentprograms to the regions, in order to make Government more responsive to localneeds. The Updated Plan emphasizes the decentralization of budgetaryfunctions to local government units, and the increased participation of localunits in the implementation of programs and policies. Nevertheless, the issueremains serious, particularly since there is a danger of raising falseexpectations if the Government cannot deliver on announced programs andpolicies.
7. This report is designed to provide a review of the economic recoveryas well as the longer term structural problems that remain. The first threechapters discuss current issues in resource management and monetary policies,public finance, the balance of payments, growth prospects and aidrequirements. The balance of the report looks at the longer-term structuralissues in industry and agriculture, along with the issues in poverty,employment and natural resource management.
CHAPTER I
Recent Performance and Issues in Macro-management
A. Recent Economic Performance
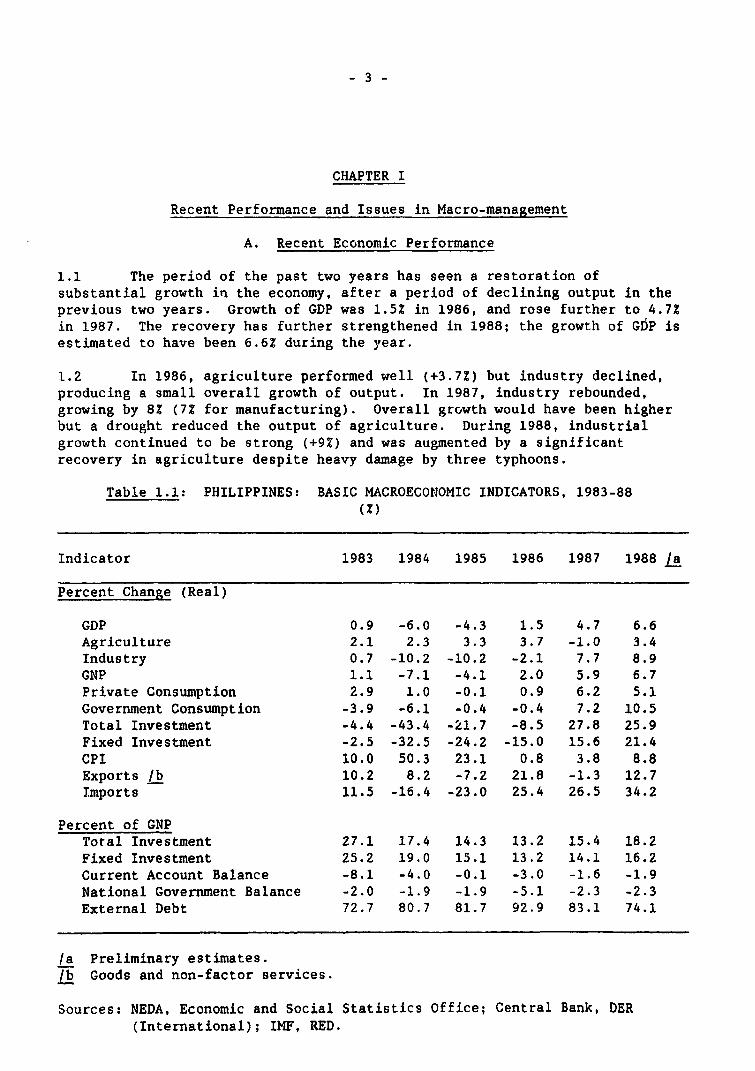
1.1 The period of the past two years has seen a restoration ofsubstantial growth in the economy, after a period of declining output in theprevious two years. Growth of GDP was 1.52 in 1986, and rose further to 4.7Zin 1987. The recovery has further strengthened in 1988; the growth of GDP isestimated to have been 6.6Z during the year.
1.2 In 1986, agriculture performed well (+3.7Z) but industry declined,producing a small overall growth of output. In 1987, industry rebounded,growing by 8Z (72 for manufacturing). Overall growth would have been higherbut a drought reduced the output of agriculture. During 1988, industrialgrowth continued to be strong (+9Z) and was augmented by a significantrecovery in agriculture despite heavy damage by three typhoons.
Table 1.1: PHILIPPINES: BASIC MACROECONOMIC INDICATORS, 1983-88(Z)
Indicator 1983 1984 1985 1986 1987 1988 /a
Percent Change (Real)
GDP 0.9 -6.0 -4.3 1.5 4.7 6.6Agriculture 2.1 2.3 3.3 3.7 -1.0 3.4Industry 0.7 -10.2 -10.2 -2.1 7.7 8.9GNP 1.1 -7.1 -4.1 2.0 5.9 6.7Private Consumption 2.9 1.0 -0.1 0.9 6.2 5.1Government Consumption -3.9 -6.1 -0.4 -0.4 7.2 10.5Total Investment -4.4 -43.4 -21.7 -8.5 27.8 25.9Fixed Investment -2.5 -32.5 -24.2 -15.0 15.6 21.4CPI 10.0 50.3 23.1 0.8 3.8 8.8Exports lb 10.2 8.2 -7.2 21.8 -1.3 12.7Imports 11.5 -16.4 -23.0 25.4 26.5 34.2
Percent of GNPTotal Investment 27.1 17.4 14.3 13.2 15.4 18.2Fixed Investment 25.2 19.0 15.1 13.2 14.1 16.2Current Account Balance -8.1 -4.0 -0.1 -3.0 -1.6 -1.9National Government Balance -2.0 -1.9 -1.9 -5.1 -2.3 -2.3External Debt 72.7 80.7 81.7 92.9 83.1 74.1
/a Preliminary estimates.lb Goods and non-factor services.
Sources: NEDA, Economic and Social Statistics Office; Central Bank, DER(International); IMF, RED.
-4-
1.3 During the period, tight monetary and fiscal policies, and decliningoil prices, have helped keep inflation under control. Consumer pricesincreased on average only .8X in 1986 and 3.8Z In 1987. During 1988 the ratehas accelerated somewhat to about 9Z, although this may reflect such factorsas the introduction of the value added tax in January 1988, and the drought in1987 which raised prices of agricultural commodities. Another factor has beenthe increases required in government wages in 1987 and 1988 to offset theerosion caused by inflation in the past, and to make public sector wagescompetitive with the private sector. In addition, minimum wage levels for theprivate sector were raised by about 18% in December 1987, although it is notclear how much this affected overall wage levels.
1.4 While the recovery has been characterized as "consumption led," infact investment growth has been strong, and more rapid than consumptiongrowth. Private consumption increased by 6% in 1987 and an estimated 5% in1988. Public consumption rose even faster, growing at 72 and 11% in 1987 and1988, respectively. This rapid growth reflects increased public sector wagesas well as greater allocations for necessary operating and maintenanceexpenditures. Investment, on the other hand, rose by 28% in 1987 and 26% in1988. Nevertheless, investment remains low; fixed investment was 15% of GNPin 1987 and 18% in 1988. The low levels of current investment reflect boththe decline in aggregate demand in recent years, and the accumulation of astock of existing capital, much of which is underutilized. With excesscapacity in many industries, it is logical that investment will remain lowuntil excess capacity is eliminated. Those industries, such as foodprocessing, which suffered least during the recent recession, are already ator over full capacity and are undertaking new investments. The fact that thePhilippines can grow with a low level of investment allows this growth to betranslated into increased consumption levels. Even with this recovery,however, per capita personal consumption in 1987 in real terms was 3% lowerthan it was in 1983. Translated using current exchange rates, per capitaconsumption is about $435 per person per year.
Savings and Investment
1.5 While the country has enjoyed rapid growth despite low investmentrates, once excess capacities are fully exhausted it will be necessary toraise the investment rate to a level sufficient to maintain the planned rateof growth. To sustain future growth of 6% will require an overall investmentrate of 22-25% of GNP. To raise the overall investment rate to this level,however, will require a substantial increase in domestic savings, since only asmall part of this investment could be expected to be financed through thebalance of payments.

- 5 -
Table 1.2: SAVINGS AND INVESTMENT, 1983-88(Z of GNP)
19881983 1984 1985 1986 1987 (est.)
National GovernmentSavings 0.5 -0.8 -0.3 -3.2 -1.0 -1.3Investment 2.5 1.1 1.5 1.9 1.8 1.8Net Balance -2.0 -1.9 -1.9 -5.1 -2.8 -3.1
Corporations /aSavings -0.9 0.9 0.6 0.0 0.7 0.7Investment 3.3 3.0 1.9 1.1 1.2 1.3Net Balance -4.2 -2 1 -1.3 -1.1 -0.5 -0.6
Total Public Sector /bSavings -2.8 -3.7 -2.2 -2.5 0.4 -1.3Investment 6.2 4.5 3.7 3.1 3.2 3.2Net Balance -9.0 -8.2 -5.9 -5.4" -2.8 '-4.5
Private SectorSavings 19.9 18.8 17.2 18.2 13.4 17.6Investment 19.0 14.6 11.4 9.8 12.2 15.0Net Balance 0.9 4.2 5.8 8.4 1.2 2.6
Current Account Balance -8.1 -4.0 -0.1 <.0 -1.6 -1.9
/a Covers 14 major public sector corporations./b Includes local governments, social security, and government financial
institutions, including the Central Bank.
Source: NEDA, Central Bank and staff estimates.
1.6 Raising the savings rate may be difficult, particularly in light ofthe need to undo past declines in private consumption and provide for somereal improvement in living levels. In the past, and despite the recession,the private sector has had a substantial savings rate. During the 1983-87period, private sector savings averaged about 17.5% of GNP (see Table 1.2).The public sector, however, was a net dissaver, with an average rate of -6.32.At the same time, public sectcr investment averaged only 4.1Z of GNP, so thatthe public sector was tapping private savings to finance public consumption.Preliminary estimates indicate that these trends continued into 1988, withprivate savings rising to 17.6% of GNP, but private investment equal to only15Z. This strategy may have made sense during the recession years, whenagareaate demand was falling, the private sector was reluctant to invest, anda pubiic sector stimulus was LequiEed. With the reLovery now in progress,however, there will be substantial competition between the public and pri7atesectors for investment funds. Unless the public sector does a better job of

- 6 -
mobilizing its own resources the competition for investible funds will resultin high interest rates, a crowding out of the private sector, and a constrainton future private sector investments.
1.7 In fact, between 1983 and 1987 there has been substantial progress inreducing the overall public sector deficit from 9Z of GNP to 3.22; in 1987 thedeficit was smaller than public sector investment for the first time in fouryears. The major factor behind the smaller deficit was a substantial increasein the tax ratio and lower than planned investment expenditures. The taxeffort in 1987 rose nearly 2 percentage points to 12.2Z of GNP as a result ofbcth the 1986 tax reform package and an expansion of the tax base, particu-larly imports. In 1988, however, the public sector deficit appears to haverisen to 4.5? of GNP, and the tax effort declined to 11? of GNP.
Monetary Policy and Interest Rates
1.8 Monetary policy has been conducted cautiously, with the money supply(M3) growing by 12? in both 1986 and 1987. Political uncertainties andinstability have made monetary management difficult in recent years. Thesefactors have resulted in the public preferring to hold cash and governmentsecurities to bank deposits. Thus, the currency-deposit ratio at the end of1987 reached a historical high level of 272 (see Table 1.3). The presentincrease in inflationary pressures may reflect a return to more normal condi-tions, and an attempt by the public to decrease cash holdings. InOctober 1986, the monetary authorities suspended the sale of new central bankbills and the National Government deficit was covered by issuing treasurysecurities. The emergence of these close substitutes for quasi-money holdingsis related to the relatively slow rate of growth of deposits (9.92 in 1987),as government securities substitute for bank deposits.
Table 1.3: MONEY SUPPLY AND INTEREST RATES
1983 1984 1985 1986 1987 1988(Sept.)
Money Supply (P Billion)M3 113.0 121.2 132.9 149.3 167.3 184.8Currency 19.6 21.8 24.1 29.3 35.4 31.8Deposits 93.4 99.4 108.8 120.0 1 1.9 153.1
Currency-Deposit Ratio (Z) 21.0 21.9 22.2 24.4 27.0 20.8
Interest Rates (2)Time deposits 15.3 24.2 21.8 14.8 9.8 13.2 /aAverage lending rate 19.3 26.7 28.2 17.3 13.3 15.8 /a91-day treasury bills 14.2 40.9 26.2 16.3 11.4 15.7 /a
Inflation 10.0 50.3 23.1 0.8 3.8 8.8
/a December 1988.
Source: Philippine authorities.
1.9 There has been an overall trend to bring interest rates down in thepast three years, from the very high levels reached during 1984. Thus, the 91day Treaeury bill rate has dropped from an average of 412 during 1984 to 11.42in 1987. In real terms, however, interest rates have actually risen, sinceinflation rates exceeded interest rates during 1984. Real rates were particu-larly high in 1986, when inflation rates dropped swiftly and nominal lendingrates remained high. In 1988, however, while nominal rates have risen, realrates have declined. The prevalence of high real interest rates reflects manyfactors, including the large stock of government debt within the system.
Reserves and the Exchango Rate
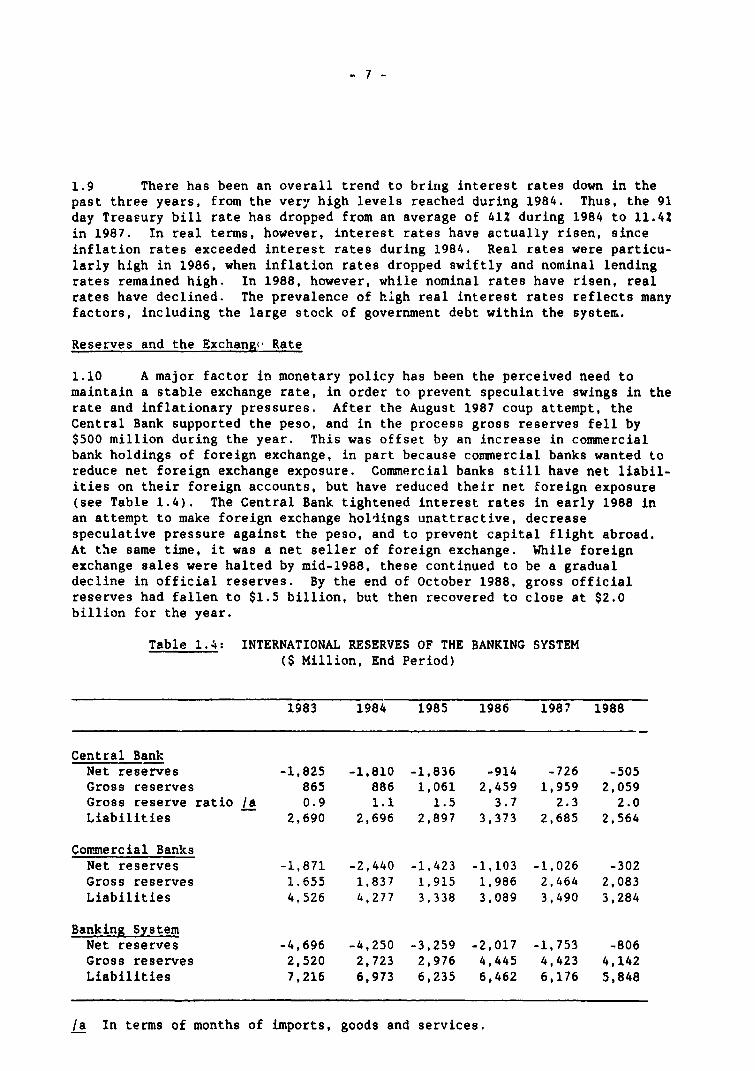
1.10 A major factor in monetary policy has been the perceived need tomaintain a stable exchange rate, in order to prevent speculative swings in therate and inflationary pressures. After the August 1987 coup attempt, theCentral Bank supported the peso, and in the process gross reserves fell by$500 million during the year. This was offset by an increase in commercialbank holdings of foreign exchange, in part because commercial banks wanted toreduce net foreign exchange exposure. Commercial banks still have net liabil-ities on their foreign accounts, but have reduced their net foreign exposure(see Table 1.4). The Central Bank tightened interest rates in early 1988 inan attempt to make foreign exchange holdings unattractive, decreasespeculative pressure against the peso, and to prevent capital flight abroad.At the same time, it was a net seller of foreign exchange. While foreignexchange sales were halted by mid-1988, these continued to be a gradualdecline in official reserves. By the end of October 1988, gross officialreserves had fallen to $1.5 billion, but then recovered to close at $2.0billion for the year.
Table 1.4: INTERNATIONAL RESERVES OF THE BANKING SYSTEM($ Million, End Period)
1983 1984 1985 1986 198' 1988
Central BankNet reserves -1,825 -1,810 -1,836 -914 -726 -505Gross reserves 865 886 1,061 2,459 1,959 2,059Gross reserve ratio /a 0.9 1.1 1.5 3.7 2.3 2.0Liabilities 2,690 2,696 2,897 3,373 2,685 2,564
Commercial BanksNet reserves -1,871 -2,440 -1,423 -1,103 -1,026 -302Gross reserves 1.655 1,837 1,915 1,986 2,464 2,083Liabilities 4,526 4,277 3,338 3,089 3,490 3,284
Banking SystemNet reserves -4,696 -4,250 -3,259 -2,017 -1,753 -806Gross reserves 2,520 2,723 2,976 4,445 4,423 4,142Liabilities 7,216 6,973 6,235 6,462 6,176 5,848
/a In terms of months of imports, goods and services.
- 8 -
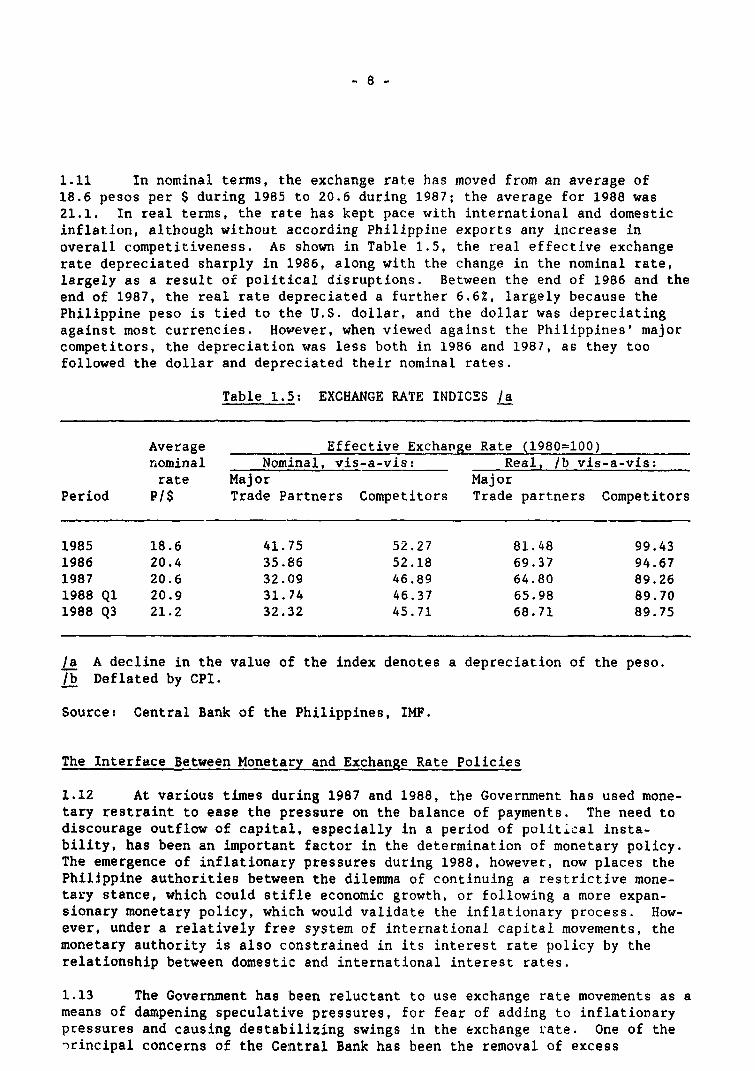
1.11 In nominal terms, the exchange rate has moved from an average of18.6 pesos per $ during 1985 to 20.6 during 1987; the average for 1988 was21.1. In real terms, the rate has kept pace with international and domesticinflation, although without according Philippine exports any increase inoverall competitiveness. As shown in Table 1.5, the real effective exchangerate depreciated sharply in 1986, along with the change in the nominal rate,largely as a result of political disruptions. Between the end of 1986 and theend of 1987, the real rate depreciated a further 6.6Z, largely because thePhilippine peso is tied to the U.S. dollar, and the dollar was depreciatingagainst most currencies. However, when viewed against the Philippines' majorcompetitors, the depreciation was less both in 1986 and 1987, as they toofollowed the dollar and depreciated their nominal rates.
Table 1.5: EXCHANGE RATE INDICES /a
Average Effective Exchange Rate (1980=100)nominal Nominal, vis-a-vis: Real, /b vis-a-vis:rate Major Major
Period P/$ Trade Partners Competitors Trade partners Competitors
1985 18.6 41.75 52.27 81.48 99.431986 20.4 35.86 52.18 69.37 94.671987 20.6 32.09 46.89 64.80 89.261988 Ql 20.9 31.74 46.37 65.98 89.701988 Q3 21.2 32.32 45.71 68.71 89.75
/a A decline in the value of the index denotes a depreciation of the peso./b Deflated by CPI.
Source: Central Bank of the Philippines, IMF.
The Interface Between Monetary and Exchange Rate Policies
1.12 At various times during 1987 and 1988, the Government has used mone-tary restraint to ease the pressure on the balance of payments. The need todiscourage outflow of capital, especially in a period of politial insta-bility, has been an important factor in the determination of monetary policy.The emergence of inflationary pressures during 1988, however, now places thePhilippine authorities between the dilemma of continuing a restrictive mone-tary stance, which could stifle economic growth, or following a more expan-sionary monetary policy, which would validate the inflationary process. How-ever, under a relatively free system of international capital movements, themonetary authority is also constrained in its interest rate policy by therelationship between domestic and international interest rates.
1.13 The Government has been reluctant to use exchange rate movements as ameans of dampening speculative pressures, for fear of adding to inflationarypressures and causing destabilizing swings in the exchange rate. One of the-rincipal concerns of the Central Bank has been the removal of excess
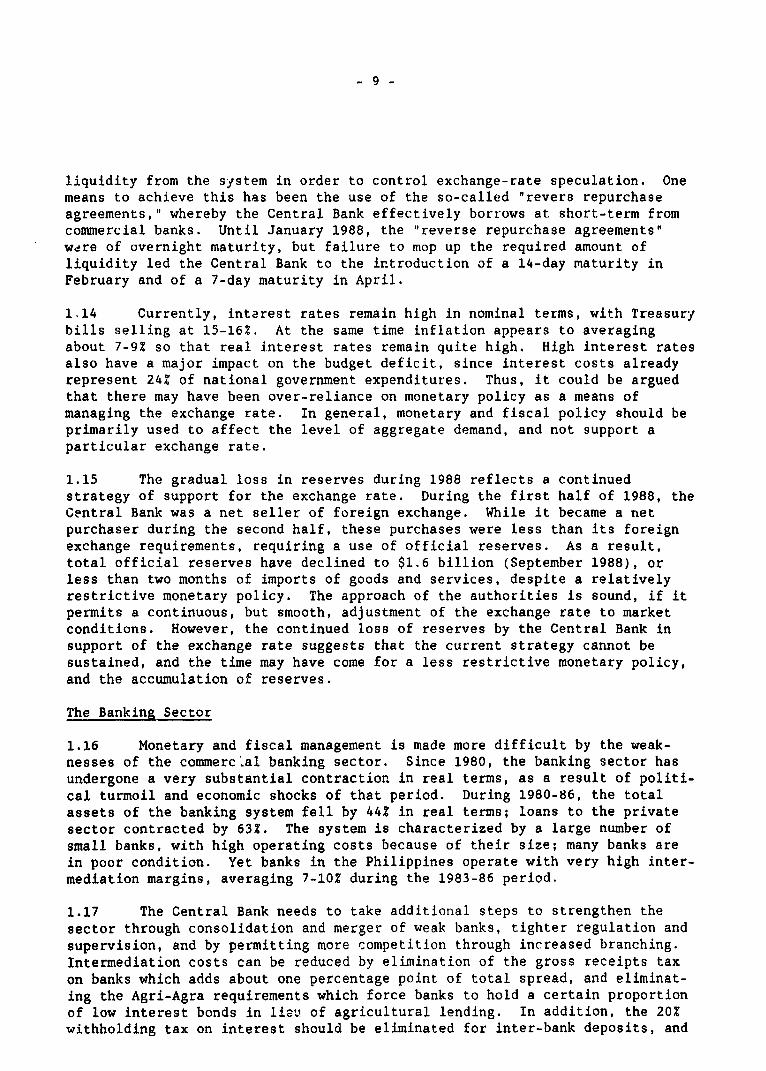
liquidity from the system in order to control exchange-rate speculation. Onemeans to achieve this has been the use of the so-called "revers repurchaseagreements," whereby the Central Bank effectively borrows at short-term fromcommercial banks. Until January 1988, the "reverse repurchase agreements"were of overnight maturity, but failure to mop up the required amount ofliquidity led the Central Bank to the introduction of a 14-day maturity inFebruary and of a 7-day maturity in April.
1.14 Currently, interest rates remain high in nominal terms, with Treasurybills selling at 15-162. At the same time inflation appears to averagingabout 7-92 so that real interest rates remain quite high. High interest ratesalso have a major impact on the budget deficit, since interest costs alreadyrepresent 242 of national government expenditures. Thus, it could be arguedthat there may have been over-reliance on monetary policy as a means ofmanaging the exchange rate. In general, monetary and fiscal policy should beprimarily used to affect the level of aggregate demand, and not support aparticular exchange rate.
1.15 The gradual loss in reserves during 1988 reflects a continuedstrategy of support for the exchange rate. During the first half of 1988, theCentral Bank was a net seller of foreign exchange. While it became a netpurchaser during the second half, these purchases were less than its foreignexchange requirements, requiring a use of official reserves. As a result,total official reserves have declined to $1.6 billion (September 1988), orless than two months of imports of goods and services, despite a relativelyrestrictive monetary policy. The approach of the authorities is sound, if itpermits a continuous, but smooth, adjustment of the exchange rate to marketconditions. However, the continued loss of reserves by the Central Bank insupport of the exchange rate suggests that the current strategy cannot besustained, and the time may have come for a less restrictive monetary policy,and the accumulation of reserves.
The Banking Sector
1.16 Monetary and fiscal management is made more difficult by the weak-nesses of the commercial banking sector. Since 1980, the banking sector hasundergone a very substantial contraction in real terms, as a result of politi-cal turmoil and economic shocks of that period. During 1980-86, the totalassets of the banking system fell by 44% in real terms; loans to the privatesector contracted by 631. The system is characterized by a large number ofsmall banks, with high operating costs because of their size; many banks arein poor condition. Yet banks in the Philippines operate with very high inter-mediation margins, averaging 7-10X during the 1983-86 period.
1.17 The Central Bank needs to take additional steps to strengthen thesector through consolidation and merger of weak banks, tighter regulation andsupervision, and by permitting more competition through increased branching.Intermediation costs can be reduced by elimination of the gross receipts taxon banks which adds about one percentage point of total spread, and eliminat-ing the Agri-Agra requirements which force banks to hold a certain proportionof low interest bonds in lieu of agricultural lending. In addition, the 20%withholding tax on interest should be eliminated for inter-bank deposits, and
- 10 -
transactions between the CB and the commercial banks. Another possibility isto raise the interest rate paid on required eserves, or lowering the requiredreserve ratio.
1.18 In general, commercial banks do not provide adequate amounts of longterm loans. In part, this reflects their tradition of commercial banking, andthe fact that most sources of funds are short-term. Attempts in the past toencourage long-term lending, such as by reducing reserve requirements on long-term deposits, have not been successful. Central Bank funds (APEX) madeavailable to finance long term loans have been underutilized, as commercialbanks seem inherently unwilling to take on an unfamiliar activity. Outsidethe commercial banks, there are few viable alternative sources of long-termfunds. Equity and bond markets remain underdeveloped and available only tothe biggest corporations with outstanding reputations. As a result, manyentrepreneurs finance long-term investments with short-term credits which areperiodically rolled-over. This is less than a happy solution. Yet theoverall financial system does have sources of long term funds, principally theGovernment's social security system and private life insurance companies.Some system needs to be developed to tap these sources and funnel them throughan institution that is equipped to undertake long term lending, as well as towork with borrowers on other aspects of their financial needs, such as finan-cial restructuring and equity offerings. The reorganized and restructured DBPis the logical choice for this role, as recent reforms have removed thesources of past problems. Long-term funds presently administered by theCentral Bank (APEX, IGLF) should be shifted to DBP, and efforts should be madeto have DBP act as a mobilizer of domestic savings.
B. Balance of Payments
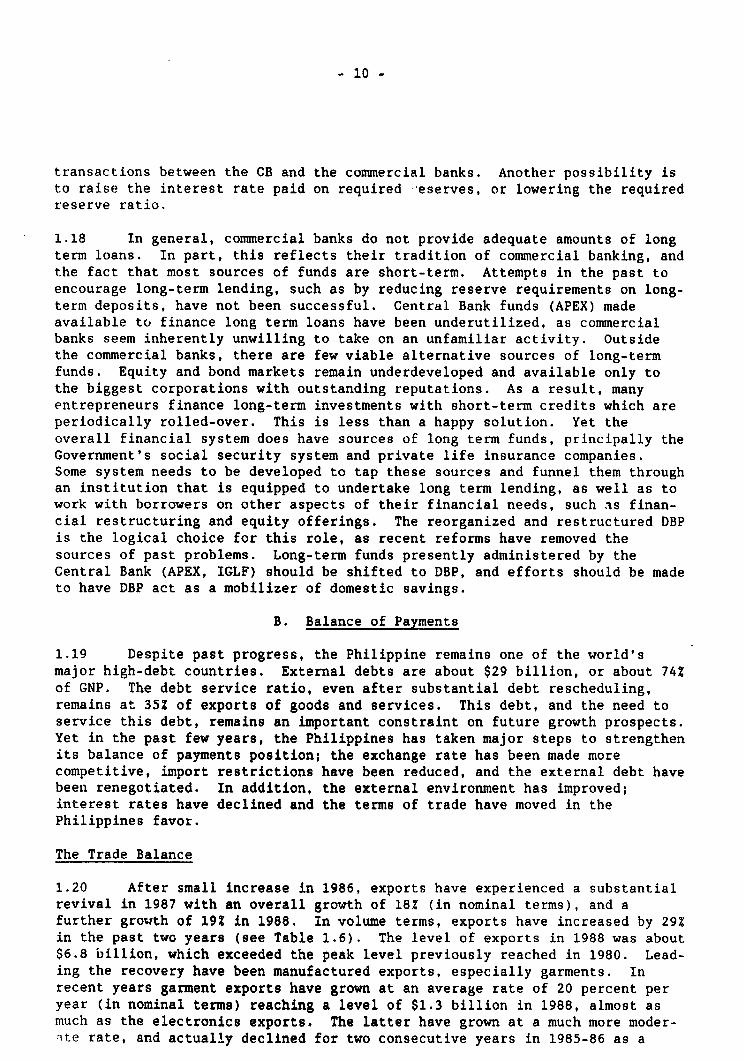
1.19 Despite past progress, the Philippine remains one of the world'smajor high-debt countries. External debts are about $29 billion, or about 74%of GNP. The debt service ratio, even after substantial debt rescheduling,remains at 35% of exports of goods and services. This debt, and the need toservice this debt, remains an important constraint on future growth prospects.Yet in the past few years, the Philippines has taken major steps to strengthenits balance of payments position; the exchange rate has been made morecompetitive, import restrictions have been reduced, and the external debt havebeen renegotiated. In addition, the external environment has improved;interest rates have declined and the terms of trade have moved in thePhilippines favor.
The Trade Balance
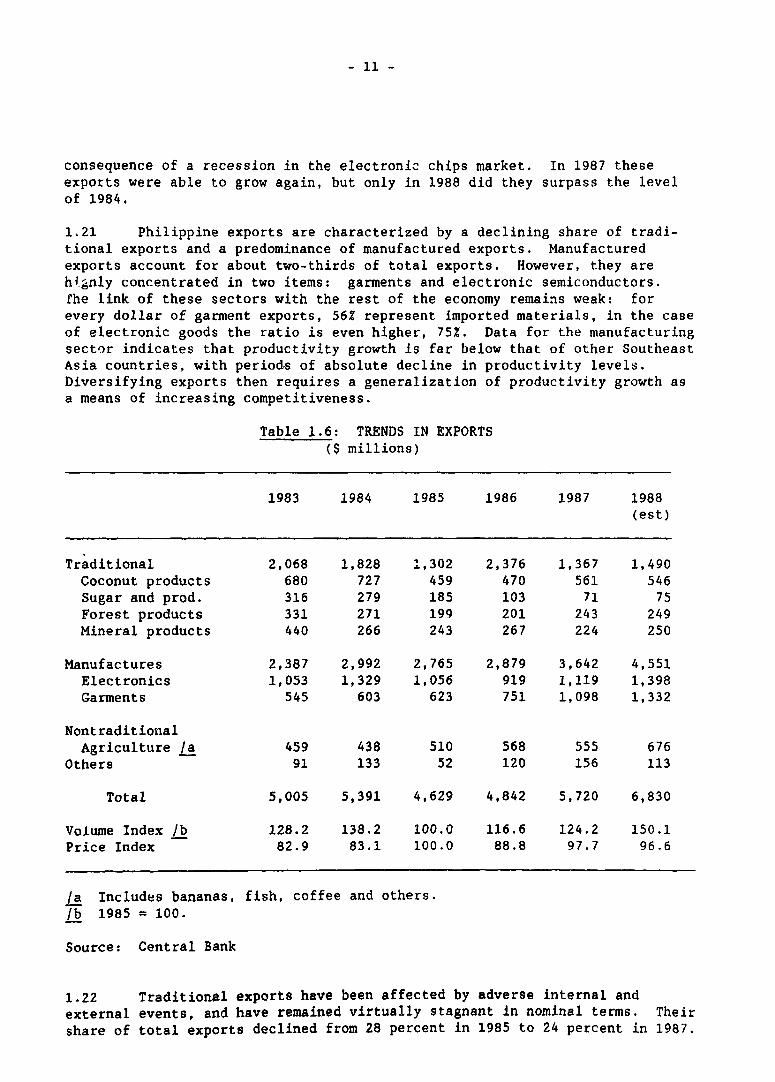
1.20 After small increase in 1986, exports have experienced a substantialrevival in 1987 with an overall growth of 18Z (in nominal terms), and afurther growth of 19% in 1988. In volume terms, exports have increased by 29%in the past twG years (see Table 1.6). The level of exports in 1988 was about$6.8 billion, which exceeded the peak level previously reached in 1980. Lead-ing the recovery have been manufactured exports, especially garments. Inrecent years garment exports have grown at an average rate of 20 percent peryear (in nominal terms) reaching a level of $1.3 billion in 1988, almost asmuch as the electronics exports. The latter have grown at a much more moder-ate rate, and actually declined for two consecutive years in 1985-86 as a
- 11 -
consequence of a recession in the electronic chips market. In 1987 theseexports were able to grow again, but only in 1988 did they surpass the levelof 1984.
1.21 Philippine exports are characterized by a declining share of tradi-tional exports and a predominance of manufactured exports. Manufacturedexports account for about two-thirds of total exports. However, they arehignly concentrated in two items: garments and electronic semiconductors.fhe link of these sectors with the rest of the economy remains weak: forevery dollar of garment exports, 56Z represent imported materials, in the caseof electronic goods the ratio is even higher, 75Z. Data for the manufacturingsector indicates that productivity growth is far below that of other SoutheastAsia countries, with periods of absolute decline in productivity levels.Diversifying exports then requires a generalization of productivity growth asa means of increasing competitiveness.
Table 1.6: TRENDS IN EXPORTS($ millions)
1983 1984 1985 1986 1987 1988(est)
Traditional 2,068 1,828 1,302 2,376 1,367 1,490Coconut products 680 727 459 470 561 546Sugar and prod. 316 279 185 103 71 75Forest products 331 271 199 201 243 249Mineral products 440 266 243 267 224 250
Manufactures 2,387 2,992 2,765 2,879 3,642 4,551Electronics 1,053 1,329 1,056 919 1,119 1,398Garments 545 603 623 751 1,098 1,332
NontraditionalAgriculture /a 459 438 510 568 555 676
Others 91 133 52 120 156 113
Total 5,005 5,391 4,629 4,842 5,720 6,830
Volume Index /b 128.2 138.2 100.0 116.6 124.2 150.1Price Index 82.9 83.1 100.0 88.8 97.7 96.6
/a Includes bananas, fish, coffee and others./b 1985 = 100.
Source: Central Bank
1.22 Traditional exports have been affected by adverse internal andexternal events, and have remained virtually stagnant in nominal terms. Theirshare of total exports declined from 28 percent in 1985 to 24 percent in 1987.
- 12 -
Coconut oil exports, responding to the improvements in marketing conditionsinternally, and better weather, increased by 92% in 1986 in volume terms.However, sharply lower world prices resulted in a declined in total earnings.In 1987, drought again reduced production, but higher world prices resulted inan increase in total earnings. Sugar exports continued to contract during theperiod, reflecting a diminishing U.S. quota and the inability of Philippinesugar exports to compete against subsidized sugar export from the EEC. Theban on log exports, and the shortage of adequate timber resources, continue tolimit the level of log and plywood exports. One bright spot has been therapid growth of some of the non-traditional agricultural exports, such asshrimp and prawns, and processed food products.
Merchandise Imports
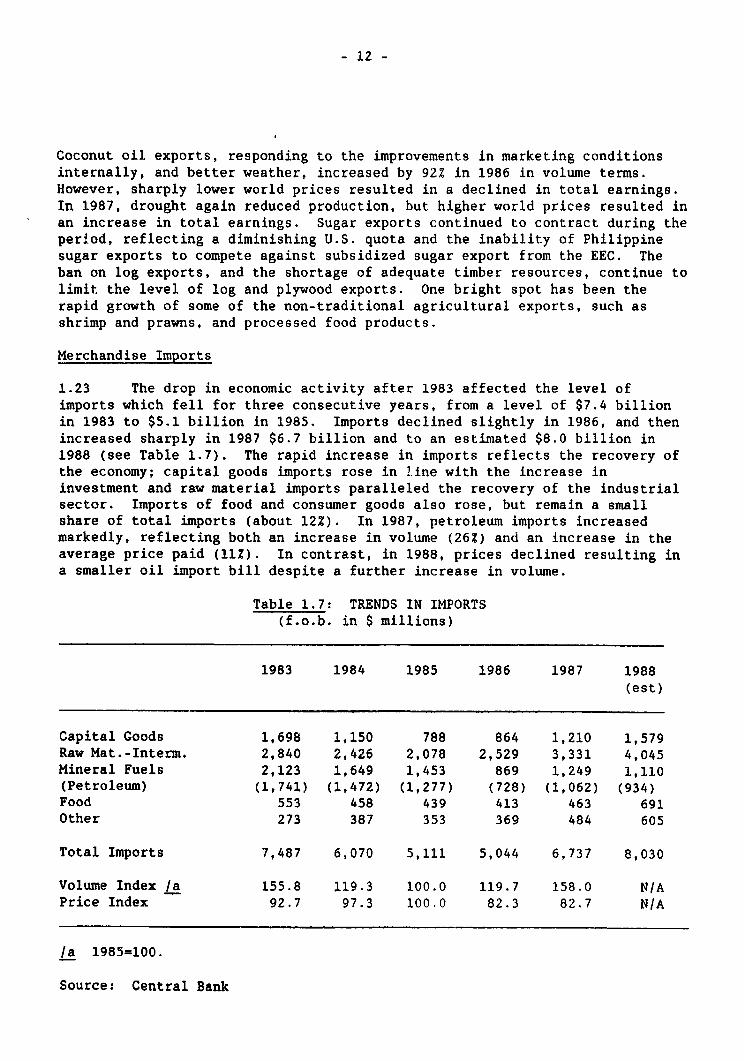
1.23 The drop in economic activity after 1983 affected the level ofimports which fell for three consecutive years, from a level of $7.4 billionin 1983 to $5.1 billion in 1985. Imports declined slightly in 1986, and thenincreased sharply in 1987 $6.7 billion and to an estimated $8.0 billion in1988 (see Table 1.7). The rapid increase in imports reflects the recovery ofthe economy; capital goods imports rose in line with the increase ininvestment and raw material imports paralleled the recovery of the industrialsector. Imports of food and consumer goods also rose, but remain a smallshare of total imports (about 12Z). In 1987, petroleum imports increasedmarkedly, reflecting both an increase in volume (26Z) and an increase in theaverage price paid (11Z). In contrast, in 1988, prices declined resulting ina smaller oil import bill despite a further increase in volume.
Table 1.7: TRENDS IN IMPORTS(f.o.b. in $ millions)
1983 1984 1985 1986 1987 1988(est)
Capital Goods 1,698 1,150 788 864 1,210 1,579Raw Mat.-Interm. 2,840 2,426 2,078 2,529 3,331 4,045Mineral Fuels 2,123 1,649 1,453 869 1,249 1,110(Petroleum) (1,741) (1,472) (1,277) (728) (1,062) (934)Food 553 458 439 413 463 691Other 273 387 353 369 484 605
Total Imports 7,487 6,070 5,111 5,044 6,737 8,030
Volume Index /a 155.8 119.3 100.0 119.7 158.0 N/APrice Index 92.7 97.3 100.0 82.3 82.7 N/A
la 1985=100.
Source: Central Bank
- 13 -
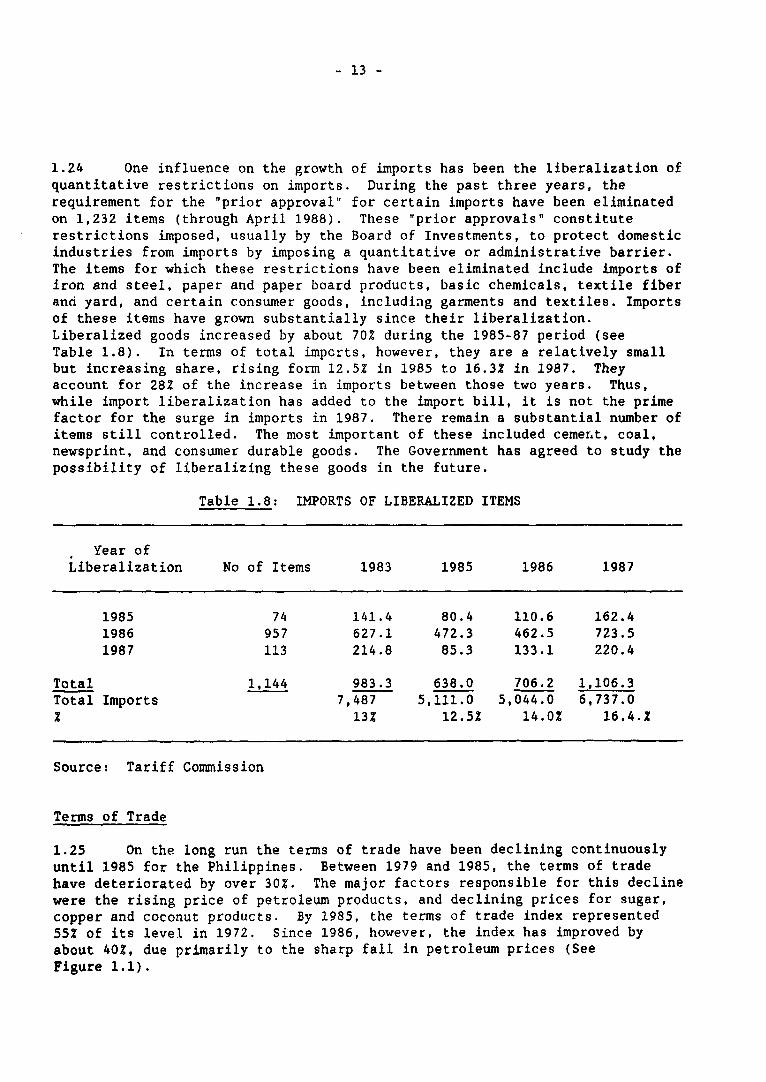
1.24 One influence on the growth of imports has been the liberalization ofquantitative restrictions on imports. During the past three years, therequirement for the "prior approval" for certain imports have been eliminatedon 1,232 items (through April 1988). These "prior approvals" constituterestrictions imposed, usually by the Board of Investments, to protect domesticindustries from imports by imposing a quantitative or administrative barrier.The items for which these restrictions have been eliminated include imports ofiron and steel, paper and paper board products, basic chemicals, textile fiberand yard, and certain consumer goods, including garments and textiles. Importsof these items have grown substantially since their liberalization.Liberalized goods increased by about 70% during the 1985-87 period (seeTable 1.8). In terms of total impcrts, however, they are a relatively smallbut increasing share, rising form 12.5% in 1985 to 16.3% in 1987. Theyaccount for 28% of the increase in imports between those two years. Thus,while import liberalization has added to the import bill, it is not the primefactor for the surge in imports in 1987. There remain a substantial number ofitems still controlled. The most important of these included cement, coal,newsprint, and consumer durable goods. The Government has agreed to study thepossibility of liberalizing these goods in the future.
Table 1.8: IMPORTS OF LIBERALIZED ITEMS
Year ofLiberalization No of Items 1983 1985 1986 1987
1985 74 141.4 80.4 110.6 162.41986 957 627.1 472.3 462.5 723.51987 113 214.8 85.3 133.1 220.4
Total 1,144 983.3 638.0 706.2 1,106.3Total Imports 7,487 5,111.0 5,044.0 6,737.0X 13% 12.52 14.0% 16.4.X
Source: Tariff Commission
Terms of Trade
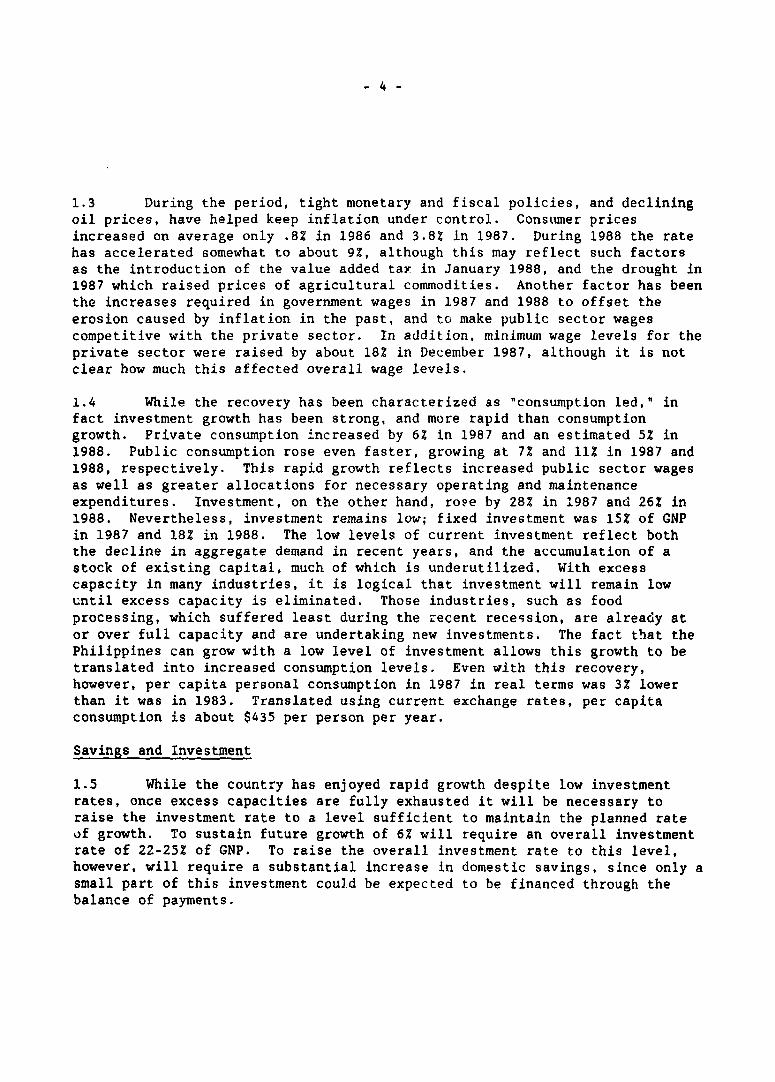
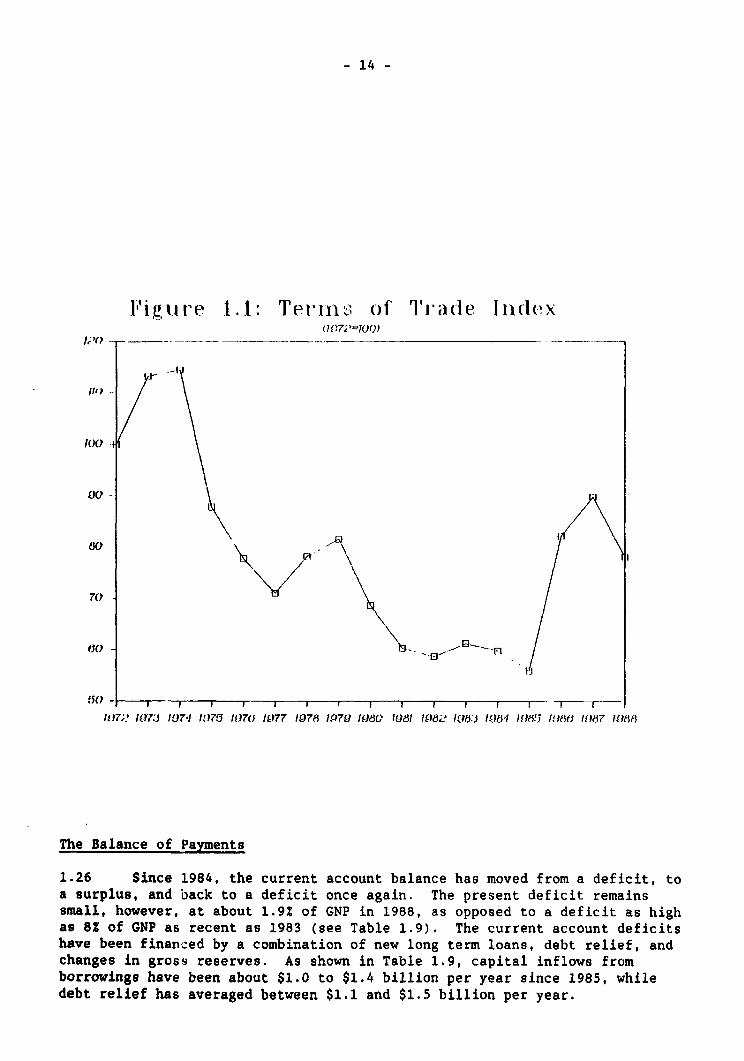
1.25 On the long run the terms of trade have been declining continuouslyuntil 1985 for the Philippines. Between 1979 and 1985, the terms of tradehave deteriorated by over 30%. The major factors responsible for this declinewere the rising price of petroleum products, and declining prices for sugar,copper and coconut products. By 1985, the terms of trade index represented55% of its level in 1972. Since 1986, however, the index has improved byabout 40%, due primarily to the sharp fall in petroleum prices (SeeFigure 1.1).
- 14 -
I'igu re 1.1: Terrn,; of T'i acle I11(lex1?OP
100 1100
'°I k
60 - t,
/lO;? ID7:J 10741 1175 /1076 l077 /978 1.47910 lW1 81 1986 1016:J 10614 1118!5 HOW15 10187 10188
The Balance of Payments
1.26 Since 1984, the current account balance has moved from a deficit, toa surplus, and back to a deficit once again. The present deficit remainssmall, however, at about 1.9% of GNP in 1988, as opposed to a deficit as highas 8Z of GNP as recent as 1983 (see Table 1.9). The current account deficitshave been financed by a combination of new long term loans, debt relief, andchanges in gross reserves. As shown in Table 1.9, capital inflows fromborrowings have been about $1.0 to $1.4 billion per year since 1985, whiledebt relief has averaged between $1.1 and $1.5 billion per year.
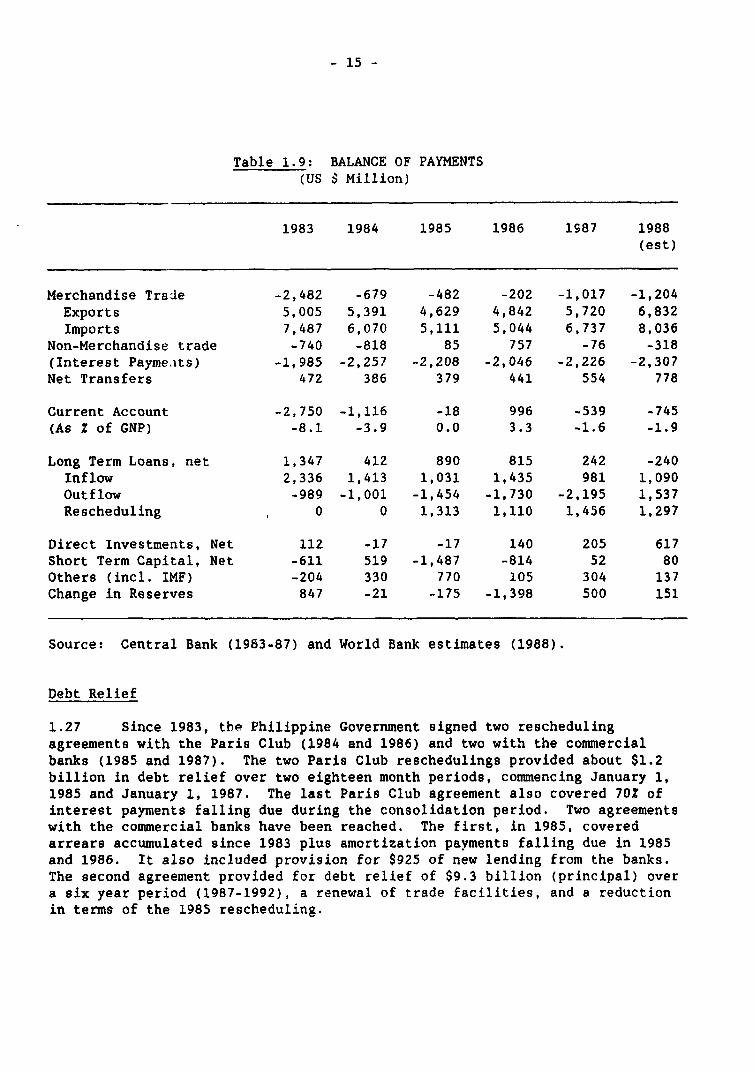
- 15 -
Table 1.9: BALANCE OF PAYMENTS(US $ Million)
1983 1984 1985 1986 1987 1988(est)
Merchandise Trade -2,482 -679 -482 -202 -1,017 -1,204Exports 5,005 5,391 4,629 4,842 5,720 6,832Imports 7,487 6,070 5,111 5,044 6,737 8,036
Non-Merchandise trade -740 -818 85 757 -76 -318(Interest Payme.ats) -1,985 -2,257 -2,208 -2,046 -2,226 -2,307Net Transfers 472 386 379 441 554 778
Current Account -2,750 -1,116 -18 996 -539 -745(As Z of GNP) -8.1 -3.9 0.0 3.3 -1.6 -1.9
Long Term Loans, net 1,347 412 890 815 242 -240Inflow 2,336 1,413 1,031 1,435 981 1,090Outflow -989 -1,001 -1,454 -1,730 -2,195 1,537Rescheduling 0 0 1,313 1,110 1,456 1,297
Direct Investments, Net 112 -17 -17 140 205 617Short Term Capital, Net -611 519 -1,487 -814 52 80Others (incl. IMF) -204 330 770 105 304 137Change in Reserves 847 -21 -175 -1,398 500 151
Source: Central Bank (1983-87) and World Bank estimates (1988).
Debt Relief
1.27 Since 1983, the Philippine Government signed two reschedulingagreements with the Paris Club (1984 and 1986) and two with the commercialbanks (1985 and 1987). The two Paris Club reschedulings provided about $1.2billion in debt relief over two eighteen month periods, commencing January 1,1985 and January 1, 1987. The last Paris Club agreement also covered 70Z ofinterest payments falling due during the consolidation period. Two agreementswith the commercial banks have been reached. The first, in 1985, coveredarrears accumulated since 1983 plus amortization pavments falling due in 1985and 1986. It also included provision for $925 of new lending from the banks.The second agreement provided for debt relief of $9.3 billion (principal) overa six year period (1987-1992), a renewal of trade facilities, and a reductionin terms of the 1985 rescheduling.
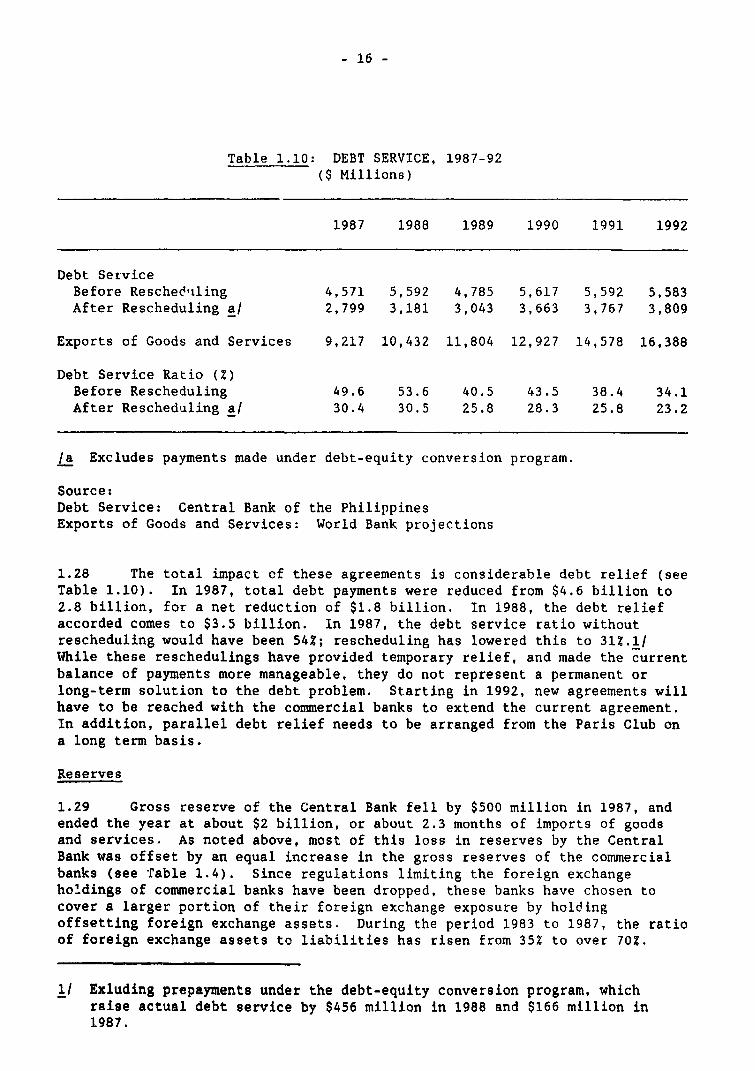
- 16 -
Table 1.10: DEBT SERVICE, 1987-92($ Millions)
1987 1988 1989 1990 1991 1992
Debt ServiceBefore Rescheduiling 4,571 5,592 4,785 5,617 5,592 5,583After Rescheduling a/ 2,799 3,181 3,043 3,663 3,767 3,809
Exports of Goods and Services 9,217 10,432 11,804 12,927 14,578 16,388
Debt Service Ratio (Z)Before Rescheduling 49.6 53.6 40.5 43.5 38.4 34.1After Rescheduling a/ 30.4 30.5 25.8 28.3 25.8 23.2
/a Excludes payments made under debt-equity conversion program.
Source:Debt Service: Central Bank of the PhilippinesExports of Goods and Services: World Bank projections
1.28 The total impact cf these agreements is considerable debt relief (seeTable 1.10). In 1987, total debt payments were reduced from $4.6 billion to2.8 billion, for a net reduction of $1.8 billion. In 1988, the debt reliefaccorded comes to $3.5 billion. In 1987, the debt service ratio withoutrescheduling would have been 54Z; rescheduling has lowered this to 31Z.1/While these reschedulings have provided temporary relief, and made the currentbalance of payments more manageable, they do not represent a permanent orlong-term solution to the debt problem. Starting in 1992, new agreements willhave to be reached with the commercial banks to extend the current agreement.In addition, parallel debt relief needs to be arranged from the Paris Club ona long term basis.
Reserves
1.29 Gross reserve of the Central Bank fell by $500 million in 1987, andended the year at about $2 billion, or about 2.3 months of imports of goodsand services. As noted above, most of this loss in reserves by the CentralBank was offset by an equal increase in the gross reserves of the commercialbanks (see rable 1.4). Since regulations limiting the foreign exchangeholdings of commercial banks have been dropped, these banks have chosen tocover a larger portion of their foreign exchange exposure by holdingoffsetting foreign exchange assets. During the period 1983 to 1987, the ratioof foreign exchange assets to liabilities has risen from 35Z to over 70%.
1/ Exluding prepayments under the debt-equity conversion program, whichraise actual debt service by $456 million in 1988 and $166 million in1987.
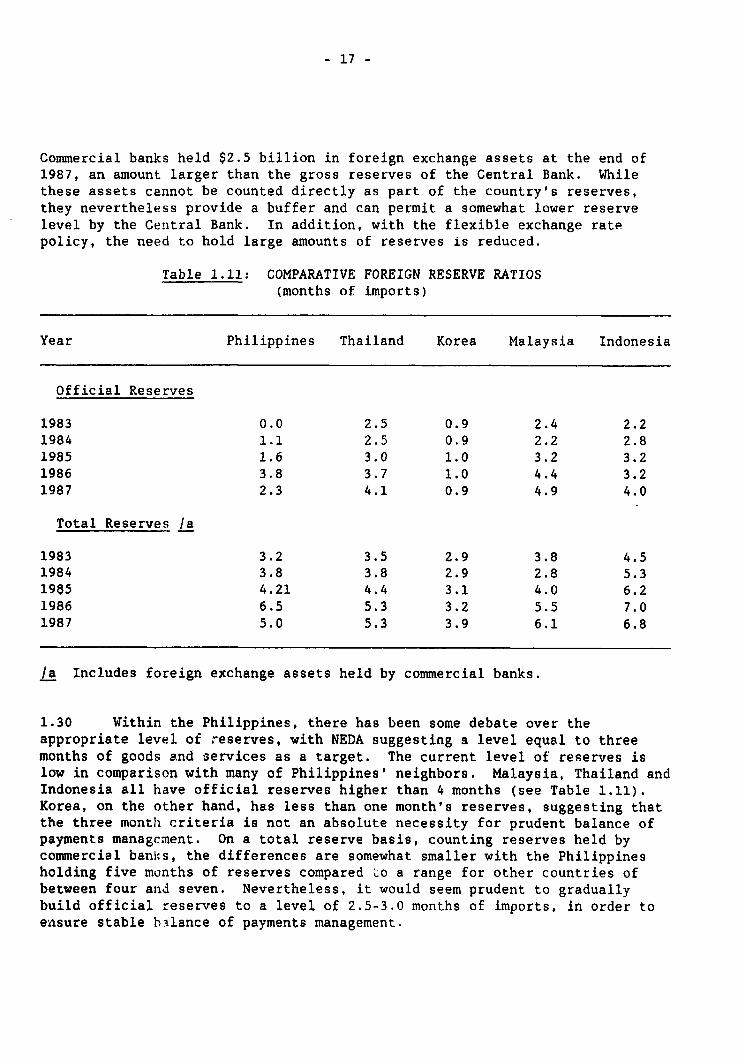
- 17 -
Commercial banks held $2.5 billion in foreign exchange assets at the end of1987, an amount larger than the gross reserves of the Central Bank. Whilethese assets cannot be counted directly as part of the country's reserves,they nevertheless provide a buffer and can permit a somewhat lower reservelevel by the Central Bank. In addition, with the flexible exchange ratepolicy, the need to hold large amounts of reserves is reduced.
Table 1.11: COMPARATIVE FOREIGN RESERVE RATIOS(months of imports)
Year Philippines Thailand Korea Malaysia Indonesia
Official Reserves
1983 0.0 2.5 0.9 2.4 2.21984 1.1 2.5 0.9 2.2 2.81985 1.6 3.0 1.0 3.2 3.21986 3.8 3.7 1.0 4.4 3.21987 2.3 4.1 0.9 4.9 4.0
Total Reserves la
1983 3.2 3.5 2.9 3.8 4.51984 3.8 3.8 2.9 2.8 5.319g5 4.21 4.4 3.1 4.0 6.21986 6.5 5.3 3.2 5.5 7.01987 5.0 5.3 3.9 6.1 6.8
/a Includes foreign exchange assets held by commercial banks.
1.30 Within the Philippines, there has been some debate over theappropriate level of reserves, with NEDA suggesting a level equal to threemonths of goods and services as a target. The current level of reserves islow in comparison with many of Philippines' neighbors. Malaysia, Thailand andIndonesia all have official reserves higher than 4 months (see Table 1.11).Korea, on the other hand, has less than one month's reserves, suggesting thatthe three montlh criteria is not an absolute necessity for prudent balance ofpayments managcnent. On a total reserve basis, counting reserves held bycommercial banls, the differences are somewhat smaller with the Philippinesholding five months of reserves compared Lo a range for other countries ofbetween four and seven. Nevertheless, it would seem prudent to graduallybuild official reserves to a level of 2.5-3.0 months of imports, in order toensure stable balance of payments management.
- 18 -
CHAPTER II
THE PUBLIC SECTOR
2.1 The public sector has undergone a major reorientation in the past twoyears. The tax oystem has been reformed, and a value-added tax introduced inplace of a cascading series of sales and excise taxes. Public investment hasbeen scaled back and reoriented toward providing basic infrastructure. Areform program for the government corporate sector has been adopted that willlead to the privatization, closure, or rationalization of over 200 governmentcorporations. The government financial institutions, which had been a majordrain on the budget, have been reorganized, reduced in scope, and put underbetter management; their non-performing accounts have been taken over by agovernment entity, and a significant number sold back to the private sector.The salaries of public sector employees have been adjusted upwards tocompensate for past inflation.
2.2 Nevertheless, serious problems remain. Overall, the efficiency ofthe public sector is low, and this limits the Government's ability to imple-ment agreed policies and programs. Thus, there are often shortfalls betweenannounced tax rates and actual tax collections, between planned investmentsand actual expenditures, and between announced policies and actual administra-tion of policies. There is often a general failure of government departmentsto agree and coordinate, further reducing government effectiveness. Anefficient public sector, with a well-focused expenditure program, will be anessential element of a rapidly growing economy. This chapter discusses recentdevelopments and achievements in the public sector, and examines some of theimportant problems that will have to be addressed by the Government in yearsto come.
A. Tax and Revenue Effort
2.3 The public finances began to improve in 1986 and 1987. The taxeffort (taxes/GNP) rose from 10.3? in 1985 to 12.22 in 1987. This reflectsnew tax measures adopted to improve the efficiency and elasticity of the taxsystem, as well as strengthened revenue performance. However, it was thegrowth in the tax base, particularly imports, which contributed the mosttowards improved tax performance. In 1988, preliminary estimates suggest thatthe tax revenues fell to about 11.2Z of GNP, despite continued expansion ofthe tax base and no changes in tax rates. Poor enforcement and inadequatestaffing appear to be the main reasons for declining tax effort performance.
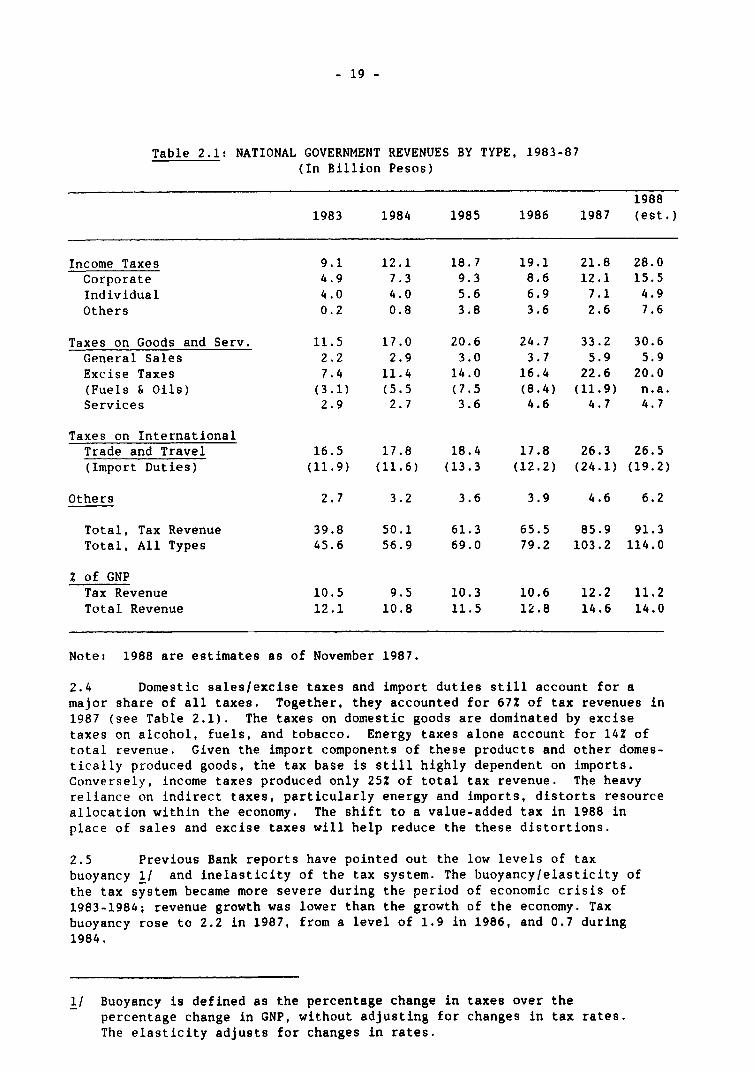
- 19 -
Table 2.1: NATIONAL GOVERNMENT REVENUES BY TYPE, 1983-87(In Billion Pesos)
19881983 1984 1985 1986 1987 (est.)
Income Taxes 9.1 12.1 18.7 19.1 21.8 28.0Corporate 4.9 7.3 9.3 8.6 12.1 15.5Individual 4.0 4.0 5.6 6.9 7.1 4.9Others 0.2 0.8 3.8 3.6 2.6 7.6
Taxes on Goods and Serv. 11.5 17.0 20.6 24.7 33.2 30.6General Sales 2.2 2.9 3.0 3.7 5.9 5.9Excise Taxes 7.4 11.4 14.0 16.4 22.6 20.0(Fuels & Oils) (3.1) (5.5 (7.5 (8.4) (11.9) n.a.Services 2.9 2.7 3.6 4.6 4.7 4.7
Taxes on InternationalTrade and Travel 16.5 17.8 18.4 17.8 26.3 26.5(Import Duties) (11.9) (11.6) (13.3 (12.2) (24.1) (19.2)
Others 2.7 3.2 3.6 3.9 4.6 6.2
Total, Tax Revenue 39.8 50.1 61.3 65.5 85.9 91.3Total, All Types 45.6 56.9 69.0 79.2 103.2 114.0
Z of GNPTax Revenue 10.5 9.5 10.3 10.6 12.2 11.2Total Revenue 12.1 10.8 11.5 12.8 14.6 14.0
Note: 1988 are estimates as of November 1987.
2.4 Domestic sales/excise taxes and import duties still account for amajor share of all taxes. Together, they accounted for 67Z of tax revenues in1987 (see Table 2.1). The taxes on domestic goods are dominated by excisetaxes on alcohol, fuels, and tobacco. Energy taxes alone account for 142 oftotal revenue. Given the import components of these products and other domes-tically produced goods, the tax base is still highly dependent on imports.Conversely, income taxes produced only 25Z of total tax revenue. The heavyreliance on indirect taxes, particularly energy and imports, distorts resourceallocation within the economy. The shift to a value-added tax in 1988 inplace of sales and excise taxes will help reduce the these distortions.
2.5 Previous Bank reports have pointed out the low levels of taxbuoyancy 1/ and inelasticity of the tax system. The buoyancy/elasticity ofthe tax system became more severe during the period of economic crisis of1983-1984; revenue growth was lower than the growth of the economy. Taxbuoyancy rose to 2.2 in 1987, from a level of 1.9 in 1986, and 0.7 during1984.
1/ Buoyancy is defined as the percentage change in taxes over thepercentage change in GNP, without adjusting for changes in tax rates.The elasticity adjusts for changes in rates.
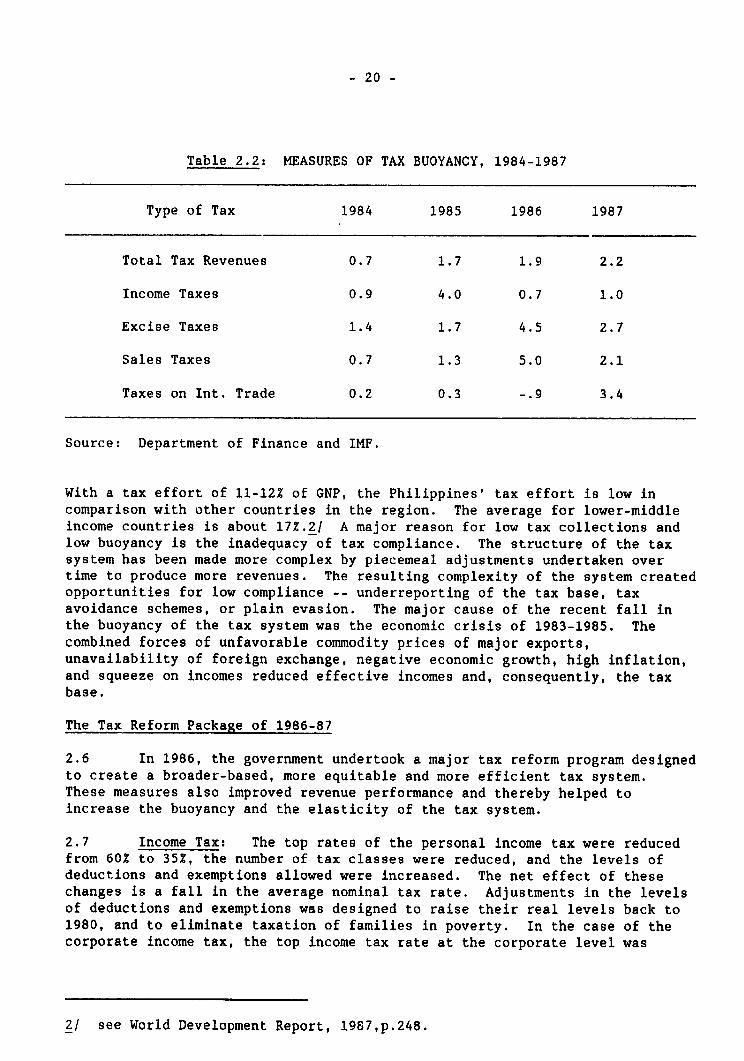
- 20 -
Table 2.2: MEASURES OF TAX BUOYANCY, 1984-1987
Type of Tax 1984 1985 1986 1987
Total Tax Revenues 0.7 1.7 1.9 2.2
Income Taxes 0.9 4.0 0.7 1.0
Excise Taxes 1.4 1.7 4.5 2.7
Sales Taxes 0.7 1.3 5.0 2.1
Taxes on Int. Trade 0.2 0.3 -.9 3.4
Source: Department of Finance and IMF.
With a tax effort of 11-12% of GNP, the Philippines' tax effort is low incomparison with other countries in the region. The average for lower-middleincome countries is about 17Z.2/ A major reason for low tax collections andlow buoyancy is the inadequacy of tax compliance. The structure of the taxsystem has been made more complex by piecemeal adjustments undertaken overtime to produce more revenues. The resulting complexity of the system createdopportunities for low compliance -- underreporting of the tax base, taxavoidance schemes, or plain evasion. The major cause of the recent fall inthe buoyancy of the tax system was the economic crisis of 1983-1985. Thecombined forces of unfavorable commodity prices of major exports,unavailability of foreign exchange, negative economic growth, high inflation,and squeeze on incomes reduced effective incomes and, consequently, the taxbase.
The Tax Reform Package of 1986-87
2.6 In 1986, the government undertook a major tax reform program designedto create a broader-based, more equitable and more efficient tax system.These measures also improved revenue performance and thereby helped toincrease the buoyancy and the elasticity of the tax system.
2.7 Income Tax: The top rates of the personal income tax were reducedfrom 602 to 352, the number of tax classes were reduced, and the levels ofdeductions and exemptions allowed were increased. The net effect of thesechanges is a fall in the average nominal tax rate. Adjustments in the levelsof deductions and exemptions was designed to raise their real levels back to1980, and to eliminate taxation of families in poverty. In the case of thecorporate income tax, the top income tax rate at the corporate level was
2/ see World Development Report, 19&7,p.248.
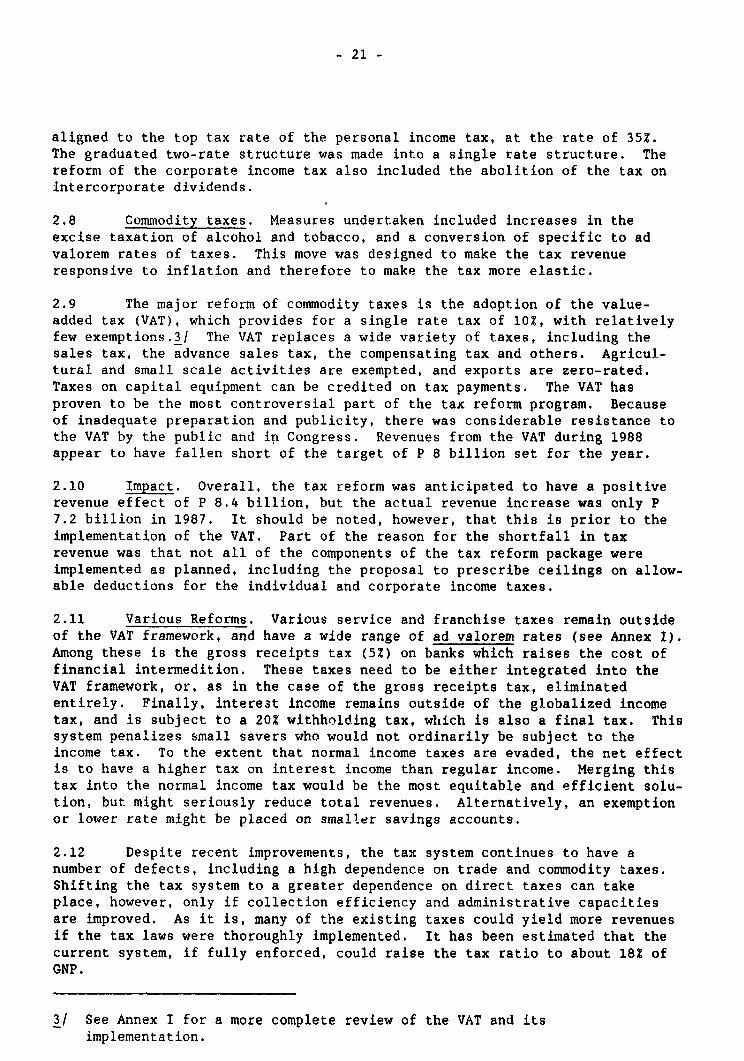
- 21 -
aligned to the top tax rate of the personal income tax, at the rate of 35Z.The graduated two-rate structure was made into a single rate structure. Thereform of the corporate income tax also included the abolition of the tax onintercorporate dividends.
2.8 Commodity taxes. Measures undertaken included increases in theexcise taxation of alcohol and tobacco, and a conversion of specific to advalorem rates of taxes. This move was designed to make the tax revenueresponsive to inflation and therefore to make the tax more elastic.
2.9 The major reform of commodity taxes is the adoption of the value-added tax (VAT), which provides for a single rate tax of 102, with relativelyfew exemptions.3/ The VAT replaces a wide variety of taxes, including thesales tax, the advance sales tax, the compensating tax and others. Agricul-tural and small scale activities are exempted, and exports are zero-rated.Taxes on capital equipment can be credited on tax payments. The VAT hasproven to be the most controversial part of the tax reform program. Becauseof inadequate preparation and publicity, there was considerable resistance tothe VAT by the public and in Congress. Revenues from the VAT during 1988appear to have fallen short of the target of P 8 billion set for the year.
2.10 Impact. Overall, the tax reform was anticipated to have a positiverevenue effect of P 8.4 billion, but the actual revenue increase was only P7.2 billion in 1987. It should be noted, however, that this is prior to theimplementation of the VAT. Part of the reason for the shortfall in taxrevenue was that not all of the components of the tax reform package wereimplemented as planned, including the proposal to prescribe ceilings on allow-able deductions for the individual and corporate income taxes.
2.11 Various Reforms. Various service and franchise taxes remain outsideof the VAT framework, and have a wide range of ad valorem rates (see Annex I).Among these is the gross receipts tax (5%) on banks which raises the cost offinancial intermedition. These taxes need to be either integrated into theVAT framework, or, as in the case of the gross receipts tax, eliminatedentirely. Finally, interest income remains outside of the globalized incometax, and is subject to a 202 withholding tax, which is also a final tax. Thissystem penalizes small savers who would not ordinarily be subject to theincome tax. To the extent that normal income taxes are evaded, the net effectis to have a higher tax on interest income than regular income. Merging thistax into the normal income tax would be the most equitable and efficient solu-tion, but might seriously reduce total revenues. Alternatively, an exemptionor lower rate might be placed on smaller savings accounts.
2.12 Despite recent improvements, the tax system continues to have anumber of defects, including a high dependence on trade and commodity taxes.Shifting the tax system to a greater dependence on direct taxes can takeplace, however, only if collection efficiency and administrative capacitiesare improved. As it is, many of the existing taxes could yield more revenuesif the tax laws were thoroughly implemented. It has been estimated that thecurrent system, if fully enforced, could raise the tax ratio to about 18% ofGNP.
3/ See Annex I for a more complete review of the VAT and itsimplementation.
- 22 -
B. Public Expenditure
Expenditures
2.13 There have been major shifts in the allocation of budget expendituresover the past few years. Up through 1986, there was a tendency to cut mainte-nance and operating expenditures, and to limit government salary increases.After 1986, a major effort was made to restore O&M expenditures. Thus, O&Mincreased in nominal terms by 24% between 1985 and 1987, and the current levelof O&M planned for 1988 would. be about 85% of the 1982 level in real terms.
2.14 For the future, the Medium-Term Plan calls for increased expendituresin agriculture, agrarian reform and the social sectors. Social sector expen-ditures are expected to rise from 19X to 29% of the total budget between 1988and 1992. In ke,eping with this target, budget allocations for the socialsectors were expacted to increase by 54% in 1988, and agriculture/agrarianreform by 76%. At the same t.ime, wage and salary adjustments, and increasedpublic sector employment, wil.l raise personnel services by 52Z. Interest ondomestic and external debt isa expected to increase by 25%, and overall expen-ditures by 36% (see Table 2.3). Meeting these targets may not be possible,however, given the limited fl.exibility of the tax base and other sources ofrevenues.
Table 2.3: EXPEM1LIRES OF NATTONAL GOVERNMENT. 1978-1988(in Million Pesos)
_-1988 191Particulars 1983 1984 1985 1986 1987 (est.) %
Current Expenditures 84,489 42,995 56,006 70,950 92,301 118,200 98.2Personal Services 14,282 18,829 22,046 28,527 31,050 41,900 a1.8Maintenance and Operating 11,716 10,448 13,788 16,448 17,442 20,000 16.2National Revenue Sharingto LOUs 2,598 2,795 8,622 8,882 8,884 4,400 8.8
Interest Payments 4,997 10,409 14,409 21,612 86,908 46,900 84.8Subsidies 897 1,018 998 1,645 2,021 2,200 1.7Tax Expenditures n.a. n.a. n.a. 441 1,049 1,800 1.4
Capital Outlays 9,9st 7,490 10,977 9,736 11,111 15,800 11.8Infrastructure 6,066 4,265 8,098 5,081 8,611 8,200 6.2Other Captiel Outlays 8,868 8,228 4,879 8,906 4,600 6,200 4.7
Net Lending andCorporate Equity 7,968 18,652 17,307 27,870 11,808 8,600 6.4
Total Expenditures 52,360 84,087 88,290 108,068 114,718 181,800 100.0Debt Amortization 8,461 4,588 4,100 8,449 82,920 34,200
Total Expenditures andDebt Amortization 56,611 68,625 87,890 114,606 147,638 186,000
% of GNPCurrent Expenditure 9.1 8.2 9.2 11.6 13.1 14.80*M Expenditure 8.1 2.0 2.3 2.6 2.6 2.6Interest Payments 1.8 2.0 2.6 8.6 6.2 6.8Capitol Expenditure 2.6 1.4 1.8 1.6 1.6 1.9
Source: Department of Budget and Management
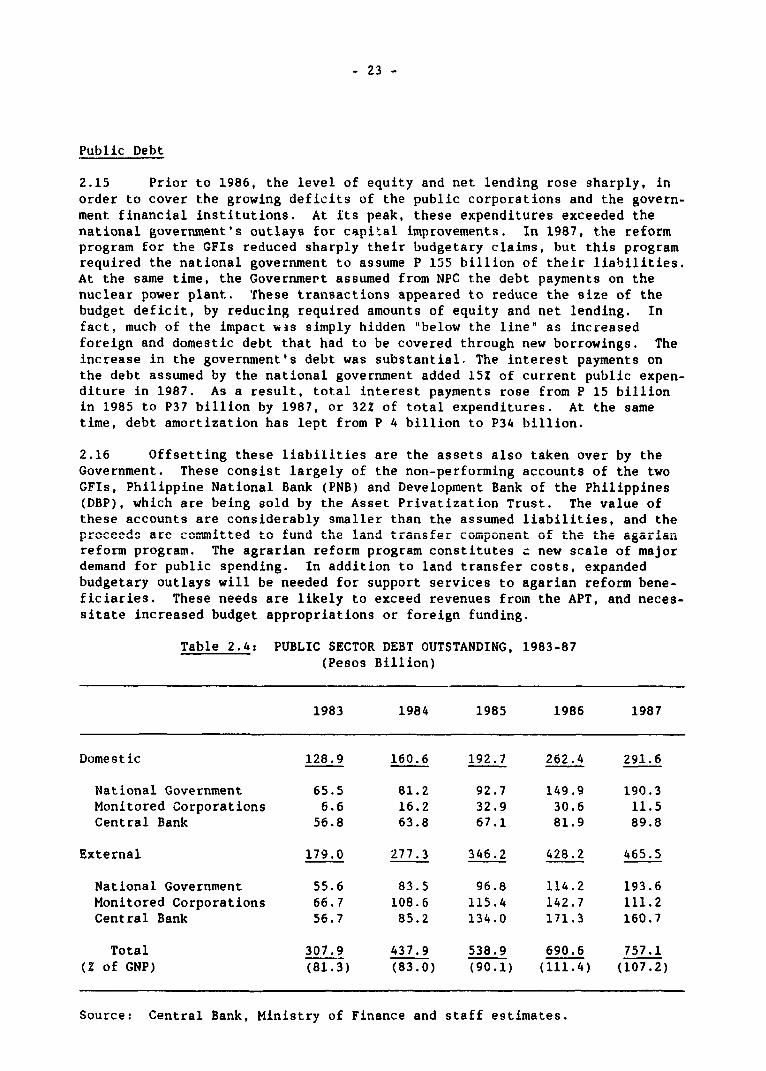
- 23 -
Public Debt
2.15 Prior to 1986, the level of equity and net lending rose sharply, inorder to cover the growing deficits of the public corporations and the govern-ment financial institutions. At its peak, these expenditures exceeded thenational government's outlays for capital improvements. In 1987, the reformprogram for the GFIs reduced sharply their budgetary claims, but this programrequired the national government to assume P 155 billion of their liabilities.At the same time, the Governmert assumed from NPC the debt payments on thenuclear power plant. 'rhese transactions appeared to reduce the size of thebudget deficit, by reducing required amounts of equity and net lending. Infact, much of the impact wis simply hidden 'below the line" as increasedforeign and domestic debt that had to be covered through new borrowings. Theincrease in the government's debt was substantial. The interest payments onthe debt assumed by the national government added 152 of current public expen-diture in 1987. As a result, total interest payments rose from P 15 billionin 1985 to P37 billion by 1987, or 32Z of total expenditures. At the sametime, debt amortization has lept from P 4 billion to P34 billion.
2.16 Offsetting these liabilities are the assets also taken over by theGovernment. These consist largely of the non-performing accounts of the twoGFIs, Philippine National Bank (PNB) and Development Bank of the Philippines(DBP), which are being sold by the Asset Privatization Trust. The value ofthese accounts are considerably smaller than the assumed liabilities, and theproceeds are committed to fund the land transfer cosmiponent of the the agariarnreform program. The agrarian reform program constitutes a new scale of majordemand for public spending. In addition to land transfer costs, expandedbudgetary outlays will be needed for support services to agarian reform bene-ficiaries. These needs are likely to exceed revenues from the APT, and neces-sitate increased budget appropriations or foreign funding.
Table 2.4: PUBLIC SECTOR DEBT OUTSTANDING, 1983-87(Pesos Billion)
1983 1984 1985 1986 1987
Domestic 128.9 160.6 192.7 262.4 291.6
National Government 65.5 81.2 92.7 149.9 190.3Monitored Corporations 6.6 16.2 32.9 30.6 11.5Central Bank 56.8 63.8 67.1 81.9 89.8
External 179.0 277.3 346.2 428.2 465.5
National Government 55.6 83.5 96.8 114.2 193.6Monitored Corporations 66.7 108.6 115.4 142.7 111.2Central Bank 56.7 85.2 134.0 171.3 160.7
Total 307.9 437.9 538.9 690.6 757.1(Z of GNP) (81.3) (83.0) (90.1) (111.4) (107.2)
Source: Central Bank, Ministry of Finance and staff estimates.
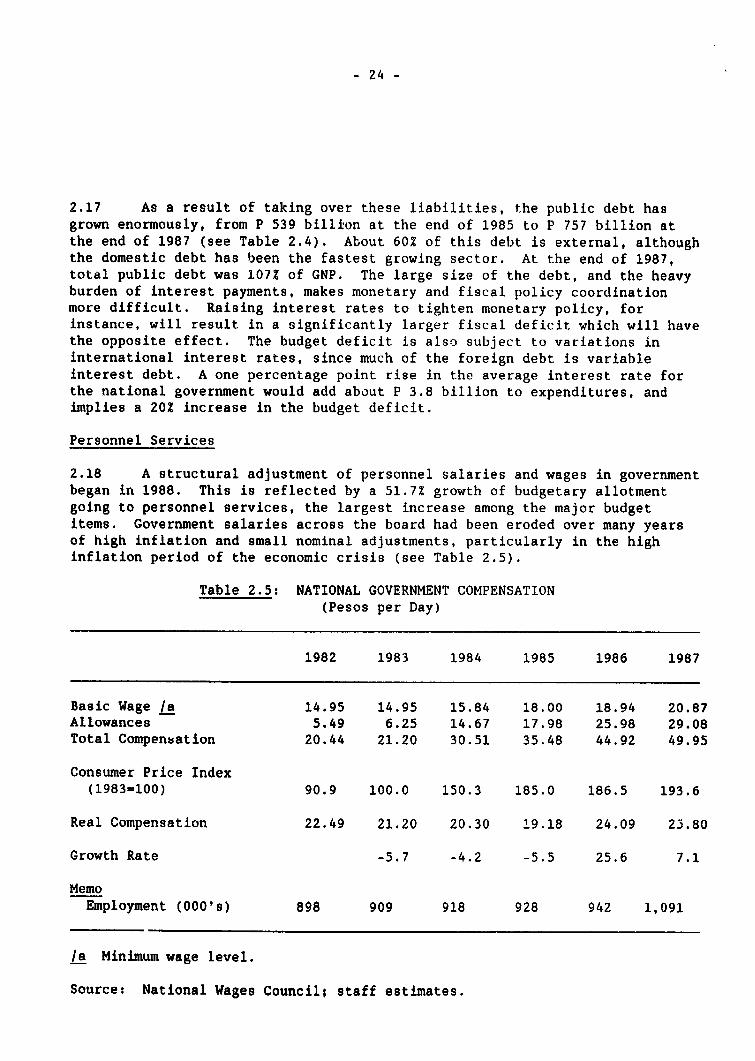
- 24 -
2.17 As a result of taking over these liabilities, the public debt hasgrown enormously, from P 539 billion at the end of 1985 to P 757 billion atthe end of 1987 (see Table 2.4). About 60% of this debt is external, althoughthe domestic debt has been the fastest growing sector. At the end of 1987,total public debt was 1072 of GNP. The large size of the debt, and the heavyburden of interest payments, makes monetary and fiscal policy coordinationmore difficult. Raising interest rates to tighten monetary policy, forinstance, will result in a significantly larger fiscal deficit which will havethe opposite effect. The budget deficit is also subject to variations ininternational interest rates, since much of the foreign debt is variableinterest debt. A one percentage point rise in the average interest rate forthe national government would add about P 3.8 billion to expenditures, andimplies a 20% increase in the budget deficit.
Personnel Services
2.18 A structural adjustment of personnel salaries and wages in governmentbegan in 1988. This is reflected by a 51.7Z growth of budgetary allotmentgoing to personnel services, the largest increase among the major budgetitems. Government salaries across the board had been eroded over many yearsof high inflation and small nominal adjustments, particularly in the highinflation period of the economic crisis (see Table 2.5).
Table 2.5: NATIONAL GOVERNMENT COMPENSATION(Pesos per Day)
1982 1983 1984 1985 1986 1987
Basic Wage /a 14.95 14.95 15.84 18.00 18.94 20.87Allowances 5.49 6.25 14.67 17.98 25.98 29.08Total Compensation 20.44 21.20 30.51 35.48 44.92 49.95
Consumer Price Index(1983=100) 90.9 100.0 150.3 185.0 186.5 193.6
Real Compensation 22.49 21.20 20.30 19.18 24.09 23.80
Growth Rate -5.7 -4.2 -5.5 25.6 7.1
MemoEmployment (000's) 898 909 918 928 942 1,091
/a Minimum wage level.
Source: National Wages Council; staff estimates.
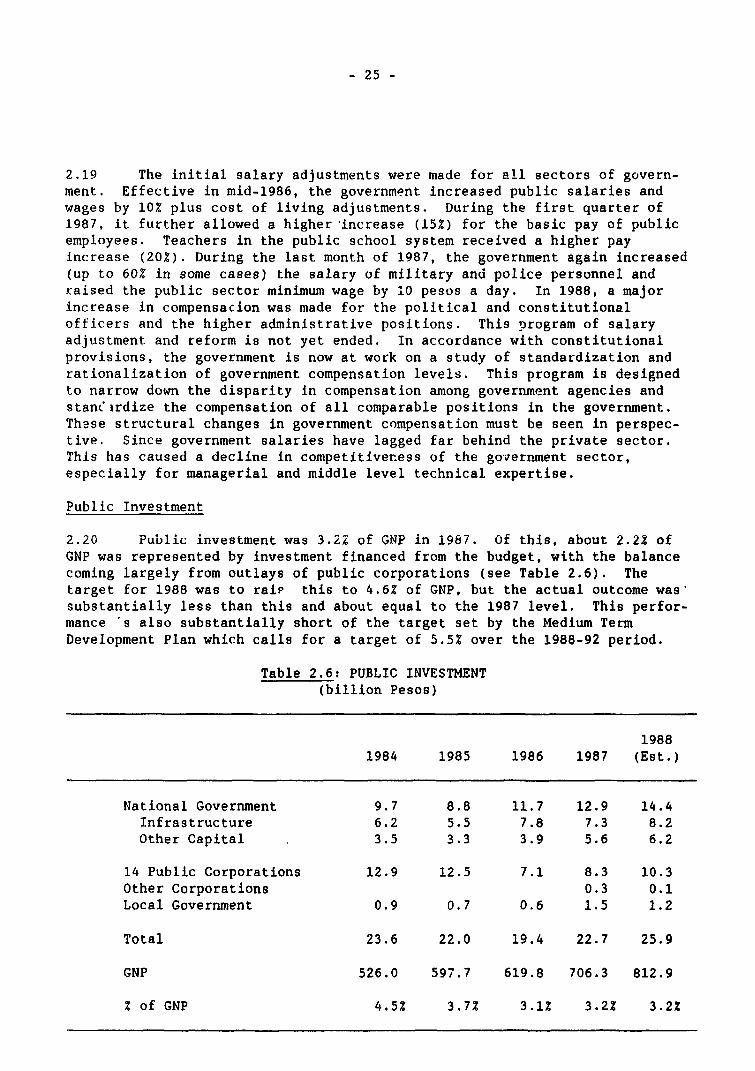
- 25 -
2.19 The initial salary adjustments were made for all sectors of govern-ment. Effective in mid-1986, the government increased public salaries andwages by 10% plus cost of living adjustments. During the first quarter of1987, it further allowed a higher increase (152) for the basic pay of publicemployees. Teachers in the public school system received a higher payincrease (20Z). During the last month of 1987, the government again increased(up to 60% in some cases) the salary of military and police personnel andraised the public sector minimum wage by LO pesos a day. In 1988, a majorincrease in compensacion was made for the political and constitutionalofficers and the higher administrative positions. This program of salaryadjustment and reform is not yet ended. In accordance with constitutionalprovisions, the government is now at work on a study of standardization andrationalization of government compensation levels. This program is designedto narrow down the disparity in compensation among government agencies andstanCirdize the compensation of all comparable positions in the government.These structural changes in government compensation must be seen in perspec-tive. Since government salaries have lagged far behind the private sector.This has caused a decline in competitiveness of the government sector,especially for managerial and middle level technical expertise.
Public Investment
2.20 Public investment was 3.2Z of GNP in 1987. Of this, about 2.2Z ofGNP was represented by investment financed from the budget, with the balancecoming largely from outlays of public corporations (see Table 2.6). Thetarget for 1988 was to raip this to 4.6% of GNP, but the actual outcome wassubstantially less than this and about equal to the 1987 level. This perfor-mance 's also substantially short of the target set by the Medium TermDevelopment Plan which calls for a target of 5.5X over the 1988-92 period.
Table 2.6: PUBLIC INVESTMENT(billion Pesos)
19881984 1985 1986 1987 (Est.)
National Government 9.7 8.8 11.7 12.9 14.4Infrastructure 6.2 5.5 7.8 7.3 8.2Other Capital 3.5 3.3 3.9 5.6 6.2
14 Public Corporations 12.9 12.5 7.1 8.3 10.3Other Corporations 0.3 0.1Local Government 0.9 0.7 0.6 1.5 1.2
Total 23.6 22.0 19.4 22.7 25.9
GNP 526.0 597.7 619.8 706.3 812.9
Z of GNP 4.5% 3.7X 3.1% 3.2% 3.22
- 26 -
2.21 The failure to achieve a higher investment duting 1986-88 reflectsvarious factors, including those related to the transitional problems asso-ciated with a change in government. Given the abrupt nature of the change ingovernment in 1986, the accompanying personnel changes had been drastic in thecase of some departments and bureaus, affecting critical senior and middle-level personnel. A rapid succession of turnovers of top leadership of somedepartments also contributed to this problem. There were five changes indepartment secretaries in DPWH, for instance, between 1986 and 1988. Suchdevelopments naturally caused unintended delays in the flow of majordecisions.
2.22 Implementation delays have adversely affected disbursement of invest-ment projects financed by project loans secured from multilateral andbilaterai development agencies. In 1985 and 1986, the availment rate againstschedule was 62Z. In 1987, this rate improved slightly to 66%. The rateitself reflects actual performance against planned performance, and is notcompletely accurat- measure of project performance. Nevertheless, the failureto implement projects on their original schedules reduces the amount offoreign capital inflow in the balance of payments, and reduces the williAignessof donors to make funds available new projects. The problems associated withforeign-financed projects has been the major thrust behind the efforts of thePhilippine government to undertake the corrective actions.
Administrative Improvements
2.23 During the past year, the Government has a number of actions designedto remove obstacles to the smooth flow of decisions, and accelerate the use offoreign loans.
2.24 Project Facilitation Committee (PFC). The main function of the PFCis to study the causes of these delays and to address them systematically.The major departments and agencies having a role in the of financing andimplementation of public investment projects are represented on thiscommittee, making it possible to identify and help resolve issues of coordina-tion at agency and project levels.
2.25 Budgeting. The major innovation in the budgeting system for fundingpublic investment projects is the use of a "common fund" within the agency.Previously, cash disbursement ceilings were undertaken on a per project basis,and fast moving projects could be financed only within their project cashdisbursement ceilings until their subsequent replenishment. Under the newmethod of funding warrants, the head of the department or agency level has theflexibility to allocate funds among projects, depending on their disbursementrates. This can be done so long as the total agency ceiling is not exceeded.In effect, the faster moving projects are able to borrow from the slowermoving projects within the agency's funding warrants for its pool of projects.
2.26 One side effect of this new funding system is that agencies nowappear to have a surplus of funds on hand. The OBM (Office of Budget andManagement) has released funds based on agencies' plans, but this has provedto be much more than warranted by the capacity of agencies to spend. Thus, a
- 27 -
large "float" of cash was put in the hands of a few government depositorybanks. By mid 1988. this float was estimated by the Treasury to be 8 billionpesos. At the same time that the Treasury has to borrow funds to finance partof the fiscal deficit from the banking system, some banks are able to use partof these government deposits to purchase government debt. As a result, theTreasury is borrowing back its own money, and paying banks 14-152 interest inthe process. Reduction in this float will be necessary in order to controlthe interest cost to the budget.
2.27 Contract delegation. The authority for contract signing was delega-ted to the departments and to corporate boards in a substantial wey. This wasdesigned to promote a decentralization of decision-making in government. Theadministrative delegation raised the threshold levels of contracts that can beapproved by the department secretary and the governing boards of public corpo-rations. Likewise, projects costing three million pesos or less can beapproved by the regional director of DPWH,4/ rather than the central office,an increase f:rom the previous level of one-half million pesos. This effectivedelegation has caused 90Z of all the infrastructure projects in 1987 to beapprovable at the regional level. In terms of the value of these contracts,they represent about one-half of the total funding requirements of theinfrastructure budget. This move assists the decentralization of authorityof the infrastructure agencies and also immensely contributes to theregionalization thrust of the government. As disctssed in the section onregionalization efforts, however, more needs to be done to encourage greaterlocal initiative.
2.28 Auditing. Earlier changes in auditing procedures in 1986 raised theamount of auditing of infrastructure projects to the point that some paralysisin project disbursements were experienced. An increase in auditing vigilancewas a welcome and natural development of a change in government. However, thepreaudit function prior to release of payment was exercised through routinebillings, thus causing considerable delays. In late 1987, the Commission onAudit made pre-auditing a requirement only on the last 15Z of payment for acontract; the remainder of the contract is now only subject to post-audit.
Future Public Investment
2.29 The goals of the Government's Medium-Term Development Plan(1988-1992) are given as: an acceleration of growth and improved economicefficiency; reduced government involvement in the economy and emphasis onprivate initiative; and greater attention to poverty alleviation and socialjustice. The Plan emphasizes the priority to be given to rural-based develop-ment, agriculture and the growth of exports.
2.30 The medium-term public investment program calls for public investmentexpenditures of P 291.5 billion (1988 prices) during the five-year periodending in 1992. Public investments as a percent of total investment is
4/ Department of Public Works and Highways, the most important of thepublic infrastructure departments.
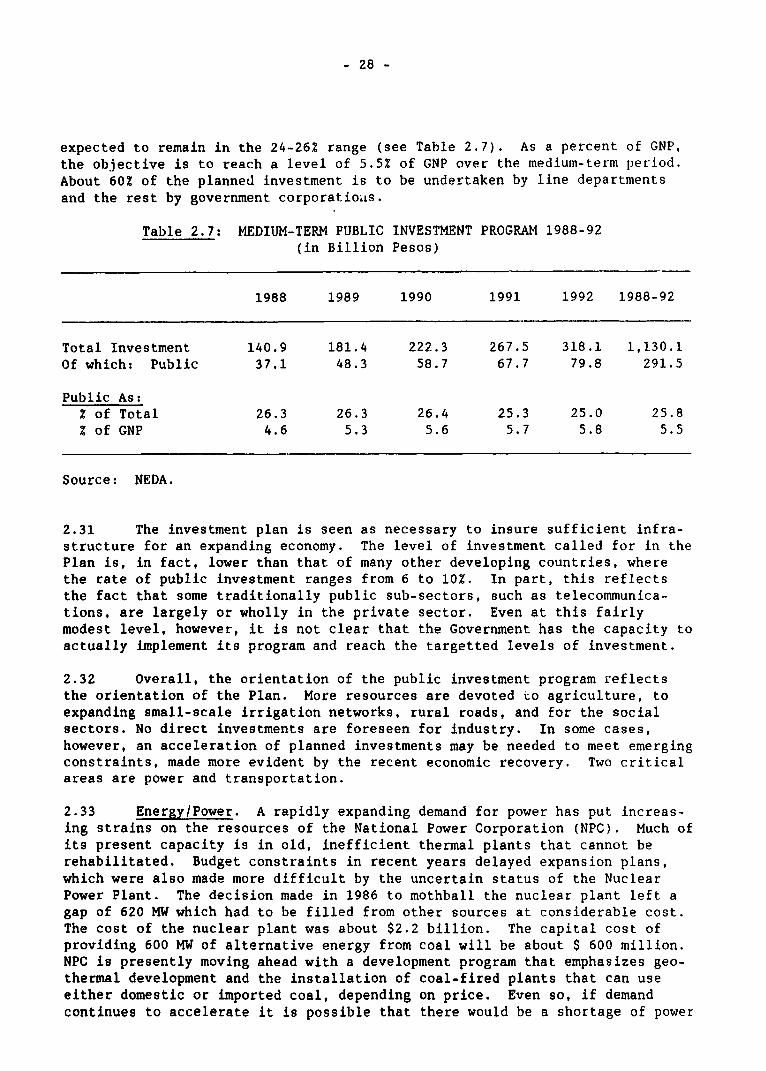
- 28 -
expected to remain in the 24-26X range (see Table 2.7). As a percent of GNP,the objective is to reach a level of 5.5% of GNP over the medium-term period.About 60Z of the planned investment is to be undertaken by line departmentsand the rest by government corporatioaLs.
Table 2.7: MEDIUM-TERM PUBLIC INVESTMENT PROGRAM 1988-92(in Billion Pesos)
1988 1989 1990 1991 1992 1988-92
Total Investment 140.9 181.4 222.3 267.5 318.1 1,130.1Of which: Public 37.1 48.3 58.7 67.7 79.8 291.5
Public As:Z of Total 26.3 26.3 26.4 25.3 25.0 25.8Z of GNP 4.6 5.3 5.6 5.7 5.8 5.5
Source: NEDA.
2.31 The investment plan is seen as necessary to insure sufficient infra-structure for an expanding economy. The level of investment called for in thePlan is, in fact, lower than that of many other developing countries, wherethe rate of public investment ranges from 6 to 10Z. In part, this reflectsthe fact that some traditionally public sub-sectors, such as telecommunica-tions, are largely or wholly in the private sector. Even at this fairlymodest level, however, it is not clear that the Government has the capacity toactually implement its program and reach the targetted levels of investment.
2.32 Overall, the orientation of the public investment program reflectsthe orientation of the Plan. More resources are devoted to agriculture, toexpanding small-scale irrigation networks, rural roads, and for the socialsectors. No direct investments are foreseen for industry. In some cases,however, an acceleration of planned investments may be needed to meet emergingconstraints, made more evident by the recent economic recovery. Two criticalareas are power and transportation.
2.33 Energy/Power. A rapidly expanding demand for power has put increas-ing strains on the resources of the National Power Corporation (NPC). Much ofits present capacity is in old, inefficient thermal plants that cannot berehabilitated. Budget constraints in recent years delayed expansion plans,which were also made more difficult by the uncertain status of the NuclearPower Plant. The decision made in 1986 to mothball the nuclear plant left agap of 620 MW which had to be filled from other sources at considerable cost.The cost of the nuclear plant was about $2.2 billion. The capital cost ofproviding 600 MW of alternative energy from coal will be about $ 600 million.NPC is presently moving ahead with a development program that emphasizes geo-thermal development and the installation of coal-fired plants that can useeither domestic or imported coal, depending on price. Even so, if demandcontinues to accelerate it is possible that there would be a shortage of power
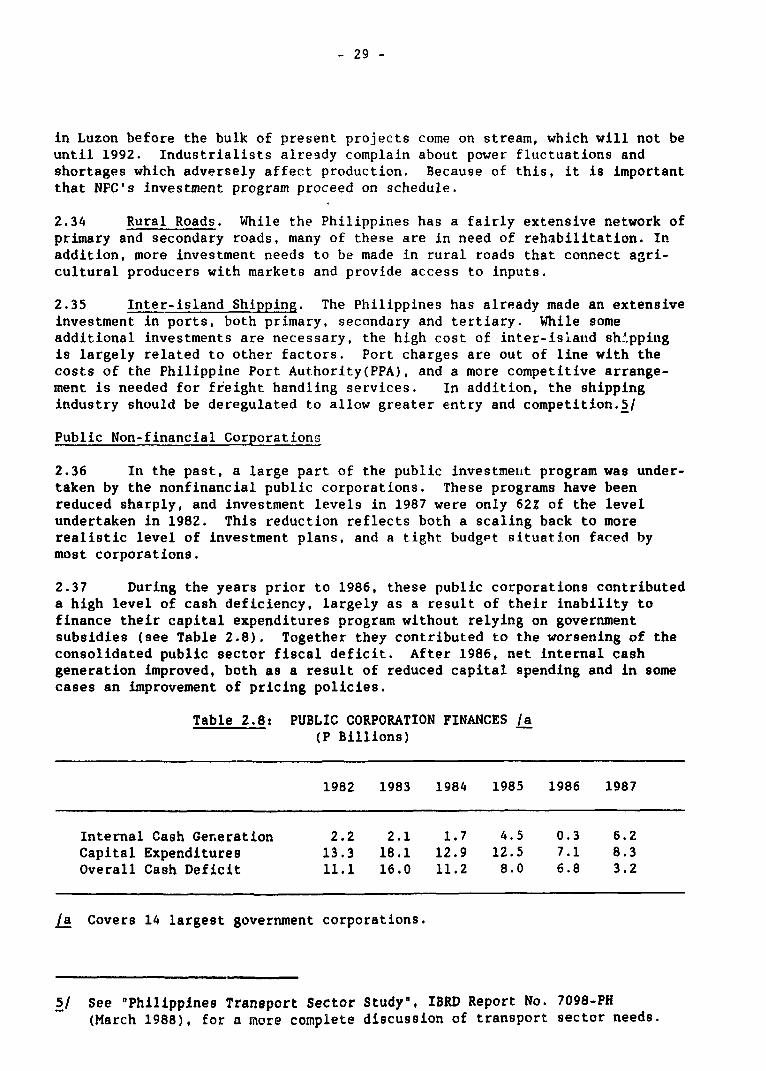
- 29 -
in Luzon before the bulk of present projects come on stream, which will not beuntil 1992. Industrialists already complain about power fluctuations andshortages which adversely affect production. Because of this, it is importantthat NPC's investment program proceed on schedule.
2.34 Rural Roads. While the Philippines has a fairly extensive network ofprimary and secondary roads, many of these are in need of rehabilitation. Inaddition, more investment needs to be made in rural roads that connect agri-cultural producers with markets and provide access to inputs.
2.35 Inter-island Shipping. The Philippines has already made an extensiveinvestment in ports, both primary, secondary and tertiary. While someadditional investments are necessary, the high cost of inter-islalnd shippingis largely related to other factors. Port charges are out of line with thecosts of the Philippine Port Authority(PPA), and a more competitive arrange-ment is needed for freight handling services. In addition, the shippingindustry should be deregulated to allow greater entry and competition.5/
Public Non-financial Corporations
2.36 In the past, a large part of the public investmelnt program was under-taken by the nonfinancial public corporations. These programs have beenreduced sharply, and investment levels in 1987 were only 62Z of the levelundertaken in 1982. This reduction reflects both a scaling back to morerealistic level of investment plans, and a tight budgpt situation faced bymost corporations.
2.37 During the years prior to 1986, these public corporations contributeda high level of cash deficiency, largely as a result of their inability tofinance their capital expenditures program without relying on governmentsubsidies (see Table 2.8). Together they contributed to the worsening of theconsolidated public sector fiscal deficit. After 1986, net internal cashgeneration improved, both as a result of reduced capital spending and in somecases an improvement of pricing policies.
Table 2,8: PUBLIC CORPORATION FINANCES /a(P Billions)
1982 1983 1984 1985 1986 1987
Internal Cash Generation 2.2 2.1 1.7 4.5 0.3 6.2Capital Expenditures 13.3 18.1 12.9 12.5 7.1 8.3Overall Cash Deficit 11.1 16.0 11.2 8.0 6.8 3.2
/a Covers 14 largest government corporations.
5/ See "Philippines Transport Sector Study", IBRD Report No. 7098-PH(March 1988), for a more complete discussion of transport sector needs.
- 30 -
2.38 Since 1983, the Government has taken a number of steps to bring thepublic corporations under tighter central control, and to limit their prolife-ration. In the past, Government departments often set up corporations inorder to avoid financial., budgetary and auditing controls of the centralgovernment. Under policies adopted since 1986, and all corporations are tobecome financially independent, have minimal government support, and operatewithout any special privelege or assistance. Government interventions ingeneral are to be limited to those areas not undertaken by the private sector,which are vital to society, or which assist some disadvantaged group. Thus,corporations not fitting these criteria will be abolished or privatized (seebelow). As part of the move to financial autonomy, corporations are requiredto pay dividends equal to 52 of their net earnings, and to pay market interestrates on new borrowings from the Government.
2.39 A more thorny problem relates to the pricing of other Eervices soldto the general public which has been used to receiving subsidized prices. Oneproblem inherent in the pricing policy is the adjustment to inflation. Anindexation formula needs to be worked out to provide automatic adjustments.One problem complicating the tariff setting for these enterprises is theexistence of cross-subsidies, common in the setting of power rates andcharges for urban water supply. Mainly devised as an equity measure, thesecross-subsidies tax the industrial and commercial sectors in order to providehouseholds with service at prices below cost. Even 50, there are doubts abouttheir effectiveness in targetting the right groups.
2.40 Another factor is the need to improve operational efficiency. Lossesin the delivery of services is common to the water and irrigation agencies,for instance. An improvement of these problems could mean increased revenuesor at least smaller operating costs. A more important issue, however, is thecollect'on efficiency for receivables. The presence of arrears is a majorproblem for some of the major public corporations. This is significant forthe power sector (NPC and NEA), irrigation (NIA), and waterworks and sewerage(MWSS). In the case of the NPC, some of the arrearages are not only owed bysegments of the public sector (other government agencies and corporations andlocal governments) but also by relatively large private enterprises (includingelectrification cooperatives). The irrigation agency has been saddledperennially by a large collection problem, and raising the fees for irrigationonly penalizes the good clients but further subsidizes the delinquent user ofirrigation services. The receivables of some of these major corporations, forinstance that of NPC, have been reduced recently. But more effort on thisfront is needed to improve the finances of the cotporations.
2.41 Privatization. In 1987, the Government finalized its program for therationalization of government corporate sector. Under this program, 133corporations (CG) will be sold to the private sector, 65 abolished, 15 mergedwith other corporations, and seven converted into private foundations. Formalapproval has already been given for the privatization of 102 corporations, theremaining 32 are awaiting final approval by the President. Once this plan iscarried out, only 37 government corporations would remain, although these are
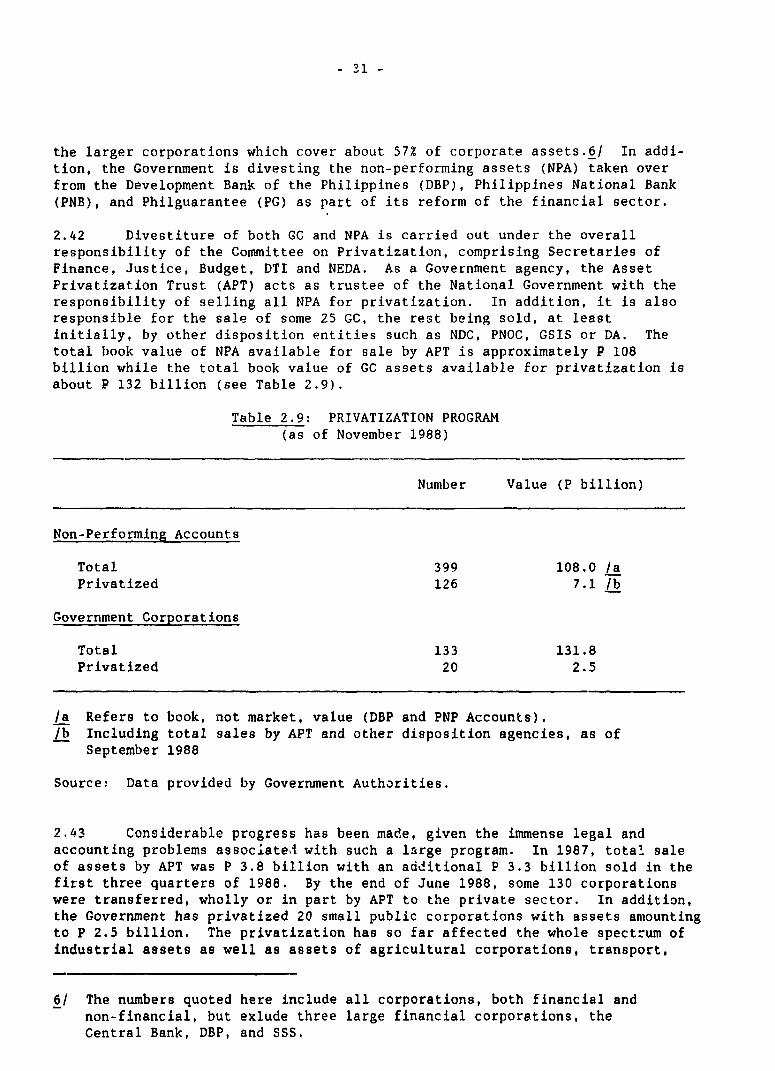
- 31 -
the larger corporations which cover about 57% of corporate assets.6/ In addi-tion, the Government is divesting the non-performing assets (NPA) taken overfrom the Development Bank of the Philippines (DBP), Philippines National Bank(PNB), and Philguarantee (PG) as part of its reform of the financial sector.
2.42 Divestiture of both GC and NPA is carried out under the overallresponsibility of the Committee on Privatization, comprising Secretaries ofFinance, Justice, Budget, DTI and NEDA. As a Government agency, the AssetPrivatization Trust (APT) acts as trustee of the National Government with theresponsibility of selling all NPA for privatization. In addition, it is alsoresponsible for the sale of some 25 GC, the rest being sold, at leastinitially, by other disposition entities such as NDC, PNOC, GSIS or DA. Thetotal book value of NPA available for sale by APT is approximately P 108billion while the total book value of GC assets available for privatization isabout P 132 billion (see Table 2.9).
Table 2.9: PRIVATIZATION PROGRAM(as of November 1988)
Number Value (P billion)
Non-Performing Accounts
Total 399 108.0 /aPrivatized 126 7.1 /b
Government Corporations
Total 133 131.8Privatized 20 2.5
/a Refers to book, not market, value (DBP and PNP Accounts).lb Including total sales by APT and other disposition agencies, as of
September 1988
Source: Data provided by Government Authorities.
2.43 Considerable progress has been made, given the immense legal andaccounting problems associateA with such a large program. In 1987, total saleof assets by APT was P 3.8 billion with an additional P 3.3 billion sold in thefirst three quarters of 1988. By the end of June 1988, some 130 corporationswere transferred, wholly or in part by APT to the private sector. In addition,the Government has privatized 20 small public corporations with assets amountingto P 2.5 billion. The privatization has so far affected the whole spectrum ofindustrial assets as well as assets of agricultural corporations, transport,
6/ The numbers quoted here include all corporations, both financial andnon-financial, but exlude three large financial corporations, theCentral Bank, DBP, and SSS.
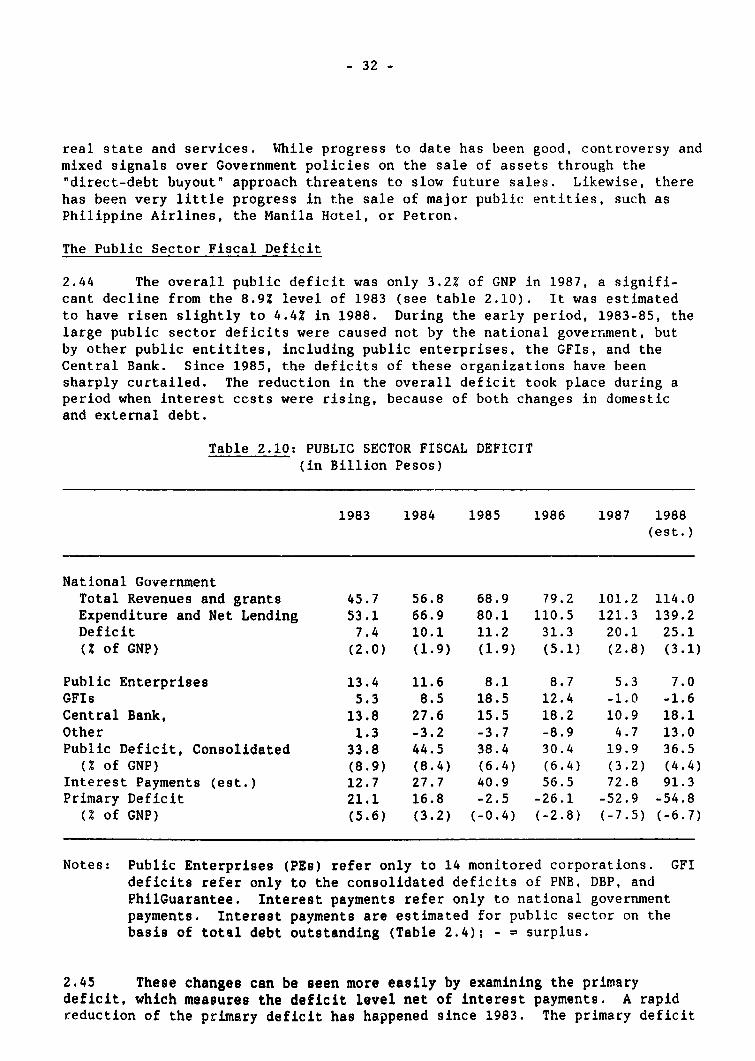
- 32 -
real state and services. While progress to date has been good, controversy andmixed signals over Government policies on the sale of assets through the"direct-debt buyout" approach threatens to slow future sales. Likewise, therehas been very little progress in the sale of major public entities, such asPhilippine Airlines, the Manila Hotel, or Petron.
The Public Sector Fiscal Deficit
2.44 The overall public deficit was only 3.2% of GNP in 1987, a signifi-cant decline from the 8.9Z level of 1983 (see table 2.10). It was estimatedto have risen slightly to 4.4% in 1988. During the early period, 1983-85, thelarge public sector deficits were caused not by the national goverrLment, butby other public entitites, including public enterprises, the GFIs, and theCentral Bank. Since 1985, the deficits of these organizations have beensharply curtailed. The reduction in the overall deficit took place during aperiod when interest ccsts were rising, because of both changes in domesticand external debt.
Table 2.10: PUBLIC SECTOR FISCAL DEFICIT(in Billion Pesos)
1983 1984 1985 1986 1987 1988(est.)
National GovernmentTotal Revenues and grants 45.7 56.8 68.9 79.2 101.2 114.0Expenditure and Net Lending 53.1 66.9 80.1 110.5 121.3 139.2Deficit 7.4 10.1 11.2 31.3 20.1 25.1(% of GNP) (2.0) (1.9) (1.9) (5.1) (2.8) (3.1)
Public Enterprises 13.4 11.6 8.1 8.7 5.3 7.0GFIs 5.3 8.5 18.5 12.4 -1.0 -1.6Central Bank, 13.8 27.6 15.5 18.2 10.9 18.1Other 1.3 -3.2 -3.7 -8.9 4.7 13.0Public Deficit, Consolidated 33.8 44.5 38.4 30.4 19.9 36.5(% of GNP) (8.9) (8.4) (6.4) (6.4) (3.2) (4.4)
Interest Payments (est.) 12.7 27.7 40.9 56.5 72.8 91.3Primary Deficit 21.1 16.8 -2.5 -26.1 -52.9 -54.8(% of GNP) (5.6) (3.2) (-0.4) (-2.8) (-7.5) (-6.7)
Notes: Public Enterprises (PEs) refer only to 14 monitored corporations. GFIdeficits refer only to the consolidated deficits of PNB, DBP, andPhilGuarantee. Interest payments refer only to national governmentpayments. Interest payments are estimated for public sector on thebasis of total debt outstanding (Table 2.4); - = surplus.
2.45 These changes can be seen more easily by examining the primarydeficit, which measures the deficit level net of interest payments. A rapidreduction of the primary deficit has happened since 1983. The primary deficit
- 33 -
was 5.6% percent of GNP in 1983, but by 1987 had turned into a surplus of over7Z of GNP. The main reason for this trend has been the rise in the interestpayments on the large domestic and foreign debt, which in 1987 equalled 107%of GNP. Thus, the non-interest portion of the public sector has been forcedto generate a surplus to cover rising interest payments. Even if the publicsector deficit is controlled, if interest rates on debt exceed the nominalgrowth of GNP, the primary deficit will fall further, putting additionalstrain on other expenditure items.
Decentralization and Regional Development
2.46 The 1987 Constitution provides for increased decentralization andlocal autonomy through strengthened local government institutions. Governmen-tal decentralization is seen as necessary to make government institutions moreresponsive to regional needs, and to support regional development efforts,particularly in rural areas, and to increase the level of participation in thedevelopment effort. The Constitution provides, in a general way for indepen-dent local government units, regional development councils, revenue sharingwith the national government, and the development of local sources of revenue.However, the precise nature of each is left to the Congress to define.
2.47 In keeping with this mandate, the Government has taken a number ofsteps to strengthen local government and decentralize national governmentpowers. A number of national government departments have set up regionalorganizations (including DPWH, OBM, DTI, DA and MOH). The Cabinet Officersfor Regional Development (CORDs) system was established, whereby cabinetofficers are designated to represent the President in a particular region, andprovide a direct link between the President and various regional andsubregional institutions. In addition, a new local government code has beendrafted and sent to Congress, but not yet passed. This code will more clearlydefine center-local relations, particularly in improving accountability,responsiveness and allocation of powers and responsibilities to localgovernment units.
2.48 The Regional Development Councils (RDCs) have been strengthened,their composition more clearly defined, private sector representatives added,and a mechanism introduced to provide a link to Congress. The RDCs wereinitially established in 1972 for each of the country's 13 regions. They aremade up of the provincial governors, mayors and government officials within aregion, with the head of the NEDA regional office serving a permanent vice-chairman. Their purpose is to develop regional plans based on local needs,which in turn become part of the national economic development plan. The RDCsare supported by local development councils at the municipal, district andbarangay level and by the NEDA regional offices, which provide staff support.
2.49 While some progress has been made, effective power has not yetdevolved to the regions and local goveruments. While the RDCs serve a usefulconsultative mechanism, they lack the staff to develop new projects fully, andlack control over actual expenditures. The regional development plans tend tobe broad and indicative in nature, reflecting the inability of the RDC's todevelop projects and set priorities. Expenditure priorities continue to bedetermined by the central offices of various government departments, not theRDCs or the local governments. While many departments have shifted part oftheir staffs to regional offices, they are often unwilling to shift signifi-
- 34 -
cant amounts of authority to these offices, or to allow these staffs to comeunder the jurisdiction of local officials. In 1988 budget, for instance,local government units control only about 4% of the total public investmentprogram- Many of the expenditures of local governments are mandatecl by law,limiting their flexibility in shifting expenditures between different func-tions. The Government is developing a plan, however, which would allow forthe control over the functions of three departments (Public Works,Agriculture, Health) to be given to the provincial governments in threeprovinces on a trial basis.
2.50 The autonomy of local governments is limited by their ability todevelop independent sources of revenues. In 1987, the national government,through revenue sharing and direct grants, provided over 70% of the totalrevenues of local government units. In many cases, local governments fail toadequately tap tax bases which are within their jurisdiction, because offaulty administration and low tax rates. Real property tax collections, forinstance, are about 55-65% of potential and assessments are often outdated orinaccurate.
2.51 The pace of decentralization will be limited by the ability ofregional governments to accept greater responsibility and to exercise thisresponsibility prudently. Steps will have to be taken to improve the adminis-trative capabilities of local units, through retraining and upgrading of localstaff. An effective program of decentralization, however, can go far toimprove the operating efficiency and effectiveness of Government services.
Conclusion
2.52 The public sector is faced with serious and complex problems. Thereare urgent needs which must be met through increased expenditures, includingimproved infrastruc.ure services and provision of basic needs for the poor.At the same time, further efforts at tax reform are likely to lower totalrevenues unless alternative tax bases can be developed, or the present systemmade more efficient. The large deficits of the past have led to accumulateddomestic debt which presents a major burden on the budget. At present levels,government borrowings are diverting private savings into public consumption.The need to simultaneously reduce the deficit and increase expenditurespresents a difficult challenge to the tax system. While present tax rates areadequate by most standards, there are serious shortfalls in collectionefficiency that undercuts the revenue effort. Unless a significant improve-ment in tax collection is undertaken, the future is likely to see a continua-tion of large deficits and reduced ability to undertake investment and socialsector programs.
- 35 -
Chapter IIANNEXPage 1 of 5
THE 'VALUE ADDED TAX
1. The value-added tax, which took effect in January 1988, is thecenterpiece of the tax reform program undertaken by the new government. TheVAT that was put in place is consumption-based, imposed on the principle offinal destination (i.e., on the final user and not on the source of supply),and comprehensive (i.e., applicable to the retail sector). The rate of theVAT is a uniform IOZ ad valorem, with the standard use of zero-rating, in thecase of exports. In keeping with the consumption-based design, taxes oncapital eouipment purchases can be credited against tax payments. Thus,investment goods are free of the tax on value added. Likewise, exp,orts arefree of tax and imports are taxed in keeping with the destination principle.
2. Certain sectors and businesses are exempted from the VAT. Thisincludes a range of agricultural inputs and small businesses, in keeping withthe traditional treatment of these hard-to-tax sectors. Enterprises with aturnover exceeding two hundred thousand pesos are required to register as VATenterprises. Government purchases and sales are treated as normaltransactions.
3. The VAT replaced a number of major taxes, notably, the sales tax, thecompensating tax, the (manufacturer's) advance sales tax, the sales turnovertax, and other fixed taxes. These taxes comprise the significant indirecttaxes imposed on commodities that are consumed in the countLy. Some types ofservice were brought under the VAT, including construction contractors,millers and brokers (which were originally under separate taxation). Finan-cial services such as banking and insurance are taxed outside of the VATsystem. This is also the case with a number of services that continue to betaxed under their present percentage taxes.
Assessing the early implementation of the VAT
4. The VAT was originally set for implementation after a program ofscheduled preparatory work could be undertaken. Specifically, these stepsincluded the registration campaign for VAT enterprises, explaining its proce-dures and, in general, making the tax more widely understood and appreciated.In addition, the internal revenue administration also required upgrading forthe task of implementing the VAT tax and redeploying administrative resourcesaway from the implementation of the abolished taxes.
5. These steps required time and effort prior to the effectivity ofimplementation. The implementation schedule therefore was set towards thelast quarter of 1988. Sometime in 1987, the government decided that the taxcould be implemented sooner and therefore the effectivity was advanced toJanuary 1988.
6. The VAT is collected by the two revenue arms. The Bureau of Customscollects the import-based VAT. The bulk of the domestic administration of thetax, however, is with the Bureau of Internal Revenue (BIR). The BIR has been
- 36 -
Chapter IIANNEXPage 2 of 5
able to register initially 67,13Z enterprises under the VAT. The VAT regis-trants are classified as Groups A, B, or C, ra.idomly distributed according tothe last digit of their registration numbers. Each group had a differentquarterly filing date, to previde a staggered administrative load. Data forGroup A filers were already available (at the time of the Bank Mission). Of25,495 Group A VAT-registrants, only 14,029 tax returns were filed, or 47Z ofthe Group A registrants.
7. The tax revenues from these returns accounts for 7% of the initialcollection goal of P 8.6 billion for the domestic VAT. (These representedgovernment interagency estimates utilizing a method of calculating VAT returnsfrom interindustry data using the structure of the 1983 input-output table andprojected to the growth rates of demand between 1983 to 1988.) Assuming thisrate of collection for the other groups and projecting for the year, theexpected yield of the VAT for 1988 is P 7.2 billion. This is short by P 1.4billion compared to the initial expectations. In fact, the expected revenueshad already been reduced to P 8 billion by March, reflecting this reducedoptimism, so that current revenue expectations had already taken this intoaccount. Adding the collections of the customs of the VAT at the importlevel, the total expected revenue performance of the VAT is P 13 billion.
8. These expected returns of P 7.2 billion is gross VAT from domesticsales. Although it is expected that much of this collection reflects thetotal net taxes of VAT taxpayers, there is expected to be some tax creditsreimbursed as a result of the tax-credits earned by other enterprises, whichmay require net reimbursements, especially for zero-rated activities. Forinstance, there is a presumptive tax credit of 8% being applied as part of thetransitory provisions of the VAT.
9. While the VAT has now been integrated into the tax system, it isstill to be determined how revenue-productive it will be in the context of therevenues it supplanted. The VAT certainly is to be commended as an improve-ment over the system of sales taxes that it has replaced, more so in terms ofits overall economic effects. There are still features of the current VATwhich requires improvements. The first order of priority, however, is toimprove collection and administration.
Problems Associated with the Initial Implementation of the VAT
10. The initial period of implementation-was accompanied by adversepublicity and hostile reaction, both from the general public and some parts ofthe legislature. The public commentary on the VAT revealed a great deal ofmisunderstanding and misinformation, thus amplifying the need for an adequatepublic information campaign on the implementation of the VAT.
11. The problems of the implementation related to the following: (1) theinterpretation of the VAT laws and regulations; (2) adequacy of administrativepreparation; and (3) level of VAT compliance information campaign.
- 37 -
Chapter IIANNEXPage 3 of 5
Problems Related to VAT Laws and Regulations
12. Although the VAT rules and regulations had been disseminated, it wasinevitable that interpretations and subsequent actions by traders could beinitially confused in some situations. Some traders interpreted the VAT rateas an excuse to raise prices. Many traders misinterpreted the VAT on inputsas an additional cost, which they passed on. Partly because there werevarious taxes replaced each with differing rates, traders were unable to rollback prices by the full amount of indirect taxes replaced by the VAT. Thus,the initial VAT may have been used as an excuse for the rienstallation of thecascading tax process because of misinterpretations. In due time, some ofthese mistakes will be corrected.
13. During the first three months of the VAT, the consumer price indexrose by 7.6Z, indicating a large jump in the index. However, it is not clearhow much of this increas, in the consumer price index is due to the impositionof the VAT.
Administrative Preparation
14. As already stated, a total of 67,132 enterprises registered under theVAT. Although this indicates that a large amount of enterprises had beenreached, it is not possible yet to determine how many potential VAT enter-prises that meet the threshold requirement have registered. The initialreturns for Group A filers which paid tax returns amounted only to 47Z of theregistered filers, thus indicating a low level of initial compliance. This isprobably the result of inadequate preparation due to lack of personnel toattend to the registration.
15. If only to explain the administrative intricacies of the new tax, theBIR needed additional personnel on the field. The BIR was hampered by lack ofpersonnel, and also by inadequately trained personnel to attend to the newtax. There were reported delays in the transmission of rules and regulationsto the district offices, thus compounding the problem of the registrationprocess. From the experience gained with the early tax-filing, many enter-prises at the retail stage were confused by the new requirements of the tax.There was less confusion at the manufacturing stage, because enterprises atthis level had been familiar with the method of crediting earlier taxes oninputs.
VAT Information Campaign
16. The problems already mentioned could have been eased if the informa-tion on the VAT campaign on compliance had been effectively waged. Much ofthe information campaign for the VAT was centralized within the BIR. Unlikeother countries, which have used a decentralized approach for public informa-tion dissemination to win over acceptance and understanding of the tax, therevenue agency undertook the campaign of information and registration largelyon its own. The issuance of revenue regulations were explained mainly be
- 38 -
Chapter IIANNEXPage 4 of 5
revenue officers. The printed VAT revenue regulations were made availableonly in English, and to some extent these materials failed to address some ofthe questions raised by sectors during the public debate on it. Even thoughthe VAT is now in place, there is a large segment of the taxpaying publicwhich can be won over for effective voluntary compliance. Thus, it is impor-tant that a public information campaign be undertaken, enlisting as wide afront of the public communications media as possible.
The Future of VAT
17. When the VAT was decided as a comprehensive form of taxation up tothe retail stage, it became clear that it challenged the capacity of the tax
administration. The present task is to make it work effectively toimprove its collection by stimulating voluntary compliance and bystrengthening the administrative machinery.
18. In order to stimulate voluntary compliance, the highest priorityshould be given to inducing and supervising compliance of governmentcorporations and the larger private establishments. These enterprises canhelp in the entorcement ot the VAT it properly motivated. By requiring theirstrict compliance, these enterprises will find it in their interest in turn torequire other enterprises which which they trade to issue receipts that arenecessary for them to claim their own tax credit. The enforcement of the VATon the larger enterprises can provide a chain effect on enforcement of the VATamong smaller enterprises, thus widening the compliance base for the tax.
19. Because of itp neutral effect on resource allocation, every effortshould be made to make its structure more in keeping with the appropriatedesign of the VAT. Any future efforts related to improving its structurepoints out to the provisions that were made in relation to exemption and zero-rating and to the issue of expanded coverage of sectors presently taxedoutside of the VAT.
20. At the time of adoption, various types of accommodations were made onborderline cases as to exemptions and zero-rating. In general, the zero-rating provision has been used sparingly, and apply mainly to export sales.The more common type of treatment for exclusion from the VAT is through exemp-tion. The list of exempt products from the VAT are nunerous. They have beenmade largely to meet certain equity considerations (e.g., rice and sugarmilling, medical and educational services) and also to avoid bringing into theVAT ambit those sectors that would be difficult to tax in any case. However,there are a number of notable exclusions from the VAT. Among these are itemssubject to other taxation, for instance, petroleum products, which are taxedunder the domestic excise tax. Another is the taxation of professionals,including those in entertainment, which are covered by the income tax. Theother set of exclusions are those covered under different percentage taxes onservices.
- 39 -
Chapter IIANNEXPage 5 of 5
21. There are various ad valorem taxes on services, which represent acomplex set of taxes of different rates. These include the gross receipts taxfor financial transactions (5Z), the 12Z receipts tax for hotels, the 42 to25% caterer's tax, 3% garage keepers' tax, the 2X to 5Z franchise tax (forutilities, telephone and telegraph services, and for other franchises), the10% overseas dispatch tax, and the 15X to 30% amusemenLt tax. The next steptherefore is to study how these and other forms of services can be broughtinto more orderly coverage under the VAT.
- 40 -
CHAPTER III
GROWTH, DEBT Ai.D AID REQUIREMENTS
Background
3.1 The long-term outlook for the Philippines contains many uncertain-ties. However, given a reasonable level of political and social stability, itis possible to foresee a period of fairly robust growth ahead. Many of thefactors that have constrained growth in the recent past have been eliminated.Specifically, commodity and factor prices are relatively free from distor-tions, and the role of the public sector in directing and controlling theeconomy has been reduced. Debt relief has given the Philippines a temporarybreathing space during which it can begin the growth process. In addition,the country stands to gain from shifting comparative advantage within the EastAsian community. Rising wage demands in countries such as Hong Kong, Koreaand Singapore will increase the Philippines competitive edge. Low wage costs,and a relatively highly trained, English speaking, business community makesthe country an attractive site for foreign investment. With a the loss of GSPpreferences by Korea, Hong Kong and Taiwan, many investors will be seekingalternative sites for labor intensive manufacturing investments. For theseinvestors, Philippines will be an attractive alternative, although it will bein competition with such rivals as Malaysia, Indonesia arid Tliaila-d. On- thenegative side, however, there are substantial questions about the ability ofthe economy to extend the growth process. Savings rates remain low, and theefficiency of investment at the margin remains questionable. While a rela-tively distortion free incentive environment should ensure relativel3 effi-cient investment undertakings, the present capital stock still reflectsinvestment decisions made under a different set of incentives. Maintaininggrowth will depend on improving the level of efficiency in agriculture andindustry, and ensuring that public sector supportive services are adequatelyprovided.
Constraints on Growth
3.2 In agriculture, recent pelformance has been affected adversely by aperiod of unusually severe weather conditions. In addition, price and market-ing distortions tended to hold down production during the early 1980s. Givena period of normal weather, and with the removal of these distortions, along-term growth rate of about 3.5% per year should be possible (see Chapter Vfor a detailed description of agricultural projections). This rate wouldstill be lower than that achieved during the 1970s, when agricultural outputresponded to a combination of new technologies and a rapid expansion ofsurface irrigation works. At present, the growth possibilities from boththese sources is much more limited.
3.3 The question of investment efficiency is critical to future growthprospects. Again, with a less distorted incentive system, it is likely thatthe level of future investment efficiency would be much higher. As shown inTable 3.1 (below), the incremental-capital output ratio (ICOR) during the1978-83 period was 7.1, based on a 4% growth rate of GDP and an average
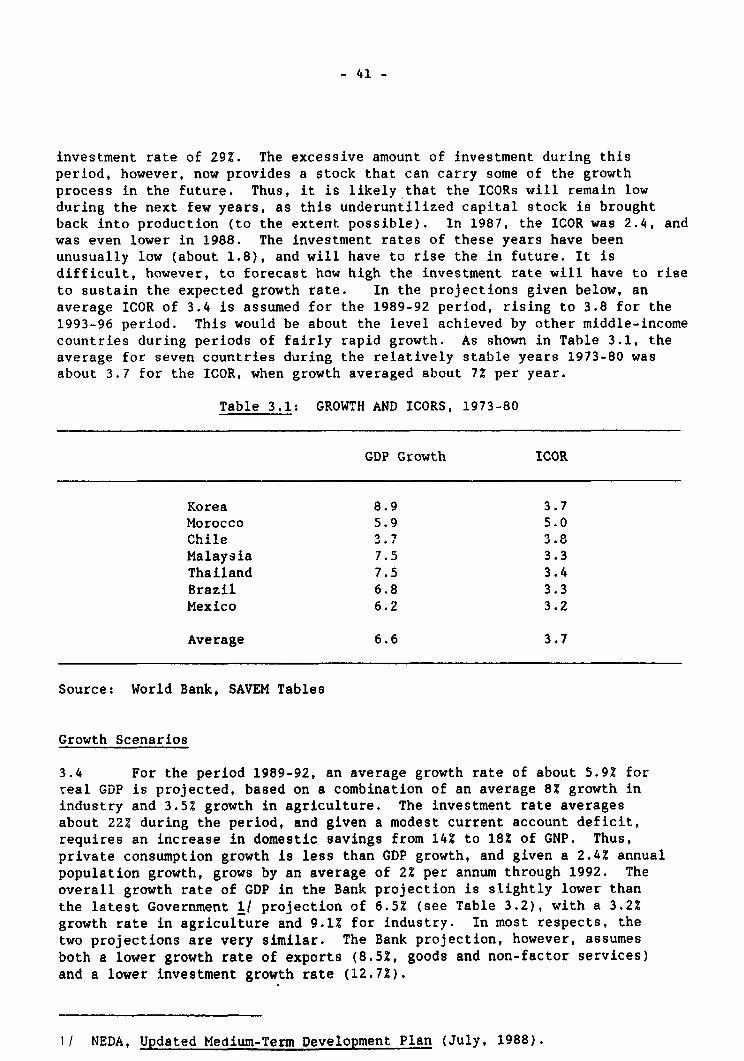
- 41 -
investment rate of 29Z. The excessive amount of investment during thisperiod, however, now provides a stock that can carry some of the growthprocess in the future. Thus, it is likely that the ICORs will remain lowduring the next few years, as this underuntilized capital stock is broughtback into production (to the extent possible). In 1987, the ICOR was 2.4, andwas even lower in 1988. The investment rates of these years have beenunusually low (about 1.8), and will have to rise the in future. It isdifficult, however, to forecast how high the investment rate will have to riseto sustain the expected growth rate. In the projections given below, anaverage ICOR of 3.4 is assumed for the 1989-92 period, rising to 3.8 for the1993-96 period. This would be about the level achieved by other middle-incomecountries during periods of fairly rapid growth. As shown in Table 3.1, theaverage for seven countries during the relatively stable years 1973-80 wasabout 3.7 for the ICOR, when growth averaged about 7Z per year.
Table 3.1: GROWTH AND ICORS, 1973-80
GDP Growth ICOR
Korea 8.9 3.7Morocco 5.9 5.0
-, . ., 1.
Malaysia 7.5 3.3Thailand 7.5 3.4Brazil 6.8 3.3Mexico 6.2 3.2
Average 6.6 3.7
Source: World Bank, SAVEM Tables
Growth Scenarios
3.4 For the period 1989-92, an average growth rate of about 5.9Z forreal GDP is projected, based on a combination of an average 8% growth inindustry and 3.5% growth in agriculture. The investment rate averagesabout 22% during the period, and given a modest current account deficit,requires an increase in domestic savings from 14% to 18% of GNP. Thus,private consumption growth is less than GDP growth, and given a 2.4% annualpopulation growth, grows by an average of 2% per annum through 1992. Theoverall growth rate of GDP in the Bank projection is slightly lower thanthe latest Government 1, projection of 6.5% (see Table 3.2), with a 3.2Zgrowth rate in agriculture and 9.1% for industry. In most respects, thetwo projections are very similar. The Bank projection, however, assumesboth a lower growth rate of exports (8.5%, goods and non-factor services)and a lower investment growth rate (12.7%).
1/ NEDA, Updated Medium-Term DeveloPment Plan (July, 1988).

- 42 -
Table 3.2: MACRO-ECONOMIC PROJECTIONS
1989-92Actual Estimated World1978-83 1988 Bank Government 1993-96 /a
Growth Rates:IbGNP 4.0 6.7 6.2 6.5 6.3GDP 4.1 6.6 5.9 6.4 6.0
Agriculture 3.1 3.4 3.5 3.2 3.5Industry 4.4 8.9 8.0 9.1 8.0Services 4.7 7.1 5.5 6.0 5.5
Private Consumption 4.1 5.1 4.5 4.6 5.8Government Consumption 2.8 10.5 6.0 7.9 6.0Investment 3.1 25.9 12.7 19.0 6.2
Exports (G+NFS) 5.5 12.7 8.5 9.0 8.0Imports (G+NFS) 7.5 34.2 9.6 9.5 7.3
IC ^11
2.'i1aLesoLVj. r.
Investment 29.1 16.0 21.5 20.9 23.4Savings 26.4 13.9 18.7 18.3 21.0Current Account 2.7 1.9 2.8 2.6 2.4
Ratios:ICOR /c 6.2 1.8 3.4 2.8 3.8Import Elasticity 1.8 5.1 1.6 1.5 1.2Marginal Savings Rate 26.2 28.5 37.9 n.a. 24.7
/a World Bank projections./b Values in constant prices./c Based on fixed investment.
Source: NEDA and Bank staff projections.
The high import growth rate is necessitated by the high growth in invest-ment, which averages about 13% per annum during the 1989-92 period.Examining the projections of imports by end-use (Table 3.3) shows thatcapital imports are projected to grow in line with the growth of fixedinvestment, or about 16% per annum. After 1989, the growth rate ofinvestment is projected to slow down as the investment rate reaches about232 of GDP, the growth of capital goods imports also slows down to a rateof 6Z.

- 43 -
Table 3.3: IMPORTS BY END-USE
Values $ Millions Volume Growth Rates1987 1988 Est. 1989-92 1993-96
Food 463 691 5.9 6.0POL/Energy 1,229 1,098 5.5 5.4Intermediate 3,351 4,024 9.3 8.8Capital Goods 1,210 1,618 15.8 6.2Consumer Goods 484 605 5.9 6.0
Total Goods (fob) 6,737 8,036 8.6 7.4
3.5 Export prospects are a key element of any projection of the balanceof payments. For the Philippines, little real growth is expected fromtraditional exports, such as coconut products, sugar and forest products.Coconut production is already near an historical high, and the aging of theexisting scock of trees, combined with insufficient replanting, indicates thatthere will be little volume growth in the near future, and a likely decline inoutput in the longer term. Sugar exports depend on U.S. import quotas, whichare assumed to be phased out after 1988 as the U.S. becomes self sufficient insugar production. Exports of forest products are limited by the steadilydwindling supply of forest resources, and no volume growth rcn hp paor ea.4
The major growth element for exports must come from the so-called "non-traditional" manufactured products, which constitute about 64% of totalmerchandise exports. In 1987, these exports grew by about 272 in nominalterms, or 14% in volume. Prospects for these exports depend heavily on theoutlook for electronic goods and garments, which together constitute 60% ofthe total manufactures exports. A long term growth rate of about 1 per yearis assumed in the projection as a reasonable target (see Table 3.4). Thiswould imply that the Philippines' exports would grow faster than total demand,and thus the country would expand its rather small market share.
Table 3.4: EXPORT PROJECTIONS
Value /a Volume Growth Rates1987 1988 1989-92 1983-96
Coconut Prod. 561 558 .2 -3.2Sugar 71 91 -41.2 0.0Forest Prod. 243 275 0.0 0.0Copper 109 129 3.4 3.1Manuf. 3,642 4,536 11.8 10.0Others 1,003 1,130 6.0 6.0Total, Goods (fob) 5,720 6,832 9.6 7.3Services /b 2,343 2,360 5.7 6.0
Total 8,063 9,191 8.5 8.0
/a Millions $/b Non-factor services only.
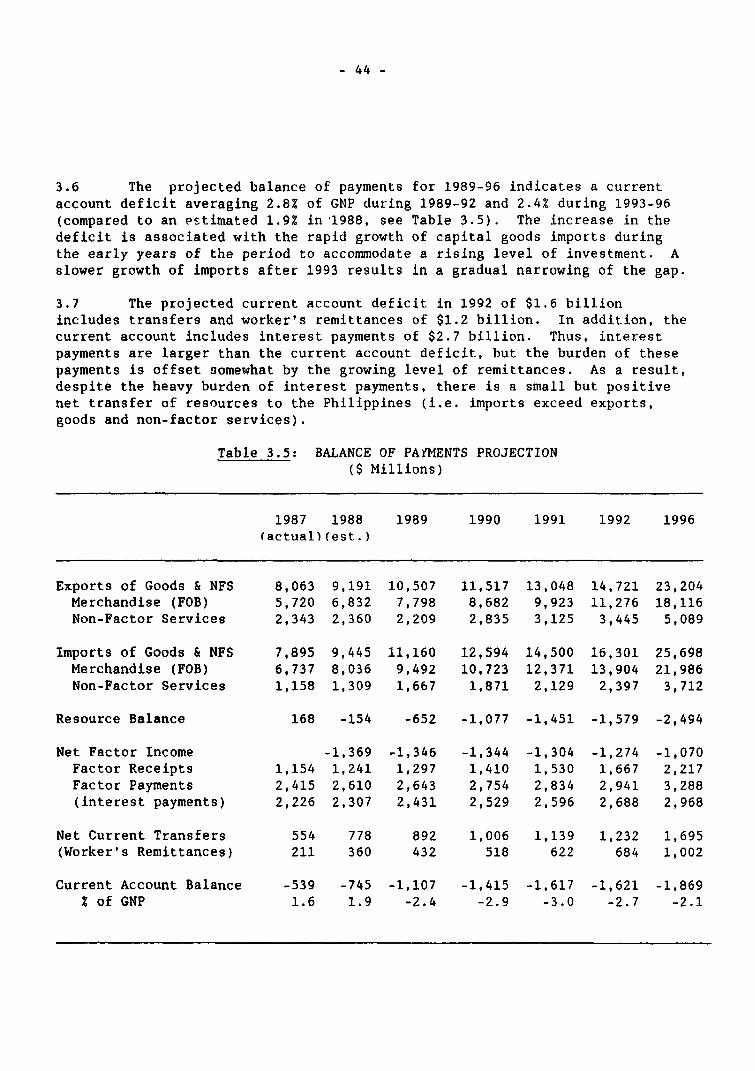
- 44 -
3.6 The projected balance of payments for 1989-96 indicates a currentaccount deficit averaging 2.8Z of GNP during 1989-92 and 2.4Z during 1993-96(compared to an estimated 1.9Z in 1988, see Table 3.5). The increase in thedeficit is associated with the rapid growth of capital goods imports duringthe early years of the period to accommodate a rising level of investment. Aslower growth of imports after 1993 results in a gradual narrowing of the gap.
3.7 The projected current account deficit in 1992 of $1.6 billionincludes transfers and worker's remittances of $1.2 billion. In addition, thecurrent account includes interest payments of $2.7 billion. Thus, interestpayments are larger than the current account deficit, but the burden of thesepayments is offset somewhat by the growing level of remittances. As a result,despite the heavy burden of interest payments, there is a small but positivenet transfer of resources to the Philippines (i.e. imports exceed exports,goods and non-factor services).
Table 3.5: BALANCE OF PAiMENTS PROJECTION($ Millions)
1987 1988 1989 1990 1991 1992 1996(actual) (est.)
Exports of Goods & NFS 8,063 9,191 10,507 11,517 13,048 14,721 23,204Merchandise (FOB) 5,720 6,832 7,798 8,682 9,923 11,276 18,116Non-Factor Services 2,343 2,360 2,209 2,835 3,125 3,445 5,089
Imports of Goods & NFS 7,895 9,445 11,160 12,594 14,500 16,301 25,698Merchandise (FOB) 6,737 8,036 9,492 10,723 12,371 13,904 21,986Non-Factor Services 1,158 1,309 1,667 1,871 2,129 2,397 3,712
Resource Balance 168 -154 -652 -1,077 -1,451 -1,579 -2,494
Net Factor Income -1,369 -1,346 -1,344 -1,304 -1,274 -1,070Factor Receipts 1,154 1,241 1,297 1,410 1,530 1,667 2,217Factor Payments 2,415 2,610 2,643 2,754 2,834 2,941 3,288(interest payments) 2,226 2,307 2,431 2,529 2,596 2,688 2,968
Net Current Transfers 554 778 892 1,006 1,139 1,232 1,695(Worker's Remittances) 211 360 432 518 622 684 1,002
Current Account Balance -539 -745 -1,107 -1,415 -1,617 -1,621 -1,869Z of GNP 1.6 1.9 -2.4 -2.9 -3.0 -2.7 -2.1
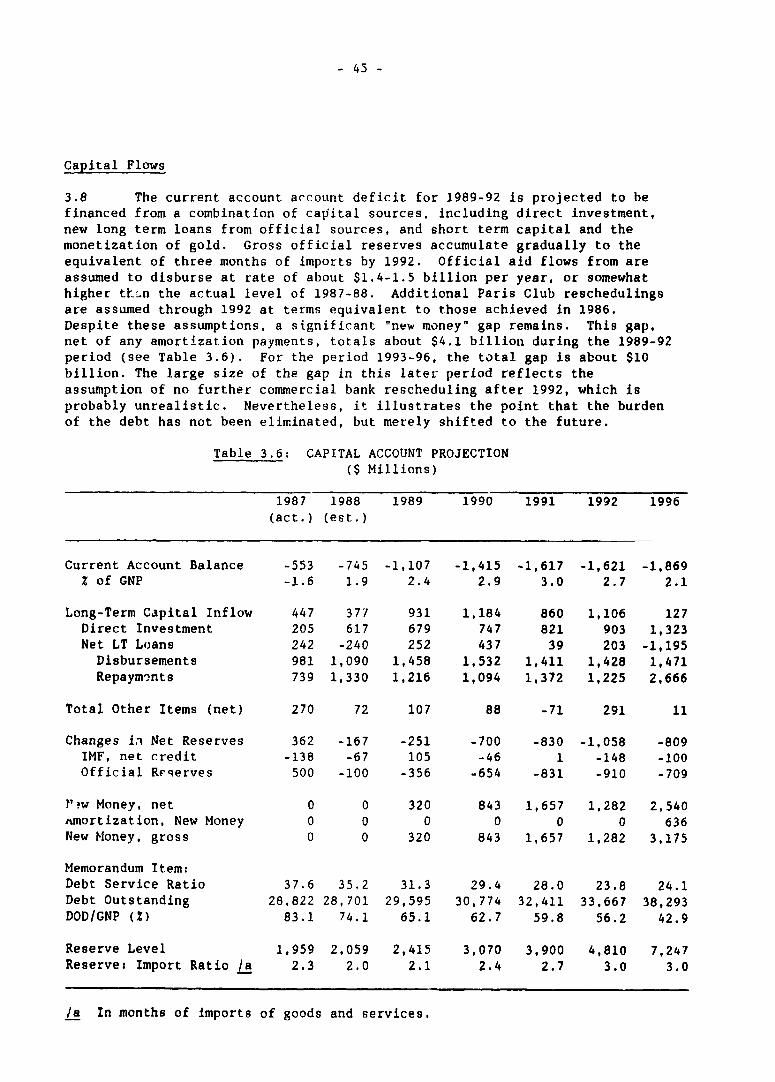
- 45 3
Capital Flows
3.8 The current account account deficit for 1989-92 is projected to befinanced from a combination of capital sources, including direct investment,new long term loans from official sources, and short term capital and themonetization of gold. Gross official reserves accumulate gradually to theequivalent of three months of imports by 1992. Official aid flows from areassumed to disburse at rate of about $1.4-1.5 billion per year, or somewhathigher tL.n the actual level of 1987-88. Additional Paris Club reschedulingsare assumed through 1992 at terms equivalent to those achieved in 1986.Despite these assumptions, a significant "new money" gap remains. This gap,net of any amortization payments, totals about $4.1 billion during the 1989-92period (see Table 3.6). For the period 1993-96, the total gap is about $10billion. The large size of the gap in this later period reflects theassumption of no further commercial bank rescheduling after 1992, which isprobably unrealistic. Nevertheless, it illustrates the point that the burdenof the debt has not been eliminated, but merely shifted to the future.
Table 3.6: CAPITAL ACCOUNT PROJECTION(S Millions)
1987 1988 1989 1990 1991 1992 1996(act.) (est.)
Current Account Balance -553 -745 -1,107 -1,415 -1,617 -1,621 -1,869Z of GNP -1.6 1.9 2.4 2.9 3.0 2.7 2.1
Long-Term Capital Inflow 447 377 931 1,184 860 1,106 127Direct Investment 205 617 679 747 821 903 1,323Net LT Loans 242 -240 252 437 39 203 -1,195Disbursements 981 1,090 1,458 1,532 1,411 1,428 1,471Repaymints 739 1,330 1,216 1,094 1,372 1,225 2,666
Total Other Items (net) 270 72 107 88 -71 291 11
Changes in Net Reserves 362 -167 -251 -700 -830 -1,058 -809IMF, net credit -138 -67 105 -46 1 -148 -100Official Reqerves 500 -100 -356 -654 -831 -910 -709
P?w Money, net 0 0 320 843 1,657 1,282 2,540itmortization, New Money 0 0 0 0 0 0 636New Money, gross 0 0 320 843 1,657 1,282 3,175
Memorandum Item:Debt Service Ratio 37.6 35.2 31.3 29.4 28.0 23.8 24.1Debt Outstanding 28,822 28,701 29,595 30,774 32,411 33,667 38,293DOD/GNP (Z) 83.1 74.1 65.1 62.7 59.8 56.2 42.9
Reserve Level 1,959 2,059 2,415 3,070 3,900 4,810 7,247Reserve: Import Ratio /a 2.3 2.0 2.1 2.4 2.7 3.0 3.0
/a In months of imports of goods and services.

- 46 -
3.9 The overall stock of debt, under this scenario, would rise over theperiod, reaching about $38 billion by 1996 (see Table 3.6). In relativeterms, however, there would be a decline in the size of the debt compared toGNP, from 742 at end-1988 to about 43Z by 1996. Likewise, the debt serviceratio would decline from 35Z to 24Z over the same period. This assumes,however, th2t the new money gap would be filled with additional lending oradditional rescheduling, at terms equivalent to that given on new money fromcommercial banks in the recent past.
Alternative Scenarios
3.10 Lower Investment Efficiency. The projections made here, however, arevery sensitive to the assumptions about future performance. One majoruncertainty is the efficiency of future investments. The basic scenariopresented above assumes a rather optimistic, but achievable, level ofinvestment efficiency. If investment is not as efficient as projected in thebase case scenario, but growth is of the same magnitude, both foreignborrowing and domestic saving will have to increase to finance a higherinvestment rate. Under the "low investment efficiency" scenario, the ICOR isincreased during the 1989-92 period from 3.4 to 3.8 by way of illustration(see Table 3.7). The result is an investment rate of 262 during the 1988-92period, and a reduced rate of consumption growth from 4.52 per year to 2.7%,implying declining per capita consumption. New money requirements rise from$4.1 billion to $7.30 billion, a level which is probably unattainable. Thus,without reasonably high investment efficiency, it is unlikely that the growthtargets of the base case can be achieved.
Table 3.7: "LOW-INVESTMENT EFFICIENCY" SCENARIO
1988-92 1993-96
Growth Rates (Z)GDP 5.9 6.0Private Consumption 2.7 5.7Investment 20.0 6.3Imports (G+NFS) 11.3 7.3
Ratios (%):
Investment/GNP 26.3 30.8Current Acct./GNP 4.2 4.7Debt Service Ratio 28.5 29.1ICOR 3.8 5.0
New Money: ($ billions): 7.0 17.8
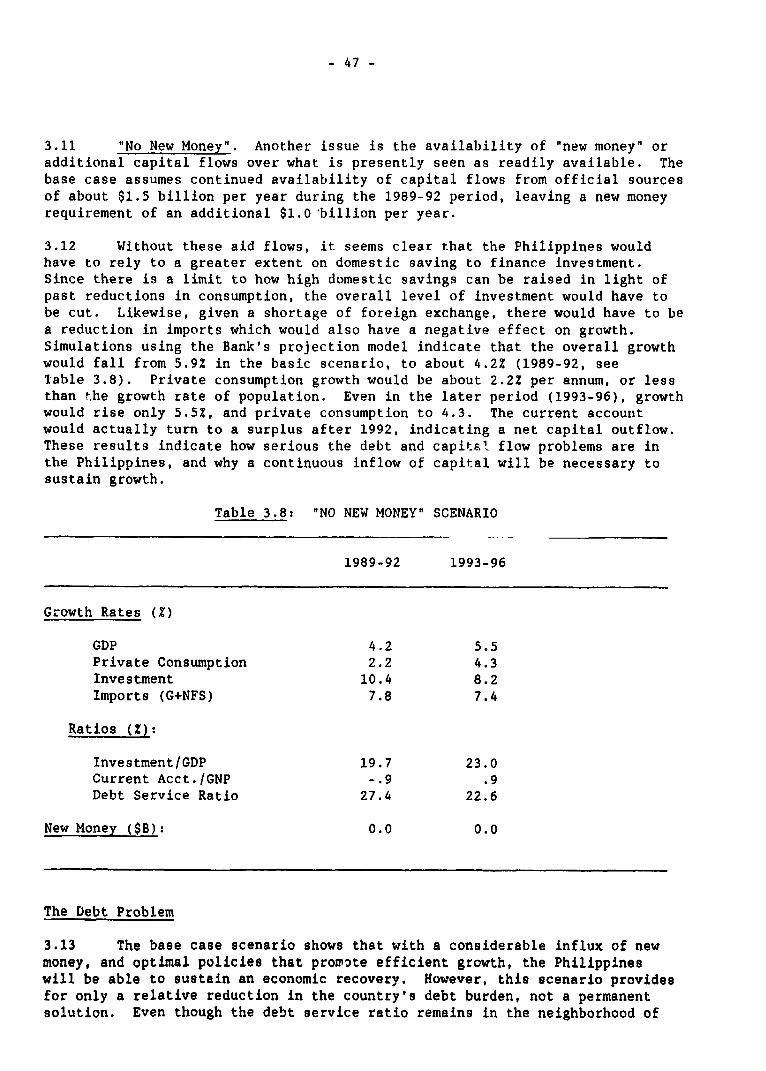
- 47 -
3.11 "No New Money". Another issue is the availability of "new money" oradditional capital flows over what is presently seen as readily available. Thebase case assumes continued availability of capital flows from official sourcesof about $1.5 billion per year during the 1989-92 period, leaving a new moneyrequirement of an additional $1.0 billion per year.
3.12 Without these aid flows, it seems clear that the Philippines wouldhave to rely to a greater extent on domestic saving to finance investment.Since there is a limit to how high domestic savings can be raised in light ofpast reductions in consumption, the overall level of investment would have tobe cut. Likewise, given a shortage of foreign exchange, there would have to bea reduction in imports which would also have a negative effect on growth.Simulations using the Bank's projection model indicate that the overall growthwould fall from 5.9Z in the basic scenario, to about 4.2% (1989-92, seeTable 3.8). Private consumption growth would be about 2.2Z per annum, or lessthan the growth rate of population. Even in the later period (1993-96), growthwould rise only 5.5%, and private consumption to 4.3. The current accountwould actually turn to a surplus after 1992, indicating a net capital outflow.These results indicate how serious the debt and capita'. flow problems are inthe Philippines, and why a continuous inflow of capital will be necessary tosustain growth.
Table 3.8: "NO NEW MONEY" SCENARIO
1989-92 1993-96
Growth Rates (%)
GDP 4.2 5.5Private Consumption 2.2 4.3Investment 10.4 8.2Imports (G+NFS) 7.8 7.4
Ratios (Z):
Investment/GDP 19.7 23.0Current Acct./GNP -.9 .9Debt Service Ratio 27.4 22.6
New Money ($B): 0.0 0.0
The Debt Problem
3.13 The base case scenario shows that with a considerable influx of newmoney, and optimal policies that promote efficient growth, the Philippineswill be able to sustain an economic recovery. However, this scenario providesfor only a relative reduction in the country's debt burden, not a permanentsolution. Even though the debt service ratio remains in the neighborhood of

- 48 -
25%, it requires considerable amounts of new money and/or further debtrescheduling after 1993. The reduction in the debt burden is gradual, being aresult of a faster growth of GDP and exports, relative to the growth of thedebt. The country will be truly creditworthy only once it regains access toprivate capital markets. This is not likely to occur before 1996, since thebase case scenario requires further reschedulings and new money which will notlikely be forthcoming on a voluntary basis. On the other hand, excessborrowings will only add to the debt burden and prevent the gradual decline inrelative debt, and the gradual restoration of creditworthiness.
3.14 The current status of Philippine creditworthiness is demonstrated bythe deep discount its debt, along with the debts of other developingcountries, sells for in world financial markets. The present discount of45-50% presents an asymmetric relationship, since the market value of the debtis significantly less than the face value on which the Philippines is payinginterest. As a result, any scheme which reduces the debt through a repurchaseor conversion is very attractive. Assuming that Philippine debt has a nominalinterest rate of 7/8th over a current LIBOR of 8%, a discount of 45% meansthat the implicit return on a purchase is 16Z. Thus any scheme which canreduce external debt and convert it into domestic equity or other financialinstruments should be encouraged, since the implicit return on a purchase is16Z. Other major debtors, facing similar circumstances, have developedvarious schemes for buying back their debt in order to hasten the return tocreditworthiness. In this vein, the Central Bank introduced a modest debt-equity conversion program in 1986.
3.15 Debt Equity Scheme. The presently constituted debt-equity scheme hastwo objectives: the stimulation of equity investment, and the reduction inexternal debt. The amount of the scheme, since its inception in 1986 has beensmall. Out of $1.7 billion in applications (September, 1988), only $544million has been converted into investments, with very little "new money"attached (see Table 3.9). Part of the reason for the limited use of thescheme is that some applications were for types of equity conversions thatwere not eligible under the scheme, which is limited to new investments andfavors certain sectors. However, a more important limit has arisen because ofthe monetary implications of the scheme and the Central Bank has set a limitof $180 million per year for conversions using Central Bank obligations.Since there is little private sector debt paper available, this haseffectively limited the use of the scheme.
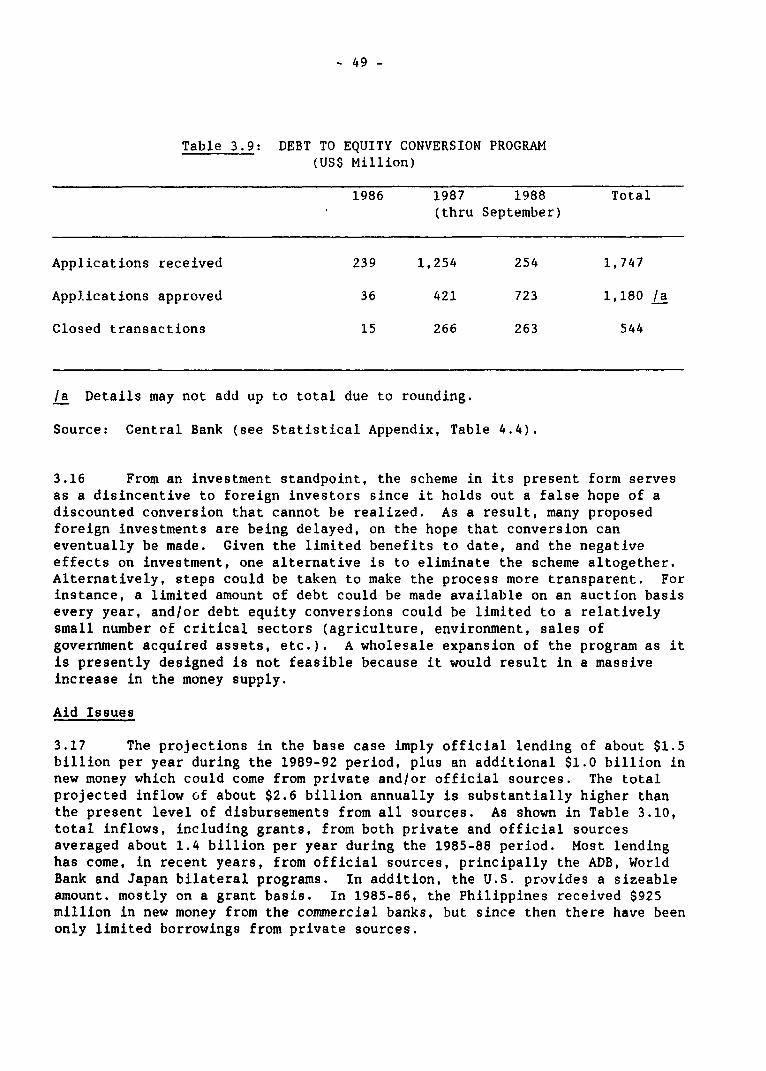
- 49 -
Table 3.9: DEBT TO EQUITY CONVERSION PROGRAM(US$ Million)
1986 1987 1988 Total(thru September)
Applications received 239 1,254 254 1,747
Applications approved 36 421 723 1,180 /a
Closed transactions 15 266 263 544
/a Details may not add up to total due to rounding.
Source: Central Bank (see Statistical Appendix, Table 4.4).
3.16 From an investment standpoint, the scheme in its present form servesas a disincentive to foreign investors since it holds out a false hope of adiscounted conversion that cannot be realized. As a result, many proposedforeign investments are being delayed, on the hope that conversion caneventually be made. Given the limited benefits to date, and the negativeeffects on investment, one alternative is to eliminate the scheme altogether.Alternatively, steps could be taken to make the process more transparent. Forinstance, a limited amount of debt could be made available on an auction basisevery year, and/or debt equity conversions could be limited to a relativelysmall number of critical sectors (agriculture, environment, sales ofgovernment acquired assets, etc.). A wholesale expansion of the program as itis presently designed is not feasible because it would result in a massiveincrease in the money supply.
Aid Issues
3.17 The projections in the base case imply official lending of about $1.5billion per year during the 1989-92 period, plus an additional $1.0 billion innew money which could come from private and/or official sources. The totalprojected inflow of about $2.6 billion annually is substantially higher thanthe present level of disbursements from all sources. As shown in Table 3.10,total inflows, including grants, from both private and official sourcesaveraged about 1.4 billion per year during the 1985-88 period. Most lendinghas come, in recent years, from official sources, principally the ADB, WorldBank and Japan bilateral programs. In addition, the U.S. provides a sizeableamount, mostly on a grant basis. In 1985-86, the Philippines received $925million in new money from the commercial banks, but since then there have beenonly limited borrowings from private sources.
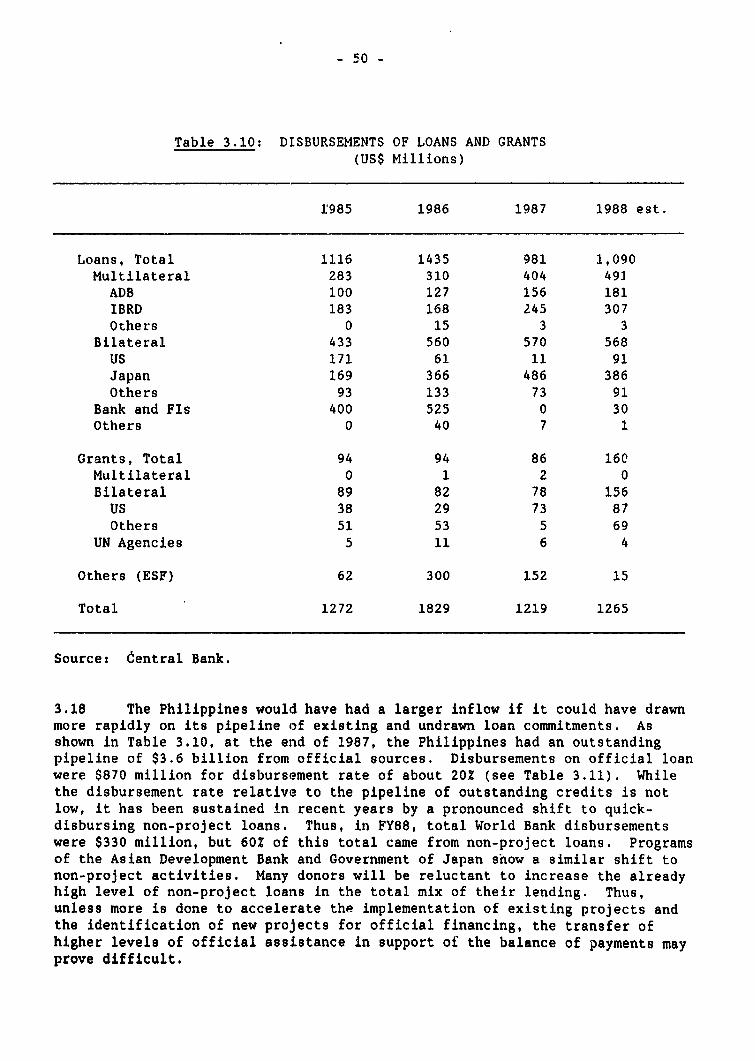
- 50 -
Table 3.10: DISBURSEMENTS OF LOANS AND GRANTS(US$ Millions)
1985 1986 1987 1988 est.
Loans, Total 1116 1435 981 1,090Multilateral 283 310 404 493ADB 100 127 156 181IBRD 183 168 245 307Others 0 15 3 3
Bilateral 433 560 570 568US 171 61 11 91Japan 169 366 486 386Others 93 133 73 91
Bank and FIs 400 525 0 30Others 0 40 7 1
Grants, Total 94 94 86 160Multilateral 0 1 2 0Bilateral 89 82 78 156US 38 29 73 87Others 51 53 5 69
UN Agencies 5 11 6 4
Others (ESF) 62 300 152 15
Total 1272 1829 1219 1265
Source: central Bank.
3.18 The Philippines would have had a larger inflow if it could have drawnmore rapidly on its pipeline of existing and undrawn loan commitments. Asshown in Table 3.10, at the end of 1987, the Philippines had an outstandingpipeline of $3.6 billion from official sources. Disbursements on official loanwere $870 million for disbursement rate of about 20Z (see Table 3.11). Whilethe disbursement rate relative to the pipeline of outstanding credits is notlow, it has been sustained in recent years by a pronounced shift to quick-disbursing non-project loans. Thus, in FY88, total World Bank disbursementswere $330 million, but 60Z of this total came from non-project loans. Programsof the Asian Development Bank and Government of Japan snow a similar shift tonon-project activities. Many donors will be reluctant to increase the alreadyhigh level of non-project loans in the total mix of their lending. Thus,unless more is done to accelerate the implementation of existing projects andthe identification of new projects for official financing, the transfer ofhigher levels of official assistance in support of the balance of payments mayprove difficult.
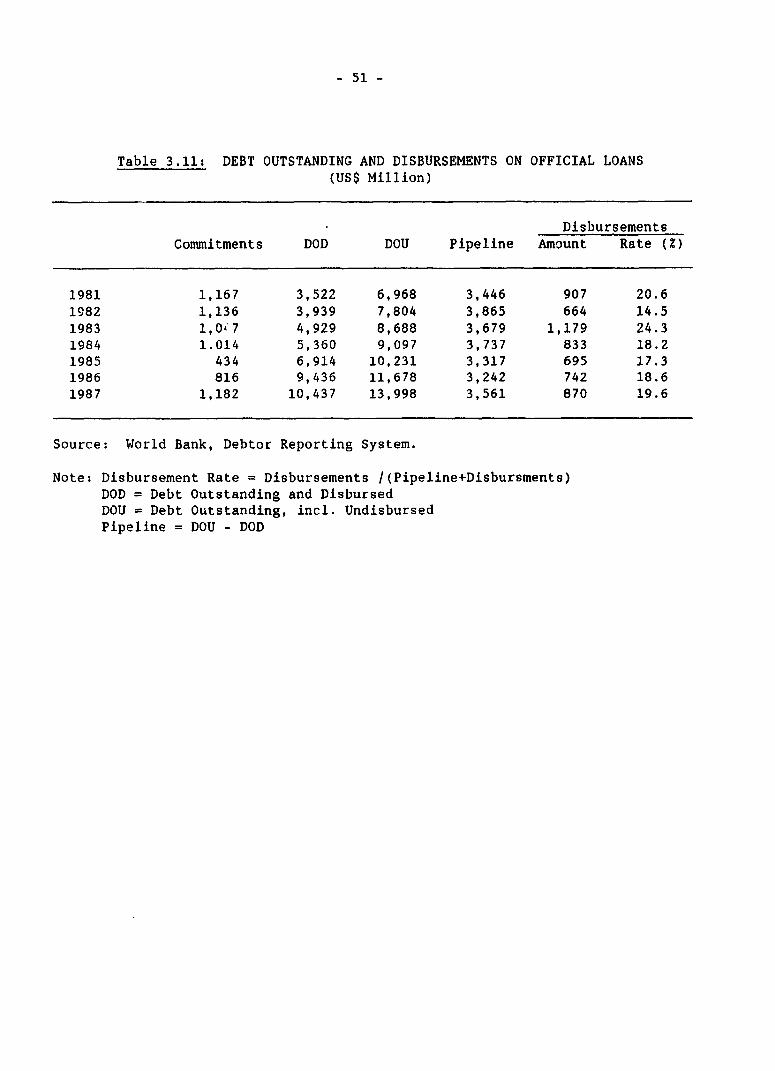
- 51 -
Table 3.11: DEBT OUTSTANDING AND DISBURSEMENTS ON OFFICIAL LOANS(US$ Million)
DisbursementsCommitments DOD DOU Pipeline Amount Rate (Z)
1981 1,167 3,522 6,968 3,446 907 20.61982 1,136 3,939 7,804 3,865 664 14.51983 1,0i7 4,929 8,688 3,679 1,179 24.31984 1.014 5,360 9,097 3,737 833 18.21985 434 6,914 10,231 3,317 695 17.31986 816 9,436 11,678 3,242 742 18.61987 1,182 10,437 13,998 3,561 870 19.6
Source: World Bank, Debtor Reporting System.
Note: Disbursement Rate = Disbursements /(Pipeline+Disbursments)DOD = Debt Outstanding and DisbursedDOU = Debt Outstanding, incl. UndisbursedPipeline = DOU - DOD
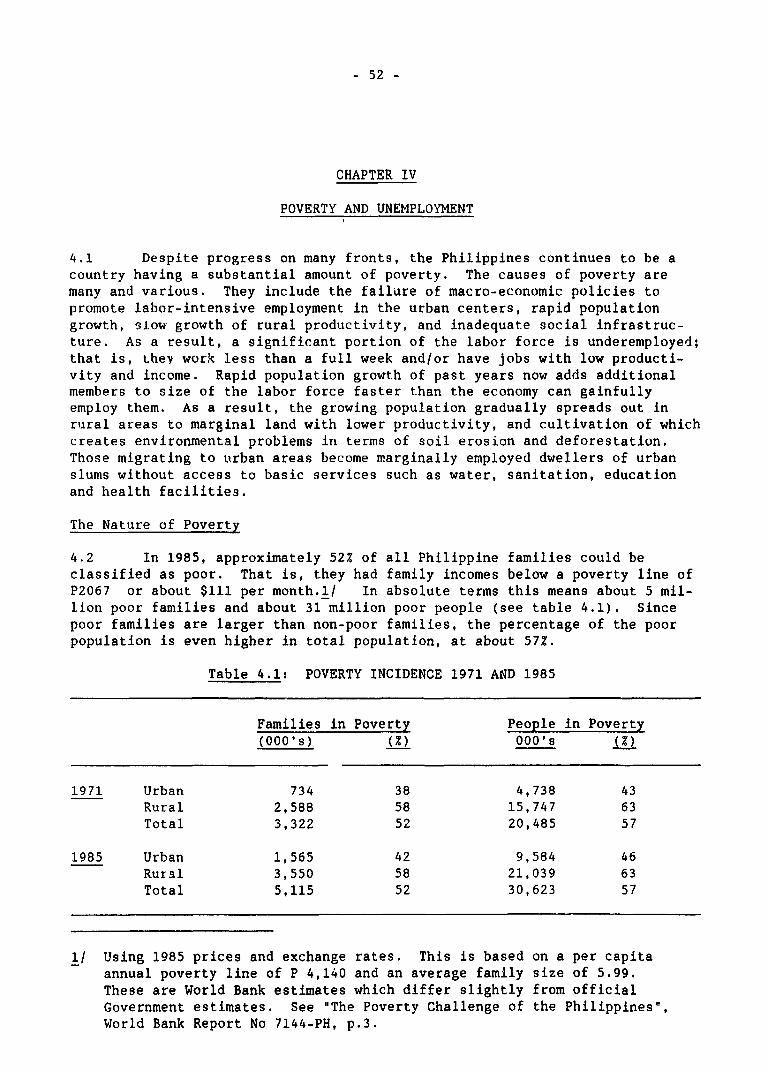
- 52 -
CHAPTER IV
POVERTY AND UNEMPLOYMENT
4.1 Despite progress on many fronts, the Philippines continues to be acountry having a substantial amount of poverty. The causes of poverty aremany and various. They include the failure of macro-economic policies topromote labor-intensive employment in the urban centers, rapid populationgrowth, slow growth of rural productivity, and inadequate social infrastruc-ture. As a result, a significant portion of the labor force is underemployed;that is, they work less than a full week and/or have jobs with low producti-vity and income. Rapid population growth of past years now adds additionalmembers to size of the labor force faster than the economy can gainfullyemploy them. As a result, the growing population gradually spreads out inrural areas to marginal land with lower productivity, and cultivation of whichcreates environmental problems in terms of soil erosion and deforestation.Those migrating to utrban areas become marginally employed dwellers of urbanslums without access to basic services such as water, sanitation, educationand health facilities.
The Nature of Poverty
4.2 In 1985, approximately 52Z of all Philippine families could beclassified as poor. That is, they had family incomes below a poverty line ofP2067 or about $111 per month.l/ In absolute terms this means about 5 mil-lion poor families and about 31 million poor people (see table 4.1). Sincepoor families are larger than non-poor families, the percentage of the poorpopulation is even higher in total population, at about 57Z.
Table 4.1: POVERTY INCIDENCE 1971 AND 1985
Families in Poverty People in Poverty(000's) (Z) 000's (Z)
1971 Urban 734 38 4,738 43Rural 2,588 58 15,747 63Total 3,322 52 20,485 57
1985 Urban 1,565 42 9,584 46Rural 3,550 58 21,039 63Total 5,115 52 30,623 57
1/ Using 1985 prices and exchange rates. This is based on a per capitaannual poverty line of P 4,140 and an average family size of 5.99.These are World Bank estimates which differ slightly from officialGovernment estimates. See "The Poverty Challenge of the Philippines",World Bank Report No 7144-PH, p.3.

- 53 -
4.3 The prevalence of poverty is higher in rural areas. About 58Z ofrural families are poor, compared to 42Z of urban families. Comparing thesituation with 1971, which is the last year of a comparable survey, thepoverty level appears to have remained constant at 57Z. In fact, limitedinformation based on the national accounts would suggest that per capitaincomes rose during the period 1971-79, as GNP per capita rose by almost 4%per year. It is Likely that the numbers in poverty fell during thatperiod. After 1919, and particularly after 1983, per capita incomes stag-nated and declined, leading to a decline in personal income and a likelyincrease in poverty. Thus the progress in reducing poverty achieved duringthe 1970s was negated by the consequent economic collapse and stabilizationin the 1980s.
4.4 Clearly a growth strategy which emphasizes distributional aspectsis essential if progress is to be made in reducing poverty. To the extentthat government interventions, particularly on social service delivery, arewarranted, they must be targeted on the core poor, those below subsistenceincome levels, or roughly the lowest three deciles of the incomedistribution.2/ An important beginning of this process consists of anaccurate mapping of the poor.
The Causes of Poverty
4.5 Macro-Management. The failure to reduce poverty in recent yearscan be traced to a number of factors, but of prime importance has been thenature of macro-economic policies pursued in the past. While growth wasrapid during th2 1970s, it depended heavily on policies which promotedcapital intensive import substitution, distorted exchange and interestrates, and heavy foreign borrowing. In agriculture, much progress was madein raising farm productivity through a combination of high-yielding vari-eties, expansion of large-scale irrigation works, and government supportedcredit programs. However, other government policies reduced agriculturalincome, including price controls, marketing monopolies in sugar and coco-nuts, and export taxes and levies.
4.6 The gains from the high yielding agricultural technology andimport substitution in industry began to be exhausted by the late 1970s.At the same time, the country was affected by a changed internationalenvironment, deteriorating external terms of trade, accelerating energyprices, and high interest rates. The continued heavy reliance on foreignborrowings, particularly in the early 1980s, made the country particularlyvulnerable to external conditions. By 1983, the authorities were forced todeclare a debt moratorium and to undertake a stabilization program toreduce the external and budget deficits. The policies pursued caused anaccelerating inflation in 1984, negative growth in GNP in 1984-85, furtherdeclines in real wages and higher unemployment, all of which adverselyimpacted on the poor (see Table 4.2).
2/ See "Philippines: The Challenge of Poverty", Chapter I.
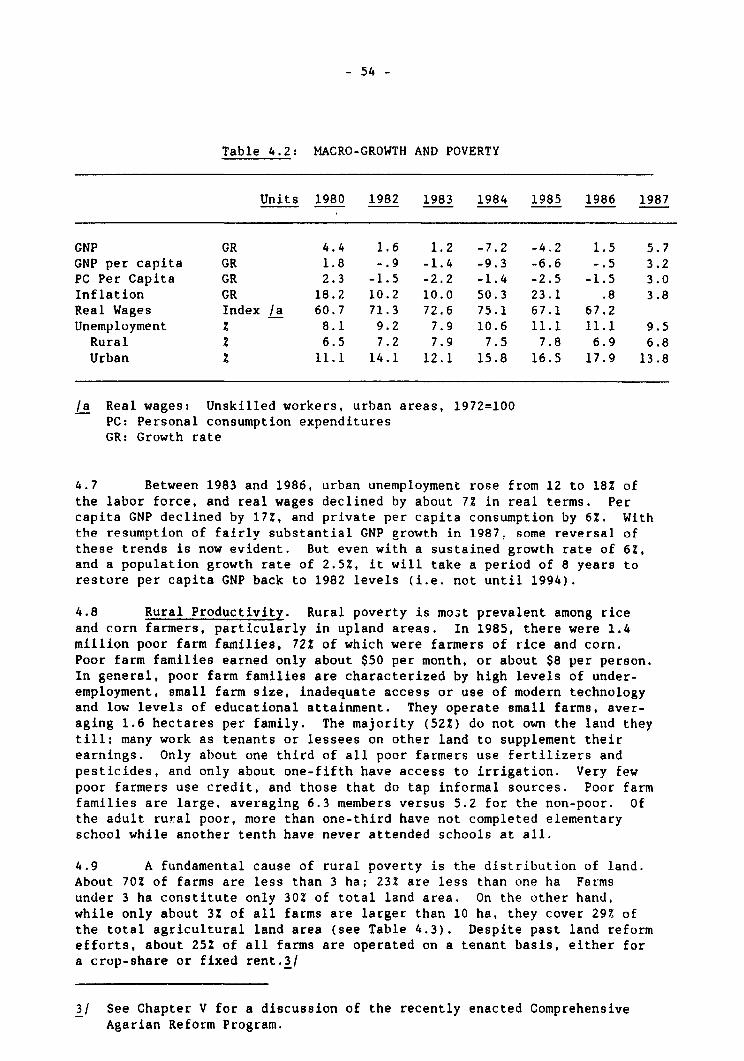
- 54 -
Table 4.2: MACRO-GROWTH AND POVERTY
Units 1980 1982 1983 1984 1985 1986 1987
GNP GR 4.4 1.6 1.2 -7.2 -4.2 1.5 5.7GNP per capita GR 1.8 -.9 -1.4 -9.3 -6.6 -.5 3.2PC Per Capita GR 2.3 -1.5 -2.2 -1.4 -2.5 -1.5 3.0Inflation GR 18.2 10.2 10.0 50.3 23.1 .8 3.8Real Wages Index /a 60.7 71.3 72.6 75.1 67.1 67.2Unemployment 2 8.1 9.2 7.9 10.6 11.1 11.1 9.5Rural 2 6.5 7.2 7.9 7.5 7.8 6.9 6.8Urban z 11.1 14.1 12.1 15.8 16.5 17.9 13.8
/a Real wages: Unskilled workers, urban areas, 1972=100PC: Personal consumption expendituresGR: Growth rate
4.7 Between 1983 and 1986, urban unemployment rose from 12 to 182 ofthe labor force, and real wages declined by about 72 in real terms. Percapita GNP declined by 17Z, and private per capita consumption by 62. Withthe resumption of fairlv substantial GNP growth in 1987. some reversal ofthese trends is now evident. But even with a sustained growth rate of 6%,and a population growth rate of 2.52, it will take a period of 8 years torestore per capita GNP back to 1982 levels (i.e. not until 1994).
4.8 Rural Productivity. Rural poverty is most prevalent among riceand corn farmers, particularly in upland areas. In 1985, there were 1.4million poor farm families, 72% of which were farmers of rice and corn.Poor farm families earned only about $50 per month, or about $8 per person.In general, poor farm families are characterized by high levels of under-employment, small farm size, inadequate access or use of modern technologyand low level3 of educational attainment. They operate small farms, aver-aging 1.6 hectares per family. The majority (52%) do not own the land theytill; many work as tenants or lessees on other land to supplement theirearnings. Only about one third of all poor farmers use fertilizers andpesticides, and only about one-fifth have access to irrigation. Very fewpoor farmers use credit, and those that do tap informal sources. Poor farmfamilies are large, averaging 6.3 members versus 5.2 for the non-poor. ofthe adult rural poor, more than one-third have not completed elementaryschool while another tenth have never attended schools at all.
4.9 A fundamental cause of rural poverty is the distribution of land.About 70% of farms are less than 3 ha; 232 are less than one ha Farmsunder 3 ha constitute only 30% of total land area. On the other hand,while only about 3% of all farms are larger than 10 ha, they cover 29% ofthe total agricultural land area (see Table 4.3). Despite past land reformefforts, about 25t of all farms are operated on a tenant basis, either fora crop-share or fixed rent.3/
3/ See Chapter V for a discussion of the recently enacted ComprehensiveAgarian Reform Program.
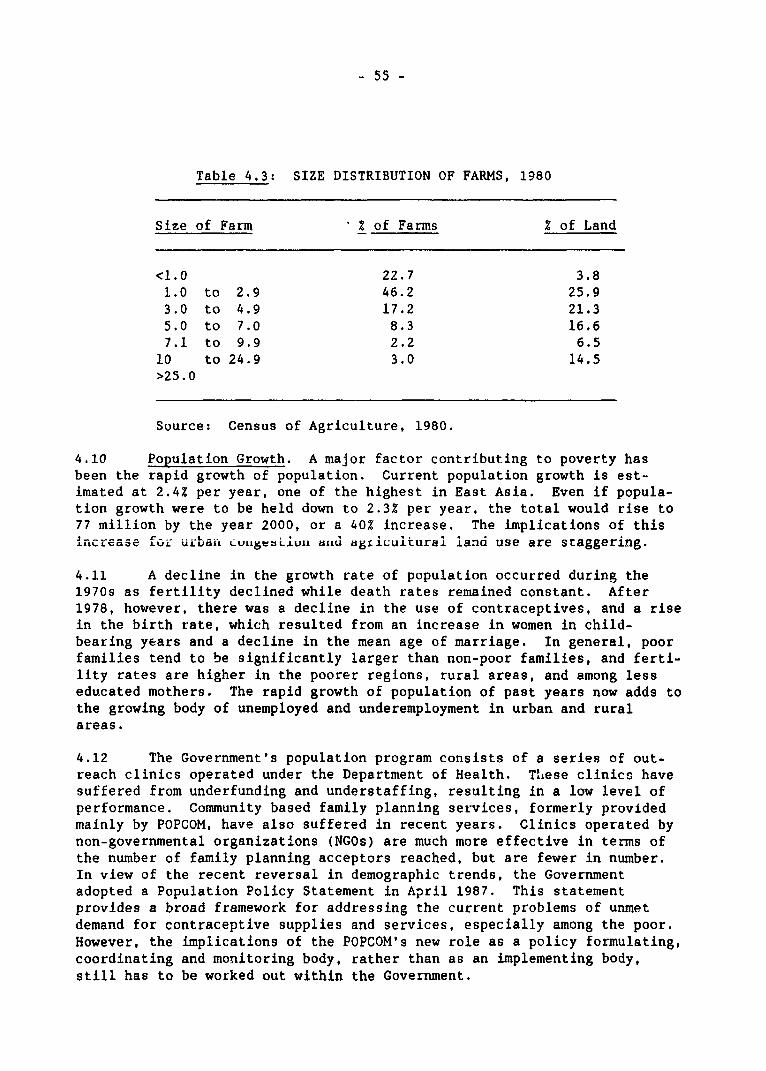
- 55 -
Table 4.3: SIZE DISTRIBUTION OF FARMS, 1980
Size of Farm % of Farms % of Land
<1.0 22.7 3.81.0 to 2.9 46.2 25.93.0 to 4.9 17.2 21.35.0 to 7.0 8.3 16.67.1 to 9.9 2.2 6.510 to 24.9 3.0 14.5>25.0
Source: Census of Agriculture, 1980.
4.10 Population Growth. A major factor contributing to poverty hasbeen the rapid growth of population. Current population growth is est-imated at 2.4Z per year, one of the highest in East Asia. Even if popula-tion growth were to be held down to 2.3% per year, the total would rise to77 million by the year 2000, or a 40% increase. The implications of this
nricrease fvi urbuau CULLtebLiuu aiid agLicuiturai land use are staggering.
4.11 A decline in the growth rate of population occurred during the1970s as fertility declined while death rates remained constant. After1978, however, there was a decline in the use of contraceptives, and a risein the birth rate, which resulted from an increase in women in child-bearing years and a decline in the mean age of marriage. In general, poorfamilies tend to be significantly larger than non-poor families, and ferti-lity rates are higher in the poorer regions, rural areas, and among lesseducated mothers. The rapid growth of population of past years now adds tothe growing body of unemployed and underemployment in urban and ruralareas.
4.12 The Government's population program consists of a series of out-reach clinics operated under the Department of Health. T'.ese clinics havesuffered from underfunding and understaffing, resulting in a low level ofperformance. Community based family planning services, formerly providedmainly by POPCOM, have also suffered in recent years. Clinics operated bynon-governmental organizatIons (NGOs) are much more effective in terms ofthe number of family planning acceptors reached, but are fewer in number.In view of the recent reversal in demographic trends, the Governmentadopted a Population Policy Statement in April 1987. This statementprovides a broad framework for addressing the current problems of unmetdemand for contraceptive supplies and services, especially among the poor.However, the implications of the POPCOM's new role as a policy formulating,coordinating and monitoring body, rather than as an implementing body,still has to be worked out within the Government.
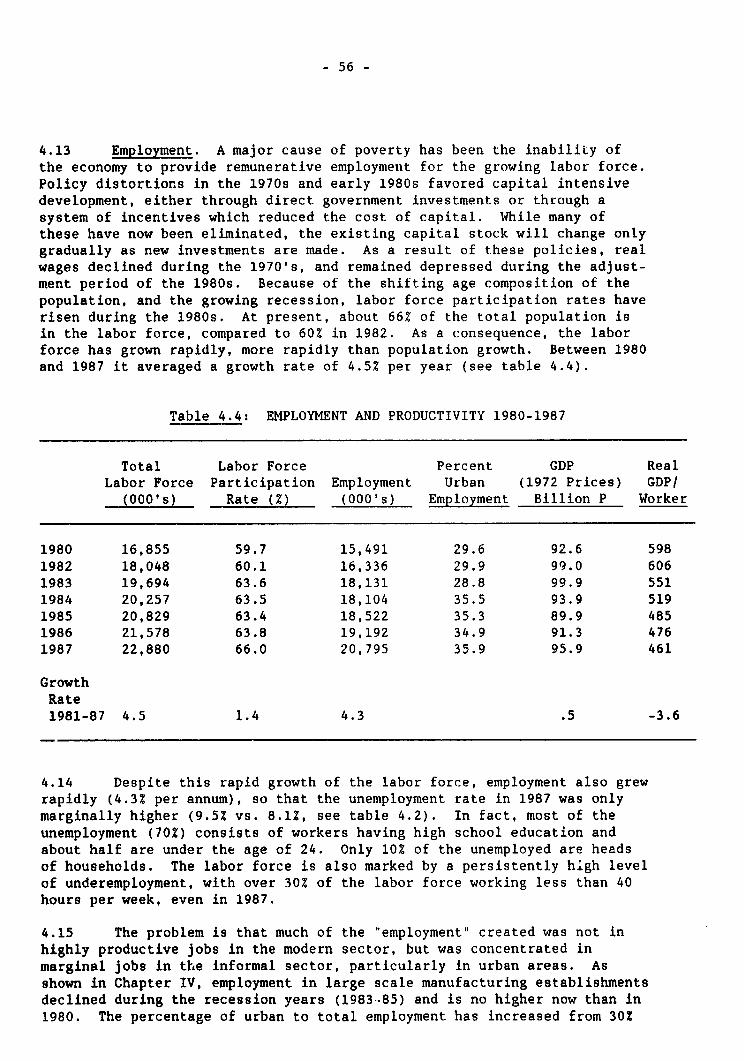
- 56 -
4.13 Employment. A major cause of poverty has been the inabiliLy ofthe economy to provide remunerative employment for the growing labor force.Policy distortions in the 1970s and early 1980s favored capital intensivedevelopment, either through direct government investments or through asystem of incentives which reduced the cost of capital. While many ofthese have now been eliminated, the existing capital stock will change onlygradually as new investments are made. As a result of these policies, realwages declined during the 1970's, and remained depressed during the adjust-ment period of the 1980s. Because of the shifting age composition of thepopulation, and the growing recession, labor force participation rates haverisen during the 1980s. At present, about 66Z of the total population isin the labor force, compared to 60% in 1982. As a consequence, the laborforce has grown rapidly, more rapidly than population growth. Between 1980and 1987 it averaged a growth rate of 4.5% per year (see table 4.4).
Table 4.4: EMPLOYMENT AND PRODUCTIVITY 1980-1987
Total Labor Force Percent GDP RealLabor Force Participation Employment Urban (1972 Prices) GDP/
(000's) Rate (Z) (000's) Employment Billion P Worker
1980 16,855 59.7 15,491 29.6 92.6 5981982 18,048 60.1 16,336 29.9 99.0 6061983 19,694 63.6 18,131 28.8 99.9 5511984 20,257 63.5 18,104 35.5 93.9 5191985 20,829 63.4 18,522 35.3 89.9 4851986 21,578 63.8 19,192 34.9 91.3 4761987 22,880 66.0 20,795 35.9 95.9 461
GrowthRate1981-87 4.5 1.4 4.3 .5 -3.6
4.14 Despite this rapid growth of the labor force, employment also grewrapidly (4.3% per annum), so that the unemployment rate in 1987 was onlymarginally higher (9.5% vs. 8.1%, see table 4.2). In fact, most of theunemployment (70%) consists of workers having high school education andabout half are under the age of 24. Only 10% of the unemployed are headsof households. The labor force is also marked by a persistently high levelof underemployment, with over 30% of the labor force working less than 40hours per week, even in 1987.
4.15 The problem is that much of the 'employment" created was not inhighly productive jobs in the modern sector, but was concentrated inmarginal jobs in the informal sector, particularly in urban areas. Asshown in Chapter IV, employment in large scale manufacturing establishmentsdeclined during the recession years (1983-85) and is no higher now than in1980. The percentage of urban to total employment has increased from 30%
- 57 -
in 1980 to 36Z in 1987, with about 55% of total "employment" created duringthe period in urban areas. The rapid growth in the labor force, combinedwith almost no growth in GDP during the period, has resulted in a declinein output per worker of 3.6% during the period, paralleling the decline inreal wages(see table 4.4).
Income Distribution
4.16 The Philippines has one of the most unequal income distributionsamong middle-income countries; in 1985 the top 102 of the population hadmore than fifteen times the income of the poorest 102. The Philippineincome distribution appears particularly unequal when compared with someother developing countries in the region. Inequality of income after taxesis also much worse when with similar indicators in other countries, sincerevenue collections in the Philippines are regressive. The absolute levelof rural income is, on average, less than half the average urban income.The disparity has remained virtually unchanged over the last 25 years;rural incomes are now 47% of average urban incomes as compared with 40% in1961. While there is some evidence of a small aggregate improvement in thedistribution of income over the 1971-85 period, the gains are modest andare overshadowed by the large absolute additions to the core poor group.
Toward a Poverty Alleviation Strategy 4/
4.17 There are no easy, quick solutions to the poverty problem.Poverty is a long term problem which will only be successfully addressed bya long-term sttategy consistently applied. A possible poverty alleviationstrategy could have to have many elements, with varying degrees ofemphasis.
4.18 Macro-Management. The Government has made great strides, inrecent years, in removing the major distortive elements in the pricesystem. Interest rates, exchange rates and agricultural prices broadlyreflect market conditions; tariffs have been reduced and many quantitativerestrictions on import eliminated; price controls and marketing monopolieseliminated in the agricultural sector. For the future, the Governmentneeds to maintain an outward oriented growth strategy that makes use of itsmost abundant resource, labor, and avoid steps that would restore incen-tives to use excessive amounts of scarce capital, or that would createdistortions in resource use that will lower overall productivity. In thelong run, the restoration of a stable, high rate of growth free from pricedistortions will be one of the most effective means of reducing poverty.
4.19 Tax System. For the most part, the system of taxation has Beenregressive, because it relies heavily on indirect taxes. In addition,while nominal tax rates are high, actual collections are low, so that theoverall tax effort is low in comparison with other countries. Taxes onincome are widely evaded, there is no effective capital gains tax, andcollection of taxes on real property are extremely low. The indirect taxsystem depends heavily on taxes on imports and energy products. The result
4/ This section draws on the recommendations of World Bank Report No.7144-PH, "Philippines: The Challenge Poverty of Poverty" (Oct. 17,1988).
- 58 -
is a regressive taxation structure which poor families pay 27% of theirincome in taxes while higher income families pay only 18% (1985 data).Recent tax reforms have lowered income taxation on low income families, andmoved much of domestic indirect taxation to a value-added tax. While theimpact of these reforms may have improved the situation somewhat, thecontinued high reliance on indirect taxes and low collection rates ondirect taxes implies that the system continues to be regressive in nature.Legal steps should be taken to increase compliance, and tax administrationand enforcement improved, patticularly in the area of income taxation. Inthe longer run, the Government's goal should be to reduce indirect taxa-tion, particularly of energy and imports, and shift to a greater relianceon income taxation.
4.20 Land Reform and Rural Development. A genuine, widespread landreform could do much to alleviate poverty, particularly among the growingbody of landless workers, and farmers on marginal and upland lands notsuitable for intensive farming. The Government has already taken steps toaccelerate the distribution of rice and corn lands covered under the 1972legislation. The recently passed Comprehensive Agrarian Reform Programcould, if implemented effectively, extend land reform to other areas(seeChapter V). A fully implemented program could benefit as many as 1.5 mil-lion landless agricultural families, in addition to giving title to 800,000small farmers who now farm as tenants. In addition, positive steps can beta',s=e, to givc twl o hs sLt. nJ.VL up LI.CCLOea -where. O.LVVIC VtLJ..iL
farming without serious environmental consequences. Giving titles on thesepublic alienable and disposable land could benefit another 1.2 millionfarmers. While no program holds as much promise of benefitting such alarge number of rural poor, the administrative task of carrying out theprogram are enormous and should not be underestimated (see Annex).
4.21 The Government will need to supplement the land reform effort withimprovements in basic rural infrastructure, extension services, credit andother agricultural inputs. Such programs should be extended not only toland reform beneficiaries, but all of the smaller and poorer farmers.Probably the most useful intervention is the further development of ruralroads, particularly those linking rural areas to markets. Investments insmall-scale, communal irrigation and rural electrification will also havehigh benefits. Research and extension in agriculture needs further im-provement, so that extension workers can reach poor farmers in remote areasand provide appropriate technological packages, suited to their environ-ment. Bringing the rural credit system down to the level of the smallfarmer remains a major challenge. One possibility is to improve the link-ages between the formal financial sector (i.e banks, esp. rural banks) andthe informal credit sector (i.e. suppliers, cooperatives, money-lenders) inorder to induce greater competition between providers of informal credit,and therefore lower margins.
4.22 Population/Family Planning. The Government needs to make a moredetermined effort to bring down fertility and the growth rate of popula-tion. A feasible goal would aim at a population growth rate of 2.07 by theyear 2000. Poor families lack access to family planning services, andconsequently have higher fertility and lower contraceptive use rates thanthe general population. Past programs have suffered seriously from under-
- 59 -
funding and insufficient Government commitment, resulting in insufficientsupplies, poor staff morale, and confused administration. Overall, theexisting Government programs should be expanded, the level of expendituressignificantly increased, and the delivery of services made more effective.While the existing clinic and community based network is an effectivedelivery mechanism, it should be expanded so as to reach more families, andintegrated with the delivery of nutrition and health care. In addition,non-government organizations should be encouraged to expand in cooperationwith public sector programs, since these organizations have proven to bemost effective in delivering family planning services.
4.23 Health/Nutrition. The existing health care system is not adequateto deal with the health needs of the population, particularly the poor.The present pattern of diseases suggests that greater efforts are needed inpromotive and preventive health care services, including immunization,sanitation and hygiene, nutrition, and maternal and child care (MCH). Italso calls for wider coverage of curative services in the rural areas, andstronger efforts to counteract inappropriate beliefs and attitudes abouthealth care prevalent among the poor.
4.24 The Government's updated Medium Term Development Plan (1988-1992)articulates a health development policy framework which aims to:(a) expand and improve disease control and service delivery, with emphasison the neediest segments of the population; (b) strengthen decentralizationof the health network and systematic involvement of local governments,private providers of health services and NGOs in development of effectivecommunity-based services; (c) strengthen planning, management aridimplementation capabilities of the health sector; (d) strengthen theregulatory functions of the Government and balance public and privatesector roles in provision of curative care; (e) expand investments in thehealth sector and broaden the mechanisms of financing health services; and(f) promote responsible parenthood and strengthening of family planning.
4.25 The Government already has a system of rural health units (RHUs)and barangay h'alth stations (BHS) that provide services in rural areas.However, the present system needs to be expanded. In general, there is aneed to develop a system that targets poor household in each barangay,particularly those who are nutritionally at risk, and concentrate MCHinterventions on these households. In addition, there is a need toemphasize information, education and motivation components of the program.In these areas, there needs to be an expanded role for the voluntary healthworkers (VHWs) in identification, education and referral activities.
4.26 A major expansion of the budget is required, with an emphasis onexpanded preventive services. More resources are required to finance alarger number of health workers, the training and supervision of theseworkers and the VHWs, better facilities, and logistics and supplies at theBHS/RHU level. Nutrition programs should also be expanded, both in qualityand coverage, and focused on high-risk groups. Present programs do notreach a large number of preschool children that need assistance, whilecovering a significant proportion of school and preschool children who arenot at risk.
- 60 -
4.27 While expanded health/nutrition/family planning programs willrequire raising per capita public health oxpenditures, this resource burdencan be reduced by greater efforts at cost recovery from the non-poor. Atpresent, cost recovery in public hospitals is only 1OZ of total expend-itures. Even if fully paid, fee schedules are presently below the marginalcosts of providing services. Fee schedules should be adjusted upwards, andthe non-poor asked to pay the difference between Medicare reimbursementsand hospital costs. Hospital care and medicines should continue to beprovided to the poor free of charge. But supplies of medicines in hos-pitals need to be increased, so that poor families are not forced to buyneeded medicines from private sources.
4.28 Education. Although the majority of the poor have access toelementary education, the system tends to be regressive at all levels. Atthe elementary level, regressivity stems from the variance in quality bet-ween schools, where poorer students receive lower quality services. At thesecondary level, poorer students lack access to the higher quality privatesystem, and at the tertiary level, they lack access to subsidized publiceducation facilities. A prime objective is to raise the quality of elemen-tary and secondary schools, and to increase the attendance rates of lowincome children. In general, the education system is characterized by ahigh degree of wastage. Of the entering class in grade one, about 35Z dropout before reaching grade six, the last year of elementary education.According to a 1983 data, the wastage was highest among children in ruralareas in the lowest decile of the income distribution. Among thesechildren the dropout rate was 42Z compared with 5-10% among children in thehighest decile of the income distribution. Preliminary analysis shows thatthe primary reasons for leaving school are the low motivation of children,quality of schooling, and financial burdens on parents of school relatedsocial amenities (e.g., shoes, clothing, paper, pencils). Public policiesneed to address these issues to reduce social iniquities.
4.29 Directed expenditures, such as clothing and supplies, can helpretain children in school. Expenditures on non-wage items (books, desks,training of teachers) should be increased and directed at schools cateringto lower income students. Expenditures on tertiary education should takethe form of scholarships for low income students, financed by appropriatetuition increases for the non-poor.
- 61 -
Chapter IVANNEXPage 1 of 3
Progress in Land Reform
1. With the signing on June 10, 1988, by the President of Republic ActNo. 6657, the long-awaited Comprehensive Agaraian Reform Program (CARP) hasbegun to take shape. CARP is clearly modeled on the successful land reformprogram carried out in Taiwan in the 1950s, and its stated intentions, inbalancing landed and landless interests and attempting to sustain farm produc-tivity, are commendable. Nevertheless, it has controversial sections.Specifically:
(a) retention limits are set at 5 ha for each landowner, and 3 ha foreach child who is actively managing the farm. Although theDepartment of Agrarian Reform (DAR) assumes an average of only twochildren per family can exploit this provision (implying 11 haretention per family), the actual number could be higher;
(b) landowners and their heirs, whose titles were obtained under thehomesteading provisions of an earlier law can retain their land (24ha each). The number and total area of homestead grants iscurrently unknown, but is likely to be significant in areas such asMindanao;
(cc a prescribed order of priority requires Parts A and B of CARP1 toprecede Part D (public lands) as well as in excess of 50 ha per farmunder Part C (private lands), all of which are to be distributed by1992. Land holdings between 24 and 50 ha is to be completed in1992-95, and those between the retention limits and 24 ha during1994-98;
(d) plantations on public land leased by multinationals, up to a 1,000ha limit, are allowed to continue under these leases at least until1992, even though ownership rights may be transferred to individualbeneficiaries in the interim (this affects, for example, pineappleplantations in Mindanao);
(e) "commercial farms,n defined as lands devoted to commercial livestock,poultry, and swing raising, aquaculture, fruit, vegetables, and cut-flowers, cacao, coffee and/or rubber, are deferred for ten yearsbeginning from the first year of commercial production. These is nocutoff date for establishing such farms; and
(f) land transfers "in violation of this Act" are disallowed from thedate of effectivity (June 10). but three months are allowed forregistration of such transactions, and attempts to pre-date suchtransfers can be expected.
1/ Part A refers to rice and corn lands subject to land reform under the1972 legislation. Part B refers to idle, abandoned, foreclosed orvoluntarily offered lands.

- 62 -
Chapter IVANNEXPage 2 of 3
2. Landowners have one-half year in which to register their properties,but they need not fear quick expropriation thereafter. Considerable work isstill required of DAR to formulate implementation guidelines. In addition tothe loopholes noted above, there are also opportunities for landowners to holdup implementation by legal challenges to land valuation, which now requiresconsideration of eight different factors. A number of bottleneck points,outside of DAR's control, will also slow implementation: surveying managed byDENR's Land Management Bureau, registration of titles by the Department ofJustice, and landowner compensation by Land Bank. However, finances may bethe ultimate source of delay: landowner compensation is likely to involve25-35% cash payments or, at the landowner's option, Land Bank bonds which canbe applied at full face value to offset various taxes and fees (equivalenttherefore to 10OZ cash payment).
3. At this point, it is difficult to specify the scope and effects ofCARP (Part C) in practice, since landowners have so many options open to them.It is unlikely that it will damage agricultural productivity, as participationby the major growth subsectors is largely deferred and CARP creates incentivesfor conversion of land use to some of the most promising commodities. Planta-tions are most likely to avoid subdivision by establishing worker cooperativesor associations to hold shares equivalent to land value. Landowners likely tosurrender most of their land are those with large but unproductive holdingsand little interest in direct management (especially absentee landlords).There are also likely to be far more potential land recipients than there island available for distribution. Indeed, the possibility that CARP mayincrease rather than decrease landlessness (as a result of attempts to evadecoverage) cannot be ruled out.
4. Part D of CARP (public land, mainly in the uplands) should be morepromising, because it involves more land than Parts A-C combined (over 4 mil-lion ha) and few inescapable obstacles stand in the way of implementation.However, implementation is to be given second priority, and in fact theDepartment of Environment and Natural Resources (EDENR), which controls PartD, has deferred any distribution until 1990, on the grounds that land classi-fication and surveying exercises will require two years' time. Nearly half ofPart D lands are slated for distribution of Stewardship Contracts (CSC's, aform of 25-year leaseholds) rather than titles, yet these are regarded bybeneficiaries as inferior tenure instruments (they are not transferables, canbe cancelled at DENR discretion, and therefore have no collateral value). Atpresent the tendency in Government is to assume that Part D lands will belargely available for distribution to tenants or laborers, including those whoare displaced during CARP implementation; however, it may well turn out thatmost lands identified for Part D are already occupied. The potential existsfor implementation of Part D to offset some of the weaknesses than has beencommitted by DENR to CARP; a larger proportion could be classified alienableand disposable and titled; the CSC contract could, at DENR's administrativediscretion, be converted to a better tenure instrument with considerablecollateral value; and execution of Part D could be speeded up.
- 63 -
Chapter IVANNEXPage 3 of 3
5. The Government has recognized the danger of land reform unaccompaniedby augmented support services, and about two-thirds of the estimated US$10.5billion total cost of CARP is allocated for an incremental support programfor "agrarian reform areas". This reflects "rules-of-trnumb" regarding targetincreases in densities of government services per farm or per hectare, as wellas estimated working capital requirements for farmers. Plans for qualitativeimprovements in support services are scill lacking. There are two dangersassociated with this aspect of the CARP program: (a) that CARP support willdirect resources from improvement of support services in non-agrarian reformareas; and (b) that necessary upgrading of support services will be heldhostage to the pace of land redistribution.
6. CARP is founded on equity considerations, qualified by concern foragricultural development, rather than vice versa. From a development perspec-tive, conversion of tenants to titled landowners can provide collateralfacilitating access to formal or informal credit on better terms; in turn,inducing greater use of cash inputs or investment in land productivity. CARPwill not contribute much to collaterization in the short run: titles receivedwill be mortgaged to the Land Bank of the Philippines (LBP) for 30 years andnot otherwise transferable by the beneficiaries, except to heirs, for tenyears. Title recipients (but not CSC recipients) are to have access to aGovernment-guaranteed LBP working-capital credit at sub-market rates ofinterest (15Z), and will lose this access (but not their land) in case ofdefault. This is not a strong disincentive to default, and the LBP will haveto keep close watch on these loans lest beneficiaries soon become dependent onthe informal credit market.
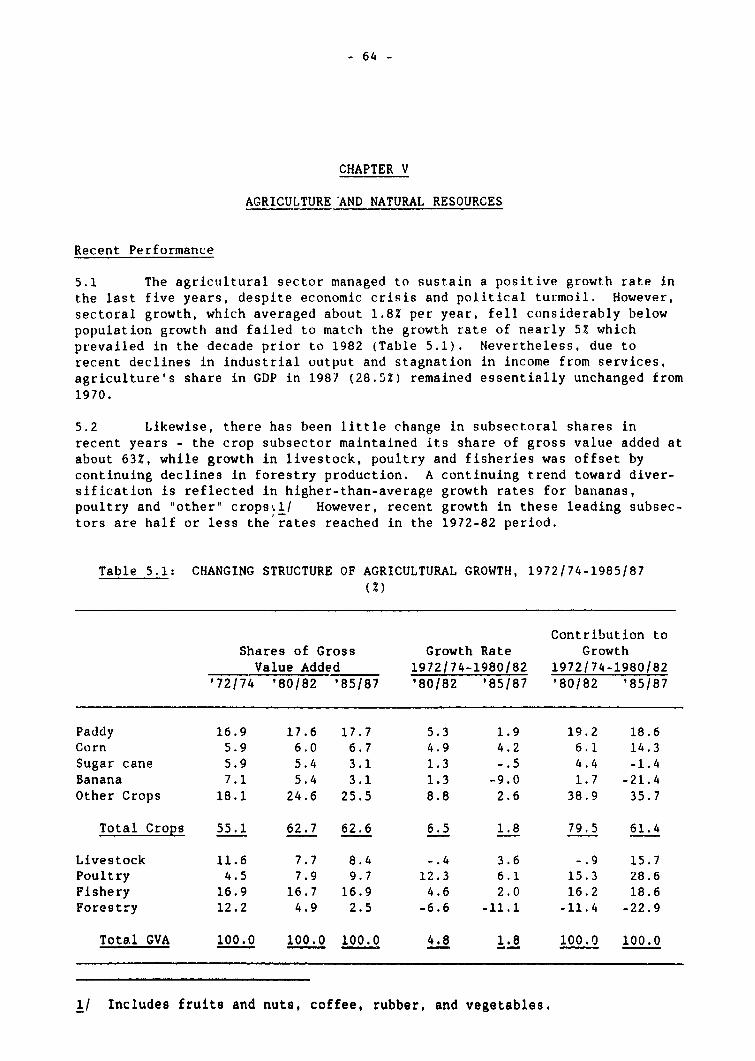
- 64 -
CHAPTER V
AGRICULTURE AND NATURAL RESOURCES
Recent Performance
5.1 The agricultural sector managed to sustain a positive growth rate inthe last five years, despite economic crisis and political turmoil. However,sectoral growth, which averaged about 1.8% per year, fell considerably belowpopulation growth and failed to match the growth rate of nearly 5% whichprevailed in the decade prior to 1982 (Table 5.1). Nevertheless, due torecent declines in industrial output and stagnation in income from services,agriculture's share in GDP in 1987 (28.5!) remained essentially unchanged from1970.
5.2 Likewise, there has been little change in subsectoral shares inrecent years - the crop subsector maintained its share of gross value added atabout 63Z, while growth in livestock, poultry and fisheries was offset bycontinuing declines in forestry production. A continuing trend toward diver-sification is reflected in higher-than-average growth rates for bananas,poultry and "other" cropsdl/ However, recent growth in these leading subsec-tors are half or less the rates reached in the 1972-82 period.
Table 5.1: CHANGING STRUCTURE OF AGRICULTURAL GROWTH, 1972/74-1985/87(%)
Contribution toShares of Gross Growth Rate GrowthValue Added 1972/74-1980/82 1972/74-1980/82
'72/74 '80/82 '85/87 '80/82 '85/87 '80/82 '85/87
Paddy 16.9 17.6 17.7 5.3 1.9 19.2 18.6Corn 5.9 6.0 6.7 4.9 4.2 6.1 14.3Sugar cane 5.9 5.4 3.1 1.3 -.5 4.4 -1.4Banana 7.1 5.4 3.1 1.3 -9.0 1.7 -21.4Other Crops 18.1 24.6 25.5 8.8 2.6 38.9 35.7
Total Crops 55.1 62.7 62.6 6.5 1.8 79.5 61.4
Livestock 11.6 7.7 8.4 -.4 3.6 -.9 15.7
Poultry 4.5 7.9 9.7 12.3 6.1 15.3 28.6Fishery 16.9 16.7 16.9 4.6 2.0 16.2 18.6Forestry 12.2 4.9 2.5 -6.6 -11.1 -11.4 -22.9
Total GVA 100.0 100.0 100.0 4.8 1.8 100.0 100.0
1/ Includes fruits and nuts, coffee, rubber, and vegetables.
- 65 -
5.3 Underlying Causes. Weaker performance since 1982 can be traced tosuch factors as a closing of the land frontier, including decreasing opportu-nities for expansion of arable area and a slowed expansion of irrigated area.The area under HYV rice varieties had reached 84% of total rice area (93% ofirrigated area) by 1982 and, even though three percent more was added by 1986,sharp increases in paddy productivity through conversion of Green Revolutiontechnology were no longer possible. Analogous to the closing of the landfrontier, extractive opportunities in the logging and fisheries sectordeclined as the resources were depleted.
5.4 Productivity advances for crops other than rice tended to be limited.Exceptions occured, however, in crops such as bananas, pineapples, mangoes,and cultured fish where private sector initiative took the lead. The long-standing emphasis of the public research and extension systems in rice leftthem ill-prepared to promote other commodities in non-irrigated areas asengines of growth in the 1980s. An attempt to extend the seed-fertilizer tocorn failed, because smallnolders lacked cdsn or credit to purchase hybridseed and sufficient fertilizer, or were unmotivated because the profits didnot offset the greater risk inherent to this technology.
5.5 The unfavorable influence of fundamental conditions was compounded bythe contraction of international markets for the Philippines' main agricul-tural export products. The long decline from peak historical levels of inter-national prices of agr_.cultural commodities, which began in the mid- 1970s,was aggravated by maintenance of an overvalued exchange rate. A series ofmajor devaluations was forced by the economic crisis beginning in 1982, whichhelped to offset adverse international market conditions. Due to expirationof long-term preferential export contracts, exports of sugar fell sharplybeginning in 1983-84; the Philippines could not profitably compete at normalworld prices, although the domestic market remained shielded. The resultingexcess supply in domestic markets forced the beginnings of diversificationprocesses which have yet to run their course. Exports of coconut productsdropped in 1984-85, but returned to normal in 1986 at prices half those of ayear before. Despite the long-term decline in world prices and the yields ofaging trees which have reduced the income from coconut lands to the pointwhere coconut farmers are among the poorest rural inhabitants, farmers havenot yet found alternatives which justify cutting down the trees.
5.6 Also associated with the economic crisis were the reduced avail-ability of (subsidized) form"! and informal rural credit, record highfertilizer prices and corresponding increases in market rates of interest,particularly in 1984-85. These factors limited growth in use of chemicalfertilizers, and in 1984-85, fertilizer applications actually tell belowlevels reached a decade earliers. Public expenditures on agriculture werealso cut back during 1983-86, more rapidly than the overall decline in publicexpenditure. Finally, the stagnation or (after 1983) decline in real wages inurban areas has put a brake on overall demand for commodities with high incomeelasticities, such as meat, poultry, fish and fruit.
_ 66 -
5.7 Policy Changes. A more favorable policy environment has at leastpartially offset the negative fundamentals of the 1980s. The beginnings ofliberalization occurred with the onset of the economic crisis. Measures takenincluded: opening up of import trade in animal feeds and wheat, phasing outof price controls on rice, poultry, eggs and pork, deregulation of interestrates and phasing out of subsidies for agricultural credit. Moresignificantly, the successive devaluations of the peso from 1982-86 helped tooffset the declines in international market prices of export commodities. Thenew Government, after assuming power in February 1986, moved quickly tofurther reduce distortions unfavorable to agriculture and institutionalconstraints on the sector, with the objective of increasing farmprofitability. Measures taken include: (a) lifting of the copra export ban;(b) abolition of monopolies and monopolistic structures; (c) liberalization ofurea and potash imports and distribution; (d) abolition of all export taxes;and (e) exemption of most agricultural inputs from taxes and customs duties.The Government has also sought to isolate domestic markets from internationalprice fluctuations as much as possible, primarily by discouraging imports ofrice, corn and other domestically-produced farm products.
5.8 These measures, in combination with international and domestic markettrends, have created a market environment unusually favorable to grainfarmers. For example, the nominal protection given to rice farmers averagedabout -32Z in 1981-82, but rose to +672 on average in 1'85-87; for yellowcorn, protection increased from -4% to +24% in the same period.2/ Trends inthe relationships between grain and fertilizer prices (Figure 1), confirmrapid improvement in incentives for input use in the last three years. Thegraphs do not reflect the decreased margins between import and farmgate pricesof fertilizer (distributor margins have fallen from about 40% to 20% of retailprices during 1984-87 due to liberalization measures). During this time,consumption of fertilizer nutrient has shot up by 83%, to a level 40% abovethe previous peak in 1983.
21 Nominal protection here measured as the relationship between thedomestic price and the world price, adjusted to farmgate equivalent.
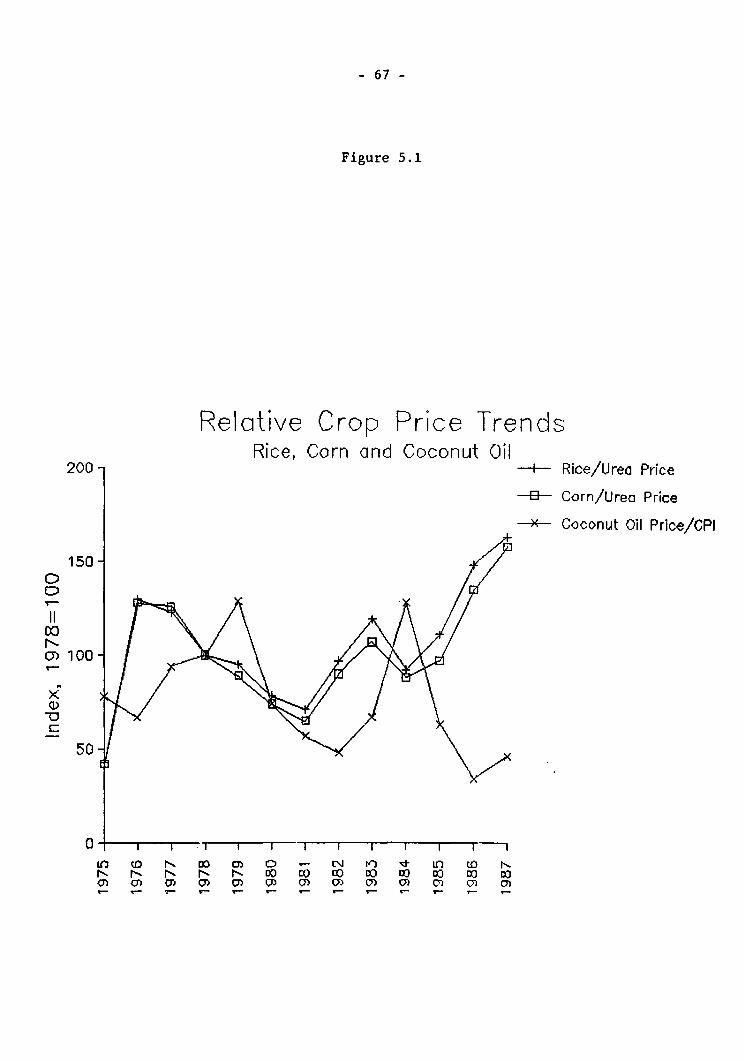
- 67 -
Figure 5.1
Relative Crop Price TrendsRice, Corn and Coconut C)il
200 - I Rice/Urea Price
E- Corn/Urea Price
-x Coconut Oil Price/CPI
150-C)
00
OI-0) 100
50
50
Lfl tO N co cm O N n f -t w La NS F r- r- r- oo w co co w ] a:
N N) N N N 0 a O 3 0 0 03 03
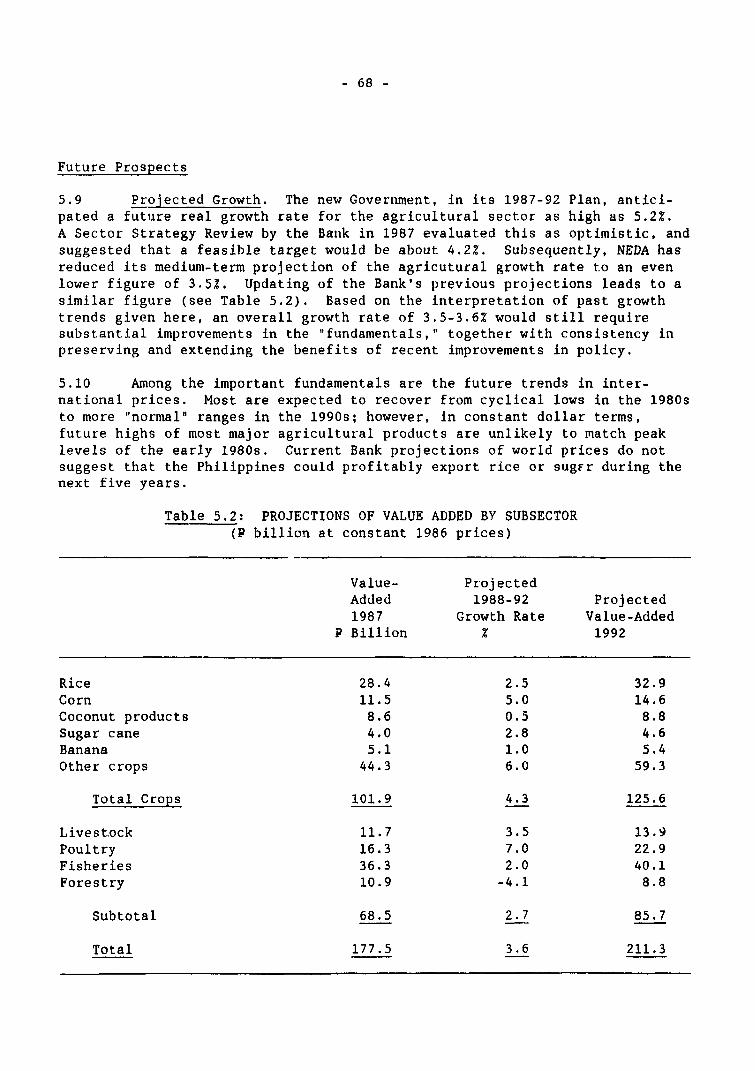
- 68 -
Future Prospects
5.9 Projected Growth. The new Government, in its 1987-92 Plan, antici-pated a future real growth rate for the agricultural sector as high as 5.2%.A Sector Strategy Review by the Bank in 1987 evaluated this as optimistic, andsuggested that a feasible target would be about 4.2Z. Subsequently, NEDA hasreduced its medium-term projection of the agricutural growth rate to an evenlower figure of 3.5%. Updating of the Bank's previous projections leads to asimilar figure (see Table 5.2). Based on the interpretation of past growthtrends given here, an overall growth rate of 3.5-3.6Z would still requiresubstantial improvements in the "fundamentals," together with consistency inpreserving and extending the benefits of recent improvements in policy.
5.10 Among the important fundamentals are the future trends in inter-national prices. Most are expected to recover from cyclical lows in the 1980sto more "normal' ranges in the 1990s; however, In constant dollar terms,future highs of most major agricultural products are unlikely to match peaklevels of the early 1980s. Current Bank projections of world prices do notsuggest that the Philippines could profitably export rice or sugEr during thenext five years.
Table 5.2: PROJECTIONS OF VALUE ADDED BY SUBSECTOR(P billion at constant 1986 prices)
Value- ProjectedAdded 1988-92 Projected1987 Growth Rate Value-Added
P Billion Z 1992
Rice 28.4 2.5 32.9Corn 11.5 5.0 14.6Coconut products 8.6 0.5 8.8Sugar cane 4.0 2.8 4.6Banana 5.1 1.0 5.4Other crops 44.3 6.0 59.3
Total Crops 101.9 4.3 125.6
Livestock 11.7 3.5 13.9Poultry 16.3 7.0 22.9Fisheries 36.3 2.0 40.1Forestry 10.9 -4.1 8.8
Subtotal 68.5 2.7 85.7
Total 177.5 3.6 211.3
- 69 -
5.11 At the same time, fertilizer prices have begun a sharp upturn andt'his will continue for the next few years. By as early as 1989, the currentlyfavorable relationship of grain to fertilizer prices in the internationalmarket will have been reduced to the unfavorable relationship of 1985. Ofcourse, continued protection of the domestic grain market from internationaltrends, or introduction at an appropriate time of subsidies to fertilizer usecould at least dampen the effect on domestic production incentives.
5.12 The growth rate of domestic demand is a crucial factor, which isdetermined by the dynamism of the urban, industrial and service sectors.Commodities with the highest income elasticities of demand typically have highvalue-added, and are potentially the growth leaders for the sector.Conversely, the income elasticity of demand for corn as food is negative andfor rice very low; per capita demand for these grains has grown under condi-tions of declining real incomes, and may fall if this trend is reversed. Themoderately high growth rates of GDP and private consumption projected inChapter III would be expected to strengthen demand for such preducts as meat,poultry, fish, fruit, sugar and yellow corn, but slow growth of demand forrice and white corn.
5.13 The Need for Intensification and Diversification. The limited scopefor expansion of cultivated area, and the still low levels of crop yields andfertilizer use, dictate a strategic emphasis on intensification. In the irri-gated paddy rice areas, remaining opportunities to extend HYV use or increasedry-season irrigation are limited. Diversification in these areas should be amajor goal - not at the expense of rice, but rather through direction ofincremental resources to development of other commodities and to rainfed orupland areas. Particular emphasis should be given to commodities with highprofitability and good market prospects, notably including many treecrops,spices, meat, vegetables, flowers, etc. These generalities are largelyaccepted by Government and reflected in donor assistance priorities. However,the strategies for implementation remain unclear.
Credit: Reform and Rehabilitation
5.14 The rural credit market includes both formal and informal lendingsources, the former comprising the LBP, supported by various Governmentlending, guarantee and subsidy programs for agrarian reform beneficiaries, theprivate rural banks, and assorted thrift banks with partly-rural lending port-folios. The formal sector supplies only 10-15% of rural credit, reaching thelargest and best collateral borrowers; and it provides primarily short-termlending, that is, production loans for the duration of a one crop season.Market interest rates on loans benefiting from 85X Government guarantees arepresently around 231. The informal sector - including landlords, family andfriends as well as commercial middlemen - accommodates both collateralized anduncollateralized borrowers. Interest rates are frequently over 100% on anannualized basis, but are not intolerable when applied to loans typicallyrepaid within the span of a three-month crop season. The terms and availabi-lity of credit from the formal and informal sectors are closely related;indeed, the LBP funnels a part of its production credits through distributorsof seed and fertilizer, who are in a better position to supervise use andrepayment.
- 70 -
5.15 During the last five years the rural banking structure that haddeveloped during the preceding two decades was virtually crippled as a resultof Government-subsidized interest rates and imprudent loan decisions. Thiseliminated a large proportion of formal production credit available to manyfarmers, forcing the informal sector to take over a.much larger share. TheGovernment is facing the major task of rehabilitating the large number ofbanks with high arrearage problems ("non-performing loans") and developing newagricultural credit policies. The Central Bank is in the process of restruc-turing the rural banking system. Out of 850 rural banks, about 300 arehealthy, another 300 require rehabilitation, and over 200 should be closed.Twenty-one separate Government-run loan funds have been merged into a singlefund (the CALF or Consolidated Agricultural Loan Fund) which, instead ofmaking direct loans at subsidized interest rates, guarantees small agricul-tural loans at market or near-market rates.
5.16 The process of banks rehabilitation should be paralleled by a simul-taneous improvement in the "policy environment' for rural lending, with theobjectives of (a) reducing the cost of funds to smaller rural banks; (b) mini-mizing credit risks associated with rural lending; and (c) reducing costsassociated with the small size of rural and agricultural loans. Appropriatemeasures would include a staged increase in equity requirements for ruralbanks and encouragement of takeovers and consolidations (after the rural bankadvantage of a lower reserve requirement is removed). Certain restrictions onrural bank lending, which have proved unenforceable, should be removed, suchas the required retention of 75% of deposits in the geographical areareceived, or the mandatory proportw-nf of lending portfolios for agriculturalor agrarian reform beneficiaries -.ie Agri/Agra requirements). Rural bankdeposits in commercial banks sh-i-Ld oe treated as interbank deposits, ratherthan subject to the same tax treatment as personal accounts. A more liberalpolicy toward bank branching should be pursued in the rural areas (less strin-gent applicability of the monopoly test). The Philippine Deposit InsuranceCorporation (PDIC) should be strengthened to provide more credible guaranteesof rural bank stability, and should take over from the CB the function of bankrehabilitation. The LBP's new secondtry rediscounting facility for ruralpaper should be encouraged to develop and, in the long run, a term fund shouldbe developed which can raise money from domestic and international financialmarkets.
5.17 Although these measures are important, even a rehabilitated formalcredit system is not likely to reach most small farmers, particularly themajority of the rural population who lack collateral. For the latter, specialmechanisms are necessary to reduce risks and absorb supervision costs: thereis no substitute for close supervision of borrowers by individuals who haveinsights into both agricultural management and family economy. Who shouldperform such supervision is open to exploration, but probably neither govern-ment nor bank staff could provide a cost-effective supervisory service. Theideal source of retail loan supervision may be cooperatives or NGOs withconsiderable training and reasonably well-paid staff. Other risk-reducingmechanisms may include crop insurance, loan guarantees, and the quedanguarantee system, all of which are being tried in the Philippines.
- 71 -
5.18 Credit reform and rural bank rehabilitation aside, agriculturaldevelopment is likely to benefit most from macroeconomic policy which leads toreduced interest rates and increased credit availability. Liberal availabi-lity of credit would filter through both formal and informal credit systems toall classes of borrowers. Moreover, studies have indicated that the highinterest rate is one of the two most important obstacles to improved function-ing of the distribution system (the other being a deteriorated and inefficienttransport system). It accounts for most of the seasonal price fluctuations ofstorable crops, for the failure of fertilizer dealers to take out letters ofcredit in time to meet market demands, and their failure to maintain adequatestocks, especially in the more distant or isolated markets.
Public Services: Decentralization, Reform and Redeployment
5.19 During 1987-88, the government departments and agencies mostconcerned with rural development have undergone a continuous process ofreorganization and decentralizatien designed to strengthen and realign theirfunctions and make them more responsive to local needs.3/
5._O The institutions most directly involved in provision of services tothe agricultural sector are the Departments of Agriculture, Environment andNatural Resources, and Agrarian Reform (DA, DENR, and DAR). All three depart-ments have been subject to regionalization, that is, control of all line func-tions in each department theoretically has been placed under the twelveregional directors, while the central units have become purely staff bureaus,with policy and advisory functions. A major obstacle to regionalization hasbeen the concentration of administrative staff at headquarters. Under reorga-nization, bureau functions were redefined, positions cut, and redundant staffwere given the options of transfer to the regions or early retirement. Thisstrategy appears to have been thwarted by Civil Service Commission andCongressional intervention to protect jobs. Consequently, there are still toofew qualified staff at the regional level, too many routine administrativestaff at headquarters, and the departments must seek budgetary increases tofund an enlarged staff complement if headquarters is to make policy or providetechnical support for the regions.
5.21 Despite this handicap, considerable devolution of power to theregional level has occurred in DA and DENR, although the greatest change willbe the direct transfer of budgets to the region now scheduled for 1989. DENRhas been notably successful in replacing the incumbent regional managers andtheir staff with a new and dynamic group. The DA, on the other hand, hasalready gone through a bottom-up planning exercise, designed to determWnecentral priorities and reconcile budget requests with total allocations forFY1989, employing the newly-organized Agricultural and Fisheries Councils(which involve substantial private-sector representation) at the provincial,regional and national levels. A number of problems emerged from the exercise:(a) the consultative mechanism, which culminated in a national congress4nvolving 1,500 delegates, was cumbersome; (b) the output involved littleinnovation because it was constrained by DA's budgetary categories, overall
3/ For a more complete review of this issue, see Agricultural SectorStrategy Review, (Report No. 6189-PH), October 1987).
- 72 -
resources, and heavy burden of personnel costs (more than 90% of the DAbudget), which left mainly the opportunity to shift staff among program cate-gories; and (c) the "grassroots" is looking for increased public investment(hardware), rather than additional personnel (software).
5.22 Despite recent progress, the DA headquarters is not well equipped to"cut and trim" in accordance with a sense of national priorities among commo-dities, regions, projects and programs. The DA is also handicapped because anumber of agencies which have been attached to it are still operating withconsiderable autonomy (including policy- making independence). Theseagencies, which include the National Food Authority (NFA), Sugar RegulatoryAgency (SRA), and Philippine Coconut Authority (PCA), are run by boards ofdirectors, have non-budgetary sources of funds, have not been subject toreorganization and decentralization, and continue to follow a centrally-directed line agency organizational pattern, to the extent of running theirown research and extension services. Full integration of these agencies intoDA proper may not be politically feasible, but it will be difficult for the DAto affect policy for the agricultural sector if grain, sugar, and coconut areexcluded.
5.23 The DA will seek external donor assistance to expand its extensionservice by 22,000 employees in the next ten years to accommodate theincremental requirements of CARP. This is based on a targeted ratio ofagents: farmers of 1:75, compared to a present ratio of 1:150 in areas nowserved. These ratios are considerably higher than those found or targeted inneighboring countries (Thailand and Malaysia 1:800; Indonesia 1:1,300, withJava/Bali 1:1,600, and transmigration areas and outlying islands 1:500-700).The DA extension service is not regarded as effective or well motivated. Thelow level of salaries, poor training and lack of operating funds, and thedivided (or limited) attention to duties which result, account for much of itsweakness. The geographical distribution of the service is also skewed towardsmore intensive coverage of lowland (rice-corn) areas, particularly in Luzon.Redistribution will be required to meet the demands of CARP as well as the newthrust of DA into the upland areas. While PCA has a better-paid and better-run extension service than DA and a near-monopoly in coconut areas, its agentsare probably not qualified to promote the development of intercrops undercoconut or diversification out of coconut.
5.24 Under *he reorganization, DA's research office has been upgraded tothe level of a bureau (BAR), and regionalization has been applied to researchmanagement. With farmer profitability as its major goal, DA has sought tomake agricultural research more responsive to farm requirements, and edge itaway from its earlier focus on major commodities. Since most of the country'sresearch capabilities are within the state college and university (SCU)system. this has led to a struggle between BAR and the Philippine Council forAgriculture, Forestry and Natural Resources Research and Development (PCARRD)over control of public research funds, particularly at the level of theregional research consortia. At present, research coordination at theregional level and below are handicapped by uncertain delineation of authoritybetween BAR and PCARRD. In addition, DA is unable to &ttract qualifiedresearch staff because of the differential in salaries and honoraria betweenDA and the SCU systems.
- 73 -
5.25 Public Investment. The Government's priorities for public investmentin rural infrastructure, excluding irrigation, include new construction andrehabilitation of (a) secondary rural roads; (b) inter-island shipping;(c) warehousing; (d) fishing ports; (e) communications; and (f) ruralelectrification. In irrigation they include (in order of precedence)(a) completion of ongoing projects; (b) development of small-scale irrigationprojects; (c) strengthening of operation and maintenance; (d) rehabilitationof existing irrigation systems; and (e) implementation of limited high-priority multipurpose projects. These are reasonable lists of priorities, andare generally in accord with previous external studies. However, the backlogof decaying infrastructure and the local demand for new construction are over-whelming, particularly in view of limited funds available from the governmentbudget. Further decisions need to be made, mainly by NEDA and DA, on theapl)zop)riate scale and location of investments, based on evaluations ofinvestment costs and magnitudes of development benefits expected in each area.In the absence of the necessary studies, the local "wish lists" emerging fromdecentralized planning exercises are not being systematically translated intonational investment programs.
5.26 The sharp decline in budgetary support between 1981-86 for capitaloutlays and current operating expenditure in the agricultural sector wasreversed during 1987-88. Support for DA and DAR has clearly surpassed 1981peaks in real terms, although it is unclear whether this extends essentialswithout which these agencies can barely function. The extent of recovery forirrigation (NIA) and rural roads (DPWH) is also uncertain. Capital outlaysfot NIA and DPWH, which fell to one-half or less 1981 levels by 1986, havemost likey not yet recovered; because of the priority of long-deferredmaintenance work, most budgetary increases in any case should be directed tothe operating budgets of these agencies.
5.27 NFA. Rice and corn markets are supported through the activities ofthe National Food Authority (NFA). At present the farmgate support prices areuniform nationwide, regardless of differences in production and transportcosts among regions and between areas (e.g., lowland vs. mountainous) withoutregions. Thnis would be expected to provide differential incentives forproduction in areas more distant from the main marketq. However, NFAgenerally procures from only a handful of surplus area, mostly in Luzon, andpresumably attempts to minimize its own costs of transport, so that theoverall effect is to provide benefits to a select group of farmers.
5.28 NFA has three objectives: (a) maintain stocks sufficient for foodsecurity; (b) stabilization of consumer prices; and (c) stabilization ofproducer prices. These objectives tend to be mutually conflicting, particu-larly under tight budget constraints. Past studies indicate that, of thethree objectives, stabilization of producer prices was least served by NFAactions. NFA procures less than 5% of national production, and, although thisis sufficient to influence prices in the four rice-producing and one corn-producing provinces where its procurement is currently concentratec, theaverage farmgate price has rarely been as high as the support price even inthese regions. In early 1988 the situation was reversed; despite high pricesNFA's procurement targets were not reduced. Since the support price fellbelow the market price in its major procurentent areas, it has been forced toprocure in the mountainous areas at the same price, absorbing the losses on.ansport.
- 74 -
5.29 NFA's existence has also been justified by the desire to stabilizeseasonal price fluctuations. However, studies indicate that, previous toNFA's emergence as a presence in domestic procurement, maximum seasonal pricedifferentials on average ranged from 12-30% in different regions and werealmost entirely due to costs on holding stocks (interest plus losses). NFA'spresence as a stabilizing influence has mainly tended to drive out privatecompetitors who do not benefit from subsidized storage costs.
5.30 NFA's most positive role probably has been in buffering the economyagainst international price fluctuations in grain markets, especially forrice. This could be done more efficiently with a variable tariff pegged to adomestic reference price, relying mainly on the private sector for inter-national trading and stock holding. If Government chooses to maintain bufferstocks, it could at least drop the ineffective and inequitable floor andceilinig price policies, and simply follow profitable trading policies in itsprocurements and sales.
Natural Resource Management
5.31 The issue of natural resources management is inextricably bound upwiti. the population and poverty problems: some of the most significant com-ponents of the degradation and depletion process are a result of activities oflocal, impoverished, and expanding populations. The issue is also closelylinked to the problem of unequal access to resources.
5.32 Historically, public management has been less than optimal, asevidenced by the declines in forestry and the recent stagnation or decline inextractive fisheries, despite the presence of a thicket of laws and regula-tions and a large component of the bureaucracy tasked with enforcement.Indeed, public lands and coastal waters have come to be viewed by the pcpula-tion as open access resources. Rapid environmental degradation and resourcedepletion have been the results.
5.33 In the Philippines, half the land is classified as "Alienable andDisposable" (A&D), which may be privately owned, and the other half, mostlyabove 18 percent slope, as public "forest lands." Of the 15 million ha. of"forest lands," only six million ha are actually forest, and only one millionha is productive, old-growth forest.4/ Logging in the uplands has opened newareas for settlement through road creation and partial clearing of forests.It also reduceb forest habitat for the many species of flora and fauna endemicto the Philippines, and directly contributes to short-run soil erosionproblems. Because of logging (legal or illegal) the old-growth dipterocarpforests, the most valuable commercially, have shrunk from 10 million ha in the1950s to only one million ha today.
Rapid population growth, resulting diminution of unoccupied lowlandarable land, inequitable land distribution and landlessness, and generalimpoverishment create - pressure for migration. Because of the availability
4/ Government underpricing of rights to harvest the public forest hasinduced excessive logging, and discouraged interest in reforestation orplantation forestry.
- 75 -
of semi-cleared land in the uplands, on which immigrants can build betterlivelihood, the direction of migration is to the uplands, as well as the urbanareas. As a result, today about 18 million people, one third of the totalPhilippine population, live in upland areas, of which perhaps 8-10 million arefarming on "forest land." Continuing immigration accounts for the high ratesof growth in resident population, as much as 3.5X in logging concessionareas, compared with a national average of about 2.42.
5.34 Immigrating farmers, as well as most long-established upland popula-tions, employ extensive and subsistence-oriented farming techniques (mainlyshifting cultivation of rice, corn and root crops). Shifting cultivation isemployed because it minimizes cash input requirements by substituting land forlabor and fertilizer. In areas of open access, which applies to most uplandareas and newly settled lands, lack of secure tenure or titling undercuts theincentive for land improvement or nutrient maintenance.
5.35 In the upstream areas of watersheds, loss of vegetative cover leadsto direct loss of soil nutrients, abandonment of fields and compensatoryconversion of further forest areas to cultivation. Downstream, erosion andunchecked rainfall runoff contribute to siltation and increased variability ofriver and stream flows. In combination, these effects are damaging to waterconservancy systems in the lowlands, reducing productivity and increasingsocial costs for maintenance and restor&tion of the irrigation and hydropowersystems. Deteriorating productivity in the lowlands contributes to themigratory "push" (completing a vicious circle). The degradation of theuplands thus entails high social costs.
5.36 Like the uplands, coastal and near-shore fisheries are an open-accesspublic resource which has attracted the most impoverished elements fromadjacent agricultural areas and induced them to use non-sustainable extractivetechniques. Most of this population is dependent on the near-shore (munici-pal) fisheries, which are extremely sensitive to two habitats which figure indifferent parts of the life cycles of various fish, namely the mangroveforests and the coral reefs. The accelerated cutting for fuelwood and coliver-sion of mangrove areas to brackish water fisbponds have reduced the 450,000 haof mangroves thought to exist in 1918 to 240,000 ha in 1980 and 150,000 hatoday. Coral reefs have been destroyed by the cutting and export of coral andseverely damaged by certain fishing techniques. Only 30 percent of theremaining reefs are considered to be in good to excellent condition. Near-shore habitats are also ecologically linked with the inland and upland areas:increased water turbidity and reduced light penetration due to soil erosionreduces growth, or even kills through smothering, off-shore coral reefs andseagrass beds. Destruction of coastal mangrove forests also opens interiorareas to increased typhoon damage.
5.37 Most of the roughly one million people employed by the fishing indus-try are poor, and have few livelihood alternatives which do not add to exces-sive pressure on the resource base. OverfJshing beyond the sustainable yield,and use of destructive fishing methods which are efficient from the viewpointof the individual, are general consequences. Competition between commercialfisheries and the small-scale "municipal fisheries" (with boats under threetons), is also severe, even in the near-shore areas. The municipal fisheries

- 76 -
account for 75% of employment in fishing and 50% of the annual catch, whilethe commercial fisheries employ only 6Z percent of the workers but catch 26%of the fish.
5.38 General Strategy. Improved management of natural resources requiresan attack on underlying causes of degradation and depletion. This shouldiiiclude equitable redistribution of land ownership rights (CARP) and an activefamily planning program to control population growth rates, to reduce the"push" factors causing migration into the uplands and coastal strips.Although legal regulations and better enforcement mechanisms are alsorequired, these will continue to be ineffectl- without an institutional andincentive structure which induces use of sustainable resource management tech-niques. Such a structure could invol're a blend of three approaches:(a) devolution of management authoiity over much of the public domain to usercommunities able to institute common property management regimes;(b) increased privatization of user rights, including titling with userestrictions and/or improved forms of leaseholds on public land; and (c) fullextraction of economic rents by the Government in return for limited rights ofaccess to public resources. These principles should be applied to both theupland and the coastal/nearshore resources.
5.39 The Uplands. One of the first steps required is a determination bygovernment of which areas need to be protected and managed in perpetuity bythe government at central or regional levels. This should probably includeparks, biological reserves and wilderness areas, primary and productiveresidual timberlands or mangrove swamps, critical watersheds, and little else(full land-use classification exercises are unnecessary, and merely provide anexcuse for delaying action). Government should then intensify its managementrole on these areas, letting the remaining areas (well over one-half of thepublic domain) devolve to local and/or private management.
5.40 Intensified management of the remaining public domain would be themain responsibility of DENR. It has essentially three main tasks to accom-plish: (a) instituting a land use or timber extraction pricing and policysystem which captures full economic rents and creates incentives for sustainedforest management; (b) devising incentives for cooperation of local popula-tions (mainly shifting cultivators; and (c) upgrading its own organizationalcapabilities, involving training, improved mobility and communications, and amonitoring system which maintains integrity. Notable beginnings have beenmade in each of these tasks in the last year.
5.41 The remaining public land should be deliberately used to satisfy theland-hunger of the Philippine population. Devolution of control over privati-zation of the remaining public land should recognize that much of this land issuitable for settled crop cultivation or tree farming, if proper techniquesare used, and that tenure security is necessary but insufficient condition foradoption of these activities. There is already a useful legal precedent inPresidential Decree No. 1998 (1985), which provides for reclassification asalienable and disposable (A & D) lands, lands with slopes above 18% in Ceburnd Benguet Provinces which are farmed using effective erosion control prac-tices like terracing and contouring. Implementing guidelines 'currently underreview) would subject titles to conservation-oriented land use restrictions.

- 77 -
As a transitional measure, there is much to recommend upgrading of the Certi-ficate of Stewardship Contract (CSC) into a tenure instrument available to allupland farmers which would allow them ten years in which to demonstrate theireligibility for titling through adoption of sustainable cultivation tech-niques. An alternative to privatization, applicable particularly to indigen-ous communities with historical land claims in some upland areas, is recogni-tion of collective land tenure rights and development or reinforcement ofexisting common property management schemes at the community level.
5.42 For the upland farming communities, with or without titles, thegovernment should p)romote settled upland agriculture using sustainable produc-tion techniques which maximize retention of soil and water. Appropriate tech-niques are known and undergoing trials in many parts of the Philippines, butthere is a need to identify techniques which are most profitable to farmerswith minimal subsidies, and to develop programs to promote widespreadadoption, not merely unreplicated demonstrations. This is the function ofextension work and at present neither DA nor DENR have the capacity to serviceupland cultivators. Decisions must be made on whether DA's extension serviceor DENR's "Integrated Social ForŽstry" program is to take the lead and withwhat division of labor (this may depend on the proportion of public ForestLand which is redefined as "agricultural," and made eligible for titling). Inany case, the capability of both agencies will need major upgrading.
5.43 Coastal Areas. The main coastal resources - the coastal strip andnearshore fisheries - are already subjected to excessive pressure. Ratherthin "intensification" of production, reduction of pressure on the resourcesthrough the introduction of common-property management systems should be themain thrust of strategy: this is likely to increase total production andlabor productivity. The second thrust would be to make access to coastalresources more equitable, by limiting, redistributing or simply enforcingaccess rights.
5.44 Common-property management system can only be run successfully byusers and local governments, which indicates that regulation of access tocoastal strips and municipal fisheries should be decentralized to the munici-pal level. This requires amendment to existing legislation, which grants fewregulatory powers in fisheries to the municipality. Although some newnational regulations are needed, such as an increase in the minimum legal meshsize for nets, and a broader definition of the commercial gears which are tobe excluded from municipal waters, in general more active enforcement ofexisting laws by a combination of national and local authorities is required.Also, some new legal instruments are needed, such as restricted titling formangrove replanting areas and tenure instruments for control of nearshoreseabeds. For equity and livelihood reasons, both laws and their enforcementmust be tightened to more effectively exclude commercial trawlers from munici-pal waters.
5.45 Prospects for intensification in agriculture are far better than infisheries, so measures to encourage intensification should be concentrated inagriculture in order to retain or attract labcr which would otherwise flowinto fisheries. Efforts to improve the livelihood of small-scale fishermanmay include promotion of mangrove replanting/maintenance, artificial reefs,

- 78 -
fish attractants, mariculture and opportunities in the tourist trade, none ofwhich necessarily increases pressure on the resource base. However, takentogether, these activities mainly promote equitable distribution of livelihoodopportunities and induce development of common property management regimes.Only reductions of fishing pressue'e, including creation of coral reef fishsanctuaries, will actually increase the resource base, so attention mustalways be paid to the equitable distribution of livelihood opportunities.
5.46 In both forestry and fisheries, future growth in production, if any,will come almost exclusively from cultural (as opposed to extractive) activi-ties. In the uplands, aside from public investments in reforestation, meansshould be found to facilitate private-sector industrial tree planting. Freshand brackishwater aquaculture are developing well largely on private sectorinitiatives and strong market demand; the main task for government is to makesure that future growth does not come at the expense of coastal fisheries viafurther conversion of mangroves to fishponds.
5.47 Pricing Issues. The Government's pricing system for natural resourceuse has been by far the most important source of distortions affecting thesector. The basic problems is that Government has largely set resource usecharges (often in the form of taxes or fees) at very low levels, so that userswho obtain licenses or concessions can extract most of the economic rent.This encourages "rent-seeking behavior," including diversion ofentrepreneurial attention from non-extractive activities (or from use ofprivate resources to 'free" public resources). It is also a potential sourceof government corruption. The most notable example is the system of fees andtaxes charged to logging concessionaires, which in the recent past has yieldedonly around ten percent of potential economic rents. The Government has justbegun to correct this situation: only this year, charges levied on loggingconcessions were tentatively increased to levels which may be about one-halfof economic rents, and there have been experiments with stumpage biddingsystems.
5.48 Related to this issue, the low level of government charges for fuel-wood extracted from public lands, aside from representing revenues foregone,has probably depressed market prices, discouraging use of substitute fuels andmaking private fuelwood production an unviable proposition. The collection ofgovernment timber revenues largely as flat fees based on volume removed (nottotal merchantable timber volume, and with little or no differentiation byspecies, grade, and site condition) contributes to the selective cutting ofmore valuable species, the high proportion of slash left on the forest floor,and excessive damage to the residual. Any of a number of alternative systems--highly differentiated specific charges, ad valorem charges, income taxes, orsite rents--would promote more complete utilization of merchantable timber,reduce wasteful deforestation, and simultaneously increase the economicbenefits accruing to the local economy.
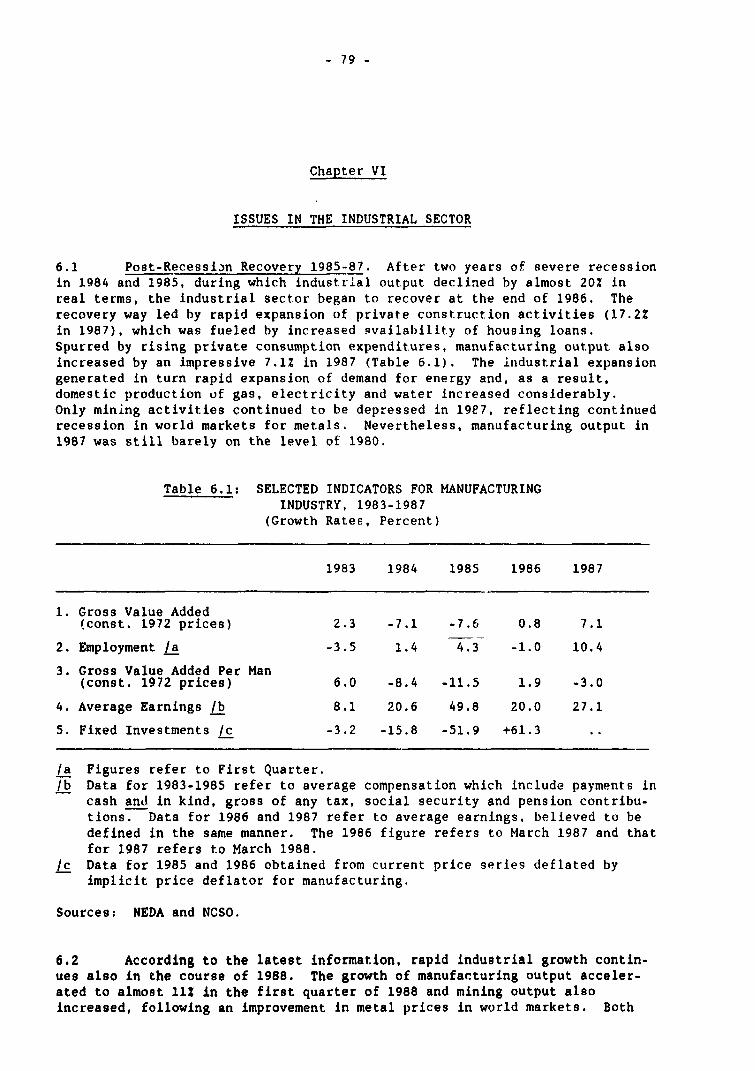
- 79 -
Chapter VI
ISSUES IN THE INDUSTRIAL SECTOR
6.1 Post-Recessian Recovery 1985-87. After two years of severe recessionin 1984 and 1985, during which industrial output declined by almost 202 inreal terms, the industrial sector began to recover at the end of 1986. Therecovery way led by rapid expansion of private construction activities (17.2?in 1987), which was fueled by increased svailability of housing loans.Spurred by rising private consumption expenditures, manufacturing output alsoincreased by an impressive 7.12 in 1987 (Table 6.1). The industrial expansiongenerated in turn rapid expansion of demand for energy and, as a result,domestic production of gas, electricity and water increased considerably.Only mining activities continued to be depressed in 19E7, reflecting continuedrecession in world markets for metals. Nevertheless, manufacturing output in1987 was still barely on the level of 1980.
Table 6.1: SELECTED INDICATORS FOR MANUFACTURINGINDUSTRY, 1983-1987
(Growth Rates, Percent)
1983 1984 1985 1986 1987
1. Gross Value Added(const. 1972 prices) 2.3 -7.1 -7.6 0.8 7.1
2. Employment /a -3.5 1.4 4.3 -1.0 10.4
3. Gross Value Added Per Man(const. 1972 prices) 6.0 -8.4 -11.5 1.9 -3.0
4. Average Earnings /b 8.1 20.6 49.8 20.0 27.1
5. Fixed Investments /c -3.2 -15.8 -51.9 +61.3
/a Figures refer to First Quarter./b Data for 1983-1985 refer to average compensation which include payments in
cash and in kind, gross of any tax, social security and pension contribu-tions. Data for 1986 and 1987 refer to average earnings, believed to bedefined in the same manner. The 1986 figure refers to March 1987 and thatfor 1987 refers to March 1988.
/c Data for 1985 and 1986 obtained from current price series deflated byimplicit price deflator for manufacturing.
Sources: NEDA and NCSO.
6.2 According to the latest information, rapid industrial growth contin-ues also in the course of 1988. The growth of manufacturing output acceler-ated to almost 11 in the first quarter of 1988 and mining output alsoincreased, following an improvement in metal prices in world markets. Both
- 80 -
private construction and production of gas and electricity continue to grow atrapid rates, reflecting the growth of industrial activity and expansion ofdemand for housing. The indications are very strong that industrial growth1988 will be at least as rapid as in the previous year.
6.3 Depth of Growth. In addition to the impressive speed with which theindustrial sector got out of the slump, the recent growth has been welldiversified. The rapid recovery of the manufacturing sector has been fueledby the growth in virtually all sectors of the manufacturing industry, withonly tobacco aLLd chemicals being left behind in continued depression. Themost dramatic growth has been registered by three consumer goods sectors; foodmanufacturers, mainly production of sugar, beverage industries and textilesmanufacturers, reflecting prin,drily strong consumer demand in the domesticmarket (Table 8.4 in Statistical Appendix). Strong consumer demand continuedto stimulate domestic consumer goods industries even in the first quarter of1988. By that time, however, even chemical industry began to grow again,reflecting strengthening of domestic demand for industrial chemicals, plasticsand drugs and medicines.
6.4 Employment. As the industrial sector began to recover, demand forlabor increased and so did labor employment. During 1987, industrial employ-ment increased by 380 thousand, representing a growth of 13.6Z. Most of thesegains came from the growth employment in the manufacturing sector. Reflectingfast growth output, most new jobs were created in the textiles ancd garmentindustries. Mining employment increased also sharpLy--by ebout 100 thousand,or growth of 70Z in spite of production stagnation, which in turn reflectedmainly increase In employment in small-scale mining.
6.5 Another factor contributing positively to the growth of employmentwas an improvement in industrial relations. The labor situation stabilizedconsiderably during 1987 as evidenced by the decline in the number of strikesby 25Z. As a result, the total number of man-days lost declined by 47Z. Thesituation further improved in the first quarter of 1988 when the number ofstrikes declined by 70%, and man-days lost fell by 562.1/
6.6 However, in spite of the growth of industrial employment, the employ-ment creation in industry has not been sufficient to absorb all new entrants(1.3 million) into the labor market, and industry remains on the whole adisappointing source of labor employment. At the end of 1987, manufacturingestablishments of 5 or more workers were employing less labor than in 1975.One recent factor behind the disappointing performance has been the slowrecovery of construction industry, which is estimated to be now producing atapproximately the level of mid-1970s and employing less labor than in early1984. The relatively slow growth of employment reflects further the growth ofproduction for the domestic market, which tends to be less labor-intensive
1/ All these figures refer to the economy as a whole but affectparticularly the industrial sector. For further details see RecentPerformance and Medium-Term Prospects for the Philippine Economy;Manila: NEDA, May 1988. See also Table 1.2 in the StatisticalAppendix.
- 81 -
than production for exports. It also reflects structural changes, which havebeen taking place in the manufacturing sector in recent years. For example,the electronics industry is relying less en production of semi-conductors andis moving more into the production of computer components. Last but notleast, the recent growth in v7ages has probably also dampened demand for labor,since the growth of wages has been continuously far in excess of the growth oflabor productivity (Table 6.1).
6.7 Industrial Strategy. The potential for rapid industrial growth inthe Philippines is enormous. Tte Philippines has a highly motivated andmobile labor force, which is well educated, fairly skilled and English-speaking and which can be trained relatively quickly to meet the needs ofmodern business. It ha? by now a fairly long history of industrialization andhas created a large group of modern entrepreneurs. The industry is "leaner"as a result of the deep recession in 1984/85, which enabled only the strongestfirms to survive. The industry has also benefitted from the restructuring offinancial and nonfinancial public enterprises and privatization of assetsunder government ownership. Being an archipelago of islands, the Philippineshas a considerable natural advantage in having access to cheaper sea routes aswell as major markets. As a result of substantial build-up of trade sur-pluses, two large competitors of the Philippines--Taiwan and Korea--have lostrecently their eligibility for the "Generalized System of Preferences" andtheir competitiveness has been also adversely affected by revaluation of theircurrencies. As indicated in Chapter 1, distortions in macroeconomic policiesin the Philippines have been by and large corrected and are no longer majorimpediments to growth. Labor productivity, however, is also low, and thisoffsets some of the advantages of low wages. Thus, unit labor costs in thePhilippines are about equal to its major competitors.
6.8 Future industrial strategy will need to place a considerable emphasison manufacturing exports in the general orientation of the industrial sector.This reflects partly the serious balance of payments situa.ion in which thecountry continues to find itself. The difficulties arise in turn partly as aresult of the heavy debt service burden and also because of serious difficul-ties to maintain the growth of traditional exports. The latter is the resultof external trade barriers and very low income elasticity of demand for theseexports in importing countries. Thus, it will be necessary to further developthe base of no--traditional exports, which include primarily manufacturedgoods. Greater orientation towards manufacturing exports will be also desir-able on the grounds of better employment creation, which export-orientedrather than local-market specialized firms are likely to mobilize. Moreover,domestic demand is unlikely to be expanding at the same pace as in recentmonths as the Government will need to restrain domestic consumer spending toprevent overheating. Furthermore, the domestic market is too small for someindustries to achieve the most efficient size of firms and consequently, toreduce average costs.
6.9 The need to increase industrial exports will necessitate to improveconsiderably the competitiveness of industrial goods. The base of industrialexports is too narrow and the domestic protection of industry is high enoughto believe that large segments of the Philippine industry is still basicallyunable to compete with foreigners without Government support. There is a
- 82 -
pressing need to intensify the backward and forward linkages with successfulexporters and import-substituting firms to spread the industrializationprocess. This will call, however, for major improvement in industrialefficiency, which has been until now a major impediment to industrial growth.
6.10 In order to increase industrial competitiveness, the industrial firmsmust improve considerably the use of its resources, particularly those whichconstitute the comparative advantage vis-a-vis other countries. This willrequire much better performance of industries which rely on labor-intensivetechnologies. At present, some firms producing tradeable goods appear to bein wrong activities and should be either closed down or restructured. So far,they have survived only because of protection awarded to them by theGovernment. But there are also inefficient firms producing non-tradeables andthey survive partly because of the lack of competition and financial supportof the Government.
6.11 In addition to better utilization of resources, another conditionnecessary to improve industrial competitiveness will be to increase substan-tially public and private investments. More investments will be required toincrease industrial capacity, which has now reached the upper limits. Newinvestments will be also required to restructure less efficient firms and toeliminate infrastructural bottlenecks reflected either in the absence ofproper infrastructure or low efficiency of existing infrastructure.
6.12 As impressive as the recent industrial growth may have been and aslarge are all the natural and other advantages to compete, the industry'sfuture remains uncertain. Present industrial growth is constrained by (a)competitiveness of the industry; which will call for new Governmentinitiatives in the area of (b) industrial; (c) trade policies; and(d) institutional reforms. These issues are discussed in the followingsections.
A. Industry's Competitiveness
6.13 Even though the Philippines' traditional exporters are affectedadversely by serious demand factors, the greatest area of concern at presenttime is the question of low competitiveness of some segments of the Philippineindustry. This is reflected not only in relatively high costs of production,but the lack of competitiveness can be also found in some sectors whereproduct quality plays an important role. Some of these problems ofcompetitiveness of the manufacturing industry are of structural nature, andthese are discussed in this section, other factors relate to policy andinstitutional issues, which are elaborated in the next two sections.
6.14 High Production Costs. A recent World Bank's review of theindustrial sector has identified major inefficiencies in the manufacturingsector, which originated in the industrial policies during the 1970s, and someof these distortions persist until the present time. The study found that thetotal factor productivity growth in the manufacturing sector, which representsone indicator of efficiency performance, was negative between 1971 and 1980
- 83 -
(-1.2% p.a.), in contrast to the Philippines' major competitors.2/ As anothetevidence of inefficiencies in the manufacturing sector the study found thatmany firms producing behind high import barriers had negative value added,atworld prices in the beginning of the 1980s. Unfortunately, comprehensive andmore up-to-date information is not available on the true protection that isrequired by domestic firms due to high costs of their operations.Nevertheless, the fragmentary evidence that is available suggests thatdomestic resource costs (DRC) in several industries continue to be excessivelyhigh and that large diversity in costs still persists among firms withinindividual sectors. The sectors with perhaps the largest distortions and,consequently, greater need for action include cement, textiles, pulp and paperand steel.
6.15 Relative Pi-oductivity Performance. The particularly worrying aspectof the efficiency performance of the sector is that the productivity growthhas been much slower in comparison to its competitors. rhis is sbjwn in anextremely disappointing growth of productivity over time and, equallyimportantly, in comparison to the performance of other countries (Figure 6.2).There are indications that this unfavorable productivity trend reflectstechnical inefficiencies, which most likely underlies the disappointing growthof total productivity. In addition, the slow growth of productivity wasprobably also due to economic inefficiencies, resulting from various pricedistortions mainly in the goods markets. Titere are no clear indications thatthe productivity performance has improved in recent years, given thepeculiarities of industrial statistics. As can be seen from Table 6.1 above,the aggregate manufacturing value added per man in constant terms has declinedby about 132 since 1984. However, it appears that this decline is largely dueto a shift within the manufacturing sector towards self-employed and otherunorganized labor, who subcontract to organized private sector firms. Thispractice is widespread, for example, in the garments industry. The practicewill increase the weight of the sector with lower productivity in the aboveindices.
6.16 One reason for the relatively low level of production efficiency andslow process of technological change in the past has been the limited amountof resources devoted to improving technology. The Philippines emerges as acountry with one of the lowest number of scientists and engineers per millionpopulation and the lowest share of R.D expenditures as a percent of GNP. Thetotal factor productivity performance improved dramatically during the periodof 1980 - 1983, when productivity has turned positive and is estimated to havegrown at a rate of 3.2% p.a. The main factor leading to this impressiveimprovement appears to have been the switch to more outward oriented, export-based strategy with less protection.
6.17 A Presidential Task Force on Science and Technology has been formedto identify technological growth potentials and specific policy requirementsdesigned to accelerate technological development and adaptation.
2/ Total factor productivity growth represents the contribution to outputfrom all factors of production after allowing for changes in theiremployment.
- 84 -
6.18 Labor Costs. Another factor underlying the low production efficiencyin the manufacturing sector is related to the condition in the labor market.As noted above, the Philippines has a large, well-educated and highlymotivated labor force but its contribution to manufacturing output has been inthe past few years jeopardized by several industrial disputes. According toTrade Union Council, industrial disputes were blamed in closing down 75factories during the period of 1985-87. The number of disputes has droppeddramatically in the last year, in part because of a Government crack-down onillegal strikes. While the situation has improved, some firms have begun tomove into automation and more capital-intensive technologies, as a means ofreducing employment and limiting exposure to union pressures.
6.19 A general move into capital-intensive technology would clearly behighly undesirable both on employment grourds and in terms of the country'sability to fully utilize its comparative advantage. Real wages in thePhil.ppines' manufacturing sector relative to those of the country's maincompetitors have been falling quite dramatically over the past decade. Thisreflects partly the fact that most wages are not subject to collectivebargaining, and have been declining since the early 1970s in real terms (seeFigure 6.1).3/ )n the other hand, unionized labor, and consequently wagesnegotiated under collective bargaining represents only 10 of the total laborforce. Even though wages of unionized labor in the manufacturing sector tendto be considerably higher than wages of non-unionized labor, and haveincreas?d rapidly in the last two years, they are still internationallycompetitive. The low manufacturing wages have been also the result of rural-urban migration and more dynamic absorption of labor in agriculture, whichtended to depress urban relative to rural wages.
6.20 Financial Constraints. In spite of much improved overallperformance, many manufacturing firms continue to face financial difficulties.Many industrialists consider lack of access to credit as the overridingconstraint in their operations. This constraint appears to be most pronouncedin the case of domestic rather than multinational firms and in the case ofsmall-scale industries. The financial difficulties reflect heavy debt serviceburden due to high gearing in the past and high nominal and real interestrates prevailing in the market at present time. Many smaller firms havedifficulties in obtaining credit for working capital and most domestic firmsinterviewed by the mission have difficulties in raising long-term funds.
6.21 Unfortunately, no detailed information is available on the mostrecent tinancial performance of manufacturing firms. Records kept until theend of 1985 indicated sharp deterioration of solvency indicators for the top1,000 manufacturing firms, which accompanied extremely low average rates ofreturn.4/ While undoubtedly aided by strong recovery and, therefore,increased revenues in 1986 and 1987, the manufacturing firms' heavy exposureto debt must be a major factor determining their financial performance as aresult of high interest rates that prevail currently in the market.
3/ See D. Leipziger, L.G. Hakim and P. Petri: "Trends in ManufacturingCompetitiveness in South East Asia; Washington, D.C., The World Bank,forthcoming.
4/ The reccrds were kept by Business Day, which has been discontinued.
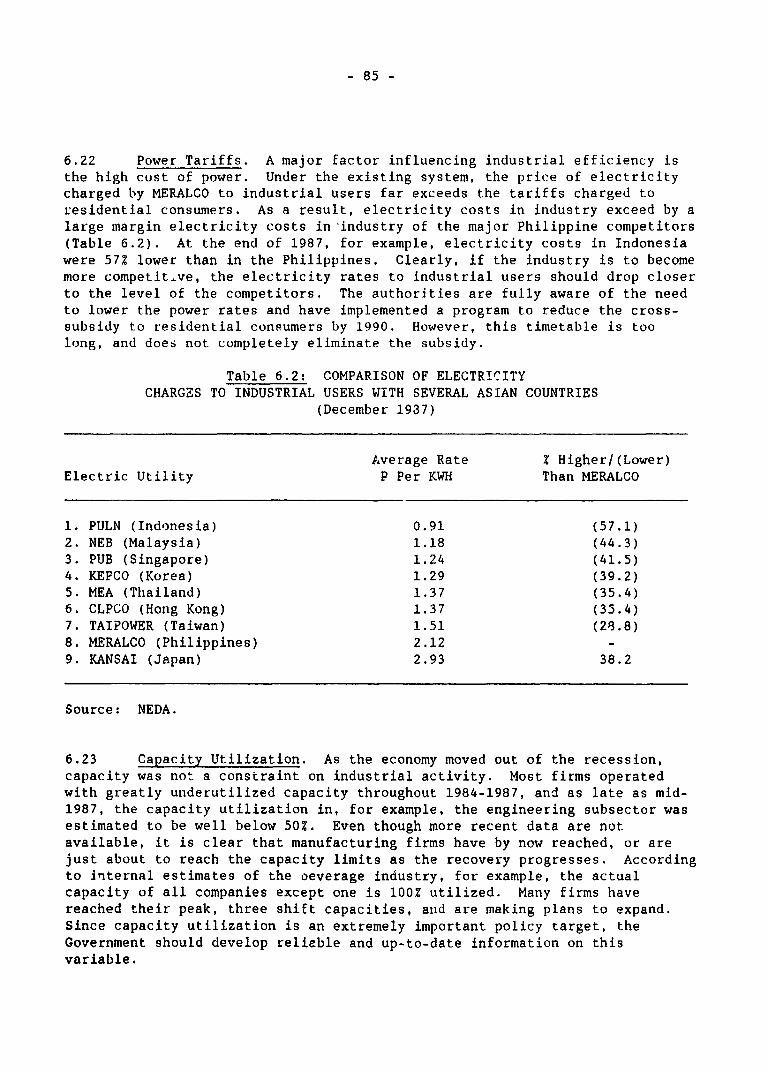
- 85 -
6.22 Power Tariffs. A major factor influencing industrial efficiency isthe high cost of power. Under the existing system, the price of electricitycharged by MERALCO to industrial users far exceeds the tariffs charged toresidential consumers. As a result, electricity costs in industry exceed by alarge margin electricity costs in industry of the major Philippine competitors(Table 6.2). At the end of 1987, for example, electricity costs in Indonesiawere 57% lower than in the Philippines. Clearly, if the industry is to becomemore competit-ve, the electricity rates to industrial users should drop closerto the level of the competitors. The authorities are fully aware of the needto lower the power rates and have implemented a program to reduce the cross-subsidy to residential consumers by 1990. However, this timetable is toolong, and does not completely eliminate the subsidy.
Table 6.2: COMPARISON OF ELECTRICITYCHARGES TO INDUSTRIAL USERS WITH SEVERAL ASIAN COUNTRIES
(December 1937)
Average Rate Z Higher/(Lower)Electric Utility P Per KWH Than MERALCO
1. PULN (Indonesia) 0.91 (57.1)2. NEB (Malaysia) 1.18 (44.3)3. PUB (Singapore) 1.24 (41.5)4. KEPCO (Korea) 1.29 (39.2)5. MEA (Thailand) 1.37 (35.4)6. CLPGO (Hong Kong) 1.37 (35.4)7. TAIPOWER (Taiwan) 1.51 (28.8)8. MERALCO (Philippines) 2.12 -9. KANSAI (Japan) 2.93 38.2
Source: NEDA.
6.23 Capacity Utilization. As the economy moved out of the recession,capacity was not a constraint on industrial activity. Most firms operatedwith greatly underutilized capacity throughout 1984-1987, and as late as mid-1987, the capacity utilization in, for example, the engineering subsector wasestimated to be well below 50Z. Even though more recent data are notavailable, it is clear that manufacturing firms have by now reached, or arejust about to reach the capacity limits as the recovery progresses. Accordingto internal estimates of the oeverage industry, for example, the actualcapacity of all companies except one is 100% utilized. Many firms havereached their peak, three shift capacities, and are making plans to expand.Since capacity utilization is an extremely important policy target, theGovernment should develop reliable and up-to-date information on thisvariable.
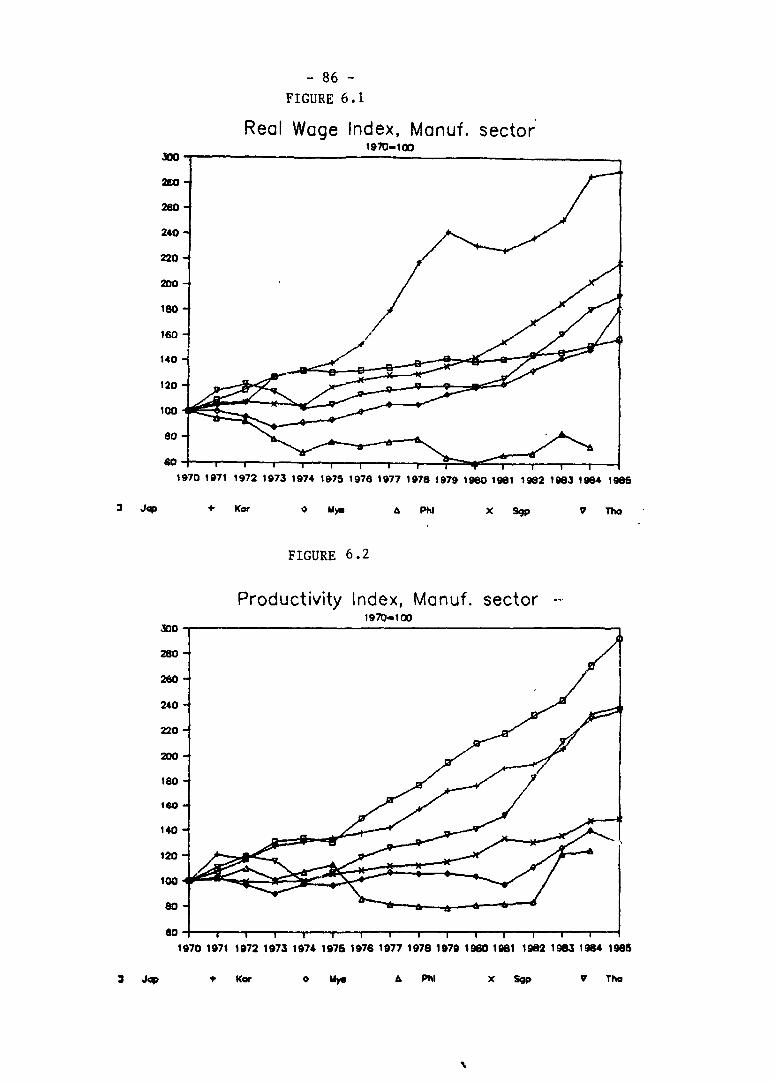
- 86 -
FIGURE 6.1
Real Wage Index, Manuf. sector1970- 10
300 -
260 -/
240 -
220 -
180
160
140-
120 -
100 -
1970 1971 1972 1973 1974 1975 1976 1977 1978 1979 1960 1961 1992 1983 19B4 196
n Jc + Kor o Miv a X Sp V Tho
FIGURE 6.2
Productivity Index, Manuf. sector1970-100
280 -
rO .280
240
140-
120-
100 .
1970 1971 1972 1973 1974 1975 1976 1977 1978 1979 1960 1981 1962 196 1964 1986
3 Jcp + Koe o My. a Phi x Sgp V Tho
- 87 -
B. Industrial Policies
6.24 The relatively poor efficiency performance of the Philippine manufac-turing sector over the years reflected to a large extent poor industrial andtrade policies pursued by the Government in the past, which led to radicalreforms in recent years. Present industrial and trade policies in thePhilippines are the result of major reforms originating in the early 1980s andof further intensification of the reform in the last two years. The recentreforms can be seen particularly as considerable achievement of tYe Governmentin managing the economy. The policies have been reviewed in a variety ofsources with the general conclusion that the reforms have led to theelimination of major distortions in the economy.5/ Most representatives inthe private and public sectors believe that the Government is essentially onthe right track to provide sound incentives through prudent macroeconomicmanagement. However, a number of improvements could be made in several areasto further improve industrial efficiency, and these are discussed in thefollowing sections.
Omnibus Investment Code
6.25 Significant improvements have been recently made in the presentationand formulation of regulations governing investment activities in thePhilippines. The Government adopted on July 20, 1987, a new OmnibusInvestment Code, a compilation of the foreign investn.e.,t Laws anu va-ilousincentives available to domestic and foreign investors, which builds up on anearlier (1981 and 1983) variants and consolidates different incentives andprivileges. It offers generous and well structured incentives, which nolonger favor import substituting industries over exports and capital-intensiveover labor-intensive technologies through 'capital-cheapening", two negativefeatures of the original drafts of the investment code heavily criticized inthe past. In addition, even though the code continues to refer to "measuredcapacity" of an industry as the criterion for the eligibility of incentives tonew entrants, the concept has not been applied in practice. This is alsohighly laudable since strict application of the concept would severelyrestrict competition. The selection of industries, whiclh the Government hasincluded in what is known as investment priority program (IPP), is also to bebased on quantifiable economic considerations including the real internal rateof return. Furthermore, the favorable treatment in the code of export-oriented investments well compensates the anti-export bias implicit in thecurrent tariff structure.
6.26 It is not straightforward to assess the practical impact of the BOIincentives but a few interesting features emerge from the experience of thelast few years and they suggest a relatively small role for BOI incentives(Table 6.2). The number of BOI approved projects has been steadily risingsince 1984. More importantly, however, the majority of approved projects didnot qualify for BOI incentives, which suggests the importance of factors otherthan incentives in investment decisions. Among the approved projects, most
S/ See, for example, The Philippines: A Framewotk for Economic Recovery,Washington, D.C., The World Bank, 1986.
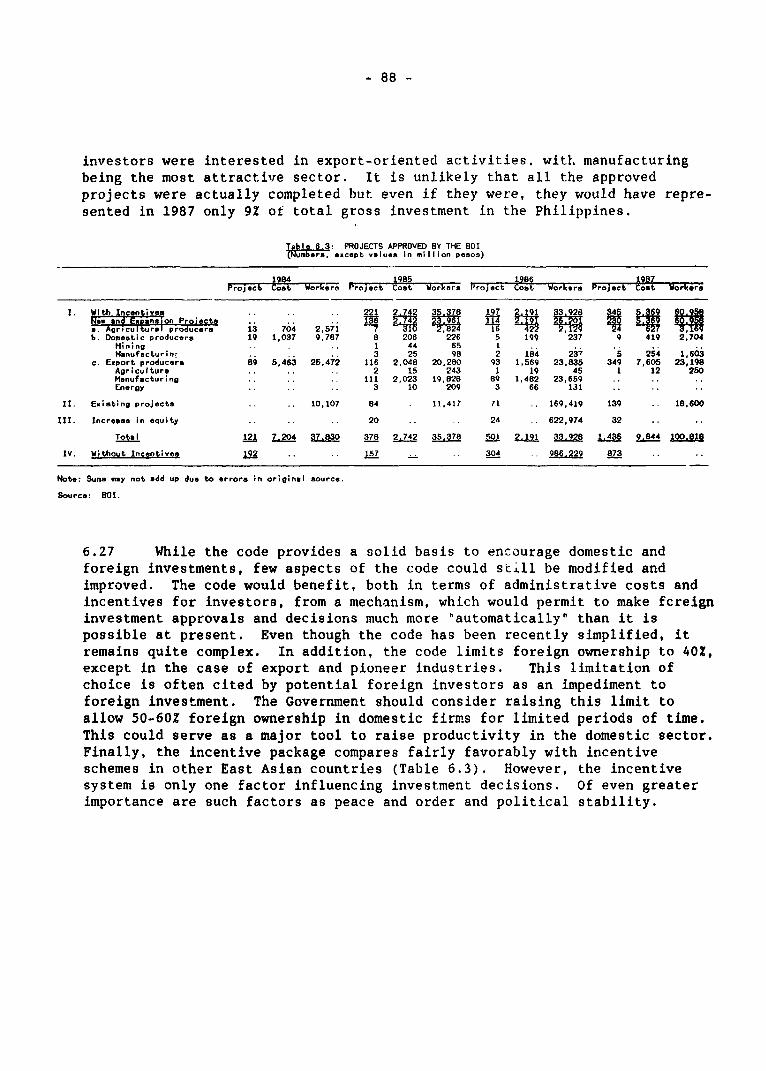
- 88 -
investors were interested in export-oriented activities. with manufacturingbeing the most attractive sector. It is unlikely that all the approvedprojects were actually completed but even if they were, they would have repre-sented in 1987 only 92 ot total gross investment in the Philippines.
TAbl! 6.3PROJECTS APPROVED BY THE BOI(m xcept lues in illion pesos)
atj, os Work pr st orers Poetteotr ost .c orNers Project Hs Workera
1. Vith Incentivea .. .. .. ~~~~~~~~~221 27.742 35.378 197 2.191 33.928 345 5.369 62.95
. Agrcultur ruer 704 2,571 -q2824 s ~42f2 427N Inb. Domestic producers 19 1,037 9,787 8 206 226 5 199 237 9 419 2,704
Mining 1 44 65 1Manufacturln. 3 25 98 2 184 237 5 254 1,603
c. Export producers 89 5,463 25,472 116 2,048 20,280 93 1,569 23,835 349 7,605 23,198Agriculture 2 15 243 1 19 45 1 12 250Manufacturing 111 2,023 19,828 89 1,482 23,659Energy 3 10 209 3 66 131
II. Existing projects 10,107 84 11,417 71 169,419 139 18,600
III. Increase in equity .. .. 20 24 622,974 32
Total 121 7.204 37.830 378 2.742 3S,378 501 2191 33.928 1.435 9.844 100.01e
IV. Without Incenti "a 157 304 986.229 873
Note: Sums may not add up due to errors in original source.
Source: 80H.
6.27 While the code provides a solid basis to encourage domestic andforeign investments, few aspects of the code could still be modified andimproved. The code would benefit, both in terms of administrative costs andincentives for investors, from a mechanism, which would permit to make fcreigninvestment approvals and decisions much more 'automatically" than it ispossible at present. Even though the code has been recently simplified, itremains quite complex. In addition, the code limits foreign ownership to 40?,except in the case of export and pioneer industries. This limitation ofchoice is often cited by potential foreign investors as an impediment toforeign investment. The Government should consider raising this limit toallow 50-60Z foreign ownership in domestic firms for limited periods of time.This could serve as a major tool to raise productivity in the domestic sector.Finally, the incentive package compares fairly favorably with incentiveschemes in other East Asian countries (Table 6.3). However, the incentivesystem is only one factor influencing investment decisions. Of even greaterimportance are such factors as peace and order and political stability.
- 89 -
6.28 Fine Tuning of BOI Incentives. One distortion that needs attentionis the restriction of the transferability of tax credits. At present, taxcredits are transferable to input suppliere up to the full amount of inputs.Small firms, however, cannot use these as they procure from marginal producerswho are not in the tax net. Similarly, transferability is limited for firmsusing imported intermediates, such as in garments, or those using few inter-mediates, such as in mining. Government should investigate expanding thetransferability of tax credits but, pari passu, it should ensure that theexpansion of the transferability does not legitimi-e tax evasion. This wouldyield three desirable benefits: (a) a reduction i. uncertainty about thevalue of BOI incentives; (b) elimination of erratic inter-firm differences inth, value of BOI incentives; and (c) an increase in the value of incentivesd'- .ng periods of low profitability, when tax credits have low value, but areespecially desirable for their macroeconomic effect. Expanding transfera-bility can be done in several ways. The most extensive is to make tax creditsfreely tradeable. This would lose tax revenue, but the effect would be mini-mized by restricting sales to new availments, which have been much more modestin scope than in the past. An alternative, more limited reform would be toextend transferability to more inputs, such as electricity or fuel, which arewidely utilized by all firms. However, this alternative should be pursuedonly if it can be implemented at low administrative costs.
6.29 Perhaps the only major feature of the code requiring change is theequity ownership restriction for foreigners. The Government is fully aware ofthe disincentive effect of this restriction but argues that it is constrainedby constitution, which would have to be changed to modify the ownership rightsfor foreigners. It is very plausible, however, that until a solution to thisproblem is found, the restriction will continue to be a major impedimentprimarily to those foreign investors, who require control over management tosafeguard quality control.
Development Programs
6.30 Tne Government has also recently drafted improved guidelines for"Development Programs", which regulate the development of car, truck andmotorcycle industries. While the mission was unable to receive detailedinformation on the actual performance of the programs, the guidelinesthemselves constitute a major rationalization of the program's predecessors,known as the "Progressive Manufacturing Programs' (PMP) that were establishedin 1984. In contrast to PMP, the "Development Programs" emphasize thedevelopment of automotive parts and components industry rather than construc-tion of complete cars, in which the country is much less likely to have acompetitive advantage. Most importantly, the guidelines stipulate thatproducers in the "Development Programs" must meet in future strict efficiencystandards. These standards are based on well defined and objective criteria,which relate the efficiency performance to world prices and involve directcosts comparisons.
6.31 Nevertheless, the guidelines also contain other investment criteria,which may endanger the efficiency of the programs. The firms operating withinthe programs are given multiple targets, which may be difficult to satisfy all

- 90 -
at the same time at minimum costs: the main targets include: (i) localcontent; (ii) number of basic product models; (iii) compulsory local compo-nents; and (iv) foreign exchange requirements. The size of the industries isinfluenced by administrative regulations (based on the so-called "measuredcapacity" of industry) which detecinine the number of firms within each indus-try (maximum three firms). The Government's stipulation that there must be2-3 participating firms in each program is commendable since it ensures acertain degree of competition. However, it is doubtful that the participatingfirms are able to operate optimal sizes of plants, given the small size of theexisting market. Moreover, by restricting the entry to these firms, new andpossibly more efficient firms may be excluded. The foreign exchange regula-tion, which calls on participating firms to earn 50% of their foreign exchangerequirements from export earnings, is encouraging the firms to enter exportactivities in which they may have no comparative advantage. In addition, theregulation can be easily abused as the firms may enter into collusion withother exportezs.
6.32 Given the extremely high domestic prices of commodities provided byfirms operating within these programs, the benefits of the programs are highlyquestionable. Since one problem appears to be the number of firms operatingwithin each industry, this would suggest a need for a reduction, rather thanthe present plans for expansion of the number of firms. Given the small sizeof Philippine car, truck and motorcycle markets, this proposal would enableremaining firms to operate closer to 'optimal size." Once the number of firmsis reduced, the existing firms may be in a position to expand sufficient'.y toabsorb retrenched labor as well as deliveries from downstream suppliers. Inorder to maintain competition within the industry, which is a major objectiveof the Government under the existing programs, the Government should allowimports. This in turn would call for removal of the current ban on importsand for provision of adequate and time-bound tariff protection. A furthersimplification of criteria for registration and incentives eligibility wouldbe also a major step forward towards preventing cost escalation, which isendemic in the present blueprint. Whatever controls are considered, however,it is imperative that efficiency criterion remains the guiding principle forinvestment.
6.33 Finally, the desire of the Government to develop certain industriesis understandable but if the costs of doing so are higher than the next alter-native, the Government needs to make a strategic decision. It should clearlyindicate that such industries are vital to national interest and that thesociety is prepared to carry the extra costs of such programs. Alternatively,the Government may perceive the industries as 'infant," which will alsorequire protection but one that is only temporary. This means that such aprotection should 5e provided on a time-bound basis and gradually phased out.The measures should be pronounced to ensure that participants in the programsas well as consumers are fully informed about the policy. Given the highcosts of such a strategy, the Government should not extend it beyond theexisting "development programs.'

- 91 -
Restructuring of Private Firms
6.34 Industrial restructuring under normal circumstances should be acontinuous, evolutionary process of adjusting to international marketdevelopments and opportunities, and of incorporating technologicaldevelopments. With the inward oriented, protected environment of the past,many industries developed with insufficient economies of scale and notdesigned to compete in the international m.iarket. The decline of the domesticmarket in the first half of the 1980s hit those industries particularly hard,causing low capacity utilization and accumulated losses. Very littleupgrading investment took place during those years. As a result, many sub-sectors consist of heavily protected firms operating small plants with out-of-date equipment, and which cannot realize the scale economies necessary to faceinternational competition. In addition, there are often burdened with a heavydebt burden from past operations which makes the funding of new investmentdifficult. Thus there is a need for both technological and financialrestructuring, particularly as firms are forced to deal with a more opentrading environment.
6.35 The restructuring of industry requires a sub-sector-specific focusbecause of the heterogeneous nature of the industrial sector, and the need toconsider the impact on industrial efficiency of a variety of Governmentpolicies, including price, trade, tariff and other regulations. The sub-sectoral studies undertaken under the auspices of DTI are proving their valuein highlighting special characteristics of different industries and thevarying nature of key concerns in each sub-sector such as .igh energy costs orlocal cot ent requirement. In certain sub-sectors additional work is needed,to assess international market opportunities, and to provide aggregatesectoral information on typical production costs of existing facilities, theircompetitiveness with modern capacities, technological alternatives andprospects for capturing market shares. The Government should use thesestudies to provide sectoral information and to identify needed policy reforms,which will be a cr'tical prerequisite for successful firm-level restructuring,rather than using them as detailed blueprints for sectoral restructuring bythe public sector.
6.36 In many cases, private firms appear to be in a state of ambiguousownership, with creditors unwilling to foreclose on a firm's assets and write-off part of its bad loans, yet also unwilling to extend additional credit forworking capital or rehabilitation investments. To remedy the situation, theauthorities should tighten regulations dealing with the requirements forfinancial institutions to make specific and general provisions against badloans. Finally, government must also ensure that an adequate legal frameworkexists to facilitate "work-outs' of companies. There is a clear need toreview and reform the law in line with recent international trends emphasizingrehabilitation and restructuring (including use of receiverships).
- 92 -
C. Trade Policies
6.37 As noted earlier, Philippine industry, which developed behind protec-tive barriers in the 1970s has been subject to major attempts of theGovernment to liberalize trade sitice the beginning of the 1980s.6/ The tradeliberalization led to a reduction in average nominal and effective tariffrates between 1979 and 1985.7/ Tariff dispersion and escalation of tariffswere also substantially reduced. This reduction in tariff was initiallyaccompanied by a relaxation of import restrictions but as a response to severebalance of payn.vnt pressures in 1983 and 1984, the number of regulated importitems increased considerably between 1983 and 1985. Since the end of 1985,however, 1,292 import restrictions have been liberalized (Table 14 below).The items liberalized include iron and steel, yarn and thread, tires, plasticsand other important industrial inputs, and some consumer goods, includinggarments and textiles. At present, the number of remaining regulated items is673, although some of these are being reviewed for possible future liberaliza-tion. While average nominal tariff protection has not changed in recent years(Table 6.4), liberalization of import restrictions has been the focus of tradereform. The stability of the nominal tariff rates reflects partly reductionin maximum rates in 1985 as well as an increase in minimum rates. The lowervalues of weighted averages in comparison to unweighted averages indicate thepresence of some very low tariffs on imports with large volumes (see alsoTable 6.8 below).
6/ The Philippines has a long history of trade reforms, which aredescribed in more details by F. Alburo and G. Shepherd: The Timing andSequencing of a Trade Liberalization Policy: The Case of thePhilippines, Washington, D.C., The World Bank, unpublished manuscript,September 1987.
7/ See T. Power and E. Medalla: Trade Liberalization in the Philippines:Assessment of Progress and Agenda for Future Reform, Washington, D.C.:The World Bank, October 1986.
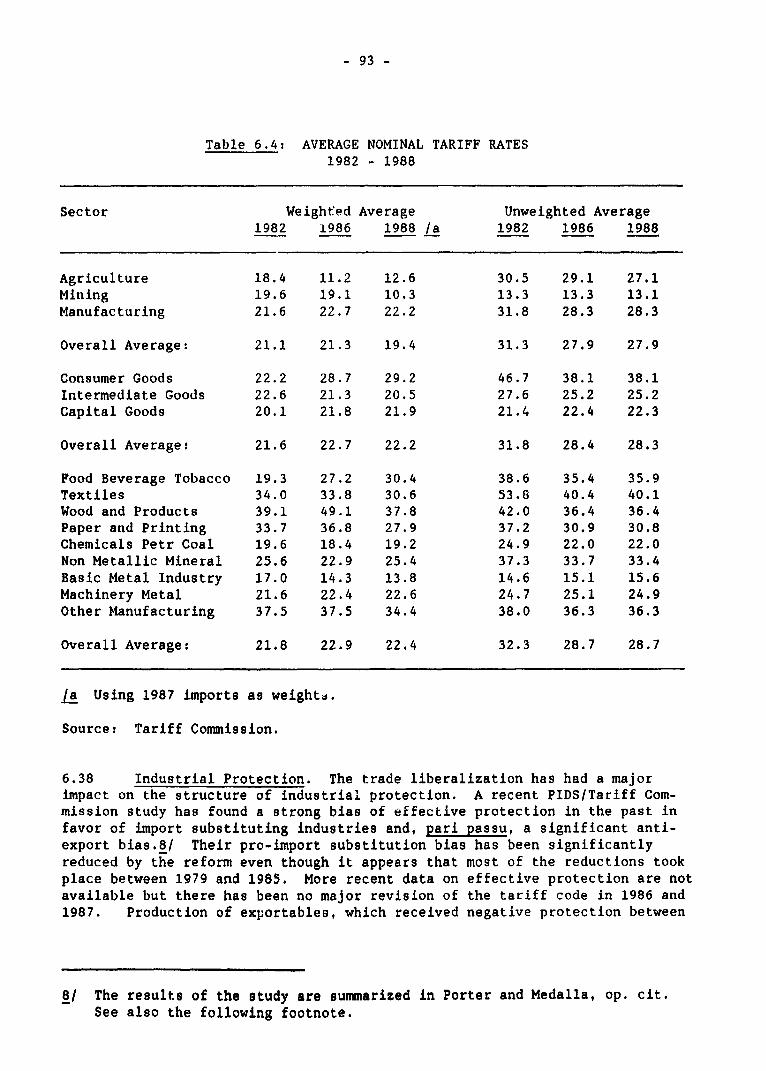
- 93 -
Table 6.4: AVERAGE NOMINAL TARIFF RATES1982 - 1988
Sector Weight:ed Average Unweighted Average1982 1986 1988 /a 1982 1986 1988
Agriculture 18.4 11.2 12.6 30.5 29.1 27.1Mining 19.6 19.1 10.3 13.3 13.3 13.1Manufacturing 21.6 22.7 22.2 31.8 28.3 28.3
Overall Average: 21.1 21.3 19.4 31.3 27.9 27.9
Consumer Goods 22.2 28.7 29.2 46.7 38.1 38.1Intermediate Goods 22.6 21.3 20.5 27.6 25.2 25.2Capital Goods 20.1 21.8 21.9 21.4 22.4 22.3
Overall Average: 21.6 22.7 22.2 31.8 28.4 28.3
Food Beverage Tobacco 19.3 27.2 30.4 38.6 35.4 35.9Textiles 34.0 33.8 30.6 53.8 40.4 40.1Wood and Products 39.1 49.1 37.8 42.0 36.4 36.4Paper and Printing 33.7 36.8 27.9 37.2 30.9 30.8Chemicals Petr Coal 19.6 18.4 19.2 24.9 22.0 22.0Non Metallic Mineral 25.6 22.9 25.4 37.3 33.7 33.4Basic Metal Industry 17.0 14.3 13.8 14.6 15.1 15.6Machinery Metal 21.6 22.4 22.6 24.7 25.1 24.9Other Manufacturing 37.5 37.5 34.4 38.0 36.3 36.3
Overall Average: 21.8 22.9 22.4 32.3 28.7 28.7
/a Using 1987 imports as weights.
Source: Tariff Commission.
6.38 Industrial Protection. The trade liberalization has had a majorimpact on the structure of industrial protection. A recent PIDS/Tariff Com-mission study has found a strong bias of effective protection in the past infavor of import substituting industries and, pari passu, a significant anti-export bias.8/ Their pro-import substitution bias has been significantlyreduced by the reform even though it appears that most of the reductions tookplace between 1979 and 1985. More recent data on effective protection are notavailable but there has been no major revision of the tariff code in 1986 and1987. Production of exportables, which received negative protection between
8/ The results of the study are summarized in Porter and Medalla, op. cit.See also the following footnote.
- 94 -
1979 and 1985, continues to be most likely discriminated against even atpresent. The strong anti-export bias has emerged especially from incentivesin the primary sector, such as agriculture, which has adversely affectedtraditional exports as well as employment in what is still the largest sectorin the economy. But strong encoutagement of import substitutes and, conse-quently, discouragement of export activities has been found also within themanufacturing sector.9/
6.39 Adjustment of Firms. It is not entirely clear at this stage whetherthe change in incentives has been translated into a corresponding change inthe behavior and performance of industrial firms. The period of uninterruptedtrade reform is still too short to enable a rigorous and systematic analysis.For example, experience from other countries suggests a time lag in the per-formance of exports to changes in relative foreign prices as long as 24months.
6.40 Anecdotal evidence indicates, however, that trade liberalization hasso far not seriously threatened the existence of firms in the industry.According to the authorities, there has been no major bankruptcy that could belinked to trade liberalization and bankruptcies that occurred during the1984-1985 period reflected primarily collapse of demand and severe foreignexchange shortages. As mentioned earlier, many firms suggest strongly thattheir main constraint is their limited access to credit. Other constraints,include investment incentives, which the firms perceived as toobureaucraticallv administered labor problems external trade barriersunderground economy, i.e. smuggling, which represents formidable competitionto domestic industry and lack of infrastructure, especially outside theexisting industrial centers. It appears, therefore, that the majority offirms currently receives sufficient protection from tariffs and QRs and thattheir performance has benefitted significantly from the .ecovery of demandsince 1986. The pattern might, of course, change as a result of increased.competition, which would result from further reduction of protection todomestic industry or from slowdown in growth of demand. Some, albeitfragmentary evidence is already available to observe the positive impact oftrade liberalization, which has increased competition from imports and forceddomestic firms to rationalize their production. For example, the highlyprotected tire industry has become an exporter of tires in 1988.
6.41 The evidence emerging from detailed industry studies prepared by thePIDS/Tariff Commission team also suggests that increased competition fromimport liberalization and tariff reforms does not necessarily affect adversely
9/ Due to the existence of QRs and other nontariff barriers to import inthe Philippines, the effective tariff rates understate the trueprotection of industries. Price comparisons, which are therefore,sometimes used as an alternative method to measure true protection, onthe whole confirm the above findings. See Loreli De Dios: NontariffMeasures Affecting Philippine Imports; Background Paper No. 4, preparedfor the above mentioned PIDS/Tariff Commission Project. Furtheievidence is also provided by R. Bautista: Domestic Price Distortionsand Agricultural Income in Developing Countries; Journal of DevelopmentEconomics, Vol. 23, (1986), pp. 19-39.
- 95 -
the production and employment in affected industries.10/ The studies, whichexamined the performance of firms in flout and bakery industries, home appli-ance industry, paper and textiles, show that some firms, generally already themore efficient ones, were able to maintain or even increase their marketshares during the period of tariff reductions. Parn passu, several firms werefound to have difficulties adjusting, which raises the question of theirability to increase their production efficiency under increased competitivepressure. Some of the latter firms shifted production to commodities whichwere more protected.1l/
6.42 The textile industry is an excellent example of an industry whichdeveloped behind protective import barriers to meet domestic demand. Theinward orientation caused inefficiencies, with high prices and uncompetitivequality products. Simultaneously, the Filipino garment export industrydeveloped rapidly on the basis of low labor costs and a free-trade status ofexporters, who sourced their entire input needs from abroad; virtually nointegration of textile and garment industries took place. In 1985, theDepartment of Trade and Industry introduced an "advLnce tax credit scheme",which allowed direct and indirect exporters of textiles quick recovery oftaxes and duties to be paid on raw materials and intermediate inputs.Simultaneously, the Government began to eliminate quantitative importrestrictions on both textiles and industry inputs, such as yarn and thread.Protection was limited to tariffs, which set a limit of 502, while setting therate for raw materials typically at 10? (202 on polyester fiber). Since then,investment in both textile and garment sectors has picked up. Prices ofdomestic textiles have remained stable (or declined in real terms) in spite ofa major increase of domestic demand. In certain types of garment exportproducts, sourcing of inputs has increasingly moved to the Filipino textileindustry. In 1987, between 25? and 30X of total textile requirements weresourced within the Philippines. The resultant strong returns toentrepreneurs, in turn, have strengthened the confidence of Filipino textilemanufacturers in their international competitiveness, and have led to theconsideration of further investment projects.
6.43 Future Trade Reform. There are other elements of the current traderegime that could be further rationalized. The tariff schedule includes sometariffs which do not have a protective function but which seem to be leviedprimarily for fiscal reasons. For example, imported inputs for the carindustry are subject to 10% (minimum) tariff even though these imports have nodomestic substitutes. Similarly, noncompeting imported feed ingredients forproduction of poultry are subject to 10? or 20? tariff. Representative of thetextile industry also pressed for the elimination of 10? tariff on importedcotton. This would reduce the costs of textile manufacturers, and increasetheir price competitiveness with imported textiles in the production ofgarments. The gains would be even greater if the Government eliminated 20?
10/ The findings are summarized in Power and Medalla; op. cit.
11/ See. I. Guerreros Trade Liberalization, Policy Management, andMicroeconomic Adjustments: The Case of the Philippines; Washington, DC:The World Bank, 1986.
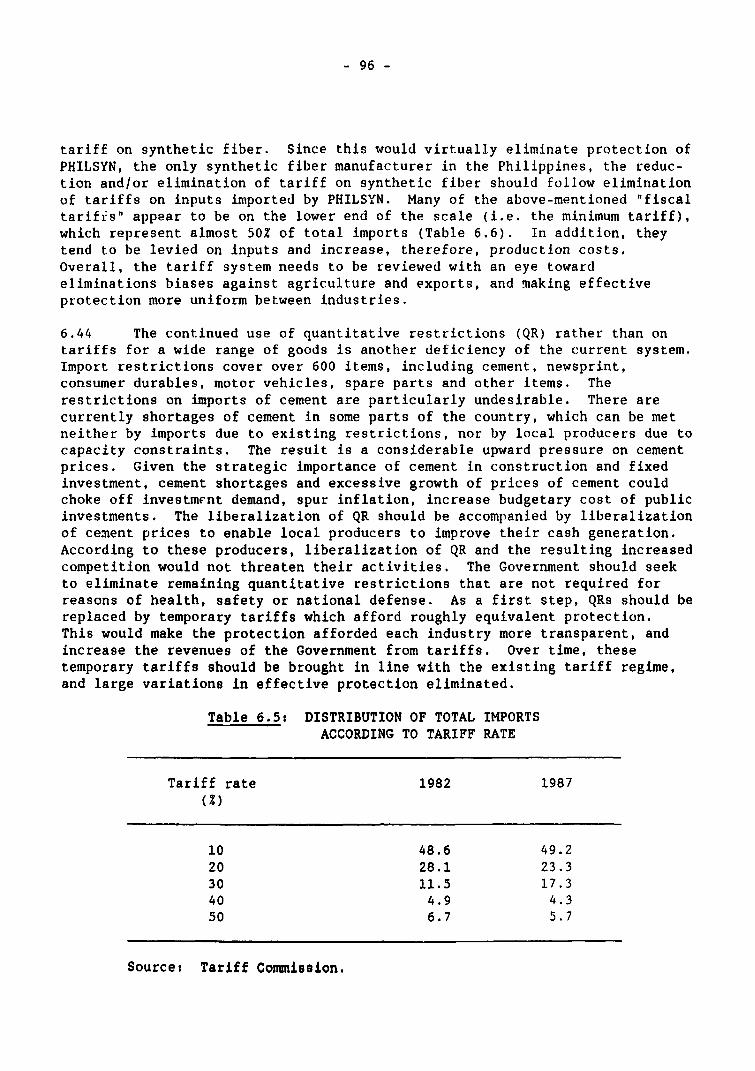
- 96 -
tariff on synthetic fiber. Since this would virtually eliminate protection ofPHILSYN, the only synthetic fiber manufacturer in the Philippines, the reduc-tion and/or elimination of tariff on synthetic fiber should follow eliminationof tariffs on inputs imported by PHILSYN. Many of the above-mentioned "fiscaltarifis" appear to be on the lower end of the scale (i.e. the minimum tariff),which represent almost 50% of total imports (Table 6.6). In addition, theytend to be levied on inputs and increase, therefore, production costs.Overall, the tariff system needs to be reviewed with an eye towardeliminations biases against agriculture and exports, and making effectiveprotection more uniform between industries.
6.44 The continued use of quantitative restrictions (QR) rather than ontariffs for a wide range of goods is another deficiency of the current system.Import restrictions cover over 600 items, including cement, newsprint,consumer durables, motor vehicles, spare parts and other items. Therestrictions on imports of cement are particularly undesirable. There arecurrently shortages of cement in some parts of the country, which can be metneither by imports due to existing restrictions, nor by local producers due tocapacity constraints. The result is a considerable upward pressure on cementprices. Given the strategic importance of cement in construction and fixedinvestment, cement shortages and excessive growth of prices of cement couldchoke off investment demand, spur inflation, increase budgetary cost of publicinvestments. The liberalization of QR should be accompanied by liberalizationof cement prices to enable local producers to improve their cash generation.According to these producers, liberalization of QR and the resulting increasedcompetition would not threaten their activities. The Government should seekto eliminate remaining quantitative restrictions that are not required forreasons of health, safety or national defense. As a first step, QRs should bereplaced by temporary tariffs which afford roughly equivalent protection.This would make the protection afforded each industry more transparent, andincrease the revenues of the Government from tariffs. Over time, thesetemporary tariffs should be brought in line with the existing tariff regime,and large variations in effective protection eliminated.
Table 6.5: DISTRIBUTION OF TOTAL IMPORTSACCORDING TO TARIFF RATE
Tariff rate 1982 1987(Z)
10 48.6 49.220 28.1 23.330 11.5 17.340 4.9 4.350 6.7 5.7
Source: Tariff Commission.
- 97 -
6.45 While it is vital for the Government to avoid "backsliding" on itsachievements, it is equally important that its next step is well thought outand clearly articulated. It is equally important to maintain a momentum oftrade reform even though the next phase of the reform need not necessarilyinvolve a major reduction in trade protection. The average nominal tariff inthe Philippines is by now quite comparable to that of other countries thathave also unilaterally liberalized in recent years and effective protectionmay be even lower in some cases. However, future trade reforms should becarried out in the context of sub-sector specific strategies that consider theentire impact of tariff, price and other government policies on each indus-try's costs of production and the level effective protection. Many firms inprotected industries will need time to restructure so as to be competitive atworld prices.
6.46 Export Promotion Policy. While future trade policy reform should befocussed on further rationalization and liberalization of import controls, theGovernment should also ensure that domestic producers are given strong stimu-lus to export. The principal instrument of trade policy should be a suffi-ciently flexible exchange rate policy to maintain the competitiveness of thecountry's sector producing tradeables. In addition, the Government has beenalso pursuing an export promotion policy to offset the anti-export biasresulting from import controls and various institutional constraints. It hasrecognized the need of exporters for free access to intermediate inputs atworld prices, and for this purpose it has been operating duty drawback/exemption schemes (DDS). The institutional support has been provided throughthe establishment of an export finance facility to enable exporters financetheir working capital needs. The Government has also taken variousinitiatives to strengthen the marketing support to exporters. Even though thehistory of comprehensive export promotion in the Philippines is relativelylong, the success so far has been mixed.
6.47 The main limitation of the policy has been its relatively restrictedeffectiveness, which is partly due to the policy d sign and its implementationand partly due to the structure of industry. The DDS has benefited so fironly about 20Z of exporters representing about 50Z of total non-traditionalexports. This small coverage reflects a fairly high dependence on exporterson domestically produced inputs. Nevertheless, the scheme has also sufferedfrom the lack of standardization, duplication and high costs of administrativeprocedures. Pre-shipment export finance, available through a rediscount windowof the Central Bank, has been also limited to a small percentage of exporters,and has benefitted mainly large firms. The limited access to pre-shipmentfinance is partly related to the generally limited access to credit discussedabove. In addition, the existing pre-shipment finance scheme has sufferedfrom a very limited scope of risk coverage, which restricted the beneficiariesof credit guarantees, from unavailability of domestic letters of credit forindirect exporters, which restricted benefits of direct exporters only, andfrom fluctuations in the provision of funds in the Central Bank rediscountwindow. The effectiveness of the marketing support has been also limitedespecially due to complex administrative procedures. This has probablyimpeded access of new firms to world markets while the existing firms tend tobe multinationals or firms with reasonably well established links abroad.
- 98 -
6.48 Even though the incremental benefits from a reform of the exportpromotion policy are unlikely to be dramatic, there is a scope for animprovement both in the design and the implementation of the policy. Sincethe DDS will not benefit exporters who rely on cheap domestic inputs, theprice incentives to these exporters have to be provided through changes in theexchange r&te. In addition, it would be useful to expand the DDS availabilityby extending to all exporters the right to import inputs at world pricesirrespective of whether they are locally available or not. The current limitof exemptions from DDS should be abolished to include all exporters, the DDSprocedures should be simplified and standardized (e.g. the "formula ofmanufacture"), technical control should be improved and overall supervisionbetter coordinated. To improve export financing, Philguarantee should bedesignated the primary export guarantee/insurance agency, whose status shouldbe enhanced through recapitalization and various policy changes ranging fromp.ovisions for higher guarantee limits, adjustment of fee schedules, spreadingthe risk cover, establishing pre-approval limits for selected exporters anddeveloping a credit insurance scheme to provide cover for term financing. Thesystem of export financing should be further improved by making domesticletters of credit available to indirect exporters and by establtshing aconsolidated and independently funded discount window at the Central Bank.The existing institutional framework for marketing support will also need tobe evaluated and a more efficient system put in place.
External Trade Barriers
6.49 In addition to potential domestic demand constraints, the Philippinesface external trade barriers in major markets like many other developingcountries, but their effect on growth of exports has not been critical. Theexternal trade barriers against Philippine exports presently take differentforms. Garment exports to the United States and EEC are mainly affected byquota restrictions, sugar and other agricultural products are also subject toquantitative restrictions of one kind or another, exports of Lropicalproducts, another major export item of the Philippines, face alse high protec-tive barriers in major markets. More detailed and specific insight into tradebarriers against Philippine exports can be obtained from inspection ofTable 3.12 in the Statistical Appendix which shows that external tradebarriers affect mainly traditional and few other exports.12/ Non-traditionalexports tend to be affected considerably less by protected measures in majormarkets. Indeed, recent evidence obtained from estimates or export functionsfor the Philippines, demonstrates very clearly that Philippine exports ofproducts other than primary commodities are sensitive to world market
12/ See also Erlinda M. Medallat A General Assessment of Foreign TradeBarriers to Philippine Exports: Manila: Philippine Institute forDevelopment Studies; Working Paper No. 88-01.
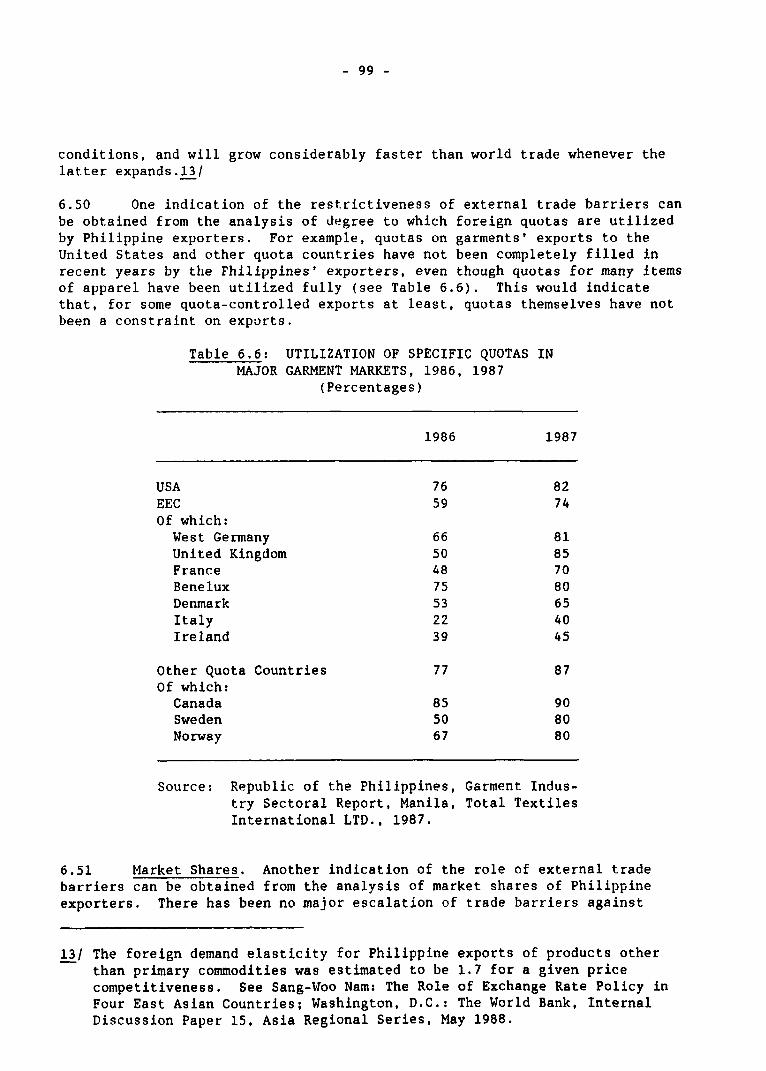
- 99 -
conditions, and will grow considerably faster than world trade whenever thelatter expands.l3/
6.50 One indication of the restrictiveness of external trade barriers canbe obtained from the analysis of degree to which foreign quotas are utilizedby Philippine exporters. For example, quotas on garments' exports to theUnited States and other quota countries have not been completely filled inrecent years by the Philippines' exporters, even though quotas for many itemsof apparel have been utilized fully (see Table 6.6). This would indicatethat, for some quota-controlled exports at least, quotas themselves have notbeen a constraint on exports.
Table 6.6: UTILIZATION OF SPECIFIC QUOTAS INMAJOR GARMENT MARKETS, 1986, 1987
(Percentages)
1986 1987
USA 76 82EEC 59 74Of which:West Germany 66 81United Kingdom 50 85France 48 70Benelux 75 80Deenmark 53 65Italy 22 40Ireland 39 45
Other Quota Countries 77 87of which:Canada 85 90Sweden 50 80Norway 67 80
Source: Republic of the Philippines, Garment Indus-try Sectoral Report, Manila, Total TextilesInternational LTD., 1987.
6.51 Market Shares. Another indication of the role of external tradebarriers can be obtained from the analysis of market shares of Philippineexporters. There has been no major escalation of trade barriers against
13/ The foreign demand elasticity for Philippine exports of products otherthan primary commodities was estimated to be 1.7 for a given pricecompetitiveness. See Sang-Woo Nam: The Role of Exchange Rate Policy inFour East Asian Countries; Washington, D.C.: The World Bank, InternalDiscussion Paper 15, Asia Regional Series, May 1988.
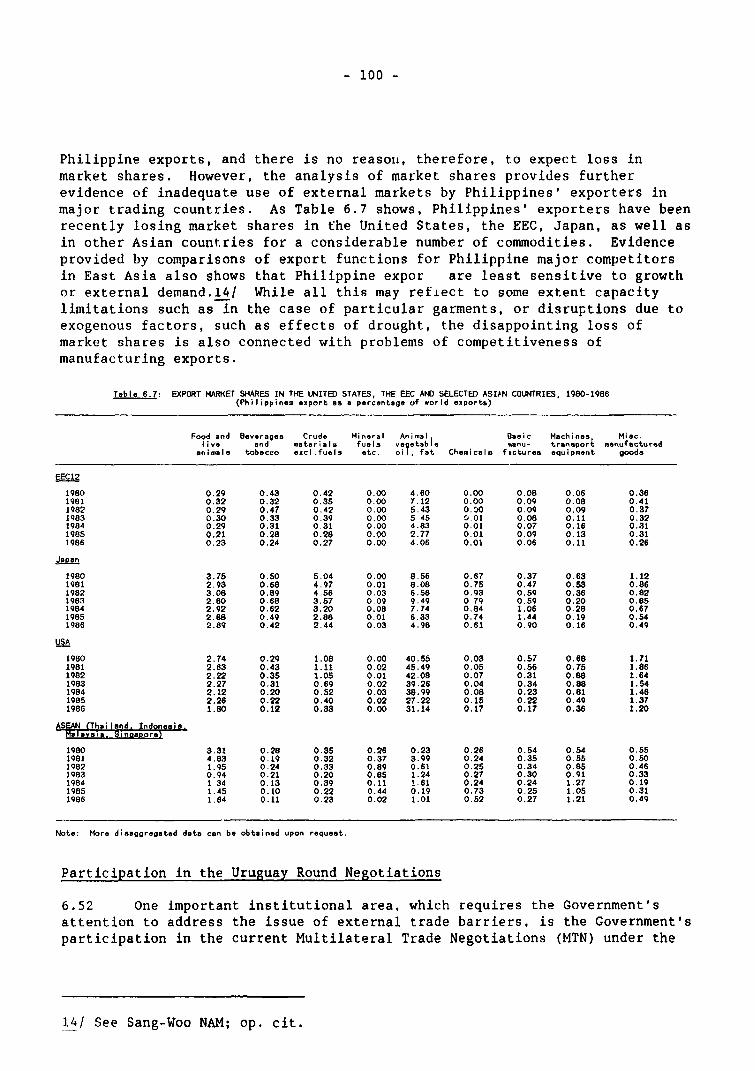
- 100 -
Philippine exports, and there is no reason, therefore, to expect loss inmarket shares. However, the analysis of market shares provides furtherevidence of inadequate use of external markets by Philippines' exporters inmajor trading countries. As Table 6.7 shows, Philippines' exporters have beenrecently losing market shares in the United States, the EEC, Japan, as well asin other Asian countries for a considerable number of commodities. Evidenceprovided by comparisons of export functions for Philippine major competitorsin East Asia also shows that Philippine expor are least sensitive to growthor external demand.14/ While all this may refiect to some extent capacitylimitations such as in the case of particular garments, or disruptions due toexogenous factors, such as effects of drought, the disappointing loss ofmarket shares is also connected with problems of competitiveness ofmanufacturing exports.
Tablo 6.7: EXPORT MARKET SHARES IN THE tJNITED STATES, THE EEC AND SELECTED ASIAN COLUTRIES, 1980-1986(Philippines export as a percentage of world exporta)
Food and Beverages Crude Mineral Animal Basic Machines, Misc.liie and materi e fue 1, veyetable menu- transport manufactured
anim,Ia tobacco excl.fuels etc. oil, fat Chemicals f,ctures equipment goods
gECI2
1980 0.29 0.43 0.42 0.00 4.60 0.00 0.08 0.06 0.361981 0.32 0.32 0.35 0.00 7.12 0.00 0.09 0.08 0.411982 0.29 0.47 0.42 0.00 5.43 0.00 0.09 0.09 0.371983 0.30 0.33 0.39 0.00 5 45 0.01 0.08 0.11 0.321984 0.29 0.31 0.31 0.00 4.83 0.01 0.07 0.16 0.311985 0.21 0.28 0.28 0.00 2.77 0.01 0.09 0.13 0.311986 0.23 0.24 0.27 0.00 4.06 0.01 0.06 0.11 0.26
Japan
1980 3.75 0.50 5.04 0.00 8.56 0.67 0.37 0.63 1.121981 2.93 0.68 4.97 0.01 8.08 0.75 0.47 0.53 0.861982 3.08 0.89 4.56 0.03 6.58 0.93 0.59 0.36 0.821983 2.80 0.68 3.57 0.09 9.49 0 79 0.59 0.20 0.851984 2.92 0.62 3.20 0.08 7.74 0.84 1.06 0.28 0.671985 2.88 0.49 2.88 0.01 6.33 0.74 1.44 0.19 0.541986 2.89 0.42 2.44 0.03 4.98 0.61 0.90 0.16 0.49
USA
1980 2.74 0.29 1.08 0.00 40.55 0.03 0.57 0.68 1.711981 2.63 0.43 1.11 0.02 45.49 0.05 0.56 0.75 1.861982 2.22 0.35 1.05 0.01 42.08 0.07 0.31 0.88 1.641983 2.27 0.31 0.69 0.02 39.26 0.04 0.34 0.88 1.541984 2.12 0.20 0.52 0.03 38.99 0.08 0.23 0.81 1.461985 2.26 0.22 0.40 0.02 27.22 0.15 0.22 0.49 1.371986 1.80 0.12 0.33 0.00 31.14 0.17 0.17 0.36 1.20
AleI (Thai I nnd Indg2n.goia.
1980 3.31 0.28 0.35 0.26 0.23 0.26 0.54 0.54 0.551981 4.83 0.19 0.32 0.37 3.99 0.24 0.35 0.55 0.501982 1.95 0.24 0.33 0.89 0.61 0.25 0.34 0.85 0.461983 0.94 0.21 0.20 0.85 1.24 0.27 0.30 0.91 0.331984 1 34 0.13 0.39 0.11 1.61 0.24 0.24 1.27 0.191985 1.45 0.10 0.22 0.44 0.19 0.73 0.25 1.05 0.311986 1.84 0.11 0.23 0.02 1.01 0.52 0.27 1.21 0.49
Note: More disaggregated data can be obtained upon request.
Participation in the Uruguay Round Negotiations
6.52 One important institutional area, which requires the Government'sattention to address the issue of external trade barriers, is the Government'sparticipation in the current Multilateral Trade Negotiations (MTN) under the
14/ See Sang-Woo NAM; op. cit.
- 101 -
GATT auspices known as "The Uruguay Round." Active participation by theGovernment in MTN is needed because it could go a long way in reducingexternal demand constraints on Philippine exports by negotiating tariff andother concessions with the country's trade partners. Such negotiations areparticularly important in the case of traditional exports, such as tropicalproducts, which are subject to considerable trade barriers in major markets.
6.53 The participation of the Government in the MTN presupposes that theGovernment has established its negotiating strategy which contains severalelements. The Government should prepare two "negotiation lists;" one repre-senting a "request list" identifying items/issues on which it would seek toobtain concessions from the country's trade partners. The other "offer list"would identify items/issues on which the Government may be prepared to offerconcessions. The Government should further decide whether it wishes to nego-tiate alone or in alliance with other developing countries. The chances forsuccess of the negotiating strategy will be enhanced if the Government is wellinformed about proposals of other GATT-member-countries that have been tabledfor negotiations, and about "offer" and "request lists" of their tradepartners. Especially useful would be Government's exploration of othercountries' views over trade liberalization adopted unilaterally by thePhilippine Government over the past few years and the extent to which theGovernment will be able to offer it as a concession for negotiations.
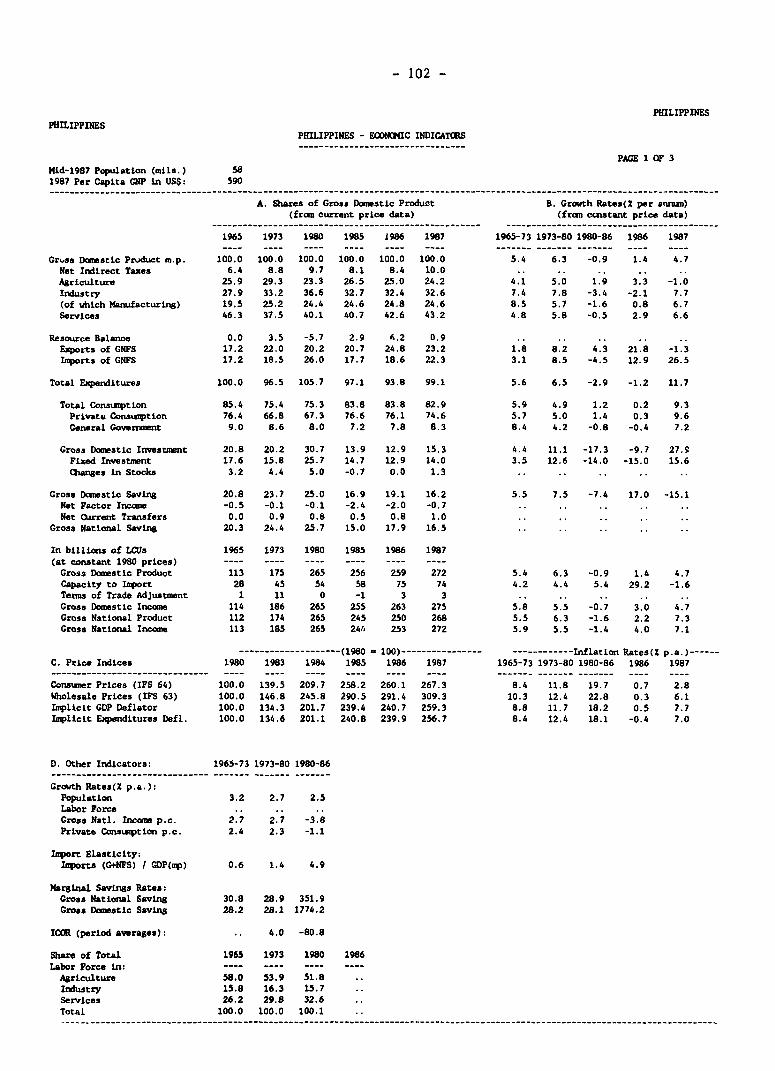
- 102 -
PHILIPPINESPHILIPPINES
PHILIPPINES - ECIONOMIC INDICATRS
PAGE 1 OF 3
Mld-1987 Population (mils.) 581987 Per Capita GNP in US$: 590
A. Shares of Gross Domestic Product B. Grovth Rates(X per annum)(from current price data) (from csAstant price data)
1965 1973 1980 1985 1986 1987 1965-73 1973-80 1980-86 1986 1987
Gr.ss Domestlc Prjduct m.p. 100.0 100.0 100.0 100.0 100.0 100.0 5.4 6.3 -0.9 1.4 4.7Net Indlrect Taxes 6.4 8.8 9.7 8.1 8.4 10.0 .. ..Agriculture 25.9 29.3 23.3 26.5 25.0 24.2 4.1 5.0 1.9 3.3 -1.0Industry 27.9 33.2 36.6 32.7 32.4 32.6 7.4 7.8 -3.4 -2.1 7.7(of vhich ManufacturLng) 19.5 25.2 24.4 24.6 24.8 24.6 8.5 5.7 -1.6 0.8 6.7Services 46.3 37.5 40.1 40.7 42.6 43.2 4.8 5.8 -0.5 2.9 6.6
Resource Balance 0.0 3.5 -5.7 2.9 6.2 0.9 .. ..Exports of GNFS 17.2 22.0 20.2 20.7 24.8 23.2 1.8 8.2 4.3 21.8 -1.3Imports of GNFS 17.2 18.5 26.0 17.7 18.6 22.3 3.1 8.5 -4.5 12.9 26.5
Total Expenditures 100.0 96.5 105.7 97.1 93.8 99.1 5.6 6.5 -2.9 -1.2 11.7
Total Consumptlon 85.4 75.4 75.3 83.8 83.8 82.9 5.9 4.9 1.2 0.2 9.3Private ConsuWption 76.4 66.8 67.3 76.6 76.1 74.6 5.7 5.0 1.4 0.3 9.6General Government 9.0 8.6 8.0 7.2 7.8 8.3 8.4 4.2 -0.8 -0.4 7.2
Gross Domestic Investment 20.8 20.2 30.7 13.9 12.9 15.3 4.4 11.1 -17.3 -9.7 27.9Flxed Investment 17.6 15.8 25.7 14.7 12.9 14.0 3.5 12.6 -14.0 -15.0 15.6Changes in Stocks 3.2 4.4 5.0 -0.7 0.0 1.3 .. ..
Gross Domestic Saving 20.8 23.7 25.0 16.9 19.1 16.2 5.5 7.5 -7.4 17.0 -15.1Net Factor Income -0.5 -0.1 -0.1 -2.4 -2.0 -0.7 .. ..
Net Current Transfers 0.0 0.9 0.8 0.5 0.8 1.0 .. ..
Gross Natlonal Savlng 20.3 24.4 25.7 15.0 17.9 16.5 .. ..
In billions of LCUs 1965 1973 1980 1985 1986 1987(at constant 1980 prices) ---- ---- ---- ---- ---- ---
Gross Domestic Product 113 175 265 256 259 272 5.4 6.3 -0.9 1.4 4.7Capacity to Import 28 45 54 58 75 74 4.2 4.4 5.4 29.2 -1.6Terms of Trade Adjustment 1 11 0 -1 3 3 .. ..
Gross Domestic Income 114 186 265 255 263 275 5.8 5.5 -0.7 3.0 4.7Gross National Product 112 174 265 245 250 268 5.5 6.3 -1.6 2.2 7.3Gross National Inc¢e 113 185 265 24b 253 272 5.9 5.5 -1.4 4.0 7.1
--------------------(1980 - 100)---------------- ------------Inflation Rates(% p.a.)------C. Prlce Indlces 1980 1983 1984 1985 1986 1987 1965-73 1973-80 1980-86 1986 1987
Cons'mer Prlees (IFS 64) 100.0 139.5 209.7 258.2 260.1 267.3 8.4 11.8 19.7 0.7 2.8Wholesale Prices (IFS 63) 100.0 146.8 245.8 290.5 291.4 309.3 10.3 12.4 22.8 0.3 6.1ImplicLt GDP Deflator 100.0 134.3 201.7 239.4 240.7 259.3 8.8 11.7 18.2 0.5 7.7Implicit ExpendLtures Defl. 100.0 134.6 201.1 240.8 239.9 256.7 8.4 12.4 18.1 -0.4 7.0
D. Other Indicators: 1965-73 1973-80 1980-86
Growth Rates(X p.a.):Population 3.2 2.7 2.5Labor ForceGross Natl. Innce p.c. 2.7 2.7 -3.8Private Consuptlon p.c. 2.4 2.3 -1.1
Import Elasticity:Imports (G+NFS) / GDP(mp) 0.6 1.4 4.9
Marginal Savings Rates:Gross NatLonal Saving 30.8 28.9 351.9Gross Domestic Saving 28.2 28.1 1774.2
ICOR (period Averages): ,. 4,0 -80.8
Share of Total 1965 1973 1980 1986Labor Force Ln: ---- ---- -- --
Agriculture 58.0 53.9 51.8Industry 15.8 16.3 15.7Serviees 26.2 29.8 32.6Total 100.0 100.0 100.1
------------------------------------------------ _-_--_--------------__-------__-----------___------------------------------------
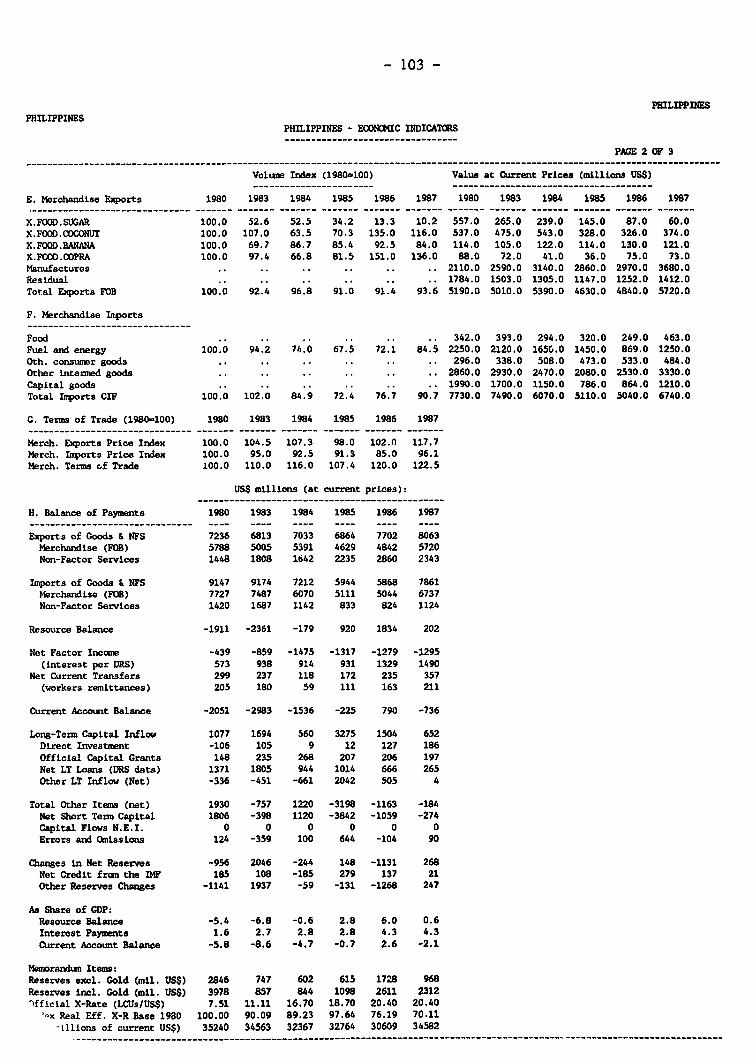
- 103 -
PHILIPPINESPHILIPPINES
PHILIPPINES - ECONOMIC INDICATORS---------------------------------
PAGE 2 OF 3------------------------------------------------------------------------ __---__-----------__----------------------------------------
Volume Iuidex (1980=100) Value at Current Prices (millions US$)
E. Merchandise Exports 1980 1983 1984 1985 1986 1987 1980 1983 1984 1985 1986 1987
X.FOOD.SUGAR 100.0 52.6 52.5 34.2 13.3 10.2 557.0 265.0 239.0 145.0 87.0 60.0X.FOOD.COCONUT 100.0 107.0 63.5 70.3 135.0 116.0 537.0 475.0 543.0 328.0 326.0 374.0X. FOM.BANANA 100.0 69.7 86.7 85.4 92.5 84.0 114.0 105.0 122.0 114.0 130.0 121.0X..FOOD.COPRA 100.0 97.4 66.8 81.5 151.0 136.0 88.0 72.0 41.0 36.0 75.0 73.0Manufactures .. .. .. .. .. .. 2110.0 2590.0 3140.0 2860.0 2970.0 3680.0Residual .. .. .. .. .. .. 1784.0 1503.0 1305.0 1147.0 1252.0 1412.0Total Exports FOB 100.0 92.4 96.8 91.0 91.4 93.6 5190.0 5010.0 5390.0 4630.0 4840.0 5720.0
F. Merchandise Inports_______________________________
Food .. .. .. .. .. .. 342.0 393.0 294.0 320.0 249.0 463.0Fuel and energy 100.0 94.2 74.0 67.5 72.1 84.5 2250.0 2120.0 1656.0 1450.0 869.0 1250.00th. consumer goods .. .. .. .. .. .. 296.0 338.0 508.0 473.0 533.0 484.0Other intermed goods .. .. .. .. .. .. 2860.0 2930.0 2470.0 2080.0 2530.0 3330.0
Capital goods .. .. .. .. .. .. 1990.0 1700.0 1150.0 786.0 864.0 1210.0
Total Imports CIF 100.0 102.0 84.9 72.4 76.7 90.7 7730.0 7490.0 6070.0 5110.0 5040.0 6740.0
G. Terms of Trade (1980=100) 1980 1983 1984 1985 1986 1987
Merch. Exports Price Index 100.0 104.5 107.3 98.0 102.n 117.7March. Imports Price Index 100.0 95.0 92.5 91.3 85.0 96.1Merch. Terms of Trade 100.0 110.0 116.0 107.4 120.0 122.5
USS millions (at current prices):
H. Balance of Payments 1980 1983 1984 1985 1986 1987
Exports of Goods & NFS 7236 6813 7033 6864 7702 8063Merchandise (FOB) 5788 5005 5391 4629 4842 5720Non-Factor Services 1448 1808 1642 2235 2860 2343
Imports of Goods & NFS 9147 9174 7212 5944 5868 7861Merchandise (FOB) 7727 7487 6070 5111 5044 6737Non-Factor Services 1420 1687 1142 833 824 1124
Resource Balance -1911 -2361 -179 920 1834 202
Net Factor Inccme -439 -859 -1475 -1317 -1279 -1295(interest per DRS) 573 938 914 931 1329 1490
Net Current Transfers 299 237 118 172 235 357(workers remittances) 205 180 59 ill 163 211
Current Account Balance -2051 -2983 -1536 -225 790 -736
Long-Term Capital Inflow 1077 1694 560 3275 1504 652Direct Investment -106 105 9 12 127 186Official Capital Grants 148 235 268 207 206 197Net LT Loans (DRS data) 1371 1805 944 1014 666 265Other LT Inflow (Net) -336 -451 -661 2042 505 4
Total Other Items (net) 1930 -757 1220 -3198 -1163 -184Net Short Term Capital 1806 -398 1120 -3842 -1059 -274Capital Flows N.E.I. 0 0 0 0 0 0Errors and Omissions 124 -359 100 644 -104 90
Changes in Net Reserves -956 2046 -244 148 -1131 268Net Credit from the DIMF 185 108 -185 279 137 21Other Reserves Changes -1141 1937 -59 -131 -1268 247
As Share of GDP:Resource Balance -5.4 -6.8 -0.6 2.8 6.0 0.6Interest Payments 1.6 2.7 2.8 2.8 4.3 4.3Current Account Balance -5.8 -8.6 -4.7 -0.7 2.6 -2.1
Memrandum Items:Reserves excl. Gold (mil. US$) 2846 747 602 615 1728 968Reserves incl. Gold (mil. USS) 3978 857 844 1098 2611 2312official X-Rate (LCUs/USS) 7.51 11.11 16.70 18.70 20.40 20.40
nx Real Eff. X-R Base 1980 100.00 90.09 89.23 97.64 76.19 70.11-illions of current US$) 35240 34563 32367 32764 30609 34582
…----------------------------------------------------------------__----------__---------------------------------------------
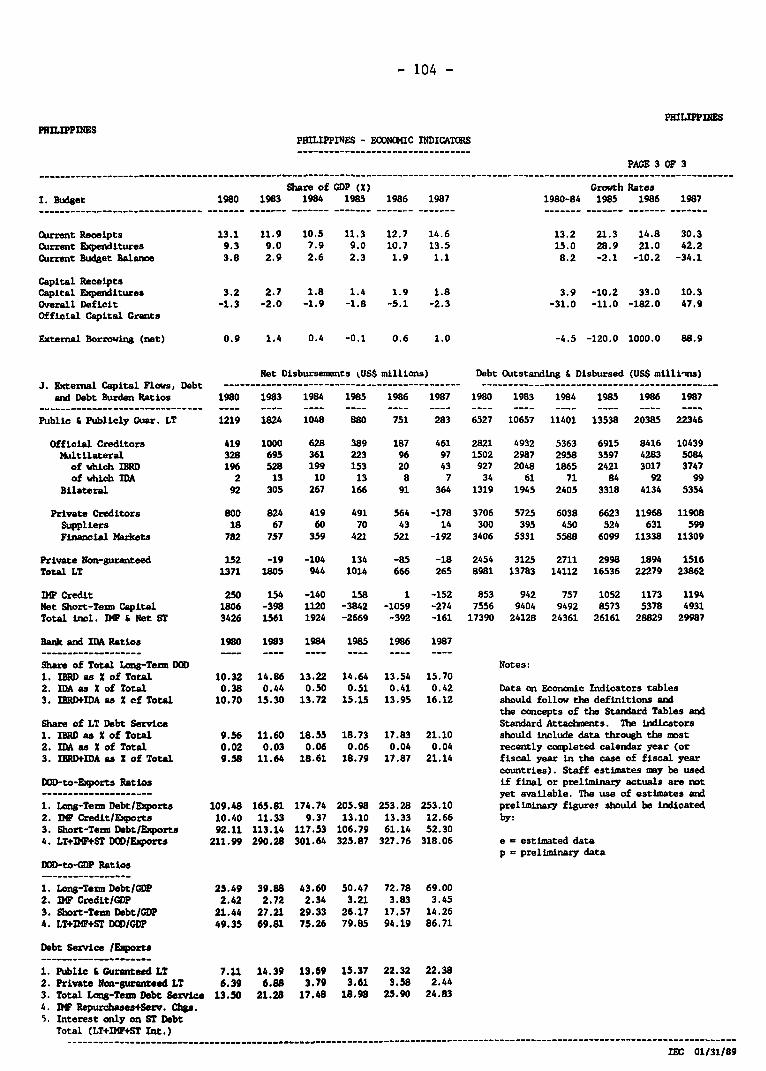
- 104 -
PHILIPPINESPHILIPPIES
PE=lIPPVW4S - ECONCKIC INDICATORS---------------------------------
PAGE 3 OF 3---------------------------------------------------- --- ____- ----- _-----------_________--- _________________________________________-
Share of GDP (M) Growth RatesI. Budget 1980 1983 1984 1985 1986 1987 1980-84 1985 1986 1987_______________________________ ------- ------ _ -_----- -- - - --- -- ------- ------- ------- ------- ------- ____
Current Receipts 13.1 11.9 10.5 11.3 12.7 14.6 13.2 21.3 14.8 30.3Current Expenditures 9.3 9.0 7.9 9.0 10.7 13.5 15.0 28.9 21.0 42.2Current Budget Balance 3.8 2.9 2.6 2.3 1.9 1.1 8.2 -2.1 -10.2 -34.1
Capital ReceiptsCapltal Expenditures 3.2 2.7 1.8 1.4 1.9 1.8 3.9 -10.2 33.0 10.3Overall Deficit -1.3 -2.0 -1.9 -1.8 -5.1 -2.3 -31.0 -11.0 -182.0 47.9Official Capltal Grants
External Borrowing (net) 0.9 1.4 0.4 -0.1 0.6 1.0 -4.5 -120.0 1000.0 88.9
Net Disbursements kUS$ mllions) Debt OutstantLng & Dlsbursed (USS milli"ns)J. External Capital Flows, Debt --------------------------------------------- --------------------------------------____
and Debt Burden Ratios 1980 1983 1984 1985 1986 1987 1980 1983 1984 1985 1986 1987
Public & Publicly Guar. LT 1219 1824 1048 880 751 283 6527 10657 11401 13538 20385 22346
OffLcial Creditors 419 1000 628 389 187 461 2821 4932 5363 6915 8416 10439MLltllateral 328 695 361 223 96 97 1502 2987 2958 3597 4283 5084
of vhLch IBRD 196 528 199 153 20 43 927 2048 1865 2421 3017 3747of which DA 2 13 10 13 8 7 34 61 71 84 92 99
Bilateral 92 305 267 166 91 364 1319 1945 2405 3318 4134 5354
Private Credltors 800 824 419 491 564 -178 3706 5725 6038 6623 11968 11908Suppllers 18 67 60 70 43 14 300 395 450 524 631 599Financial Markets 782 757 359 421 521 -192 3406 5331 5588 6099 11338 11309
Prlvate Non-guranteed 152 -19 -104 134 -85 -18 2454 3125 2711 2998 1894 1516Total LT 1371 1805 944 1014 666 265 8981 13783 14112 16536 22279 23862
IMF Credlt 250 154 -140 158 1 -152 853 942 757 1052 1173 1194Net Short-Tenm Capltal 1806 -398 1120 -3842 -1059 -274 7556 9404 9492 8573 5378 4931Total mncl. DIM & Net ST 3426 1561 1924 -2669 -392 -161 17390 24128 24361 26161 28829 29987
Bank and IDA Ratios 1980 1983 1984 1985 1986 1987
Share of Total Long-Tena DOD Notes:1. IBRD as Z of Total 10.32 14.86 13.22 14.64 13.54 15.702. IDA as S of Total 0.38 0.44 0.50 0.51 0.41 0.42 Data on Economlc Indicators tables3. IBRD+IDA as X of Total 10.70 15.30 13.72 15.15 13.95 16.12 should follow the definltlons and
the concepts of the Standard Tables andShare of LT Debt Service Standard Attachments. The indLiators1. IBRD as Z of Total 9.56 11.60 18.55 18.73 17.83 21.10 should include data through the most2. DA as X of Total 0.02 0.03 0.06 0.06 0.04 0.04 recently completed calendar year (or3. IBRD+IDA as 2 of Total 9.58 11.64 18.61 18.79 17.87 21.14 fiscal year in the case of fiscal year
countries). Staff estlmates may be usedDOD-to-Exports Ratios if flnal or preliminary actuals are not--------------------- yet available. The use of estimates and1. Lcng-Term Debt/Exports 109.48 165.81 174.74 205.98 253.28 253.10 preliminary figures should be indicated2. IDF Credlt/Exports 10.40 11.33 9.37 13.10 13.33 12.66 by:3. Short-Term Debt/Exports 92.11 113.14 117.53 106.79 61.14 52.304. LT+IMF+ST DOD/Exports 211.99 290.28 301.64 325.87 327.76 318.06 e - estimated data
p = prelilminary dataDOD-to-GDP Ratios_________________
1. Long-Term Debt/GDP 25.49 39.88 43.60 50.47 72.78 69.002. IMF Credit/GDP 2.42 2.72 2.34 3.21 3.83 3.453. Short-Term Debt/GDP 21.44 27.21 29.33 26.17 17.57 14.264. LT+DEF+ST DOD/GDP 49.35 69.81 75.26 79.85 94.19 86.71
Debt Service /Exports
1. Public & Guranteed LT 7.11 14.39 13.69 15.37 22.32 22.382. Private Noa-guranteed LT 6.39 6.88 3.79 3.61 3.58 2.443. Total Long-Term Debt Servce 13.50 21.28 17.48 18.98 25.90 24.834. IMF Repurchases+Serv. Chp.5. Interest only on ST Debt
Total (LT+IMF+ST Int.)
IEC 01/31/89
PHILIPPINES
Statistical Appendix
Table of ContentsTable No.
1. Population and Employment
1.1 Population Estimates of Census Years and PopulationProjections
1.2 Employment, Unemployment and Labor ForceParticipation, 1980-88
1.3 Employment by Sector
2. National Accounts
2.1 Expenditure on Gross National Productat Current Prices (Billion Pesos)
2.2 Expenditure on Gross National Productat Current Prices (Percentage Distribution)
2.3 Expenditure on Gross National Productat Constant 1972 Prices (Billion Pesos)
2.4 Expenditure on Gross National Productat Constant 1972 Prices: Growth Rates
2.5 Expenditure on Gross National Product,Implicit Indices
2.6 Industrial Origin of Gross Domestic Productat Current Prices (Billion Pesos)
2.7 Industrial Origin of Gross Domestic Productat Current Prices (Percentage Distribution)
2.8 Industrial Origin of Gross Domestic Productat Constant 1972 Prices (Billion Pesos)
2.9 Industrial Origin of Gross Domestic Product at 1972Constant Prices: Growth Rate
2.10 Industrial Origin of Gross Domestic Product: ImplicitPrice Indices
2.11 Absorption, Output and the Current Account
3. Balance of Payments
3.1 Balance of Payments Summary3.2 Current Account: Services and Transfers3.3 Trade Indices3.4 Exports by Commodity Groups3.5 Volume and Unit Value of Principal Commodity Exports3.6 Principal Export Markets3.7 Imports by Commodity Groups3.8 Imports of Capital Goods by Sector3.9 Imports of Petroleum and Coal3.10 Principal Sources of Imports
3.11 Trade Balance by Sector3.12 Nontariff Barriers in Importing Markets in 1986
4. External Debt and Capital Flows
4.1 Total External Debt by Type of Debt and Creditor,1983-September 1987
4.2 Loan Commitments by Donor4.3 Disbursements of Loans and Grants4.4 Operation of the Debt to Equity Conversion Scheme
5. Public Finance
5.1 Cash Operations of the National Government (1980-88)5.2 Distribution of National Government Cash Balances
at Year End, 1980-885.3 National Government Expenditures, by Function (1976-87)5.4 National Government Equity Contribution by Recipient, 1980-875.5 Major Nonfinaicial Government Corporations: Capital
Expenditures by Sectors, 1980-875.6 Major Nonfinancial Government Corporations: Internal
Cash Generation by Sector, 1980-87
6. Money and Credit
6.1 The Monetary System at Year's End6.2 Reserve Money at Year's End6.3 Financial Sector: Loans and Investments Outstanding
by Type of Institution6.4 Total Assets of the Financial System6.5 Structure of Deposits of Commercial Banks6.6 Structure of Credits Outstanding of Commercial Banks
by Maturity6.7 Credits Outstanding by Commercial Banks - by Industry6.8 Credits Outstanding by Financial Institutions
By Maturity as of end of 1986 and 19876.9 Selected Interest Rates
7. Agriculture
7.1 Coconuts: Area, ProductWon, Yield and Disposition7.2 Sugar: Area, Yield, Quality Ratio, Production and Exports7.3 Rice: Area, Yield, Supply and Use7.4 Corn: Area, Production, Supply and Disappearance7.5 Minor Crops: Harvested Area, Production and Yield7.6 Production of Selected Livestock and Fishery Products7.7 Forestry Productss Production and Exports7.8 Gross Value Added in Agriculture, Fishery and Forestry by Subsector
in Current Prices
7.9 Gross Value Added in Agriculture, Fishery and ForestryBy Subsector at 1972 Constant Prices
7.10 Agrarian Reform Program: Operation Land Transfer at End-Year7.11 Selected Agricultural Prices7.12 Average Import Price of Selected Fertilizers7.13 Fertilizer Consumption, 1975-877.14 Price Structure of Pesticides, 1986-.15 Urea Price Structure - April 1986
8. Mining and Manufacturing
8.1 Mining Production, Volume of Major Products8.2 Major Mining Production, Value in Current Prices8.3 Gross Value Added in Manufacturing by Industry Group
at Current Prices8.4 Gross Value Added in Manufacturing by Industry Group at Constant
1972 Prices8.5 Employment for Manufacturing Establishments with
Five or More Workers by Industry, 1977-1986
9. Energy
9.1 Primary Energy by Source9.2 Petroleum Product ConsumpLiun9.3 Dependence of Energy Consumption on Imported Energy9.4 Electricity Generation by Entity
10. Services
10.1 Tourism: Travel Receipts and Visitors by Country of Origin
11. Prices and Wages
11.1 Consumer Price Index for the Philippines11.2 Whole Price Indices for Metro Manila11.3 Retail Frices of Selected Commodities in Metro Manila11.4 Legislated Effective Minimum Money and Real Daily Wage Rates
12. Regional Data
12.1 Population by Region, 1980-8812.2 Gross Regional Domestic Product by Region (Revised),
1975-87 at 1972 Constant Prices12.3 Gross Regional Domestic Product by Region (Revised)
1975-87 at Current Prices
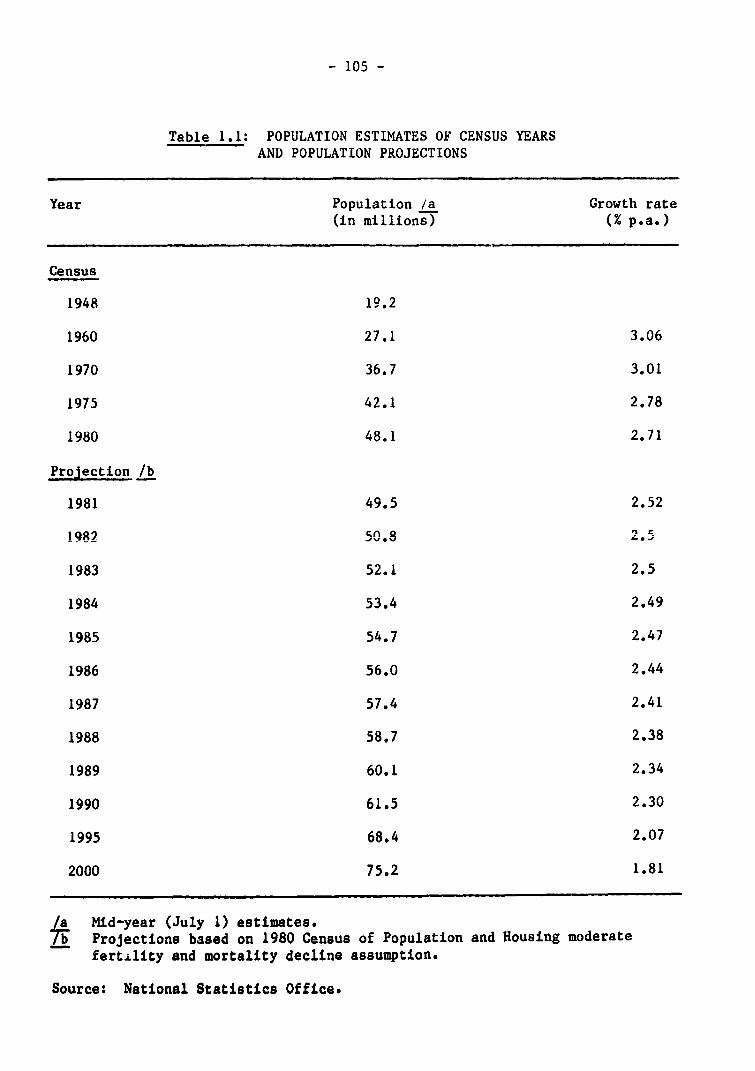
- 105 -
Table 1.1: POPULATION ESTIMATES OF CENSUS YEARSAND POPULATION PROJECTIONS
Year Population /a Growth rate(in millions) (% p.a.)
Census
1948 19.2
1960 27.1 3.06
1970 36.7 3.01
1975 42.1 2.78
1980 48.1 2.71
Projection /b
1981 49.5 2.52
19R2 50 8 2.5
1983 52.1 2.5
1984 53.4 2.49
1985 54.7 2.47
1986 56.0 2.44
1987 57.4 2.41
1988 58.7 2.38
1989 60.1 2.34
1990 61.5 2.30
1995 68.4 2.07
2000 75.2 1.81
/a Mid-year (July 1) estimates.7T Projections based on 1980 Census of Population and Housing moderate
fertility and mortality decline assumption.
Source: National Statistics Office.
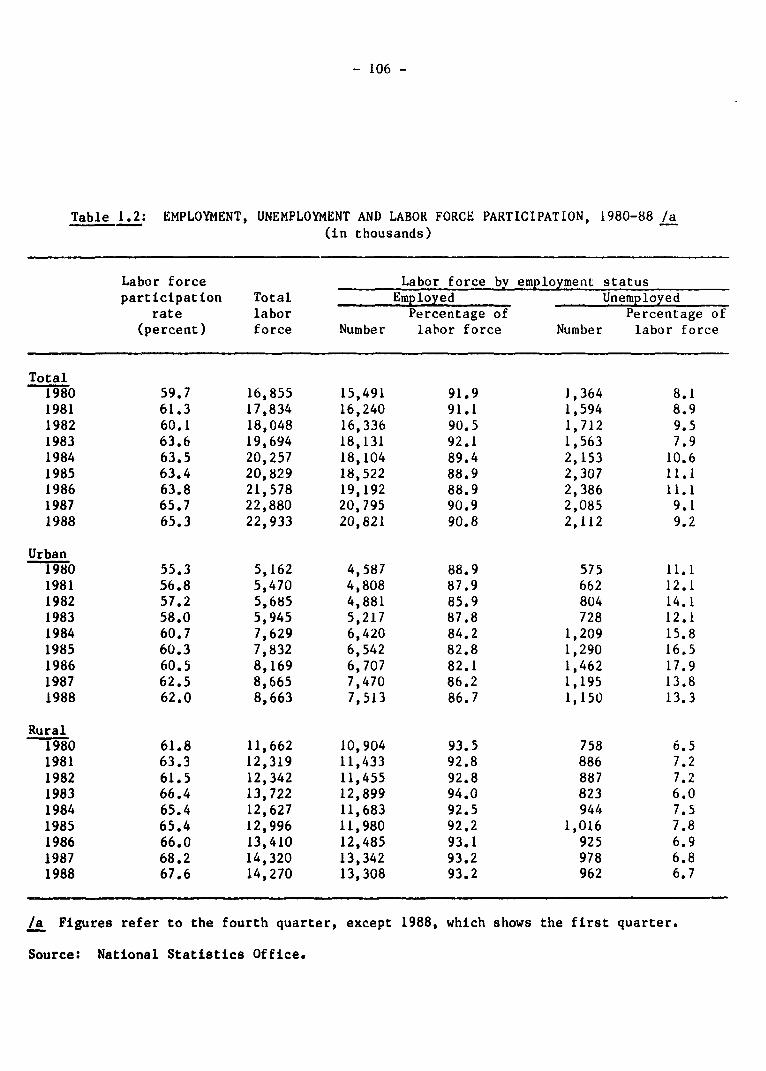
- 106 -
Table 1.2: EMPLOYMENT, UNEMPLOYMENT AND LABOR FORCE PARTICIPATION, 1980-88 /a(in thousands)
Labor force Labor force by employment statusparticipation Total Employed Unemployed
rate labor Percentage of Percentage of(percent) force Number labor force Number labor force
Total1980 59.7 16,855 15,491 91.9 1,364 8.11981 61.3 17,834 16,240 91.1 1,594 8.91982 60.1 18,048 16,336 90.5 1,712 9.51983 63.6 19,694 18,131 92.1 1,563 7.91984 63.5 20,257 18,104 89.4 2,153 10.61985 63.4 20,829 18,522 88.9 2,307 11.11986 63.8 21,578 19,192 88.9 2,386 11.11987 65.7 22,880 20,795 90.9 2,085 9.11988 65.3 22,933 20,821 90.8 2,112 9.2
Urban1980 55.3 5,162 4,587 88.9 575 11.11981 56.8 5,470 4,808 87.9 662 12.11982 57.2 5,685 4,881 85.9 804 14.11983 58.0 5,945 5,217 87.8 728 12.11984 60.7 7,629 6,420 84.2 1,209 15.81985 60.3 7,832 6,542 82.8 1,290 16.51986 60.5 8,169 6,707 82.1 1,462 17.91987 62.5 8,665 7,470 86.2 1,195 13.81988 62.0 8,663 7,513 86.7 1,150 13.3
Rural1980 61.8 11,662 10,904 93.5 758 6.51981 63.3 12,319 11,433 92.8 886 7.21982 61.5 12,342 11,455 92.8 887 7.21983 66.4 13,722 12,899 94.0 823 6.01984 65.4 12,627 11,683 92.5 944 7.51985 65.4 12,996 11,980 92.2 1,016 7.81986 66.0 13,410 12,485 93.1 925 6.91987 68.2 14,320 13,342 93.2 978 6.81988 67.6 14,270 13,308 93.2 962 6.7
/a Figures refer to the fourth quarter, except 1988, which shows the first quarter.
Source: National Statistics Office.
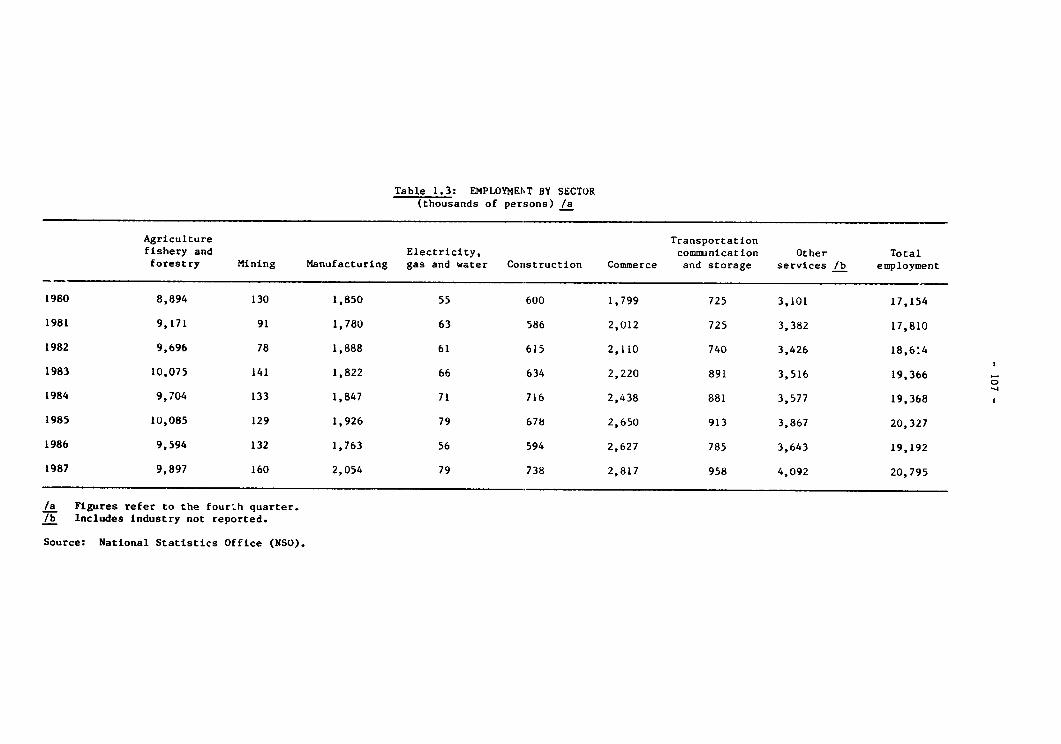
Table 1.3: EMPLOYMEI'T BY SECTOR(thousands of persons) /a
Agriculture Transportationfishery and Electricity, communication Other Totalforestry Mining Manufacturing gas and water Construction Commerce and storage services /b employment
1980 8,894 130 1,850 55 600 1,799 725 3,101 17,154
1981 9,171 91 1,780 63 586 2,012 725 3,382 17,810
1982 9,696 78 1,888 61 615 2,110 740 3,426 18,614
1983 10,075 141 1,822 66 634 2,220 891 3,516 19,366
1984 9,704 133 1,847 71 716 2,438 881 3,577 19,368
1985 10,085 129 1,926 79 678 2,650 913 3,867 20,327
1986 9,594 132 1,763 56 594 2,627 785 3,643 19,192
1987 9,897 160 2,054 79 738 2,817 958 4,092 20,795
/a Figures refer to the four.h quarter./b Includes industry not reported.
Source: National Statistics Office (NSO).
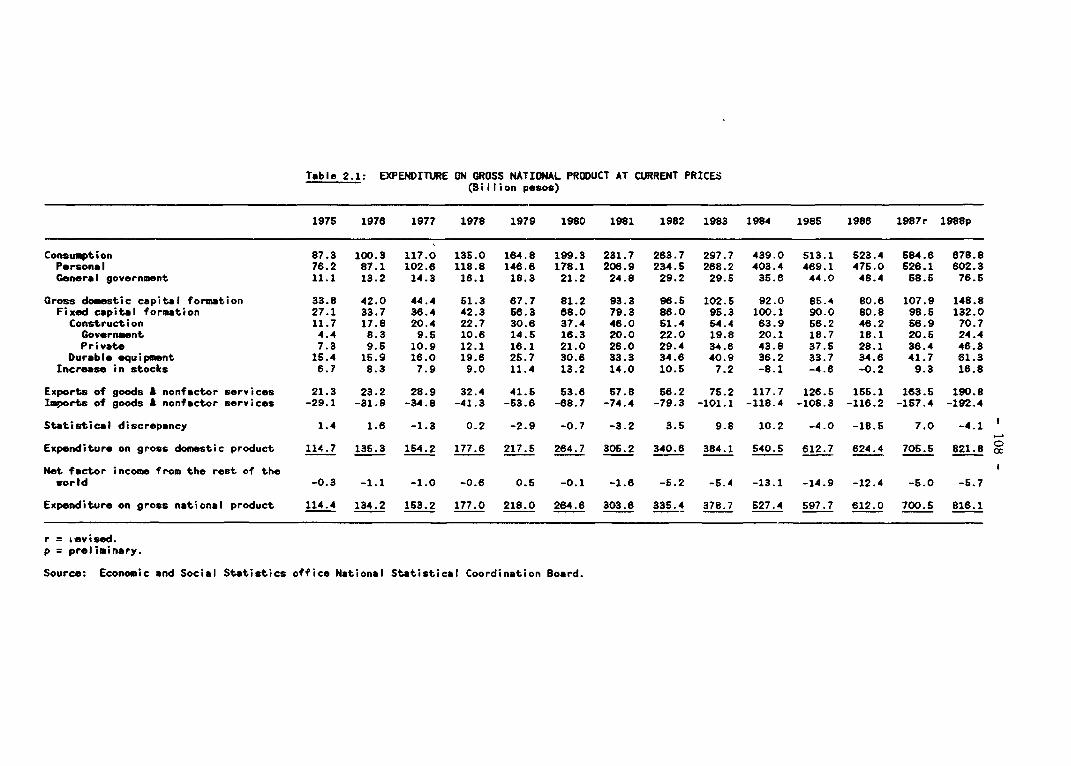
Table 2.1: EXPENDITURE ON GROSS NATIONAL PRODUCT AT CURRENT PRICES(Billion pesos)
1975 1976 1977 1978 1979 1980 1981 1982 1983 1984 1985 1986 1987r 1988p
Consumption 87.3 100.3 117.0 136.0 164.8 199.3 231.7 263.7 297.7 439.0 513.1 523.4 584.6 678.8Personal 76.2 87.1 102.6 118.8 148.6 178.1 206.9 234.6 288.2 403.4 469.1 475.0 626.1 602.3General government 11.1 13.2 14.3 16.1 18.3 21.2 24.8 29.2 29.5 35.6 44.0 48.4 68.5 76.5
Gross domestic capital formation 33.8 42.0 44.4 51.3 67.7 81.2 93.3 96.5 102.5 92.0 85.4 80.6 107.9 148.8Fixed capital formation 27.1 33.7 36.4 42.3 56.3 68.0 79.3 88.0 95.3 100.1 90.0 80.8 98.5 132.0Construction 11.7 17.8 20.4 22.7 30.6 37.4 46.0 51.4 54.4 63.9 56.2 46.2 56.9 70.7Government 4.4 8.3 9.5 10.6 14.5 16.3 20.0 22.0 19.8 20.1 18.7 18.1 20.5 24.4Private 7.3 9.S 10.9 12.1 16.1 21.0 26.0 29.4 34.6 43.8 37.5 28.1 36.4 46.3
Durable equipment 15.4 15.9 16.0 19.6 25.7 30.6 33.3 34.6 40.9 36.2 33.7 34.6 41.7 61.3Increase in stocks 6.7 8.3 7.9 9.0 11.4 13.2 14.0 10.5 7.2 -8.1 -4.6 -0.2 9.3 16.8
Exports of goods & nonfactor services 21.3 23.2 28.9 32.4 41.5 53.6 57.8 568.2 75.2 117.7 126.5 155.1 163.5 190.8Imports of goods & nonfactor services -29.1 -31.8 -34.8 -41.3 -53.6 -68.7 -74.4 -79.3 -101.1 -118.4 -108.3 -116.2 -157.4 -192.4
Statistical discrepancy 1.4 1.6 -1.3 0.2 -2.9 -0.7 -3.2 3.5 9.8 10.2 -4.0 -18.5 7.0 -4.1
Expenditure on gross domestic product 114.7 135.3 154.2 177.6 217.5 264.7 305.2 340.6 384.1 540.5 612.7 624.4 705.5 821.8 °c
Not factor income from the rest of theworld -0.3 -1.1 -1.0 -0.6 0.5 -0.1 -1.6 -5.2 -5.4 -13.1 -14.9 -12.4 -5.0 -5.7
Expenditure on gross national product 114.4 134.2 153.2 177.0 218.0 264.6 303.6 335.4 378.7 527.4 597.7 612.0 700.5 816.1
r = sevised.p = preliminary.
Source: Economic and Social Statistics office National Statistical Coordination Board.
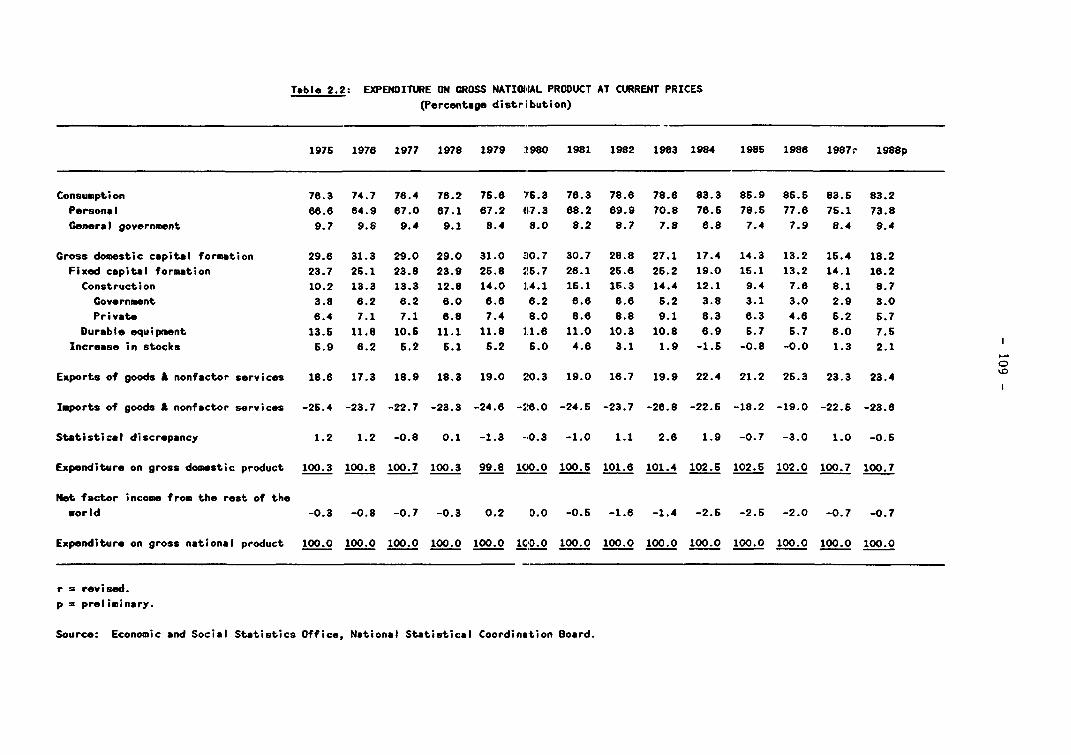
Table 2.2: EXPENDITURE ON GROSS NATIOIAL PRODUCT AT CURRENT PRICES(Percentage distribution)
1975 1978 1977 1978 1979 :1980 1981 1982 1983 1984 1985 1986 1987. 1988p
Consumption 76.3 74.7 76.4 78.2 76.8 '7.3 76.3 78.6 78.6 83.3 85.9 85.5 83.S 83.2Personal 86.8 64.9 67.0 67.1 67.2 617.3 68.2 69.9 70.8 76.5 78.5 77.6 75.1 73.8General government 9.7 9.8 9.4 9.1 8.4 8.0 8.2 8.7 7.8 8.8 7.4 7.9 8.4 9.4
Gross domestic capital formation 29.8 31.3 29.0 29.0 31.0 .10.7 30.7 28.8 27.1 17.4 14.3 13.2 16.4 18.2Fixed capital formation 23.7 26.1 23.8 23.9 26.8 256.7 28.1 26.6 26.2 19.0 15.1 13.2 14.1 16.2
Construction 10.2 13.3 13.3 12.8 14.0 1.4.1 16.1 15.3 14.4 12.1 9.4 7.6 8.1 8.7Government 3.8 6.2 8.2 6.0 6.6 6.2 6.6 6.6 6.2 3.8 3.1 3.0 2.9 3.0Private 6.4 7.1 7.1 6.8 7.4 8.0 8.6 8.8 9.1 8.3 6.3 4.6 6.2 6.7
Durable equipment 13.5 11.8 10.5 11.1 11.8 1.1.6 11.0 10.3 10.8 6.9 6.7 6.7 6.0 7.6Increase in stocks 6.9 6.2 6.2 6.1 5.2 5.0 4.6 3.1 1.9 -1.5 -0.8 -0.0 1.3 2.1
Exports of goods A nonfactor services 18.6 17.3 18.9 18.3 19.0 20.3 19.0 16.7 19.9 22.4 21.2 25.3 23.3 23.4
Imports of goods A nonfactor services -25.4 -23.7 -22.7 -23.3 -24.6 -58.0 -24.6 -23.7 -26.8 -22.6 -18.2 -19.0 -22.6 -23.8
Statistical discrepancy 1.2 1.2 -0.8 0.1 -1.3 -0.3 -1.0 1.1 2.6 1.9 -0.7 -3.0 1.0 -0.6
Expenditure on gross domestic product 100.3 100.8 100.7 100.3 99.8 1(10.0 100.5 101.6 101.4 102.5 102.5 102.0 100.7 100.7
Net factor income from the rest of theworld -0.3 -0.8 -0.7 -0.3 0.2 0.0 -0.6 -1.6 -1.4 -2.6 -2.5 -2.0 -0.7 -0.7
Expenditure on gross national product 100.0 100.0 100.0 100.0 100.0 100.0 100.0 100.0 100.0 100.0 100.0 100.0 100.0 100.0
r = revised.p = preliminary.
Source: Economic and Social Statistics Office, National Statistical Coordination Board.
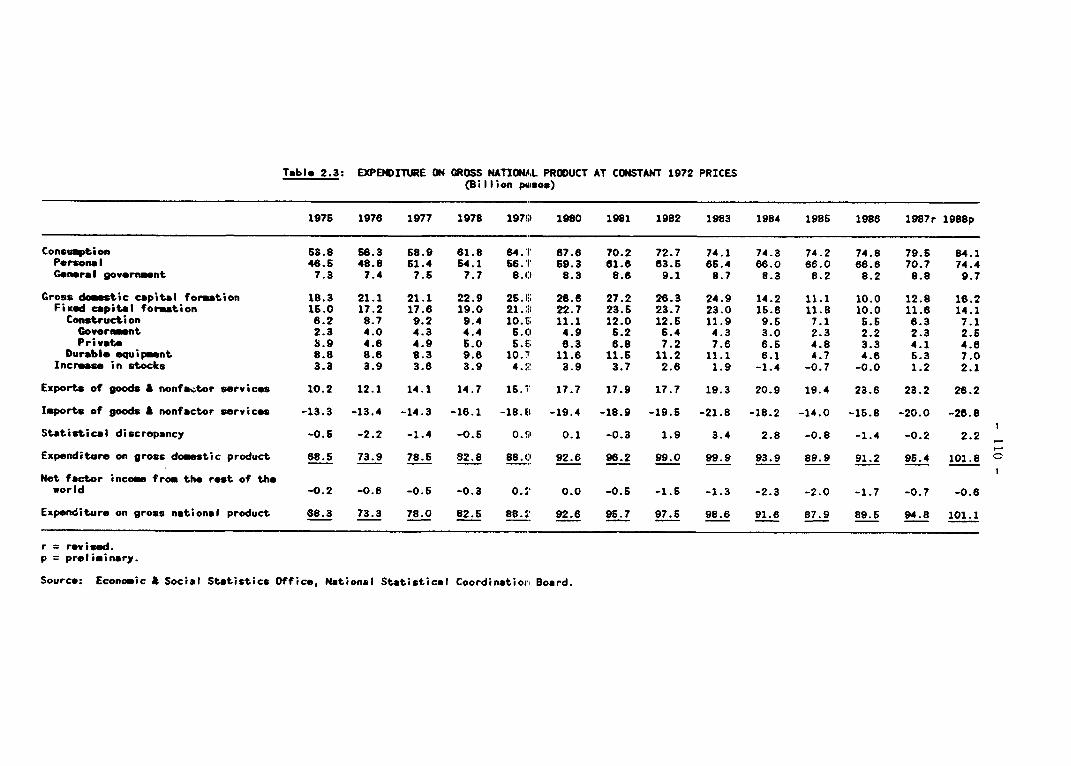
Table 2.3: EXPENDITURE ON GROSS NATIONAiL PRODUCT AT CONSTANT 1972 PRICES(Sillion p4Ilsos)
1976 1976 1977 1978 19750 1980 1981 1982 1983 1984 1985 1986 1987r 1988 p
Consumption 63.8 56.3 58.9 61.8 e4.1 67.6 70.2 72.7 74.1 74.3 74.2 74.8 79.6 84.1Personal 46.5 48.8 51.4 54.1 56.r 59.3 61.8 63.5 86.4 66.0 66.0 68.6 70.7 74.4General government 7.3 7.4 7.5 7.7 8.0 8.3 8.6 9.1 8.7 8.3 8.2 8.2 8.8 9.7
Gross domestic capital formation 18.3 21.1 21.1 22.9 2S.l.; 26.6 27.2 26.3 24.9 14.2 11.1 10.0 12.8 16.2Fixed capital formation 15.0 17.2 17.6 19.0 21.:i3 22.7 23.6 23.7 23.0 15.8 11.8 10.0 11.6 14.1
Construction 6.2 8.7 9.2 9.4 10.1; 11.1 12.0 12.6 11.9 9.5 7.1 S.S 6.3 7.1Governm_nt 2.3 4.0 4.3 4.4 15.0 4.9 S.2 6.4 4.3 3.0 2.3 2.2 2.3 2.5Private 8.9 4.6 4.9 5.0 S.1.; 8.3 6.8 7.2 7.6 6.6 4.8 3.3 4.1 4.6
Durable equipment 8.8 8.6 8.3 9.6 10.T 11.6 11.6 11.2 11.1 6.1 4.7 4.6 5.3 7.0Increase in stocks 3.3 3.9 3.6 3.9 4.2 3.9 3.7 2.6 1.9 -1.4 -0.7 -0.0 1.2 2.1
Exports of goods A nonfa,;tor services 10.2 12.1 14.1 14.7 15.' 17.7 17.9 17.7 19.3 20.9 19.4 23.6 23.2 26.2
Imports of goods A nonfactor services -13.3 -13.4 -14.3 -16.1 -18.1t -19.4 -18.9 -19.5 -21.8 -18.2 -14.0 -15.8 -20.0 -28.8
Statistical discrepancy -0.5 -2.2 -1.4 -0.5 O.IiI 0.1 -0.3 1.9 3.4 2.8 -0.8 -1.4 -0.2 2.2
Expenditure on gross domestic product 68.5 73.9 78.5 82.8 88.0 92.6 96.2 99.0 99.9 93.9 89.9 91.2 95.4 101.8
Net factor income from the rest of theworld -0.2 -0.6 -0.5 -0.3 0.:i 0.0 -0.6 -1.6 -1.3 -2.3 -2.0 -1.7 -0.7 -0.6
Expenditure on gross national product 68.3 73.3 78.0 82.5 88MT 92.6 95.7 97.5 98.6 91.6 87.9 89.5 94.8 101.1
r = revised.p = preliminary.
Soureo: Economic A Social Statistics Office, National Statistical Coordinatiov Board.

Table 2.4: EXPENDXTURE ON GROSS NATIONAL PRODUCT AT CONSTANT 1972 PRICES: GROWTH RATES
(Percent)
1975 1976 1977 1978 1979 1980 1981 1982 1983 1984 1985 1986 1987r 1988p
Person consumption 4.8 6.0 5.3 5.2 4.8 4.6 4.0 3.1 2.9 1.0 -0.1 0.9 6.2 5.1General government 7.7 2.1 0.9 3.0 3.7 3.7 3.7 6.4 -3.9 -6.1 -0.4 -0.4 7.2 10.5
Gross domestic capital formation 23.6 16.4 -0.1 8.6 11.2 4.4 2.3 -3.5 -4.4 -43.4 -21.7 -8.5 27.9 25.9Fixed capital formation 31.6 15.0 1.9 8.4 11.7 6.9 3.5 0.6 -2.5 -32.5 -24.2 -15.0 15.6 21.4
Construction 53.7 40.9 6.2 2.5 11.8 6.5 8.3 4.0 -3.9 -21.5 -24.7 -22.6 15.2 11.8Government 62.1 76.2 5.9 2.9 13.8 -3.0 7.9 2.2 -16.7 -33.1 -21.6 -7.7 6.7 7.2Private 54.7 19.9 6.6 2.1 10.0 13.2 8.6 6.3 5.7 -14.7 -26.1 -29.9 21.4 14.4
Durable equipment 19.5 -3.0 -2.4 15.0 11.7 8.3 -1.0 -2.9 -0.9 -44.4 -23.4 -3.4 16.1 32.9Increase in stocks -3.0 16.9 -8.9 9.1 8.5 -8.3 -5.0 -29.9 -21.8 -168.4 -47.1 -117.7 146.8 68.8
Exports of goods A nonfactor services 1.6 18.6 16.6 3.8 6.8 13.4 1.2 -2.6 10.2 8.2 -7.2 21.8 -1.3 12.7
Imports of goods A nonfactor services 6.2 1.0 6.4 12.9 16.4 3.3 -2.7 3.5 11.6 -16.4 -23.0 26.4 26.6 34.2
Expenditure on gross domestic product 6.6 7.9 6.1 5.5 6.3 5.2 3.9 2.9 0.9 -6.0 -4.3 1.5 4.7 6.6
Expenditure on gross national product 6.0 7.2 6.3 5.8 6.9 5.0 3.4 1.9 1.1 7.1 -4.1 2.0 5.9 6.7
r = revised.p = preliminary.
Source: Economic rnd Social Statistics Office, National Statistical Coordination Board.

Table 2.5: EXPENDITURE ON CROSS NATIONAL PRODUCT, IMPLICIT PRICE INDICES(1972 = 100)
1975 1976 1977 1978 1979 1980 1981 1982 1983 1984 1985 1986 1987r 1988 p
Consumption 162.3 178.3 198.6 218.4 254.7 295.0 330.0 302.8 401.8 592.6 710.2 899.7 732.9 774.2Personal 183.9 178.6 199.6 219.8 258.6 300.3 335.9 369.3 410.1 613.2 711.1 713.2 743.7 810.0General government 152.1 178.4 190.7 209.1 228.8 255.4 288.4 320.9 339.1 428.9 536.8 591.7 866.4 789.0
Gross do0estic capital formation 184.7 198.7 210.1 224.0 286.5 305.0 342.6 367.5 417.2 634.0 787.7 802.9 640.0 920.2Fixed capital formation 180.7 195.9 206.8 222.6 284.3 299.8 337.4 362.9 414.3 836.1 760.8 803.8 847.8 935.1Construction 188.7 204.6 221.7 241.5 291.4 336.9 383.3 411.2 457.1 672.6 790.4 839.2 898.9 996.2Governaent 191.3 207.5 220.9 240.9 290.0 332.7 384.8 407.4 460.5 670.0 798.3 839.8 896.1 994.0Private 187.2 206.5 222.4 242.0 292.7 333.3 382.4 408.3 455.3 673.8 786.5 838.9 897.3 997.4
Durable equipment 175.0 184.9 192.8 204.2 240.2 283.8 289.6 308.9 368.5 587.3 716.2 760.5 788.5 873.3Increase in stocks 203.0 212.8 219.4 230.8 271.4 338.5 378.4 403.8 376.9 885.7 511.8 760.5 648.4 864.8
Exports of goods A nonfactor services 208.8 191.7 205.7 220.4 284.3 302.8 322.9 317.5 389.8 658.9 654.1 e68.3 703.3 728.2
Imports of goods A nonfactor services 218.8 237.3 243.4 256.5 285 1 364.1 393.7 406.7 483.8 650.5 775.3 735.3 787.5 717.2
Expenditure on gross domestic product 167.3 183.0 196.5 214.5 247 3 265.7 317.3 344.0 384.6 572.6 681.5 685.0 739.2 807.6
Expenditure on gross national product 167.3 183.0 196.4 214.8 247 3 285.7 317.2 343.9 384.2 572.7 880.3 683.9 739.1 807.1
r = revised.p = preliminary.
Source: Economic and Social Statistics Office, National Statistical Coordinstion Board.
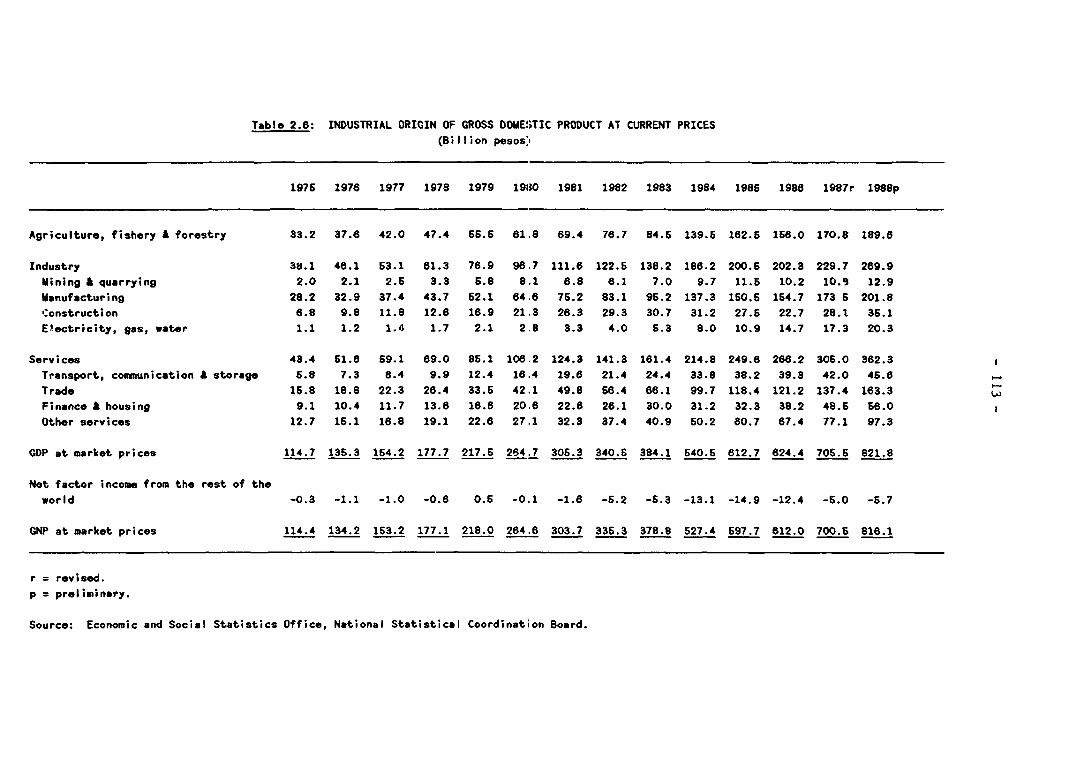
Table 2.6: INDUSTRIAL ORIGIN OF GROSS DOME!;TIC PRODUCT AT CURRENT PRICES
(Billion pesos:
1975 1976 1977 1978 1979 19110 1981 1982 1983 1984 1985 1988 1987r 1988p
Agriculture, fishery A forestry 33.2 37.6 42.0 47.4 66.6 61.8 69.4 76.7 84.5 139.5 162.5 156.0 170.8 189.6
Industry 38.1 46.1 S3.1 61.3 76.9 96.7 111.6 122.S 138.2 186.2 200.S 202.3 229.7 269.9
Mining & quarrying 2.0 2.1 2.5 3.3 5.8 8.1 6.8 6.1 7.0 9.7 11.5 10.2 10.8 12.9
Manufacturing 28.2 32.9 37.4 43.7 52.1 64.6 75.2 83.1 95.2 137.3 160.6 164.7 173 5 201.8
Construction 6.8 9.8 11.8 12.6 18.9 21.3 26.3 29.3 30.7 31.2 27.6 22.7 28.1 36.1
Electricity, gas, water 1.1 1.2 1.4 1.7 2.1 2.8 3.3 4.0 S.3 8.0 10.9 14.7 17.3 20.3
Services 43.4 51.6 59.1 69.0 85.1 106.2 124.3 141.3 161.4 214.8 249.6 268.2 305.0 362.3
Transport, communication A storage 6.8 7.3 8.4 9.9 12.4 18.4 19.6 21.4 24.4 33.8 38.2 39.3 42.0 45.6
Trade 16.8 18.8 22.3 26.4 33.5 42.1 49.8 66.4 66.1 99.7 118.4 121.2 137.4 163.3
Finance A housing 9.1 10.4 11.7 13.6 16.6 20.6 22.6 26.1 30.0 31.2 32.3 38.2 48.5 56.0
Other services 12.7 15.1 16.8 19.1 22.6 27.1 32.3 37.4 40.9 50.2 80.7 67.4 77.1 97.3
CDP at market prices 114.7 135.3 154.2 177.7 217.6 264.7 305.3 340.5 384.1 540.5 612.7 624.4 706.5 821.8
Net factor income from the rest of the
world -0.3 -1.1 -1.0 -0.6 0.5 -0.1 -1.6 -5.2 -5.3 -13.1 -14.9 -12.4 -6.0 -5.7
GNP at market prices 114.4 134.2 153.2 177.1 218.0 264.6 303.7 336.3 378.8 527.4 597.7 612.0 700.5 816.1
r = revised.
p = preliminary.
Source: Economic and Social Statistics Office, National Statistical Coordination Board.
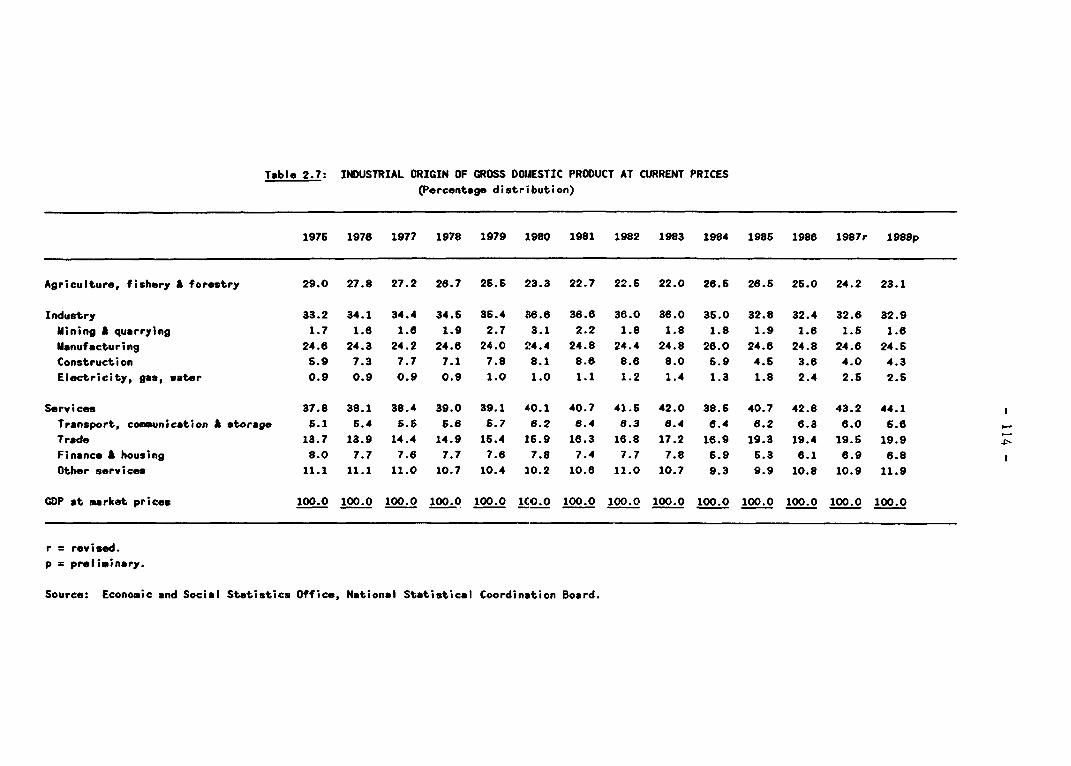
Tsble 2.7: INDUSTRIAL ORIGIN OF GROSS DOMESTIC PRODUCT AT CURRENT PRICES(Percentage distribution)
1976 1976 1977 1978 1979 1980 1981 1982 1983 1984 1985 1986 1987r 1988p
Agriculture, fishery & forestry 29.0 27.8 27.2 28.7 25.5 23.3 22.7 22.6 22.0 28.6 26.5 25.0 24.2 23.1
Industry 33.2 34.1 34.4 34.6 36.4 36.6 36.6 36.0 36.0 35.0 32.8 32.4 32.6 32.9Mining A quarrying 1.7 1.6 1.6 1.9 2.7 3.1 2.2 1.8 1.8 1.8 1.9 1.6 1.5 1.6Manufacturing 24.6 24.3 24.2 24.6 24.0 24.4 24.8 24.4 24.8 26.0 24.8 24.8 24.6 24.6Construction 5.9 7.3 7.7 7.1 7.8 8.1 8.6 8.6 8.0 5.9 4.5 3.6 4.0 4.3Electricity, gas, water 0.9 0.9 0.9 0.9 1.0 1.0 1.1 1.2 1.4 1.3 1.8 2.4 2.6 2.6
Services 37.8 38.1 38.4 39.0 39.1 40.1 40.7 41.5 42.0 38.5 40.7 42.8 43.2 44.1Transport, communication A storage 6.1 6.4 5.5 5.6 5.7 8.2 8.4 6.3 6.4 6.4 6.2 6.3 6.0 6.6Trade 13.7 13.9 14.4 14.9 16.4 16.9 16.3 16.8 17.2 16.9 19.3 19.4 19.6 19.9Finance & housing 8.0 7.7 7.6 7.7 7.6 7.8 7.4 7.7 7.8 6.9 6.3 6.1 6.9 6.8Other services 11.1 11.1 11.0 10.7 10.4 10.2 10.6 11.0 10.7 9.3 9.9 10.8 10.9 11.9
GDP at market prices 100.0 100.0 100.0 100.0 100.0 1C00O 100.0 100.0 100.0 100.0 100.0 100.0 100.0 100.0
r = revised.p = preliminary.
Source: Economic and Social Statistics Office, National Statistical Coordination Board.

Table 2.8: INDUSTRIAL ORIGIN OF GROSS DOMESTIC PRODUCT AT CONSTANT 1972 PRICES
(Billion pesos)
1975 1976 1977 1978 1979 1S80 1981 1982 1983 1984 1985 1986 1987r 1988p
Agriculture, fishery A forestry 18.3 19.8 20.8 21.6 22.8 2:1.7 24.6 25.4 24.9 25.4 26.3 27.1 26.8 27.8
Industry 23.3 25.7 27.9 29.8 32.0 31.S 36.0 35.7 3S.9 32.3 29.0 28.4 30.6 33.3
Mining A quarrying 1.4 1.6 1.7 1.8 2.1 2.2 2.2 2.0 1.9 1.8 1.8 1.r 1.5 1.6
ManufactL ing 17.3 18.3 19.7 21.1 22.2 231.2 24.0 24.5 25.1 23.3 21.5 21.. 23.2 25.2
Construction 4.0 5.3 5.8 5.9 6.8 7'.1 7.8 8.1 7.7 6.9 3 3.4 4.0 4.5
Electricity, gas, water 0.6 0.7 0.7 0.8 0.8 tl.9 1.0 1.1 1.2 1.3 1.4 1.7 1.9 2.0
Services 26.9 28.4 29.8 31.6 33.4 36.4 36.6 37.9 39.1 36.2 34.6 35.7 38.0 40.7
Transport, communication A storage 3.6 4.0 4.2 4.5 4.6 A.8 5.0 5.2 5.3 5.0 4.9 S.1 5.3 5.8
Trade 8.8 9.3 10.0 10.7 11.5 12.2 12.7 13.1 13.9 14.1 14.1 14.3 15.2 15.9
Finance A housing 5.4 5.7 5.9 6.2 6.6 7,.1 7.0 7.3 7.6 5.1 4.3 4.8 5.8 6.3
Other services 9.1 9.4 9.7 10.2 10.7 11.3 11.9 12.4 12.3 12.0 11.3 11.4 11.8 13.0
GDP at market prices 68.5 73.9 78.5 82.8 88.0 92.8 96.2 99.0 99.9 93.9 89.9 91.2 95.4 101.8
Net factor income from the rest of the
world -0.2 -0.8 -0.5 -0.3 0.2 0.0 -0.5 -1.5 -1.3 -2.3 -2.0 -1.7 -0.7 -0.6
GNP at market prices 68.3 73.3 78.0 82.5 88.2 92.6 96.7 97.5 98.6 91.6 87.9 89.5 94.8 101.1
r = revised.
p = preliminary.
Source: Economic and Social Statistics Office, National Statistical Coordination Board.

Table 2.9: INDUSTRIAL ORIGIN OF GROSS DOMESTIC PRODUCT AT 2972 CONSTANT PRICES: GROWTH RATES(Percent)
1975 1976 1977 1978 1979 1980 1981 1982 1983 1984 1985 1986 1987r 1988p
Agriculture, fishery & forestry 4.3 8.0 5.0 4.2 4.5 4.8 4.0 3.1 -2.1 2.3 3.3 3.7 -1.0 3.4
Industry 8.7 10.3 8.4 6.1 8.0 4.7 4.6 2.2 0.7 -10.2 -10.2 -2.1 7.7 8.9Mining A quarrying 3.0 3.2 16.8 3.9 18.0 4.8 2.7 -7.3 -2.5 -10.7 0.7 -11.9 -2.4 3.4Manufacturing 3.5 5.7 7.5 7.3 5.4 4.3 3.4 2.4 2.3 -7.1 -7.6 0.8 6.7 8.7Construction 44.2 33.3 9.6 2.8 13.7 5.6 9.7 3.2 -4.8 -23.7 -27.4 -20.6 17.2 12.8Electricity, gas, water 4.5 11.7 4.9 5.5 12.4 9.3 8.5 8.5 10.1 12.5 6.8 20.2 10.7 5.3
Services 6.0 6.0 4.9 5.9 5.8 6.2 3.4 3.5 3.2 -7.4 -4.4 3.0 6.6 7.1Transport, communication I storage 10.8 11.0 5.8 6.3 2.5 4.6 4.4 2.5 1.9 -4.4 -1.6 3.1 2.9 6.2Trade 3.3 6.3 6.9 7.5 7.7 8.1 4.2 3.0 6.3 1.0 0.0 1.9 5.7 4.9Finance k housing 9.3 6.9 3.5 4.8 6.4 8.6 2.2 4.1 4.5 -32.3 -16.5 12.7 20.7 7.9Other services 4.8 3.2 3.5 4.8 4.9 5.4 6.7 4.1 -0.3 -2.8 -5.4 0.5 3.5 9.8
GDP at market prices 6.4 8.0 6.2 5.5 6.3 5.2 3.9 2.9 0.9 -6.0 -4.3 1.5 4.7 6.6
GNP at market prices 5.8 7.4 6.3 5.8 6.9 6.0 3.5 1.9 1.1 -7.1 -4.1 2.0 5.9 6.7 co
r = revised.p = preliminary.
Source: Economic and Social Statistics Office, National Statistical Coordination Board.
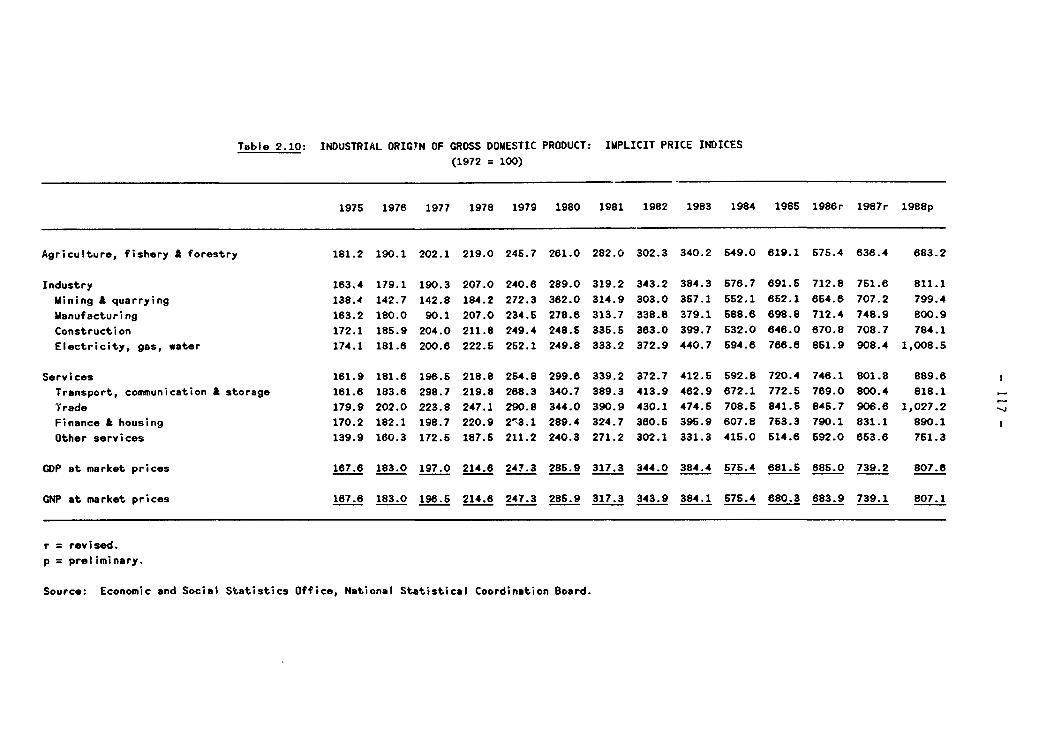
Table 2.10: INDUSTRIAL ORIGTN OF GROSS DOMESTIC PRODUCT: IMPLICIT PRICE INDICES
(1972 = 100)
1975 1976 1977 1978 1979 1980 1981 1982 1983 1984 1985 1986r 1987r 1 9 88 p
Agriculture, fishery A forestry 181.2 190.1 202.1 219.0 246.7 261.0 282.0 302.3 340.2 549.0 619.1 675.4 636.4 683.2
Industry 163.4 179.1 190.3 207.0 240.8 289.0 319.2 343.2 384.3 576.7 691.5 712.8 761.6 811.1
Mining A quarrying 138.4 142.7 142.8 184.2 272.3 362.0 314.9 303.0 357.1 552.1 652.1 664.6 707.2 799.4
Manufacturing 163.2 180.0 90.1 207.0 234.5 278.6 313.7 338.8 379.1 688.6 698.8 712.4 748.9 800.9
Construction 172.1 185.9 204.0 211.8 249.4 248.5 335.6 363.0 399.7 532.0 646.0 670.8 708.7 784.1
Electricity, gas, water 174.1 181.6 200.6 222.6 252.1 249.8 333.2 372.9 440.7 594.6 766.6 851.9 908.4 1,008.5
Services 161.9 181.6 196.5 218.8 254.8 299.6 339.2 372.7 412.5 592.8 720.4 746.1 801.8 889.6
Transport, communication A storage 161.6 183.6 298.7 219.8 268.3 340.7 389.3 413.9 462.9 672.1 772.5 769.0 800.4 818.1
Trade 179.9 202.0 223.8 247.1 290.8 344.0 390.9 430.1 474.5 708.6 841.5 8A.7 906.8 1,027.2
Finance & housing 170.2 182.1 198.7 220.9 2'3.1 289.4 324.7 360.6 395.9 607.8 753.3 790.1 831.1 890.1
Other services 139.9 160.3 172.6 187.6 211.2 240.3 271.2 302.1 331.3 415.0 514.6 592.0 653.6 751.3
GDP at market prices 167.6 183.0 197.0 214.6 247.3 285.9 317.3 344.0 384.4 575.4 681.6 685.0 739.2 807.6
GNP at market prices 167.6 183.0 196.6 214.6 247.3 286.9 317.3 343.9 384.1 575.4 680.3 683.9 739.1 807.1
r = revised.p = preliminary.
Source: Economic and Social Statistics Office, National Statistical Coordination Board.
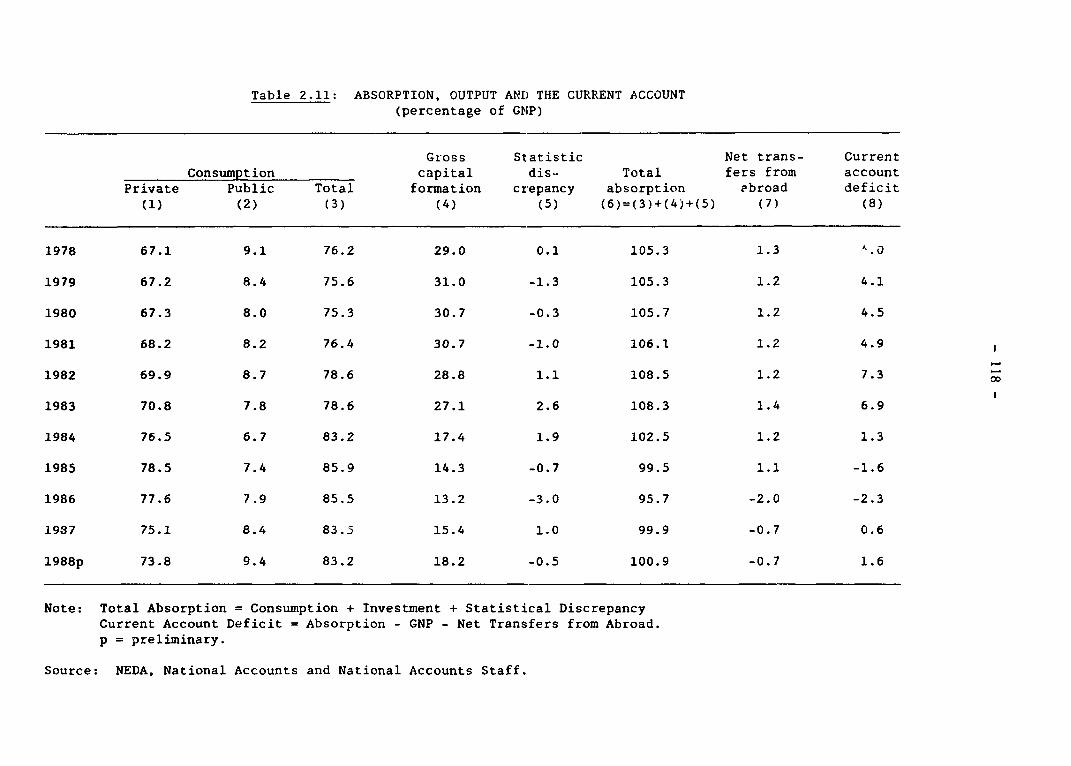
Table 2.11: ABSORPTION, OUTPUT AND THE CURRENT ACCOUNT(percentage of GNIP)
Gross Statistic Net trans- CurrentConsumption capital dis- Total fers from account
Private Public Total formation crepancy absorption -broad deficit(1) (2) (3) (4) (5) (6)=(3)+(4)+(5) (7) (8)
1978 67.1 9.1 76.2 29.0 0.1 105.3 1.3
1979 67.2 8.4 75.6 31.0 -1.3 105.3 1.2 4.1
1980 67.3 8.0 75.3 30.7 -0.3 105.7 1.2 4.5
1981 68.2 8.2 76.4 30.7 -1.0 106.1 1.2 4.9 1
1982 69.9 8.7 78.6 28.8 1.1 108.5 1.2 7.3 X
1983 70.8 7.8 78.6 27.1 2.6 108.3 1.4 6.9
1984 76.5 6.7 83.2 17.4 1.9 102.5 1.2 1.3
1985 78.5 7.4 85.9 14.3 -0.7 99.5 1.1 -1.6
1986 77.6 7.9 85.5 13.2 -3.0 95.7 -2.0 -2.3
1937 75.1 8.4 83.5 15.4 1.0 99.9 -0.7 0.6
1988p 73.8 9.4 83.2 18.2 -0.5 100.9 -0.7 1.6
Note: Total Absorption = Consumption + Investment + Statistical DiscrepancyCurrent Account Deficit = Absorption - GNP - Net Transfers from Abroad.p = preliminary.
Source: NEDA, National Accounts and National Accounts Staff.
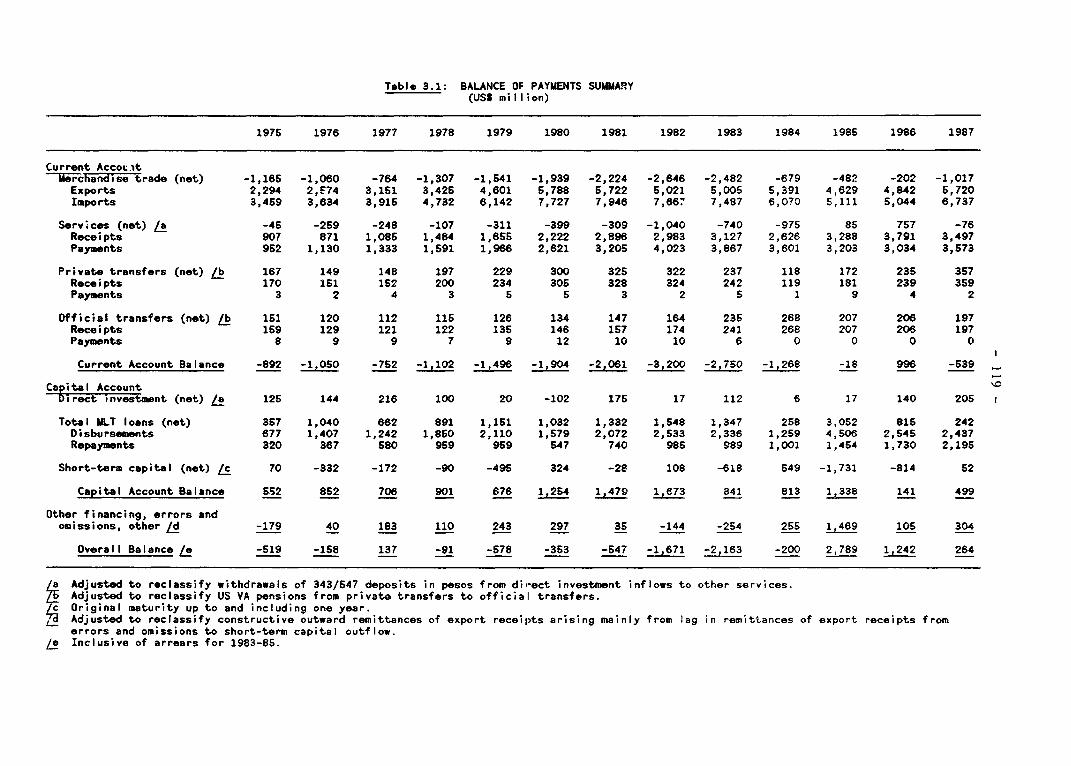
Table 3.1: BALANCE OF PAYMENTS SUMMARY(USS million)
1975 1976 1977 1978 1979 1980 1981 1982 1983 1984 1985 1986 1987
Current AccocitMorchandise trade (net) -1,165 -1,060 -764 -1,307 -1,541 -1,939 -2,224 -2,646 -2,482 -679 -482 -202 -1,017
Exports 2,294 2,F74 3,151 3,426 4,601 5,788 6,722 5,021 5,005 5,391 4,629 4,842 5,720Imports 3,459 3,634 3,916 4,732 6,142 7,727 7,946 7,667 7,487 6,070 5,111 5,044 6,737
Services (net) /a -45 -259 -248 -107 -311 -399 -309 -1,040 -740 -975 85 757 -76Receipts 907 871 1,086 1,484 1,655 2,222 2,896 2,983 3,127 2,626 3,288 3,791 3,497Payments 962 1,130 1,333 1,591 1,966 2,621 3,205 4,023 3,867 3,601 3,203 3,034 3,573
Private transfers (not) /b 167 149 148 197 229 300 325 322 237 118 172 235 357Receipts 170 151 152 200 234 305 328 324 242 119 181 239 359Payments 3 2 4 3 5 5 3 2 5 1 9 4 2
Official transfers (net) /b 151 120 112 115 126 134 147 164 235 268 207 206 197Receipts 159 129 121 122 135 146 157 174 241 268 207 206 197Payments 8 9 9 7 9 12 10 10 6 0 0 0 0
Current Account Balance -892 -1,050 -752 -1,102 -1,496 -1,904 -2,061 -3,200 -2,750 -1,268 -18 996 -539
Capital AccountDiret nvestment (net) La 125 144 216 100 20 -102 175 17 112 6 17 140 205
Total ULT loans (net) 357 1,040 682 891 1,151 1,032 1,332 1,548 1,347 2S8 3,052 815 242Disbursements 677 1,407 1,242 1,850 2,110 1,579 2,072 2,533 2,336 1,259 4,506 2,545 2,437Repayments 320 367 580 959 959 547 740 985 989 1,001 1,454 1,730 2,195
Short-term capital (net) c 70 -332 -172 -90 -495 324 -2F 108 -618 549 -1,731 -814 52
Capital Account Balance 5S2 852 706 901 676 1,254 1,479 1,673 841 813 1,338 141 499
Other financing, errors andomissions, other L -179 40 183 110 243 297 35 -144 -254 255 1,469 105 304
Overall Balance /e -519 -158 137 -91 -578 -353 -647 -1,671 -2,163 -200 2,789 1,242 264
/ Adjusted to reclassify withdrawals of 343/547 deposits in pesos from di-ect investment inflows to other services.Adjusted to reclassify US VA pensions from private transfers to official transfers.Original maturity up to and including one year.
_ Adjusted to reclassify constructive outward remittances of export receipts arising mainly from lag in remittances of export receipts fromerrors and omissions to short-term capital outflow.
L Inclusive of arrears for 1983-85.
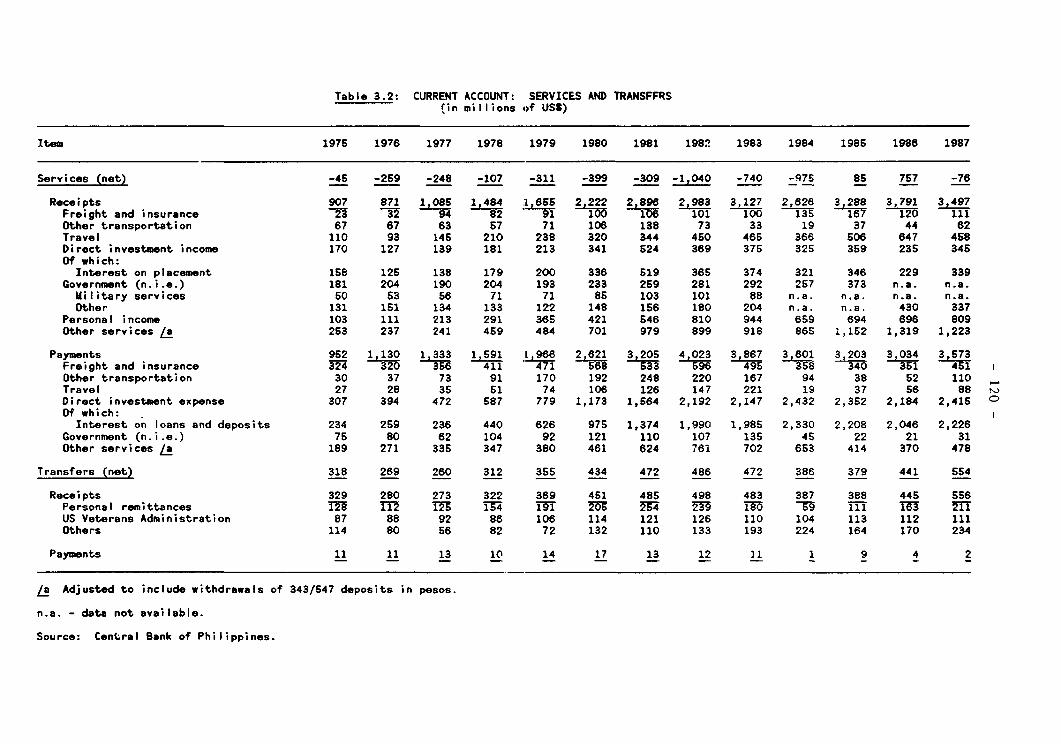
Table 3.2: CURRENT ACCOUNT: SERVICES AND TRANSFFRS(in millions of USS)
item 1976 1976 1977 1978 1979 1980 1981 1982 1983 1984 1985 1986 1987
Services (net) -45 -269 -248 -107 -311 -399 -309 -1,04 -740 -975 85 757 -76
Receipts 907 871 1,085 1 484 1 6 2 222 2 896 2,983 3 127 2,26 3 288 3,791 3,497Freight and insurance 94 1 1 101 113 120 111Other transportation 67 67 63 57 71 106 138 73 33 19 37 44 62Travel 110 93 146 210 238 320 344 450 465 366 506 647 458Direct investment income 170 127 139 181 213 341 524 369 375 325 359 235 345Of which:Interest on placement 158 125 138 179 200 336 619 365 374 321 346 229 339
Government (n.i.e.) 181 204 190 204 193 233 259 281 292 257 373 n.a. n.a.Military services 50 53 56 71 71 85 103 101 88 n.a. n.a. n.a. n.a.Other 131 151 134 133 122 148 156 180 204 n.a. n.a. 430 337
Personal income 103 111 213 291 385 421 546 810 944 659 694 696 809Other services /! 253 237 241 459 484 701 979 899 918 865 1,152 1,319 1,223
Payments 962 1,130 1 333 1,591 L 966 2,621 3 205 4 023 3,867 3,601 3,203 3,034 3 ,73Freight and insurance 324 320 3S6 411 41 588 533 56 4975 358 340 351 41Other transportation 30 37 73 91 170 192 248 220 167 94 38 52 110Travel 27 28 35 51 74 106 126 147 221 19 37 56 88 MDirect investment expense 307 394 472 587 779 1,173 1,564 2,192 2,147 2,432 2,352 2,184 2,415 SOf which:Interest on loans and deposits 234 259 236 440 626 975 1,374 1,990 1,985 2,330 2,208 2,046 2,226
Government (n.i.e.) 75 80 62 104 92 121 110 107 135 45 22 21 31Other services /a 189 271 335 347 380 461 624 761 702 653 414 370 478
Transfers (net) 318 269 260 312 355 434 472 486 472 386 379 441 554
Receipts 329 280 273 322 369 451 485 498 483 387 388 445 556Personal remittances 128 112 i2S 1T4 ThY 'fa YP 239 1780 - 111 16T3 2I1US Veterans Administration 87 88 92 86 106 114 121 126 110 104 113 112 111Others 114 80 56 82 72 132 110 133 193 224 164 170 234
Payments 11 11 13 10 14 17 13 12 11 1 9 4 2
L Adjusted to include withdrawals of 343/547 deposits in pesos.
n.a. - data not available.
Source: Central Bank of Philippines.
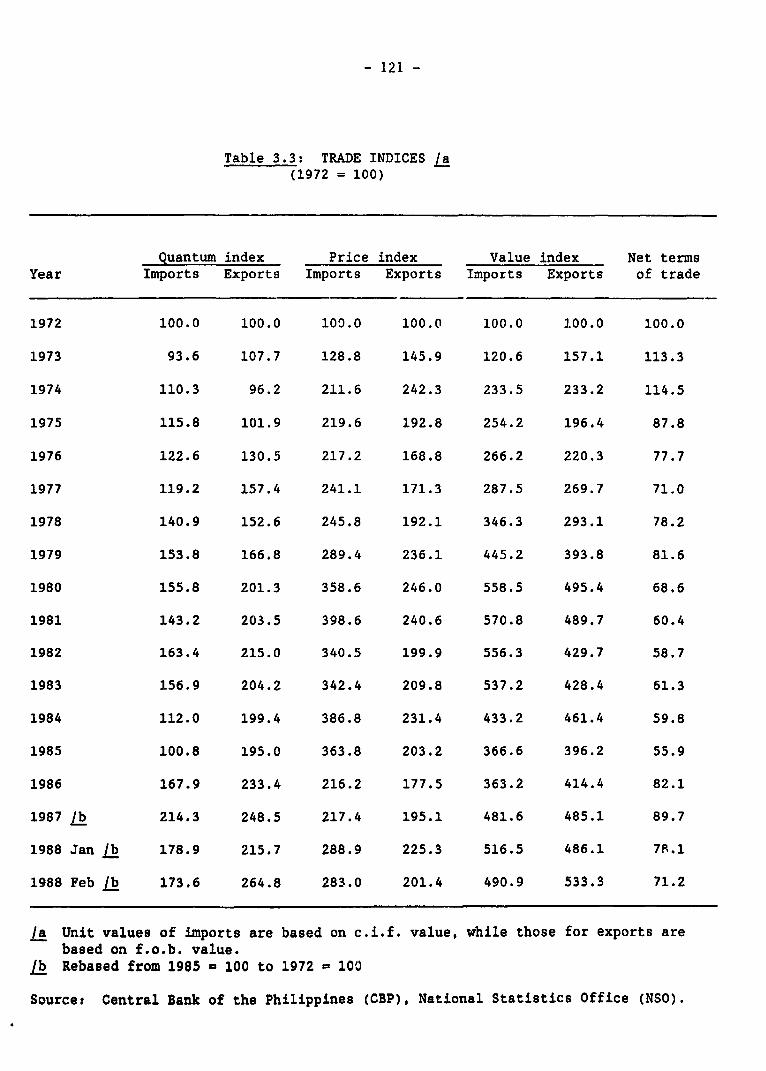
- 121 -
Table 3.3: TRADE INDICES /a(1972 = 100)
Quantum index Price index Value index Net termsYear Imports Exports Imports Exports Imports Exports of trade
1972 100.0 100.0 100.0 100.0 100.0 100.0 100.0
1973 93.6 107.7 128.8 145.9 120.6 157.1 113.3
1974 110.3 96.2 211.6 242.3 233.5 233.2 114.5
1975 115.8 101.9 219.6 192.8 254.2 196.4 87.8
1976 122.6 130.5 217.2 168.8 266.2 220.3 77.7
1977 119.2 157.4 241.1 171.3 287.5 269.7 71.0
1978 140.9 152.6 245.8 192.1 346.3 293.1 78.2
1979 153.8 166.8 289.4 236.1 445.2 393.8 81.6
1980 155.8 201.3 358.6 246.0 558.5 495.4 68.6
1981 143.2 203.5 398.6 240.6 570.8 489.7 60.4
1982 163.4 215.0 340.5 199.9 556.3 429.7 58.7
1983 156.9 204.2 342.4 209.8 537.2 428.4 61.3
1984 112.0 199.4 386.8 231.4 433.2 461.4 59.8
1985 100.8 195.0 363.8 203.2 366.6 396.2 55.9
1986 167.9 233.4 216.2 177.5 363.2 414.4 82.1
1987 /b 214.3 248.5 217.4 195.1 481.6 485.1 89.7
1988 Jan /b 178.9 215.7 288.9 225.3 516.5 486.1 78.1
1988 Feb Lb 173.6 264.8 283.0 201.4 490.9 533.3 71.2
/a Unit values of imports are based on c.i.f. value, while those for exports arebased on f.o.b. value.
/b Rebased from 1985 - 100 to 1972 a 100
Source: Central Bank of the Philippines (CBP), National Statistics Office (NSO).

- 122 -
TebIIA 3 EXPORTS 8Y COt1tODITY OROUPS(f o b TUTn .illions of US$ at current prices)
1975 1976 Ql77 1978 tO70 t98O t191 1982 1983 1984 1985 1986 1987
Coconut Product. 462 536 729 872 965 781 719 563 639 690 440 463 554
Coconut oil (crude) 226 205 380 585 683 537 502 174 475 543 328 326 374
Desiccated coconut 31 37 90 82 107 116 102 68 81 106 76 44 75
Copr' meal or cake 33 54 58 69 86 81 8i 72 72 41 36 75 73
Copra 172 150 201 136 89 47 34 49 4 0 0 18 32
Supsr and Produce 6 _ 525 1 239 590 4j4 396 282 22 S 103 7i
Centrifugal 581 426 506 197 212 557 416 371 265 239 145 87 60
Mtolasse 34 25 20 16 27 33 38 25 17 33 16 16 11
Other Agricultural Product 176 223 266 297 4fl 484 ffi 429 373 418 41 517 513
Bananas 73 76 73 84 97 114 124 146 105 122 113 130 121
P.n.apple, canned 35 47 56 60 74 82 89 88 74 87 89 83 86
Fish. fresh or simply peserved 16 26 41 57 87 107 90 71 77 68 90 143 207
Coffee, rae 2 25 45 34 44 45 39 40 47 76 70 119 32
Tobacco, unmanufactured 34 2d 28 29 33 29 48 47 34 28 24 21 18
Abaca fibers. unmanufactured 14 18 17 15 25 21 21 20 18 30 17 13 12
Rice - - 4 14 46 73 24 - 9 - - 0 25
M4angoes 2 3 2 4 5 7 6 8 9 7 7 8 12
Forest Produ4 s 32 288 4 3 484 420 344 290 327 265 193 196 237
Logo 167 135 134 145 144 92 76 79 74 88 39 27 0
Lumber 27 68 67 85 198 181 126 124 149 107 91 104 154
Ply.ood 23 47 41 72 107 111 111 67 76 56 51 56 68
Vancor and corestock 8 18 20 22 35 36 31 20 28 14 12 9 15
Mlinersl Products US 431 520 534 820 1.168 979 686 607 383 402 367 300
Copper concentrates 212 266 268 250 440 545 429 312 249 IS 84 90 109
C.04 76 63 7L 76 Iva wuJ * 'l 1b'0 154 1u4 IUO 140 91
Nickel 33 59 77 55 92 138 103 49 53 12 64 15 0
Iron ore and concentratne 12 7 - - - - - - - -
Irons ore agglomerates - 57 104 120 118 116 106 114 105 95 85 76
Chromit- ore 13 15 25 25 23 33 25 15 10 19 12 11 7
Other 19 19 22 24 42 95 91 35 27 28 47 26 17
Nontraditional Manufactures 404 568 730 1 055 1.485 2.042 2.406 2.391 2 495 3 067 2.765 2.969 3.718/a
Electrical equipments and components 47 85 124 253 412 671 838 1,000 1,053 1,329 1,056 919 1.119
Garments 100 185 250 327 405 502 618 541 545 603 623 751 1,098
Food products *nd beverages 14 20 31 41 46 92 154 150 127 109 106 116 126
Handicrafts 46 65 60 81 118 149 155 143 133 137 136 1SO 199
Chemicals 21 27 51 54i 112 89 105 95 86 105 ISO 243 245
Furniture and ports 6 10 22 27 55 77 87 72 84 88 84 89 130
Footwear 3 5 10 32 51 67 73 62 55 46 39 31 31
Wood mnufactures, eacluding
plywood. "near and lumber 29 32 28 30 40 35 46 41 53 50 43 49 62
Machinery and transport equipment 10 16 26 37 47 47 47 48 35 36 30 45 78
Textile yarn, fabrics and
other related products 22 39 34 44 55 74 69 56 44 38 39 44 68
Others 107 102 142 156 189 255 269 217 350 597 530 523 531
OQt.r 47 97 118 130 197 3Q 37 26 282 296 249 227 327/b
t etroleum products for int'I del;iery 5 11 18 21 31 54 57 49 34 18 19 13 88
Other * porto and re-e.ports 42 86 100 109 166 249 322 217 248 278 230 214 239
Total 2 294 2 574 L 3.425 4.601 5,788 5 722 5 021 5005 5 391 4.629 4 842 5 720
Lj E.cludes refined petroleum producta
/ IncIudes refined petroleum products
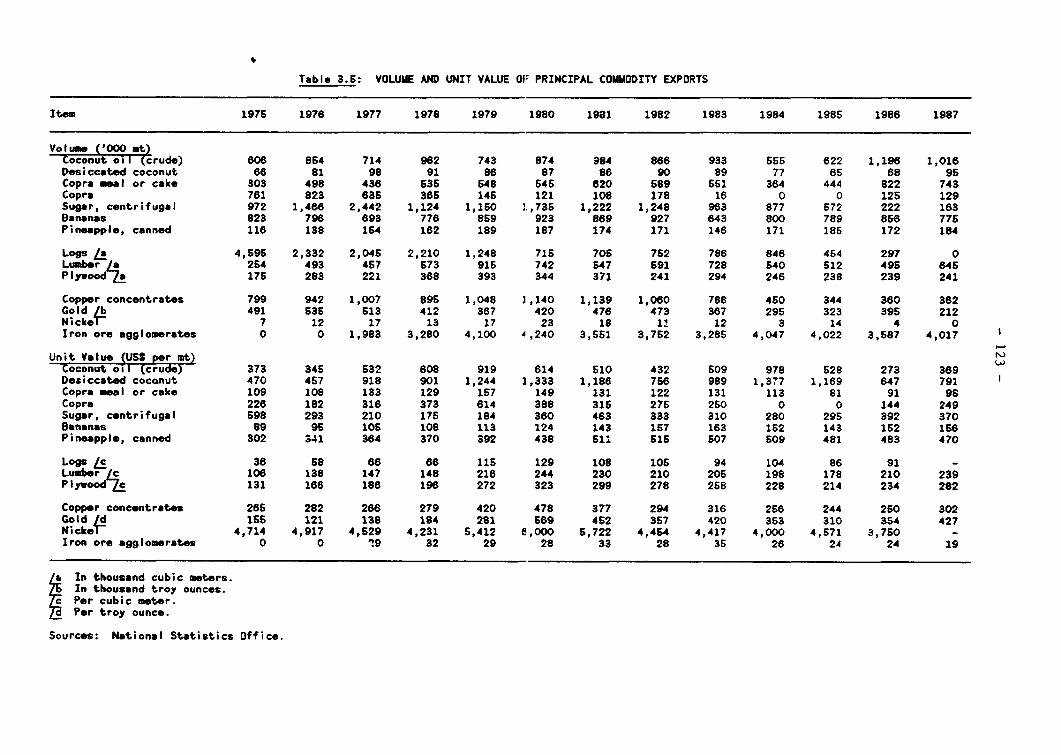
Table 3.6: VOLUME AND UNIT VALUE 01 PRINCIPAL COMMODITY EXPORTS
Item 1975 1976 1977 1978 1979 1980 1981 1982 1983 1984 1986 1986 1987
Volume ('000 at)Coconut oil (crude) 608 864 714 962 743 874 984 886 933 555 622 1,196 1,016Desiccated coconut 66 81 98 91 86 87 86 90 89 77 65 68 95Copra meal or cake 303 498 436 535 548 545 620 589 551 364 444 822 743Copra 761 823 635 365 145 121 108 178 16 0 0 125 129Sugar, centrifugal 972 1,466 2,442 1,124 1,160 1.,735 1,222 1,248 963 877 672 222 163Bananas 823 796 693 776 869 923 869 927 643 800 789 856 775Pineapple, canned 116 138 154 162 189 187 174 171 146 171 185 172 184
Logs /a 4,595 2,332 2,045 2,210 1,248 715 705 752 786 846 454 297 0Lumber /a 254 493 457 573 915 742 S47 591 728 540 512 495 645Plyw ooda 175 283 221 368 393 344 371 241 294 246 238 239 241
Copper concentrates 799 942 1,007 895 1,048 3,140 1,139 1,060 788 450 344 360 362Gold Lb 491 535 613 412 367 420 476 473 367 295 323 395 212NickeF 7 12 17 13 17 23 18 1! 12 3 14 4 0Iron ore agglomerates 0 0 1,983 3,280 4,100 4,240 3,551 3,752 3,285 4,047 4,022 3,587 4,017
Unit Value (USS per mt) Coconut oil (crude) 373 345 532 608 919 614 510 432 509 978 528 273 369Desiccated coconut 470 457 918 901 1,244 3,333 1,186 756 989 1,377 1,169 647 791Copra meal or cake 109 108 133 129 157 149 131 122 131 113 81 91 98Copra 226 182 316 373 614 388 31S 275 250 0 0 144 249Sugar, centrifugal 598 293 210 175 184 360 463 333 310 280 295 392 370Bananas 89 95 105 108 113 124 143 157 163 152 143 162 156Pineapple, canned 302 o41 364 370 392 438 51; S1S 507 509 481 483 470
Logs /c 36 58 68 66 115 129 108 105 94 104 86 91 -Lumber Lc 106 138 147 148 216 244 230 210 205 198 178 210 239Plywood7L 131 166 186 196 272 323 299 278 258 228 214 234 282
Copper concentrates 265 282 266 279 420 478 377 294 316 256 244 250 302Gold Id 1SS 121 138 184 281 569 452 367 420 353 310 354 427NickeT 4,714 4,917 4,529 4,231 5,412 6,000 5,722 4,454 4,417 4,000 4,571 3,750 -Iron ore agglomerates 0 0 29 32 29 28 33 28 35 26 24 24 19
/ In thousand cubic meters.In thousand troy ounces.Per cubic meter.Per troy ounce.
Sources: National Statistics Office.
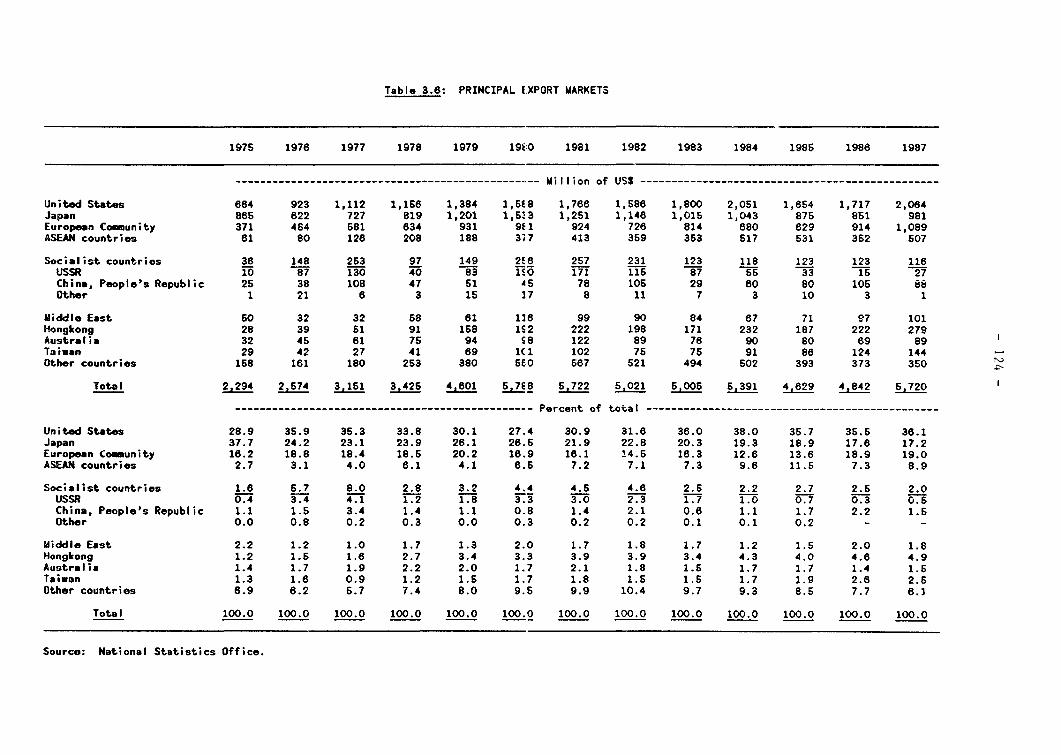
Table 3.6: PRINCIPAL EXPORT MARKETS
1975 1978 1977 1978 1979 1910 1981 1982 1983 1984 1985 1986 1987
…------------------------------------------------ Million of USS…
United States 884 923 1,112 1,156 1,384 1,518 1,768 1,s88 1,800 2,051 1,8S4 1,717 2,064Japan 8ss 822 727 819 1,201 1,5-3 1,251 1,148 1,015 1,043 875 851 981European Counity 371 464 581 834 931 91l 924 728 814 880 629 914 1,089ASEAN countries 61 80 128 208 188 3;7 413 359 353 617 531 352 607
Socialist countries 38 148 253 97 149 2V8 257 231 123 118 123 123 118USSR TO 87 130 TO 83 yso 171 115 87 55 33 -S 27China, People's Republic 25 38 108 47 51 A5 78 105 29 60 80 105 88Other 1 21 6 3 15 17 8 11 7 3 10 3 1
Middle East 50 32 32 58 61 le 99 90 84 67 71 97 101Hongkong 28 39 51 91 1ss 112 222 198 171 232 187 222 279Australia 32 45 61 75 94 S8 122 89 76 90 80 89 89Taiwan 29 42 27 41 89 lt 1 102 75 75 91 88 124 144Other countries 158 181 180 253 380 SE0 587 521 494 502 393 373 350
Total 2S294 2,574 3.151 3.425 4,601 5.7E8 5.722 5,021 5,005 5,391 4,629 4,842 5,720
------------------------------------------------ Percent of total…
United States 28.9 3s.9 3S.3 33.8 30.1 27.4 30.9 31.8 36.0 38.0 35.7 35.s 38.1Japan 37.7 24.2 23.1 23.9 28.1 28.s 21.9 22.8 20.3 19.3 18.9 17.8 17.2European Community 16.2 18.8 18.4 18.S 20.2 18.9 18.1 '4.5 16.3 12.8 13.6 18.9 19.0ASEAN countries 2.7 3.1 4.0 8.1 4.1 8.5 7.2 7.1 7.3 9.8 11.5 7.3 8.9
Socialist countries 1.8 5.7 8.0 2.8 3.2 4.4 4.S 4.6 2.S 2.2 2.7 2.5 2.0USSR 0.4 3.4 4.1 1.2 1.8 3.3 3.0 2.3 1.7 .0O 0.7 0.3 0.SChina, People's Republic 1.1 1.5 3.4 1.4 1.1 0.8 1.4 2.1 0.6 1.1 1.7 2.2 1.5Other 0.0 0.8 0.2 0.3 0.0 0.3 0.2 0.2 0.1 0.1 0.2 - -
Middle East 2.2 1.2 1.0 1.7 1.3 2.0 1.7 1.8 1.7 1.2 1.5 2.0 1.8Hongkong 1.2 1.6 1.8 2.7 3.4 3.3 3.9 3.9 3.4 4.3 4.0 4.6 4.9Australia 1.4 1.7 1.9 2.2 2.0 1.7 2.1 1.8 1.S 1.7 1.7 1.4 1.5Taiwan 1.3 1.8 0.9 1.2 1.S 1.7 1.8 1.5 1.S 1.7 1.9 2.8 2.5Other countries 8.9 8.2 6.7 7.4 8.0 9.5 9.9 10.4 9.7 9.3 8.5 7.7 8.1
Total 100.0 100.0 100.0 100.0 100.0 100.0 100.0 100.0 100.0 100.0 100.0 100.0 100.0
Source: National Statistics Office.
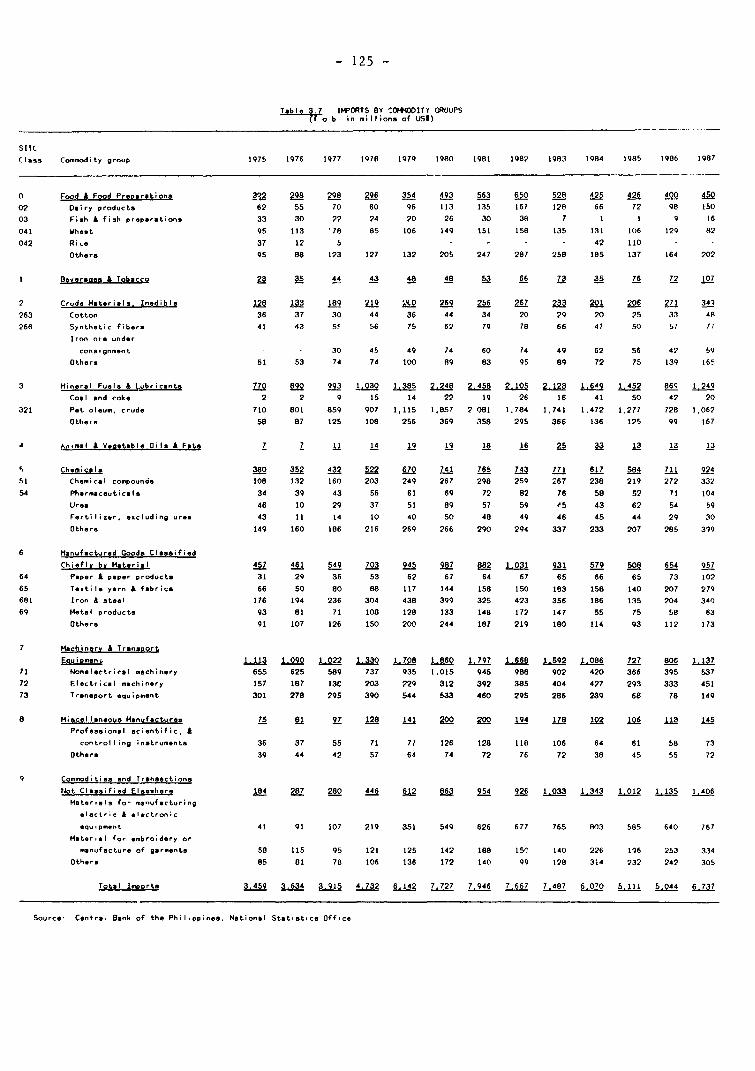
- 125 -
Table 3 7 IMPORTSBY COMMOOITY CROUPSo b in mi lions of US3)
SitCClass Commodity group 1975 1Q76 1977 1978 1Q79 1080 1981 1Q82 1983 1984 19865 1986 1Q87
0 Food A Food Preparations 32n 298 298 296 354 493 563 650 528 425 426 400 45002 Dairy products 62 55 70 60 96 113 135 167 128 66 72 Q8 ISO
03 Fish A fish preparations 33 30 22 24 20 26 30 38 7 1 1 9 16
041 Wheat 9S 113 '78 85 106 149 IS1 158 135 131 1(6 129 82
042 RiLe 37 12 5 - - - - - - 42 110 - -
Others 95 88 123 127 132 205 247 287 258 185 137 164 202
1 80vererses A Tobacco _44 43 48 48 53 66 73 35 76 72 107
2 Crude Materials Inedibl 128 j3 189 219 - 269 256 267 233 201 206 271 341
263 Cotton 36 37 30 44 36 44 34 20 29 20 25 33 4p
266 Synthetic fibers 41 43 S 56 75 62 79 78 66 47 SO 57 77
Iron ore under
consgnment - 30 45 49 74 60 74 49 62 56 42 59
Others 51 53 74 74 100 89 83 95 89 72 75 139 165
3 Mineral Fuels A Lubricants 770 890 993 1 030 1.385 2.24 2.458 2,105 2L123 1.649 1 452 86C 1.249
Coal *nd coke 2 2 9 15 14 22 19 26 16 41 50 42 20
321 Pet oleum, crude 710 801 859 907 1,115 1,857 2 081 1,784 1,741 1,472 1.277 728 1,062
Others 58 87 125 108 256 369 358 295 366 136 125 99 167
4 Animal A Voegtable Oils A Fats Z z 11 14 L 19 18 j6 25 _ l 13 13
S Chemicals 3A0 352 432 522 670 741 765 743 771 617 584 711 92451 Chemical compounds 108 132 160 203 249 267 298 259 267 238 219 272 332
54 Pharmaceuticals 34 3Q 43 56 61 69 72 82 76 58 52 71 104
Uresa 46 10 29 37 51 89 57 59 e5 43 62 54 59
Fertilizer, excluding urea 43 11 14 10 40 50 48 49 46 45 44 29 30
Others 149 160 186 216 269 266 290 294 337 233 207 285 399
6 Manufactured Goods Classified
Chiefly by Material 457 461 549 703 945 987 882 1.031 931 579 508 654 957
64 Paper A paper products 31 29 36 53 62 67 64 67 65 66 65 73 102
65 Textile yarn A fabrics 66 50 80 88 117 144 158 ISO 183 158 140 207 279681 Iron A steel 176 194 236 304 438 399 325 423 356 186 135 204 340
69 Hetal products 93 81 71 108 128 133 148 172 147 55 75 58 63
Others 91 107 126 150 200 244 187 219 180 114 93 112 173
7 Machinern A Transport
Equipm-ng 1113 1 090 1.022 1L330 1.708 1.60 1 797 1.668 1.592 1.086 727 806 1f13771 Nonelectrical machinery 655 625 589 737 935 1.015 945 988 902 420 366 395 537
72 Electrical machinery 157 187 13C 203 229 312 392 385 404 427 293 333 451
73 Transport equipment 301 278 295 390 544 533 460 295 286 239 68 78 149
8 Miscellaneovu Manufactures 75 Q. 97 120 "1 200 200 194 127 102 106 113 145Professional scientific, A
controlling instruments 36 37 55 71 71 126 128 118 106 64 61 58 73
Others 39 44 42 57 64 74 72 76 72 38 45 55 72
9 Commodities end Transactions
Not Classified Elseehere 184 287 280 446 612 863 954 926 1.033 1 343 1 012 1 135 1 406Mater,als fo. manufacturing
electric & electronic
equipment 41 91 107 219 351 549 626 677 765 803 585 640 767Material for eabroidery or
manufacture of garents 58 115 95 121 125 142 188 ISO 140 226 196 253 334
Others 85 81 78 106 136 172 140 99 128 314 232 242 305
Total Imports 3.459 3 634 3 915 4 732 6 142 7 727 7.946 7.667 7 487 6 010 5.111 5,044 6.737
Source Centre, Bank of the PhilIppines, Nat;onal Statistics Office
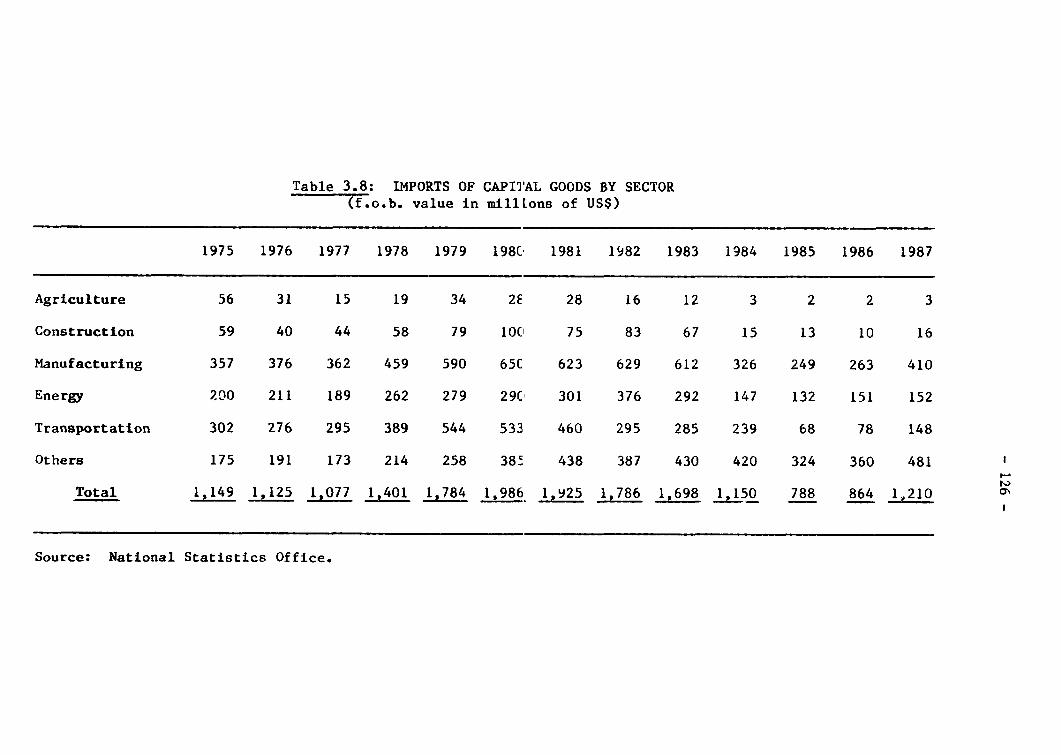
Table 3.8: IMPORTS OF CAPITAL GOODS BY SECTOR(f.o.b. value in millLons of USS)
1975 1976 1977 1978 1979 198C' 1981 1982 1983 1984 1985 1986 1987
Agriculture 56 31 15 19 34 2E 28 16 12 3 2 2 3
Construction 59 40 44 58 79 lo(' 75 83 67 15 13 10 16
Manufacturing 357 376 362 459 590 65C 623 629 612 326 249 263 410
Energy 200 211 189 262 279 29C' 301 376 292 147 132 151 152
Transportation 302 276 295 389 544 533 460 295 285 239 68 78 148
Others 175 191 173 214 258 385 438 387 430 420 324 360 481
Total 1,149 1,125 1,077 1,401 1,784 1,986 1,925 1,786 1,698 .1,50 788 864 1,210
Source: National Statistics Office.
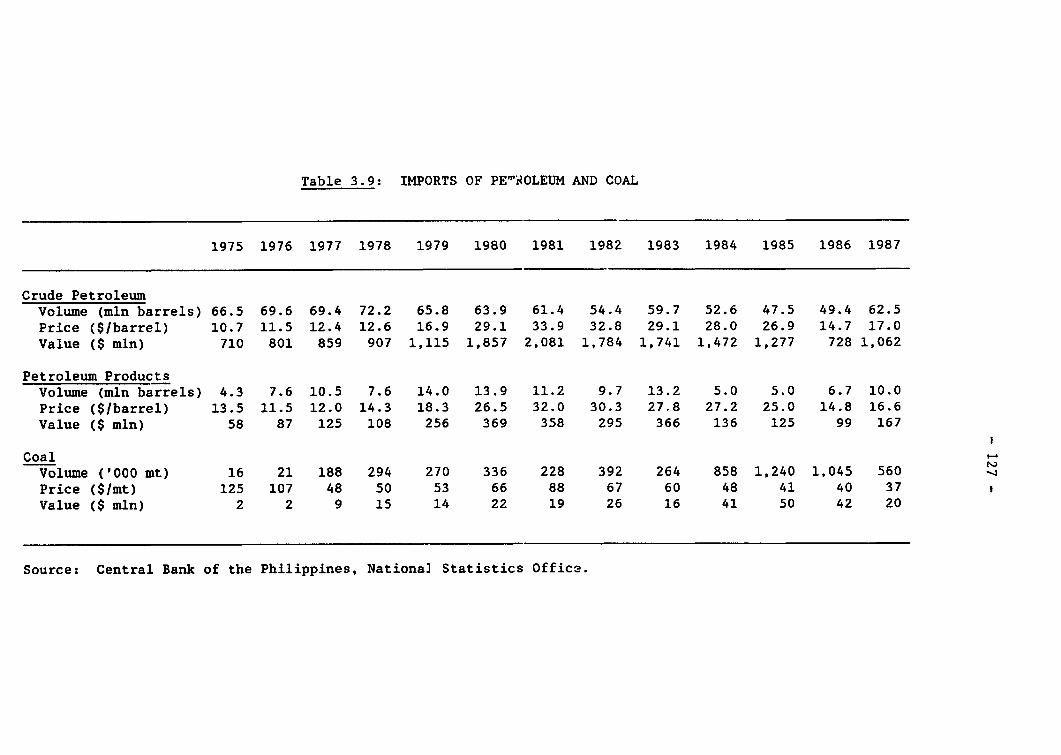
Table 3.9: IMPORTS OF PE'iROLEUM AND COAL
1975 1976 1977 1978 1979 1980 1981 1982 1983 1984 1985 1986 1987
Crude PetroleumVolume (mln barrels) 66.5 69.6 69.4 72.2 65.8 63.9 61.4 54.4 59.7 52.6 47.5 49.4 62.5
Price ($Ibarrel) 10.7 11.5 12.4 12.6 16.9 29.1 33.9 32.8 29.1 28.0 26.9 14.7 17.0
Value (S mln) 710 801 859 907 1,115 1,857 2,081 1,784 1,741 1,472 1,277 728 1,062
Petroleum ProductsVolume (mln barrels) 4.3 7.6 10.5 7.6 14.0 13.9 11.2 9.7 13.2 5.0 5.0 6.7 10.0
Price ($/barrel) 13.5 11.5 12.0 14.3 18.3 26.5 32.0 30.3 27.8 27.2 25.0 14.8 16.6
Value ($ mln) 58 87 125 108 256 369 358 295 366 136 125 99 167
CoalVolume ('000 mt) 16 21 188 294 270 336 228 392 264 858 1,240 1,045 560
Price ($/mt) 125 107 48 50 53 66 88 67 60 48 41 40 37
Value ($ mln) 2 2 9 15 14 22 19 26 16 41 50 42 20
Source: Central Bank of the Philippines, National Statistics Offic3.
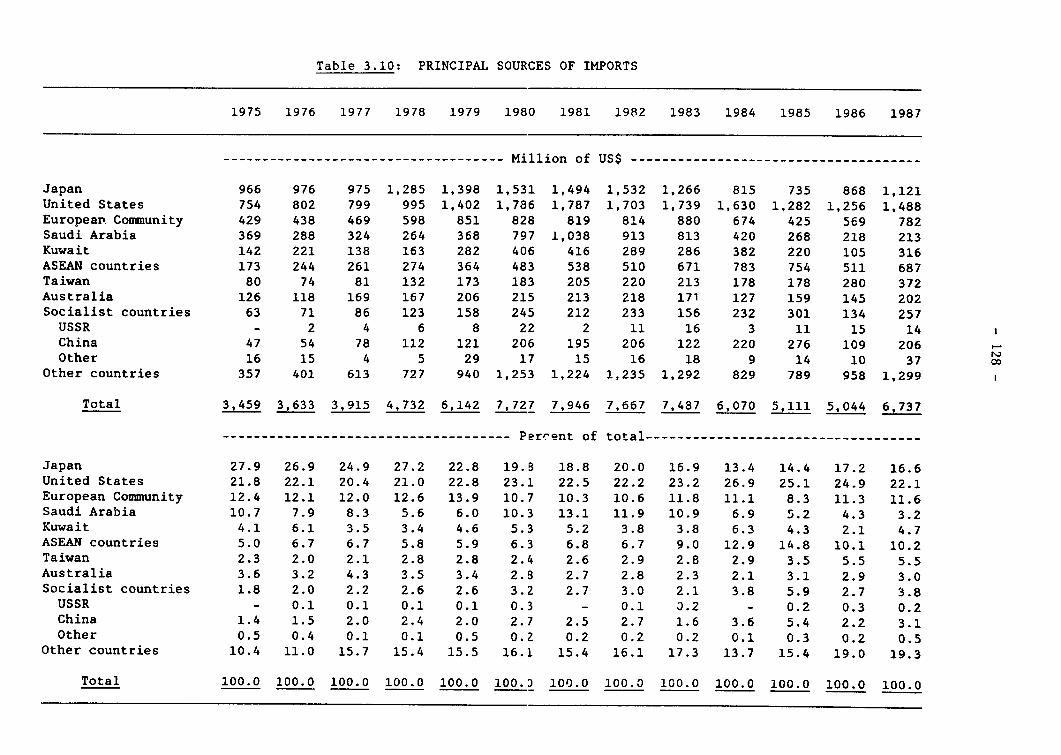
Table 3.10: PRINCIPAL SOURCES OF IMPORTS
1975 1976 1977 1978 1979 1980 1981 1982 1983 1984 1985 1986 1987
…----------------------------------- Million of US$ -------------------------------------
Japan 966 976 975 1,285 1,398 1,531 1,494 1,532 1,266 815 735 868 1,121United States 754 802 799 995 1,402 1,786 1,787 1,703 1,739 1,630 1,282 1,256 1,488European. Community 429 438 469 598 851 828 819 814 880 674 425 569 782Saudi Arabia 369 288 324 264 368 797 1,038 913 813 420 268 218 213Kuwait 142 221 138 163 282 406 416 289 286 382 220 105 316ASEAN countries 173 244 261 274 364 483 538 510 671 783 754 511 687Taiwan 80 74 81 132 173 183 205 220 213 178 178 280 372Australia 126 118 169 167 206 215 213 218 171 127 159 145 202Socialist countries 63 71 86 123 158 245 212 233 156 232 301 134 257USSR - 2 4 6 8 22 2 11 16 3 11 15 14China 47 54 78 112 121 206 195 206 122 220 276 109 206Other 16 15 4 5 29 17 15 16 18 9 14 10 37 X
Other countries 357 401 613 727 940 1,253 1,224 1,235 1,292 829 789 958 1,299 1
Total 3,459 3,633 3,915 4,732 6,142 7,727 7,946 7,667 7,487 6,070 5,111 5,044 6,737
------------------------------------- Percent of total-----------------------------------
Japan 27.9 26.9 24.9 27.2 22.8 19.3 18.8 20.0 16.9 13.4 14.4 17.2 16.6United States 21.8 22.1 20.4 21.0 22.8 23.1 22.5 22.2 23.2 26.9 25.1 24.9 22.1European Community 12.4 12.1 12.0 12.6 13.9 10.7 10.3 10.6 11.8 11.1 8.3 11.3 11.6Saudi Arabia 10.7 7.9 8.3 5.6 6.0 10.3 13.1 11.9 10.9 6.9 5.2 4.3 3.2Kuwait 4.1 6.1 3.5 3.4 4.6 5.3 5.2 3.8 3.8 6.3 4.3 2.1 4.7ASEAN countries 5.0 6.7 6.7 5.8 5.9 6.3 6.8 6.7 9.0 12.9 14.8 10.1 10.2Taiwan 2.3 2.0 2.1 2.8 2.8 2.4 2.6 2.9 2.8 2.9 3.5 5.5 5.5Australia 3.6 3.2 4.3 3.5 3.4 2.8 2.7 2.8 2.3 2.1 3.1 2.9 3.0Socialist countries 1.8 2.0 2.2 2.6 2.6 3.2 2.7 3.0 2.1 3.8 5.9 2.7 3.8
USSR - 0.1 0.1 0.1 0.1 0.3 - 0.1 0.2 - 0.2 0.3 0.2China 1.4 1.5 2.0 2.4 2.0 2.7 2.5 2.7 1.6 3.6 5.4 2.2 3.1Other 0.5 0.4 0.1 0.1 0.5 0.2 0.2 0.2 0.2 0.1 0.3 0.2 0.5
Other countries 10.4 11.0 15.7 15.4 15.5 16.1 15.4 16.1 17.3 13.7 15.4 19.0 19.3
Total 100.0 100.0 100.0 100.0 100.0 100.'J 100.0 100.0 100.0 100.0 100.0 100.0 100.0
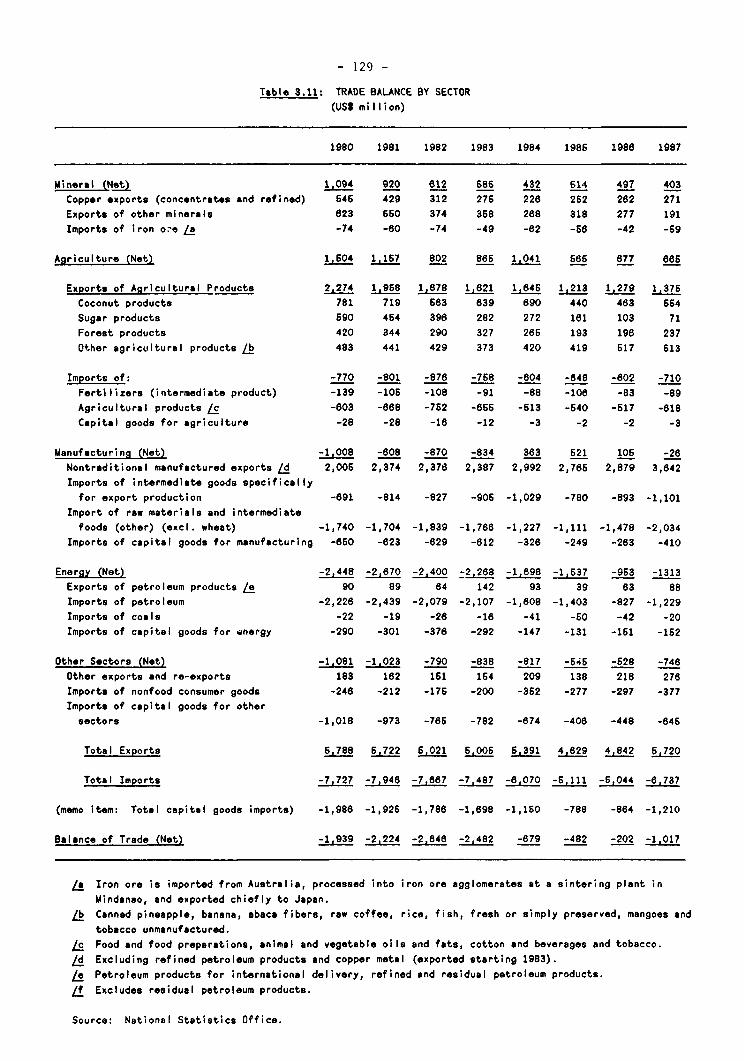
- 129 -
Table 3.11: TRADE BALANCE BY SECTOR(USS million)
1980 1981 1982 1983 1984 1986 1988 1987
Mineral (Net) 1.094 920 812 686 432 614 497 403Copper exports (concentrates and refined) 546 429 312 276 228 262 262 271Exports of other minerals 823 660 374 368 268 318 277 191Imports of iron oze /a -74 -60 -74 -49 -62 -66 -42 -59
AAriculture (Net) 1.504 1.167 802 865 1,041 666 877 865
Exports of Agricultural Products 2,274 1,958 1,678 1,621 1.646 1,213 1,279 1,376Coconut products 781 719 653 839 890 440 463 664Sugar products 690 454 396 282 272 161 103 71Forest products 420 344 290 327 286 193 196 237Other agricultural products L 483 441 429 373 420 419 617 513
Imports of: -770 -801 -876 -768 -804 -848 -802 -710Fertilizers (intermediate product) -139 -105 -108 -91 -88 -108 -83 -89Agricultural products Ls -803 -868 -762 -665 -513 -640 -517 -818Capital goods for agriculture -28 -28 -16 -12 -3 -2 -2 -3
Manufacturing (Net) -1,008 -608 -870 -834 383 621 105 -26Nontraditional manufactured exports d 2,005 2,374 2,376 2,387 2,992 2,785 2,879 3,842Imports of intermediate goods specifically
for export production -691 -814 -827 -906 -1,029 -780 -893 -1,101Import of raw materials and intermediate
foods (other) (excl. wheat) -1,740 -1,704 -1,839 -1,766 -1,227 -1,111 -1,478 -2,034Imports of capital goods for manufacturing -860 -623 -629 -612 -326 -249 -263 -410
Energy (Net) -2,448 -2,67 -2400 -2,268 -1,698 -1,637 -963 -1313Exports of petroleum products /e 90 89 64 142 93 39 83 88Imports of petroleum -2,228 -2,439 -2,079 -2,107 -1,808 -1,403 -827 -1,229Imports of coals -22 -19 -28 -18 -41 -60 -42 -20Imports of capital goods for energy -290 -301 -376 -292 -147 -131 -151 -152
Other Sectors (Net) -1.081 -1,023 -790 -838 -817 -545 -628 -746Other exports and re-exports 183 182 161 164 209 138 218 278Imports of nonfood consumer goods -246 -212 -175 -200 -362 -277 -297 -377Imports of capital goods for other
sectors -1,018 -973 -786 -782 -674 -406 -448 -646
Total Exports 65788 6,722 5,021 6,006 6.391 4,629 4,842 5,720
Total Imports -7,727 -7,943 -7,887 -7,487 -6,070 -5,111 -6,044 -6,737
(memo item: Total capital goods imports) -1,986 -1,925 -1,786 -1,698 -1,160 -788 -864 -1,210
Balance of Trade (Net) -1,939 -2,224 -2,848 -2,482 -679 -482 -202 -1,017
/a Iron ore is imported from Australia, processed into iron ore agglomerates at a sintering plant inMindanao, and exported chiefly to Japan.
Lb Canned pineapple, banana, abaca fibers, raw coffee, rice, fish, fresh or simply preserved, mangoes andtobacco unmanufactured.
/c Food and food preparations, animal and vegetable oils and fats, cotton and beverages and tobacco./d Excluding refined petroleum products and copper metal (exported starting 1983).l Petroleum products for international delivery, refined and residual petroleum products./f Excludes residual petroleum products.
Source: National Statistics Office.
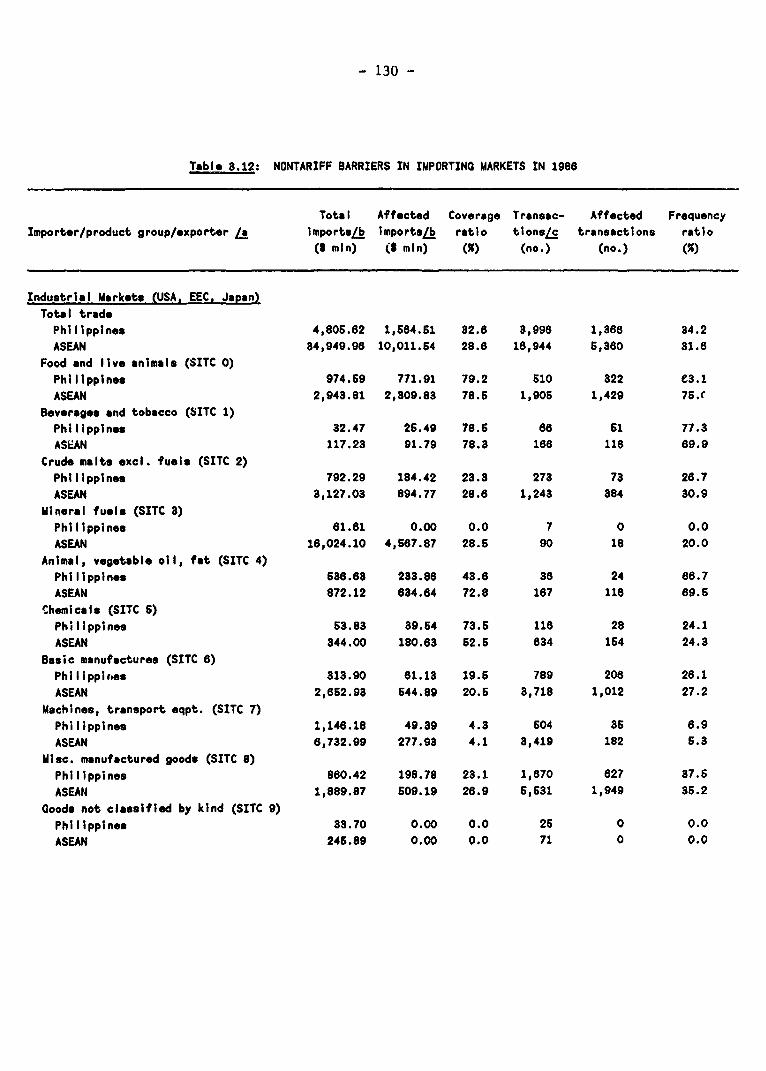
- 130 -
Table 3.12: NONTARIFF BARRIERS IN IMPORTING MARKETS IN 1986
Total Affected Coverage Transac- Affected Frequency
Importer/product group/exporter /a imports/b importsjL ratio tions/c transactions ratio
(I mln) (S min) (X) (no.) (no.) (%)
Industrial Markets (USA, EEC. Japan)
Total trade
Philippines 4,805.62 1,684.61 82.8 3,998 1,388 34.2
ASEAN 84,949.98 10,011.64 28.8 18,944 6,380 31.6
Food and live animals (SITC 0)
Philippines 974.69 771.91 79.2 510 322 e3.1
ASEAN 2,943.81 2,809.83 78.6 1,906 1,429 76.CBeverages and tobacco (SITC 1)
Philippines 32.47 26.49 78.6 68 61 77.3
ASEAN 117.23 91.79 78.3 18 l1 89.9
Crude malts excl. fuels (SITC 2)
Philippines 792.29 184.42 23.3 273 73 28.7
ASEAN 3,127.03 894.77 28.6 1,243 384 30.9
Mineral fuels (SITC 3)
Philippines 81.81 0.00 0.0 7 0 0.0
ASEAN 18,024.10 4,657.87 28.6 90 18 20.0
Animal, vegetable oil, fat (SITC 4)
Philippines 638.63 233.88 43.6 3S 24 86.7
ASEAN 872.12 634.84 72.8 167 116 89.5
Chemicals (SITC 6)
Philippines 63.83 39.64 73.5 118 28 24.1
ASEAN 344.00 180.83 62.6 834 154 24.3
Basic manufactures (SITC 8)
Philippir.es 313.90 61.13 19.6 789 206 26.1
ASEAN 2,652.93 644.89 20.5 3,718 1,012 27.2
Machines, transport eqpt. (SITC 7)
Philippines 1,146.18 49.39 4.3 604 36 6.9
ASEAN 6,732.99 277.93 4.1 3,419 182 6.3
Misc. manufactured goods (SITC 8)
Philippines 880.42 198.78 23.1 1,670 827 37.6
ASEAN 1,889.87 609.19 28.9 5,631 1,949 36.2
Goods not classified by kind (SITC 9)
Philippines 33.70 0.00 0.0 26 0 0.0
ASEAN 246.89 0.00 0.0 71 0 0.0
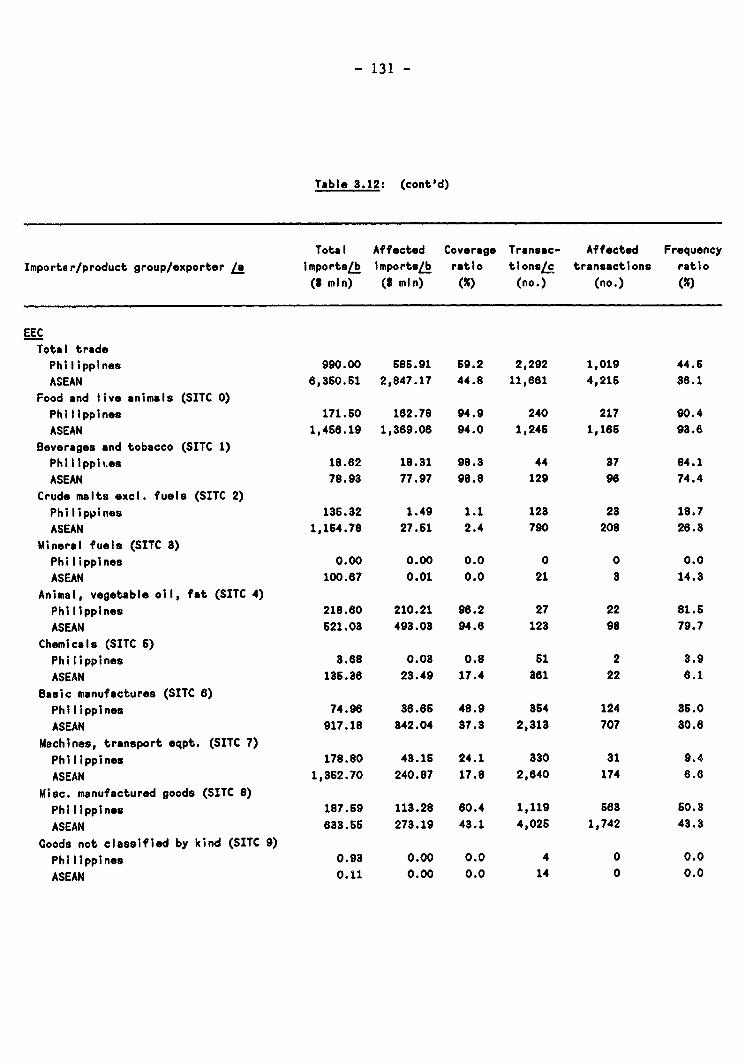
- 131 -
Table 3.12: (cont'd)
Total Affected Coverage Transac- Affected Frequency
Importer/product group/exporter la importsb importsLb ratio tions/c transactions ratio
(3 mmn) ( mi) (%) (no.) (no.) (%)
EECTotal tradePhilippines 990.00 686.91 69.2 2,292 1,019 44.6
ASEAN 6,360.61 2,847.17 44.8 11,661 4,216 36.1
Food and live animals (SITC 0)Philippines 171.60 182.78 94.9 240 217 90.4
ASEAN 1,468.19 1,369.08 94.0 1,246 1,166 93.6
Beverages and tobacco (SITC 1)Philippii.es 18.62 18.31 98.3 44 37 84.1ASEAN 78.93 77.97 98.8 129 96 74.4
Crude malts excl. fuels (SITC 2)Philippines 136.32 1.49 1.1 123 23 18.7ASEAN 1,154.78 27.51 2.4 790 208 26.3
Mineral fuels (SITC 3)Philippines 0.00 0.00 0.0 0 0 0.0ASEAN 100.67 0.01 0.0 21 3 14.3
Animal, vegetable oil, fat (SITC 4)Philippines 218.80 210.21 96.2 27 22 81.6
ASEAN 521.03 493.03 94.6 123 98 79.7Chemicals (SITC 6)Philippines 3.68 0.03 0.8 51 2 3.9ASEAN 136.38 23.49 17.4 381 22 6.1
Basic manufactures (SITC 8)Philippines 74.96 36.65 48.9 364 124 85.0
ASEAN 917.18 342.04 37.3 2,313 707 a0.6Machines, transport eqpt. (SITC 7)Philippines 178.80 43.16 24.1 330 31 9.4
ASEAN 1,362.70 240.87 17.8 2,640 174 6.6
Misc. manufactured goods (SITC 8)Philippines 187.59 113.28 80.4 1,119 683 60.3
ASEAN 633.66 273.19 43.1 4,026 1,742 43.3
Goods not classified by kind (SITC 9)Philippines 0.93 0.00 0.0 4 0 0.0
ASEAN 0.11 0.00 0.0 14 0 0.0
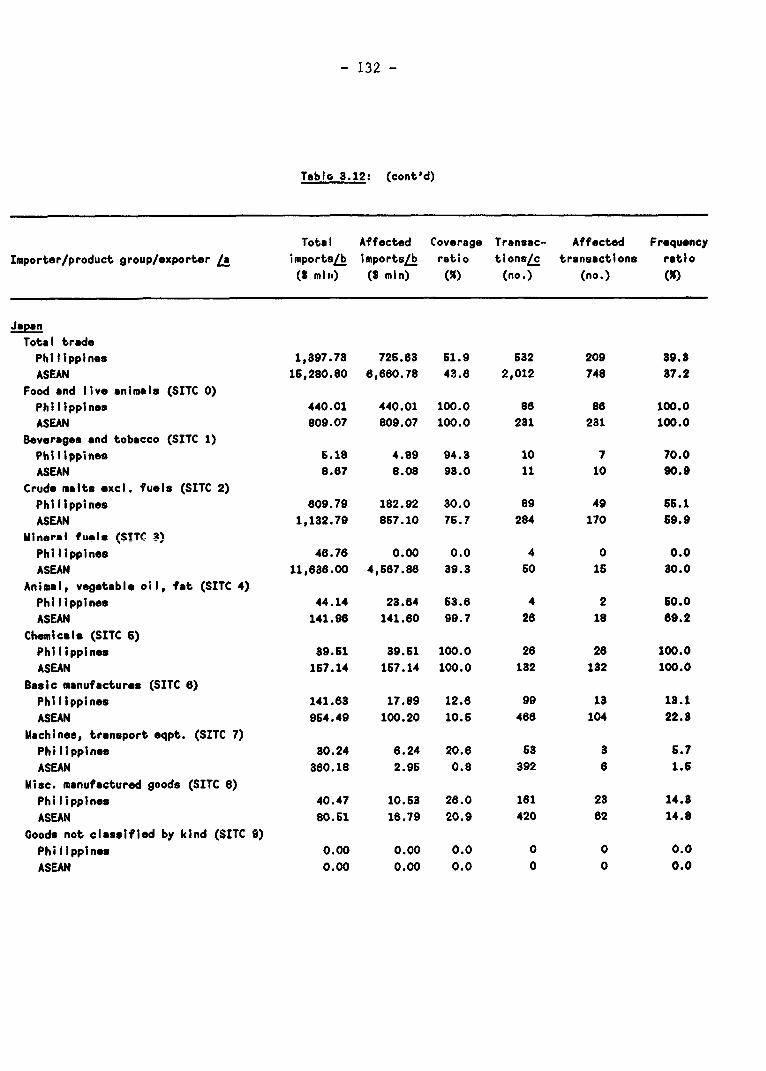
- 132 -
TablG 3.12: (cont'd)
Total Affected Coverage Transac- Affected Frequency
Importer/product group/exporter Lo imports/b imports/b ratio tions/c transactions ratio(5 mill) (S mln) (%) (no.) (no.) (#)
JapanTotal tradePhilippines 1,397.78 725.63 61.9 532 209 89.8
ASEAN 16,280.80 6,660.78 43.8 2,012 748 37.2Food and live animals (SITC 0)Philippines 440.01 440.01 100.0 8B 88 100.0
ASEAN 809.07 809.07 100.0 231 231 100.0
Beverages and tobacco (SITC 1)Philippines 6.18 4.89 94.3 10 7 70.0
ASEAN 8.67 8.08 93.0 11 10 90.9
Crude malts excl. fuels (SITC 2)Philippines 809.79 182.92 30.0 89 49 56.1
ASEAN 1,132.79 867.10 765. 284 170 69.9Mineral fuel. - TTC 2!
Philippines 46.78 0.00 0.0 4 0 0.0
ASEAN 11,636.00 4,667.88 39.3 60 15 30.0Animal, vegetable oil, fat (SITC 4)Philippines 44.14 23.64 63.8 4 2 60.0ASEAN 141.98 141.80 99.7 28 18 89.2
Chemicals (SITC 6)Philippines 39.61 39.61 100.0 28 28 100.0
ASEAN 167.14 157.14 100.0 132 132 100.0Basic manufactures (SITC 6)Philippines 141.83 17.89 12.8 99 13 13.1ASEAN 964.49 100.20 10.6 486 104 22.8
Machines, transport eqpt. (SITC 7)Philippines 30.24 8.24 20.8 63 3 6.7ASEAN 380.18 2.96 0.8 392 8 1.6
Misc. manufactured goods (SITC 8)Philippines 40.47 10.63 26.0 181 23 14.8ASEAN 80.61 18.79 20.9 420 82 14.8
Coods not classified by kind (SITC 9)Philippines 0.00 0.00 0.0 0 0 0.0
ASEAN 0.00 0.00 0.0 0 0 0.0
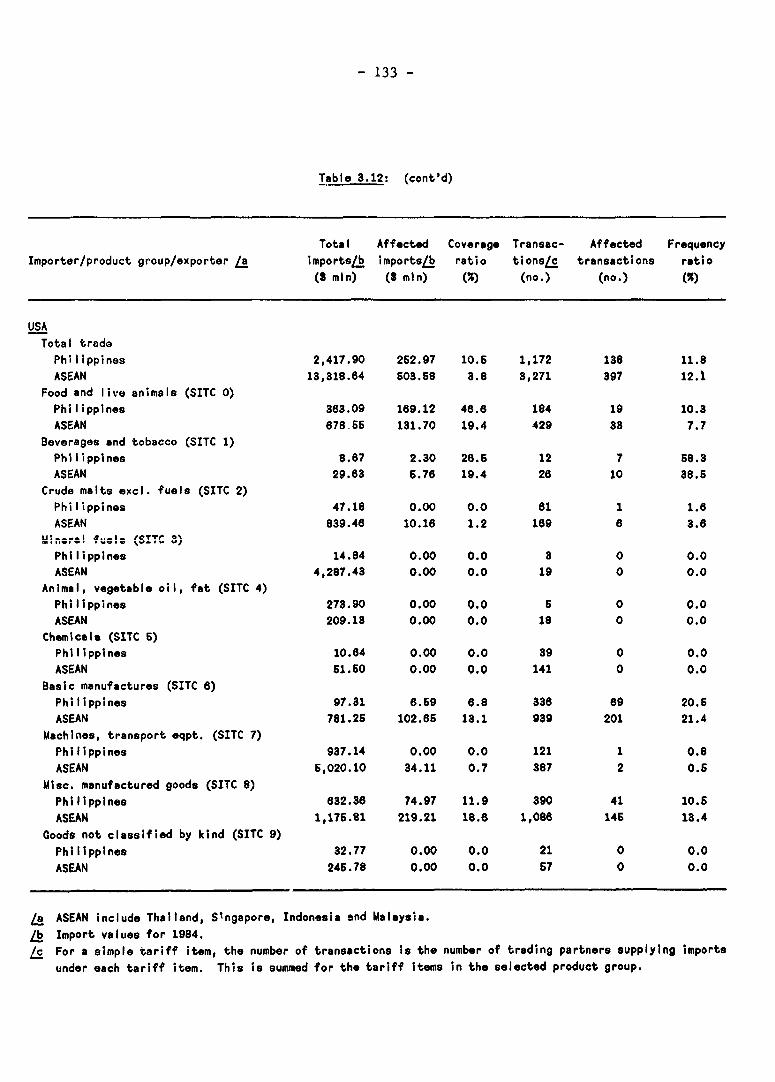
- 133 -
Table 3.12: (cont'd)
Total Affected Coverage Transac- Affected FrequencyImporter/product group/exporter La imports/b importsL ratio tionsc transactions ratio
(3 mln) (S min) () (no.) (no.) (%)
USA
Total trade
Philippines 2,417.90 262.97 10.6 1,172 138 11.8ASEAN 13,318.64 603.58 3.8 3,271 397 12.1
Food and live animals (SITC 0)Philippines 363.09 169.12 46.6 184 19 10.3ASEAN 87865 131.70 19.4 429 38 7.7
Beverages and tobacco (SITC 1)Philippines 8.67 2.30 26.6 12 7 68.3ASEAN 29.63 6.76 19.4 26 10 38.6
Crude malts excl. fuels (SITC 2)Philippines 47.18 0.00 0.0 61 1 1.8ASEAN 839.46 10.16 1.2 169 6 3.6
M n_:! fue!. 0S T SwPhilippines 14.84 0.00 0.0 8 0 0.0ASEAN 4,287.43 0.00 0.0 19 0 0.0
Animal, vegetable oil, fat (SITC 4)Philippines 273.90 0.00 0.0 6 0 0.0ASEAN 209.13 0.00 0.0 18 0 0.0
Chemicals (SITC 6)Philippines 10.84 0.00 0.0 39 0 0.0ASEAN 51.60 0.00 0.0 141 0 0.0
Basic manufactures (SITC 6)Philippines 97.31 6.69 6.8 338 69 20.6ASEAN 781.25 102.68 13.1 939 201 21.4
Machines, transport eqpt. (SITC 7)Philippines 937.14 0.00 0.0 121 1 0.8ASEAN 5,020.10 34.11 0.7 387 2 0.6
Misc. manufactured goods (SITC 8)Philippines 632.36 74.97 11.9 390 41 10.6ASEAN 1,176.81 219.21 18.6 1,088 146 13.4
Goods not classified by kind (SITC 9)Philippines 32.77 0.00 0.0 21 0 0.0ASEAN 246.78 0.00 0.0 67 0 0.0
La ASEAN include Thailand, Singapore, Indonesia and Malaysia.Lb Import values for 1984./c For a simple tariff item, the number of transactions is the number of trading partners supplying imports
under each tariff item. This is summed for the tariff items in the selected product group.
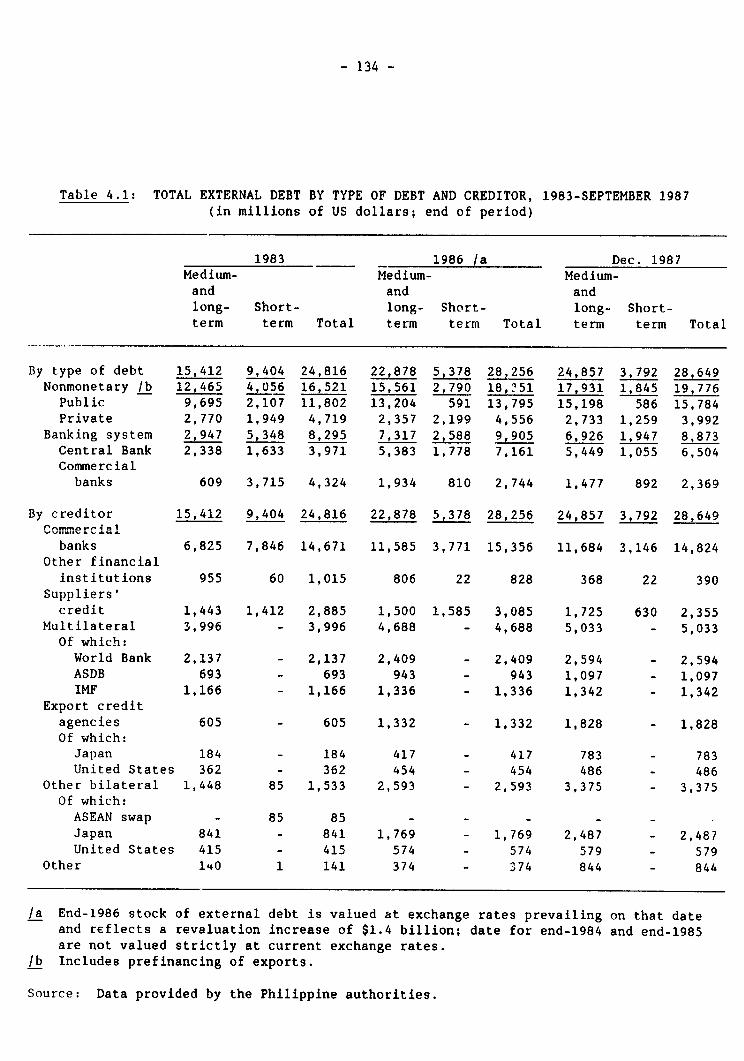
- 134 -
Table 4.1: TOTAL EXTERNAL DEBT BY TYPE OF DEBT AND CREDITOR, 1983-SEPTEMBER 1987(in millions of US dollars; end of period)
1983 1986 /a Dec. 1987Medium- Medium- Medium-and and andlong- Short- long- Short- long- Short-term term Total term term Total term term Total
By type of debt 15,412 9,404 24,816 22,878 5,378 28,256 24,857 3,792 28,649Nonmonetary /b 12,465 4 056 16,521 15,561 2,790 18,?51 17,931 1,845 19,776Public 9,695 2,107 11,802 13,204 591 13,795 15,198 586 15,784Private 2,770 1,949 4,719 2,357 2,199 4,556 2,733 1,259 3,992
Banking system 2,947 5,348 8,295 7,317 2,588 9,905 6,926 1,947 8,873Central Bank 2,338 1,633 3,971 5,383 1,778 7,161 5,449 1,055 6,504Commercial.banks 609 3,715 4,324 1,934 810 2,744 1,477 892 2,369
By creditor 15,412 9,404 24,816 22,878 5,378 28,256 24,857 3,792 28,649Pnmmrercial
banks 6,825 7,846 14,671 11,585 3,771 15,356 11,684 3,146 14,824Other financialinstitutions 955 60 1,015 806 22 828 368 22 390
Suppliers'credit 1,443 1,412 2,885 1,500 1,585 3,085 1,725 630 2,355
Multilateral 3,996 - 3,996 4,688 - 4,688 5,033 - 5,033Of which:
World Bank 2,137 - 2,137 2,409 - 2,409 2,594 - 2,594ASDB 693 - 693 943 - 943 1,097 - 1,097IMF 1,166 - 1,166 1,336 - 1,336 1,342 - 1,342
Export creditagencies 605 - 605 1,332 - 1,332 1,828 - 1,828Of which:
Japan 184 - 184 417 - 417 783 - 783United States 362 - 362 454 - 454 486 - 486
Other bilateral 1,448 85 1,533 2,593 - 2,593 3,375 - 3,375Of which:
ASEAN swap - 85 85 - - - - - -Japan 841 - 841 1,769 - 1,769 2,487 - 2,487United States 415 - 415 574 - 574 579 - 579
Other 1'0 1 141 374 - 374 844 - 844
/a End-1986 stock of external debt is valued at exchange rates prevailing on that dateand reflects a revaluation increase of $1.4 billion; date for end-1984 and end-1985are not valued strictly at current exchange rates.
/b Includes prefinancing of exports.
Source: Data provided by the Philippine authorities.
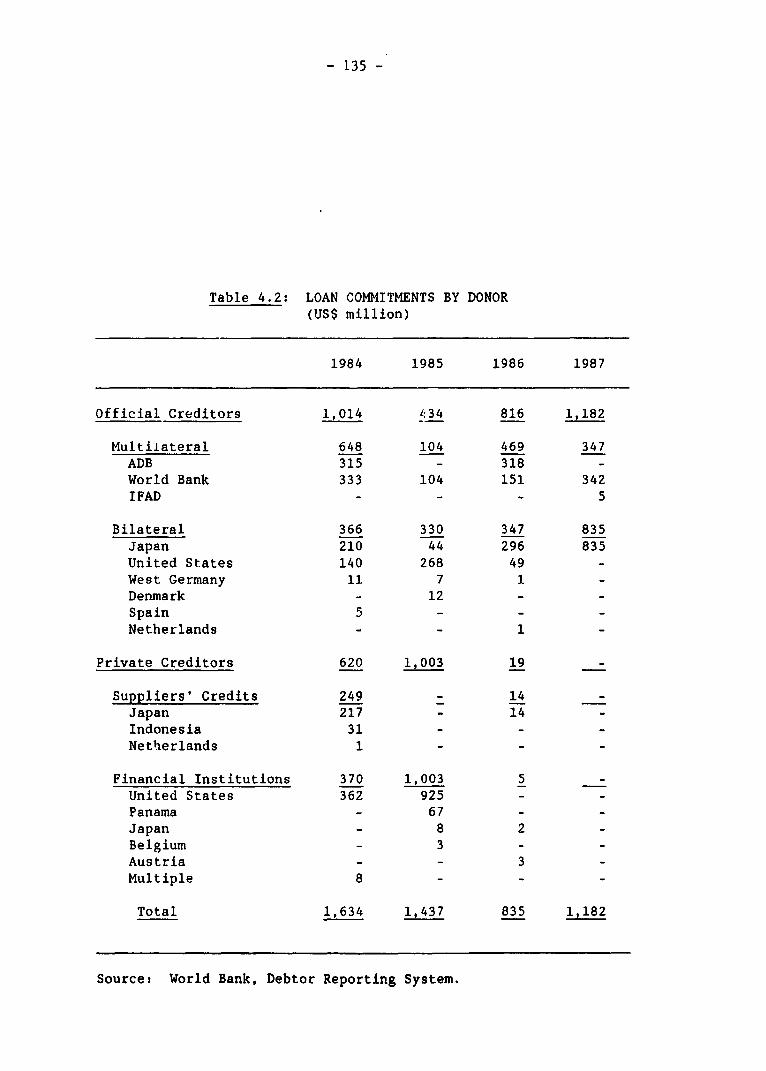
- 135 -
Table 4.2: LOAN COMMITMENTS BY DONOR(US$ million)
1984 1985 1986 1987
Official Creditors 1,014 6.34 816 1,182
Multilateral 648 104 469 347ADB 315 - 318 -World Bank 333 104 151 342IFAD - - - 5
Bilateral 366 330 347 835Japan 210 44 296 835United States 140 268 49 -West Germany 11 7 1 -
Denmark - 12 - -
Spain 5 - - -
Netherlands - - 1 -
Private Creditors 620 1,003 19 -
Suppliers' Credits 249 - 14 -Japan 217 - 14 -Indonesia 31 - - -Netherlands 1 - - -
Financial Institutions 370 1,003 5 -United States 362 925 - -Panama - 67 - -Japan - 8 2 -Belgium - 3 - -
Austria - - 3 -Multiple 8 - - -
Total 1,634 1,437 835 1,182
Source: World Bank, Debtor Reporting System.
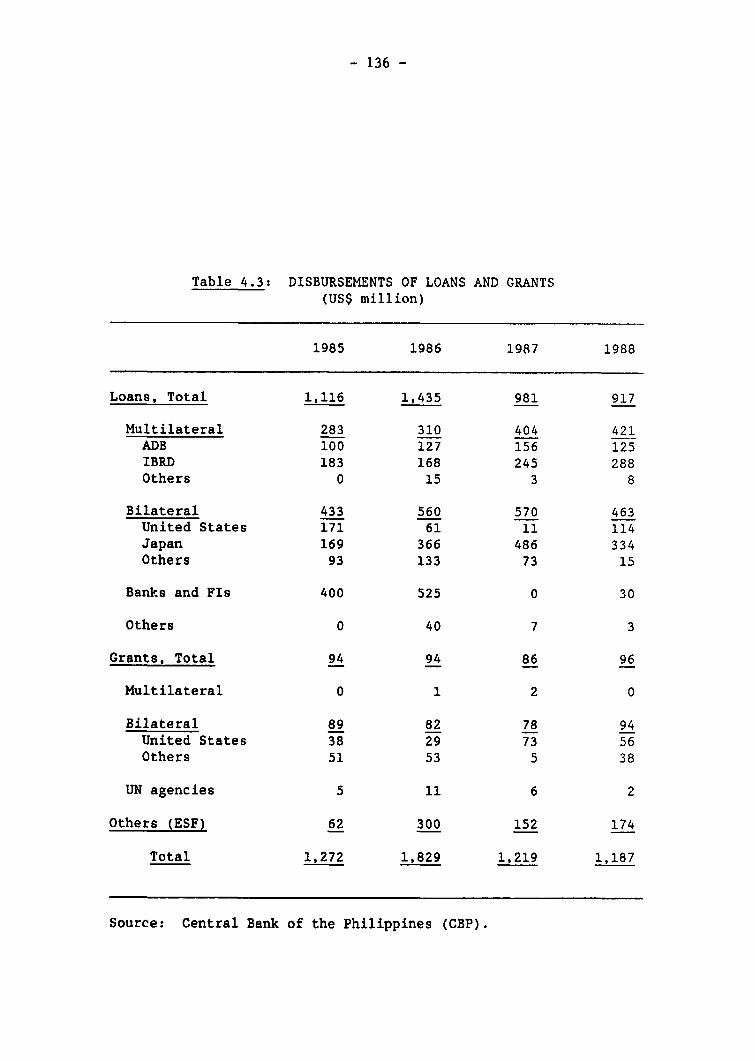
- 136 -
Table 4.3: DISBURSEMENTS OF LOANS AND GRANTS(US$ million)
1985 1986 1987 1988
Loans, Total 1,116 1,435 981 917
Multilateral 283 310 404 421ADB 100 127 156 125IBRD 183 168 245 288Others 0 15 3 8
Bilateral 433 560 570 463United States 171 61 11 114Japan 169 366 486 334Others 93 133 73 15
Banks and FIs 400 525 0 30
Others 0 40 7 3
Grants, Total 94 94 86 96
Multilateral 0 1 2 0
Bilateral 89 82 78 94United States 38 29 73 56Others 51 53 5 38
UN agencies 5 11 6 2
Others (ESF) 62 300 152 174
Total 1,272 1,829 1,219 1,187
Source: Central Bank of the Philippines (CBP).
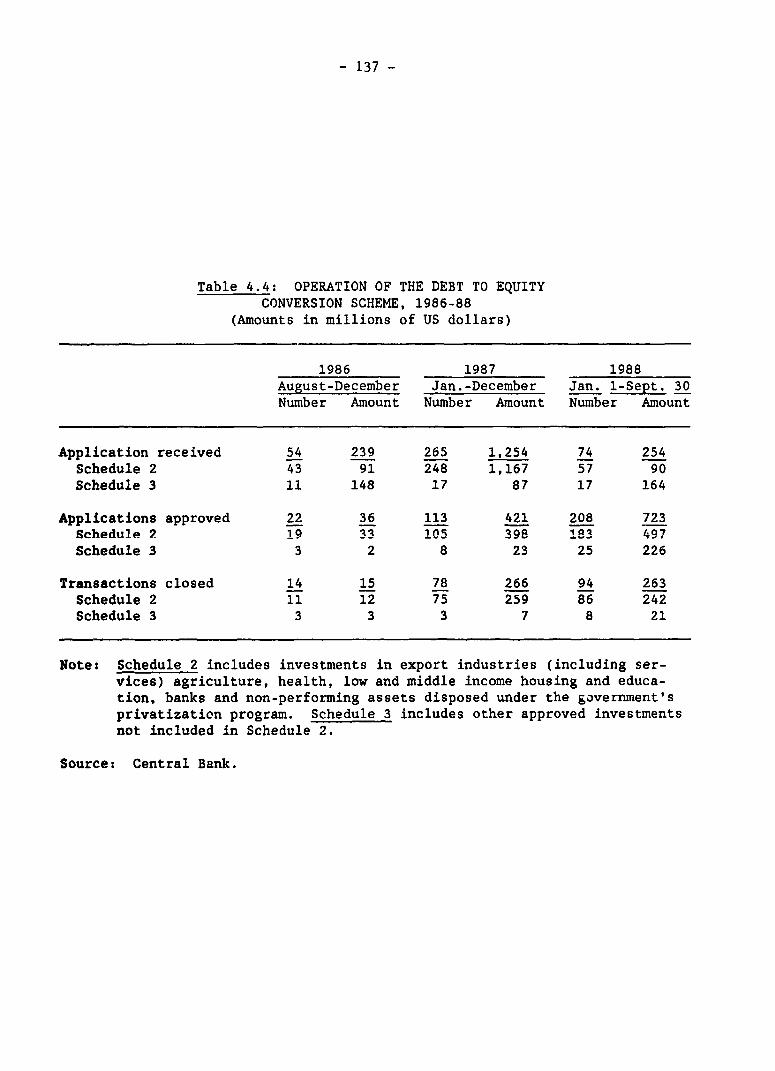
- 137 -
Table 4.4: OPERATION OF THE DEBT TO EQUITYCONVERSION SCHEME, 1986-88
(Amounts in millions of US dollars)
1986 1987 1988August-December Jan.-December Jan. 1-Sept. 30Number Amount Number Amount Number Amount
Application received 54 239 265 1,254 74 254Schedule 2 43 91 248 1,167 57 90Schedule 3 11 148 17 87 17 164
Applications approved 22 36 113 421 208 723Schedule 2 19 33 105 398 183 497Schedule 3 3 2 8 23 25 226
Transactions closed 14 15 78 266 94 263Schedule 2 11 12 75 259 86 242Schedule 3 3 3 3 7 8 21
Notes Schedule 2 includes investments in export industries (including ser-vices) agriculture, health, low and middle income housing and educa-tion, banks and non-performing assets disposed under the government'sprivatization program. Schedule 3 includes other approved investmentsnot included in Schedule 2.
Source: Central Bank.
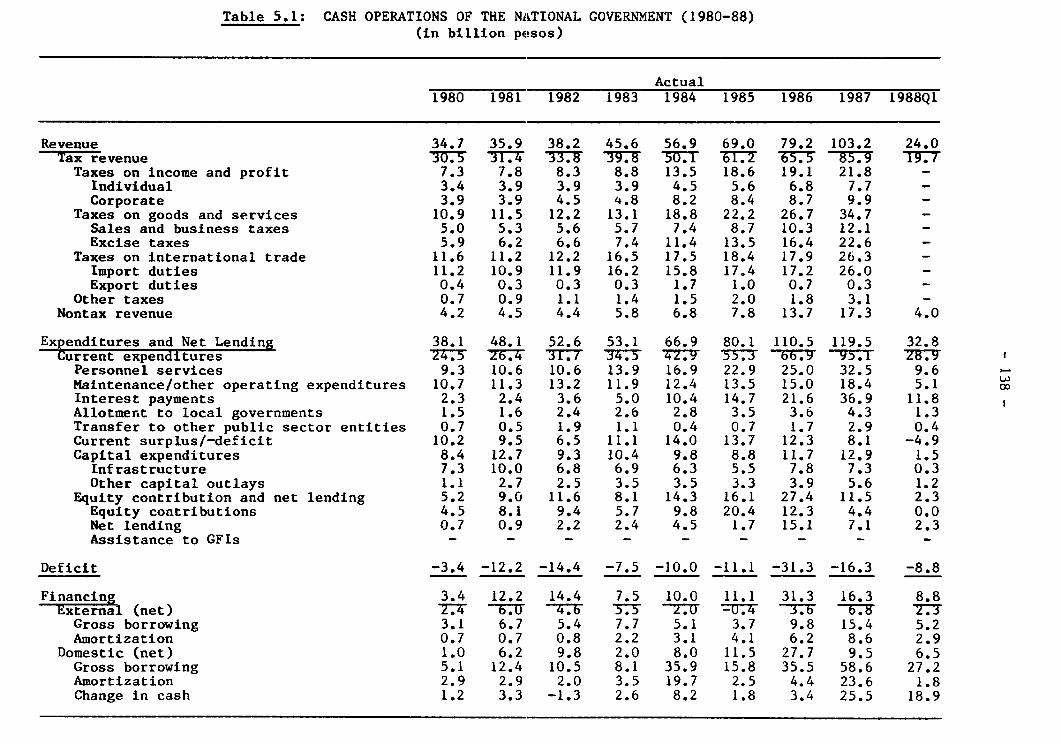
Table 5.1: CASH OPERATIONS OF THE NiATIONAL GOVERNMENT (1980-88)(in billion pesos)
Actual1980 1981 1982 1983 1984 1985 1986 1987 1988Q1
Revenue 34.7 35.9 38.2 45.6 56.9 69.0 79.2 103.2 24.0Tax-revenue -U= UTr4 33W :*g5 31: XT2 z3S 85. TW7
Taxes on income and profit 7.3 7.8 8.3 8.8 13.5 18.6 19.1 21.8 -Individual 3.4 3.9 3.9 3.9 4.5 5.6 6.8 7.7 -Corporate 3.9 3.9 4.5 4.8 8.2 8.4 8.7 9.9 -
Taxes on goods and services 10.9 11.5 12.2 13.1 18.8 22.2 26.7 34.7 -Sales and business taxes 5.0 5.3 5.6 5.7 7.4 8.7 10.3 12.1 -Excise taxes 5.9 6.2 6.6 7.4 11.4 13.5 16.4 22.6 -
Taxes on international trade 11.6 11.2 12.2 16.5 17.5 18.4 17.9 26.3 -Import duties 11.2 10.9 11.9 16.2 15.8 17.4 17.2 26.0 -Export duties 0.4 0.3 0.3 0.3 1.7 1.0 0.7 0.3 -
Other taxes 0.7 0.9 1.1 1.4 1.5 2.0 1.8 3.1 -Nontax revenue 4.2 4.5 4.4 5.8 6.8 7.8 13.7 17.3 4.0
Expenditures and Net Lending 38.1 48.1 52.6 53.1 66.9 80.1 110.5 119.5 32.8Current expenditures 25TTS Z4b. . 4 337T bb-.U 95T =7I
Personnel services 9.3 10.6 10.6 13.9 16.9 22.9 25.0 32.5 9.6Maintenance/other operating expenditures 10.7 11.3 13.2 11.9 12.4 13.5 15.0 18.4 5.1Interest payments 2.3 2.4 3.6 5.0 10.4 14.7 21.6 36.9 11.8Allotment to local governments 1.5 1.6 2.4 2.6 2.8 3.5 3.6 4.3 1.3Transfer to other public sector entities 0.7 0.5 1.9 1.1 0.4 0.7 1.7 2.9 0.4Current surplus/-deficit 10.2 9.5 6.5 11.1 14.0 13.7 12.3 8.1 -4.9Capital expenditures 8.4 12.7 9.3 10.4 9.8 8.8 11.7 12.9 1.5
Infrastructure 7.3 10.0 6.8 6.9 6.3 5.5 7.8 7.3 0.3Other capital outlays 1.1 2.7 2.5 3.5 3.5 3.3 3.9 5.6 1.2
Equity contribution and net lending 5.2 9.0 11.6 8.1 14.3 16.1 27.4 11.5 2.3Equity contributions 4.5 8.1 9.4 5.7 9.8 20.4 12.3 4.4 0.0Net lending 0.7 0.9 2.2 2.4 4.5 1.7 15.1 7.1 2.3Assistance to GFIs - - - - - - - - -
Deficit -3.4 -12.2 -14.4 -7.5 -10.0 -11.1 -31.3 -16.3 -8.8
Financing 3.4 12.2 14.4 7.5 10.0 11.1 31.3 16.3 8.8External (net) 77- T.U 4 3.3 27U6 -U.4 T.b B 7T
Gross borrowing 3.1 6.7 5.4 7.7 5.1 3.7 9.8 15.4 5.2Amortization 0.7 0.7 0.8 2.2 3.1 4.1 6.2 8.6 2.9
Domestic (net) 1.0 6.2 9.8 2.0 8.0 11.5 27.7 9.5 6.5Gross borrowing 5.1 12.4 10.5 8.1 35.9 15.8 35.5 58.6 27.2Amortization 2.9 2.9 2.0 3.5 19.7 2.5 4.4 23.6 1.8Change in cash 1.2 3.3 -1.3 2.6 8.2 1.8 3.4 25.5 18.9
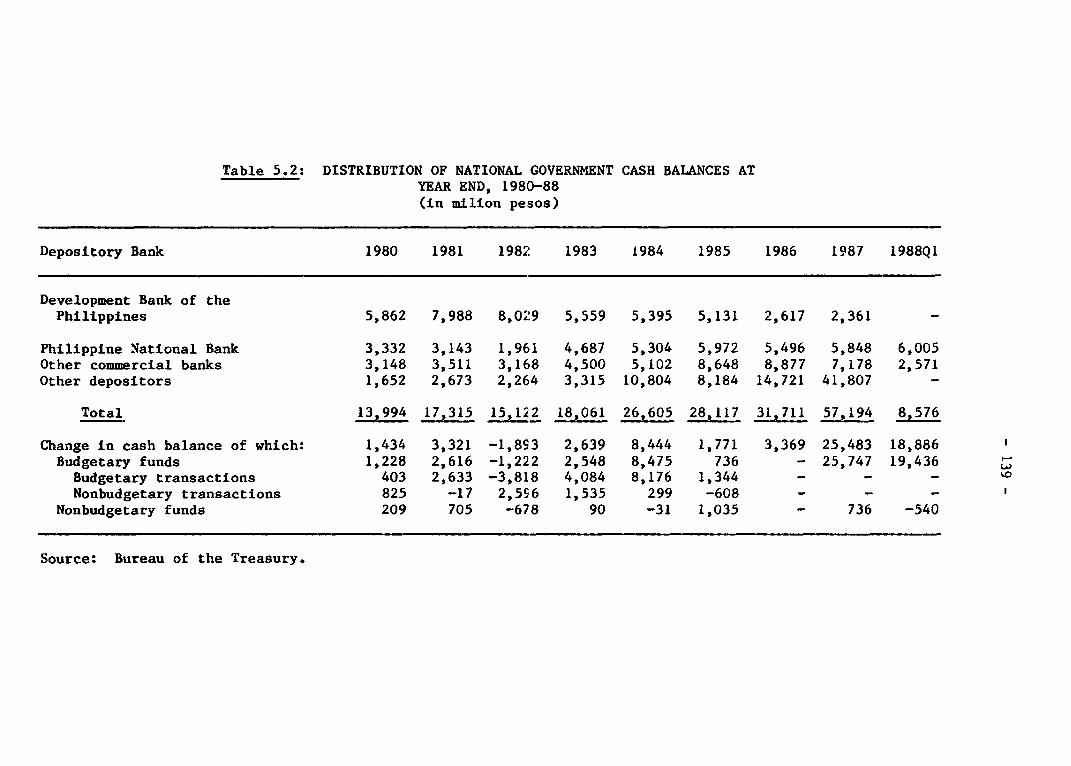
Table 5.2: DISTRIBUTION OF NATIONAL GOVERNMENT CASH BALANCES ATYEAR END, 1980-88(in milion pesos)
Depository Bank 1980 1981 1982 1983 1984 1985 1986 1987 1988Q1
Development Bank of thePhilippines 5,862 7,988 8,02:9 5,559 5,395 5,131 2,617 2,361 -
Philippine National Bank 3,332 3,143 1,961 4,687 5,304 5,972 5,496 5,848 6,005Other commercial banks 3,148 3,511 3,168 4,500 5,102 8,648 8,877 7,178 2,571Other depositors 1,652 2,673 2,264 3,315 10,804 8,184 14,721 41,807 -
Total 13,994 17,315 15,122 18,061 26,605 28,117 31,711 57,194 8,576
Change in cash balance of which: 1,434 3,321 -1,893 2,639 8,444 1,771 3,369 25,483 18,886Budgetary funds 1,228 2,616 -1,222 2,548 8,475 736 - 25,747 19,436
Budgetary transactions 403 2,633 -3,818 4,084 8,176 1,344 - - -Nonbudgetary transactions 825 -17 2,5S6 1,535 299 -608 - - -
Nonbudgetary funds 209 705 -678 90 -31 1,035 - 736 -540
Source: Bureau of the Treasury.
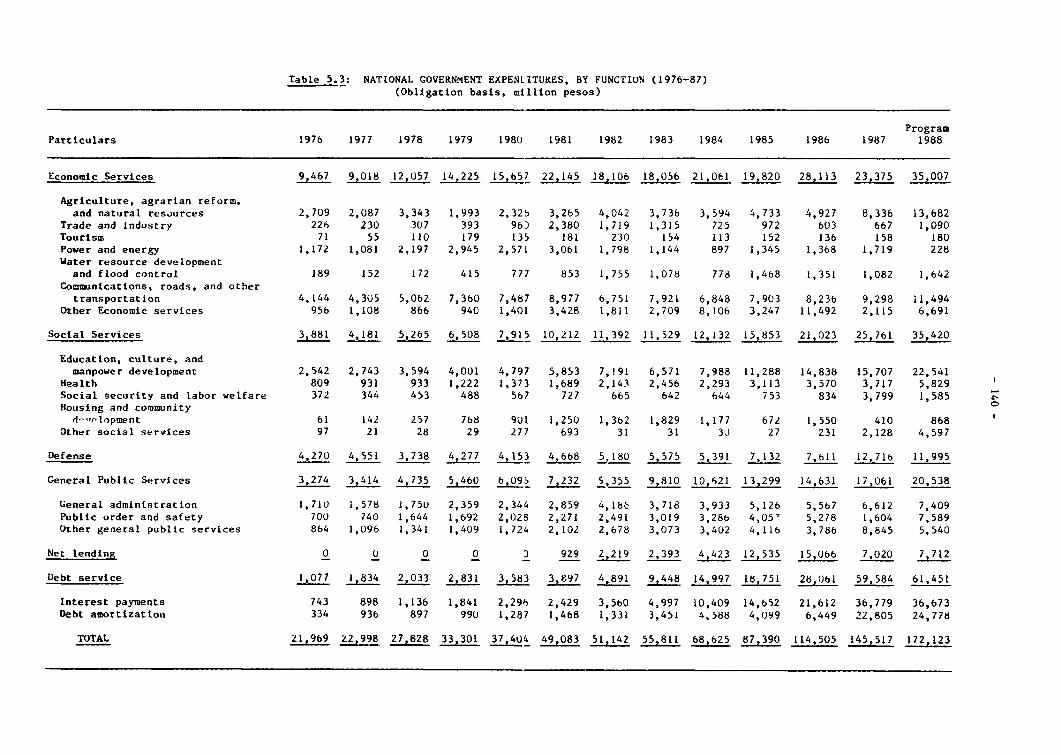
Table 5.3: NATIONAL GOVERNMENT EXPENLITURES, BY FUNCTION (1976-87)(Obligation basis, million pesos)
ProgramParticulars 1976 1977 1978 1979 1980 1981 1982 1983 1984 1985 1986 1987 1988
Economic Services 9,467 9,018 12,057 14,225 15,657 22,145 18,106 18,056 21,061 19,820 28,113 23,375 35,007
Agriculture, agrarian reform,and natural resources 2,709 2,087 3,343 1,993 2,325 3,265 4,042 3,736 3,594 4,733 4,927 8,336 13,682
Trade and industry 226 230 307 393 96) 2,380 1,719 1,315 725 972 603 667 1,090Tourism 71 55 110 179 135 181 230 154 113 152 136 158 180Power and energy 1,172 1,081 2,197 2,945 2,571 3,061 1,798 1,144 897 1,345 1,368 1,719 228Water resource development
and flood control 189 152 172 415 777 853 1,755 1,078 778 1,468 1,351 1,082 1,642Cominications, roads, and other
transportation 4,144 4,305 5,062 7,3b0 7,487 8,977 6,751 7,921 6,848 7,903 8,236 9,298 11,494Other Economic services 956 1,108 866 940 1,401 3,428 1,811 2,709 8,106 3,247 11,492 2,115 6,691
Social Services 3,881 4,181 5,265 6,508 7,915 10,212 11,392 11,529 12,132 15,853 21,023 25,761 35,420
Education, culture, andmanpower development 2,542 2,743 3,594 4,001 4,797 5,853 7,191 6,571 7,988 11,288 14,838 15,707 22,541
Health 809 931 933 1,222 1,373 1,689 2,143 2,456 2,293 3,113 3,570 3,717 5,829Social security and labor welfare 372 344 453 488 567 727 665 642 644 753 834 3,799 1,585Housing and community 0
d--'lopment 61 142 257 7b8 901 1,250 1,362 1,829 1,177 672 1,550 410 868Other social services 97 21 28 29 277 693 31 31 30 27 231 2,128 4,597
Defense 4,270 4,551 3,738 4,277 4,153 4,668 5 180 5,575 5,391 7,132 7,611 12,716 11,995
General Public Services 3,274 3,41 4,735 52460 6,095 7,232 5,355 9,810 10,621 13,299 14,631 17,061 20,538
General administration 1,710 1,578 1,750 2,359 2,344 2,859 4,1b8 3,718 3,933 5,126 5,567 6,612 7,409Public order and safety 700 740 1,644 1,692 2,025 2,Z71 2,491 3,019 3,286 4,05' 5,278 1,604 7,589Other general public services 864 1,096 1,341 1,409 1,724 2,102 2,678 3,073 3,402 4,116 3,786 8,845 5,540
Net lending 0 0 0 3 929 2,219 2,393 4,423 12,535 15,066 7,020 7,712
Debt service 1,077 1,834 2,033 2,831 3,583 3,897 4,891 9,448 14,997 18,751 28,061 59,584 61,451
Interest payments 743 898 1,136 1,841 2,29S 2,429 3,560 4,997 10,409 14,652 21,612 36,779 36,673Debt amortization 334 936 897 990 1,287 1,468 1,331 3,451 4,588 4,099 6,449 22,805 24,778
TOTAL 21,969 22,998 27,828 33,301 37,404 49,083 51,142 55,811 68,625 87,390 114,505 145,517 172,123
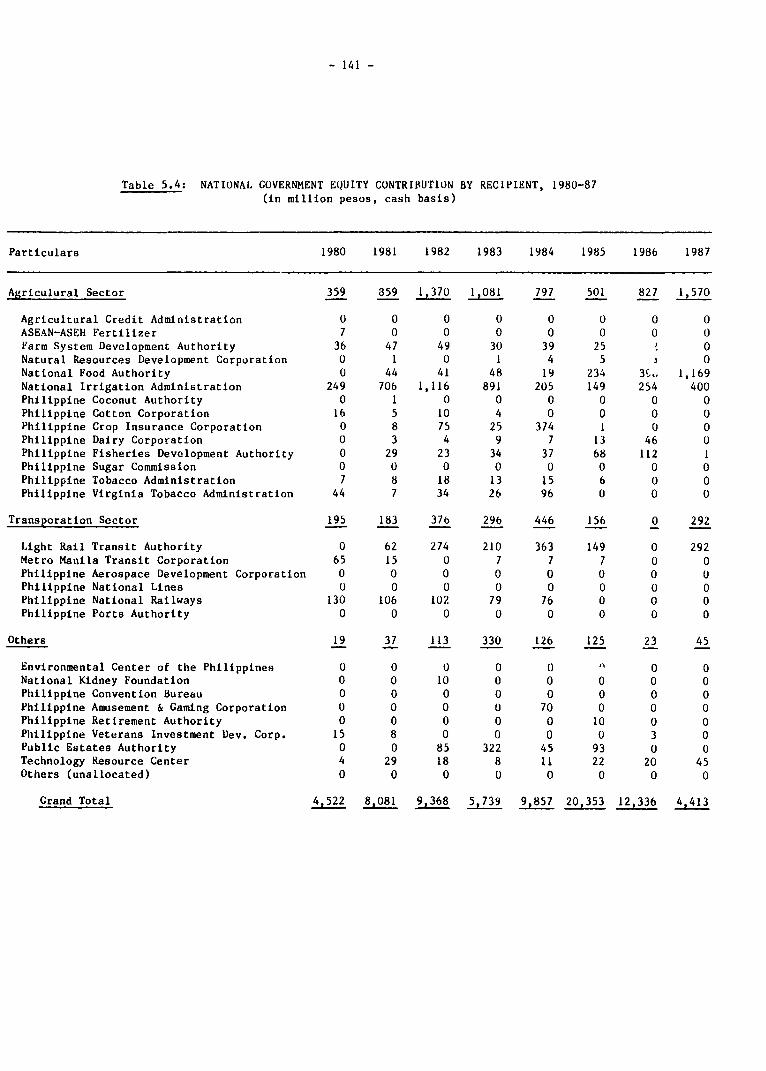
- 141 -
Table 5.4: NATIONAL GOVERNMENT EQUITY CONTRIBUTION BY RECIPIENT, 1980-87(in million pesos, cash basis)
Particulars 1980 1981 1982 1983 1984 1985 1986 1987
Agriculural Sector 359 359 1,370 1,081 797 501 827 1,570
Agricultural Credit Administration 0 0 0 0 0 0 0 0ASEAN-ASEH Fertilizer 7 0 0 0 0 0 0 0Farm System Development Authority 36 47 49 30 39 25 0Natural Resources Development Corporation 0 1 0 1 4 5 0National Food Authority 0 44 41 48 19 234 39,. 1,169National Irrigation Administration 249 706 1,116 891 205 149 254 400Philippine Coconut Authority 0 1 0 0 0 0 0 0Philippine Cotton Corporation 16 5 10 4 0 0 0 0Philippine Crop Insurance Corporation 0 8 75 25 374 1 0 0Philippine Dairy Corporation 0 3 4 9 7 13 46 0Philippine Fisheries Development Authority 0 29 23 34 37 68 112 1Philippine Sugar Commission 0 0 0 0 0 0 0 0Philippine Tobacco Administration 7 8 18 13 15 6 0 0Philippine Virginia Tobacco Administration 44 7 34 26 96 0 0 0
Transporation Sector 195 183 37b 296 446 156 0 292
Light Rail Transit Authority 0 62 274 210 363 149 0 292Metro Manila Transit Corporation 65 15 0 7 7 7 0 0Philippine Aerospace Development Corporation 0 0 0 0 0 0 0 0Philippine National Lines U 0 0 0 0 0 0 0Philippine National Railways 130 106 102 79 76 0 0 0Philippine Ports Authority 0 0 0 0 0 0 0 0
Others 19 37 113 330 126 125 23 45
Environmental Center of the Philippines 0 0 0 0 0 A 0 0National Kidney Foundation 0 0 10 0 0 0 0 0Philippine Convention Bureau 0 0 0 0 0 0 0 0Philippine Amusement & Gaming Corporation 0 0 0 0 70 0 0 0Philippine Retirement Authority 0 0 0 0 0 10 0 0Philippine Veterans Investment Dev. Corp. 15 8 0 0 0 0 3 0Public Estates Authority 0 0 85 322 45 93 0 0Technology Resource Center 4 29 18 8 11 22 20 45Others (unallocated) 0 0 0 0 0 0 0 0
Grand Total 4,522 8,081 9,368 5,739 9,857 20,353 12,336 4,413
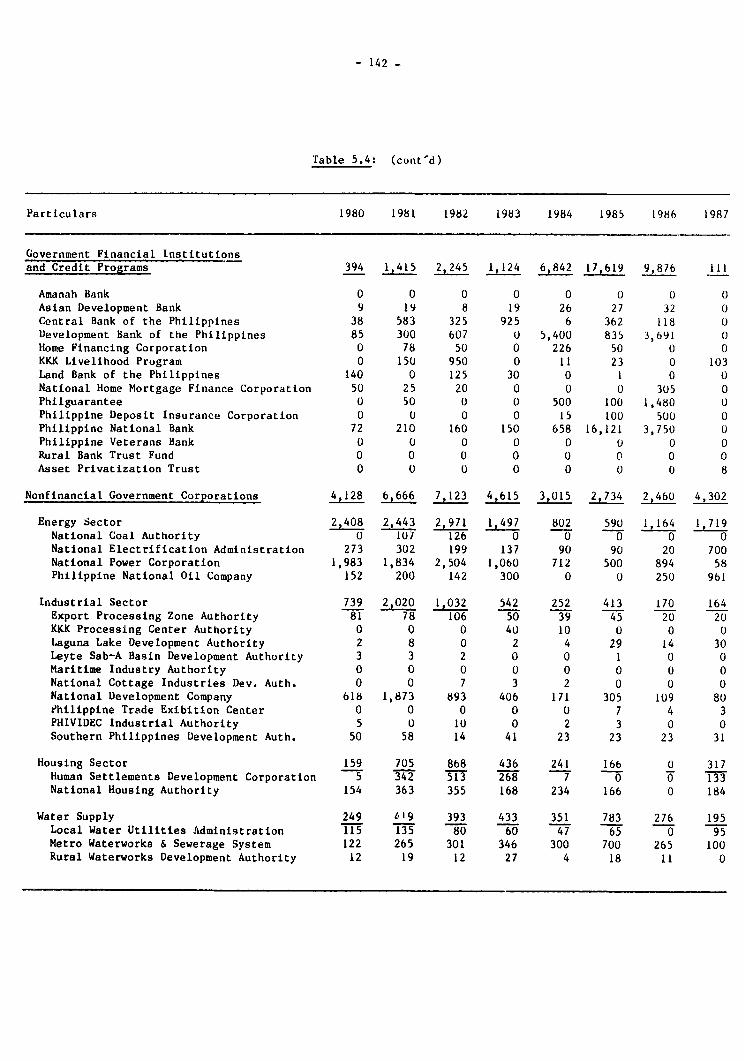
- 142 -
Table 5.4: (cont'd)
Particulars 1980 1981 1982 1983 1984 1985 1986 1987
Government Financial Institutionsand Credit Programs 394 1,415 2,24 1,124 6842 17,619 9,876 111
Amanah Bank 0 0 0 0 0 0 0 0Asian Development Bank 9 19 8 19 26 27 32 0Central Bank of the Philippines 38 583 325 925 6 362 118 0Development Bank of the Philippines 85 300 607 0 5,400 835 3,691 0Home Financing Corporation 0 78 50 0 226 50 0 0KKK Livelihood Program 0 150 950 0 11 23 0 103Land Bank of the Philippines 140 0 125 30 0 1 0 0National Home Mortgage Finance Corporation 50 25 20 0 0 0 305 0Philguarantee 0 50 0 0 500 100 1,480 UPhilippine Deposit Insurance Corporation 0 0 0 0 15 100 500 0Philippine National Bank 72 210 160 150 658 16,121 3,750 0Philippine Veterans Bank 0 0 0 0 0 0 0 0Rural Bank Trust Fund 0 0 0 0 0 0 0 0Asset Privatization Trust 0 0 0 0 0 0 0 8
Nonfinancial Government Corporations 4,128 6,666 7,123 4,615 3,015 2,734 2,460 4,302
Energy Sector 2,408 2,443 2971 1,497 802 590 1,164 1,719National Coal Authority 0 107 126 0 0 0 0 0National Electrification Administration 273 302 199 137 90 90 20 700National Power Corporation 1,983 1,834 2,504 1,060 712 500 894 58Philippine National Oil Company 152 200 142 300 0 0 250 961
Industrial Sector 739 2,020 1,032 542 252 413 170 164Export Processing Zone Authority 81 78 106 50 39 45 20 20KKK Processing Center Authority 0 0 0 40 10 0 0 0Laguna Lake Development Authority 2 8 0 2 4 29 14 30Leyte Sab-A Basin Development Authority 3 3 2 0 0 1 0 0Maritime Industry Authority 0 0 0 0 0 0 0 0National Cottage Industries Dev. Auth. 0 0 7 3 2 0 0 0National Development Company 618 1,873 893 406 171 305 109 80Philippine Trade Exibition Center 0 0 0 0 0 7 4 3PHIVIDEC Industrial Authority 5 0 10 0 2 3 0 0Southern Philippines Development Auth. 50 58 14 41 23 23 23 31
Housing Sector 159 705 868 436 241 166 0 317Human Settlements Development Corporation 5 342 513 268 7 0 0 133National Housing Authority 154 363 355 168 234 166 0 184
Water Supply 249 k19 393 433 351 783 276 195Local Water Utilities Administration 115 135 80 60 47 65 0 95Metro Waterworks & Sewerage System 122 265 301 346 300 700 265 100Rural Waterworks Development Authority 12 19 12 27 4 18 11 0
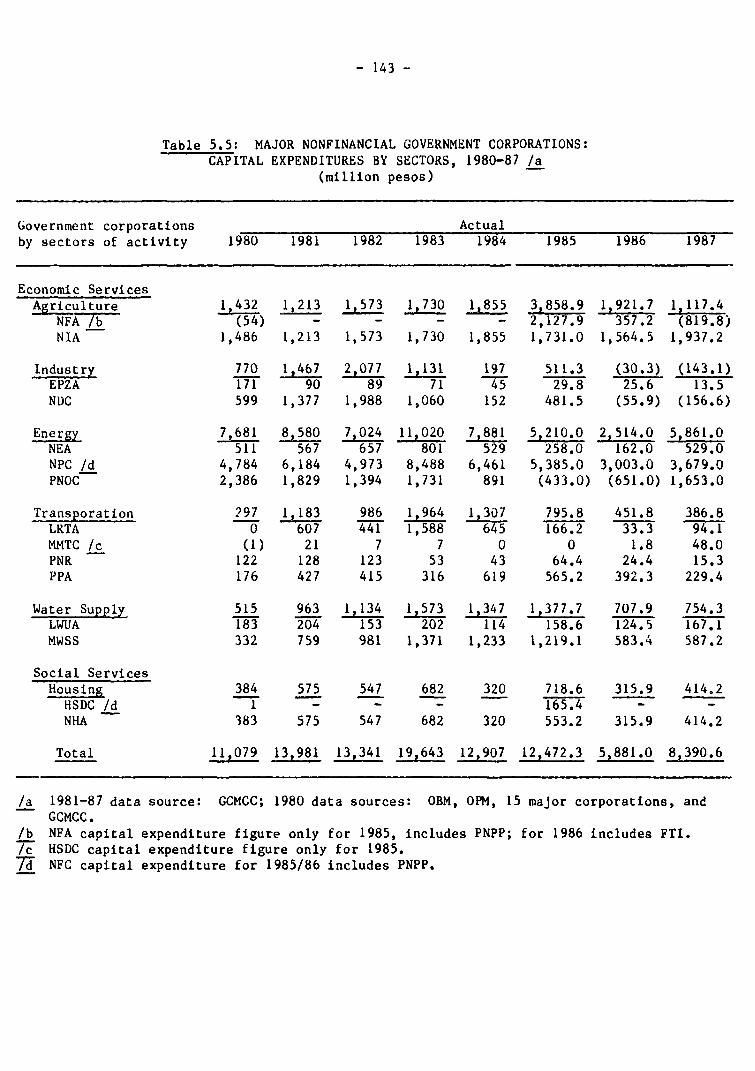
- 143 -
Table 5.5: MAJOR NONFINANCIAL GOVERNMENT CORPORATIONS:CAPITAL EXPENDITURES BY SECTORS, 1980-87 /a
(million pesos)
Government corporations Actualby sectors of activity 1980 1981 1982 1983 1984 1985 1986 1987
Economic ServicesAgriculture S432 1,213 1,573 1,730 1,855 3,858.9 1,921.7 1,117.4
NFA /b (54) - - - - 2,127.9 357.2 (819.8)NIA 1,486 1,213 1,573 1,730 1,855 1,731.0 1,564.5 1,937.2
Industry 770 1j40 2,077 1,131 197 511.3 (30.3) (143.1)EPZA 171 90 89 71 45 29.8 25.6 13.5NDC 599 1,377 1,988 1,060 152 481.5 (55.9) (156.6)
Energy 7,681 8,580 7,024 11,020 7,881 5,210.0 2,514.0 5,861.0NEA 511 567 657 801 529 258.0 162.0 529.0NPC /d 4,784 6,184 4,973 8,488 6,461 5,385.0 3,003.0 3,679.0PNOC 2,386 1,829 1,394 1,731 891 (433.0) (651.0) 1,653.0
Transporation 297 1,183 986 1,964 1,307 795.8 451.8 386.8LRTA 0 607 441 1,588 645 166.2 33.3 94.1MMTC /c (1) 21 7 7 0 0 1.8 48.0PNR 122 128 123 53 43 64.4 24.4 15.3PPA 176 427 415 316 619 565.2 392.3 229.4
Water Supply 515 963 1,134 1,573 1,347 1,377.7 707.9 754.3LWUA 183 204 153 202 114 158.6 124.5 167.11tWSS 332 759 981 1,371 1,233 1,219.1 583.4 587.2
Social ServicesHousing 384 575 547 682 320 718.6 315.9 414.2HSDC /d 1 - - - 165.4 - -NHA 383 575 547 682 320 553.2 315.9 414.2
Total 11,079 13,981 13,341 19,643 12,907 12,472.3 5,881.0 8,390.6
/a 1981-87 data source: GCMCC; 1980 data sources: OBM, OPM, 15 major corporations, andGCMCC.
/b NFA capital expenditure figure only for 1985, includes PNPP; for 1986 includes FTI./c HSDC capital expenditure figure only for 1985.7T NFC capital expenditure for 1985/86 includes PNPP.
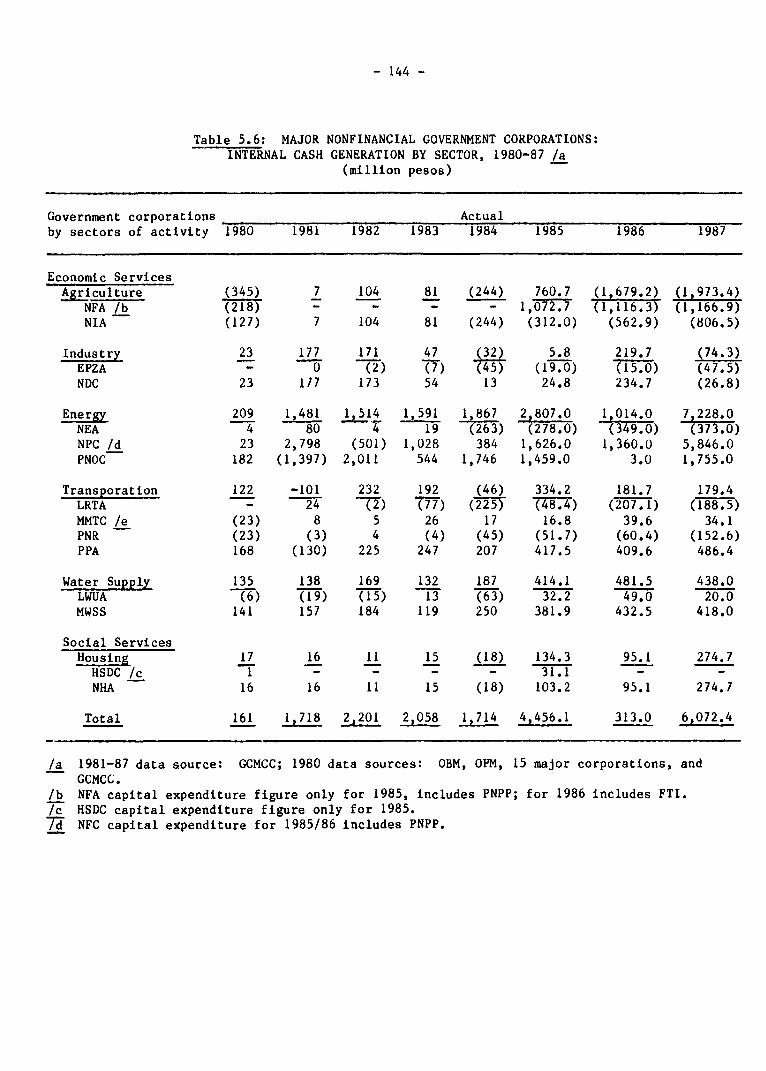
- 144 -
Table 5.6: MAJOR NONFINANCIAL GOVERNMENT CORPORATIONS:INTERNAL CASH GENERATION BY SECTOR, 1980-87 /a
(million pesos)
Government corporations Actualby sectors of activity 1980 1981 1982 1983 1984 1985 1986 1987
Economic ServicesAgriculture (345) 7 104 81 (244) 760.7 (1,679.2) (1,973.4)
NFA /b (218) - _ - - 1,072.7 (1,116.3) (1,166.9)NIA (127) 7 104 81 (244) (312.0) (562.9) (806.5)
Industry 23 177 171 47 (32) 5.8 219.7 (74.3)EPZA - (2) (7) (45) (19.0) (15.0) (47.5)NDC 23 117 173 54 13 24.8 234.7 (26.8)
Energy 209 1,481 I 514 1,591 1,867 2,807.0 1,014.0 7,228.0NEA 4 80 4 19 (263) (278.0) (349.0) (373.0)NPC /d 23 2,798 (501) 1,028 384 1,626.0 1,360.0 5,846.0PNOC 182 (1,397) 2,011 544 1,746 1,459.0 3.0 1,755.0
Transporation 122 -101 232 192 (46) 334.2 181.7 179.4LRTA - 24 (2) (77) (225) (48.4) (207.1) (188.5)MMTC /e (23) 8 5 26 17 16.8 39.6 34.1PNR (23) (3) 4 (4) (45) (51.7) (60.4) (152.6)PPA 168 (130) 225 247 207 417.5 409.6 486.4
Water Supply 135 138 169 132 187 414.1 481.5 438.0LWUA (6) (19) (15) 13 (63) 32.2 49.0 20.0MWSS 141 157 184 119 250 381.9 432.5 418.0
Social ServicesHousing 17 16 11 15 (18) 134.3 95.1 274.7HSDC /c 1 - - - - 31.1 - -NHA 16 16 11 15 (18) 103.2 95.1 274.7
Total 161 1,718 2,201 2,058 1,714 4,456.1 313.0 6,072.4
/a 1981-87 data source: GCMCC; 1980 data sources: OBM, OPM, 15 major corporations, andGCMCC.
/b NFA capital expenditure figure only for 1985, includes PNPP; for 1986 includes FTI./c HSDC capital expenditure figure only for 1985.7W NFC capital expenditure for 1985/86 includes PNPP.
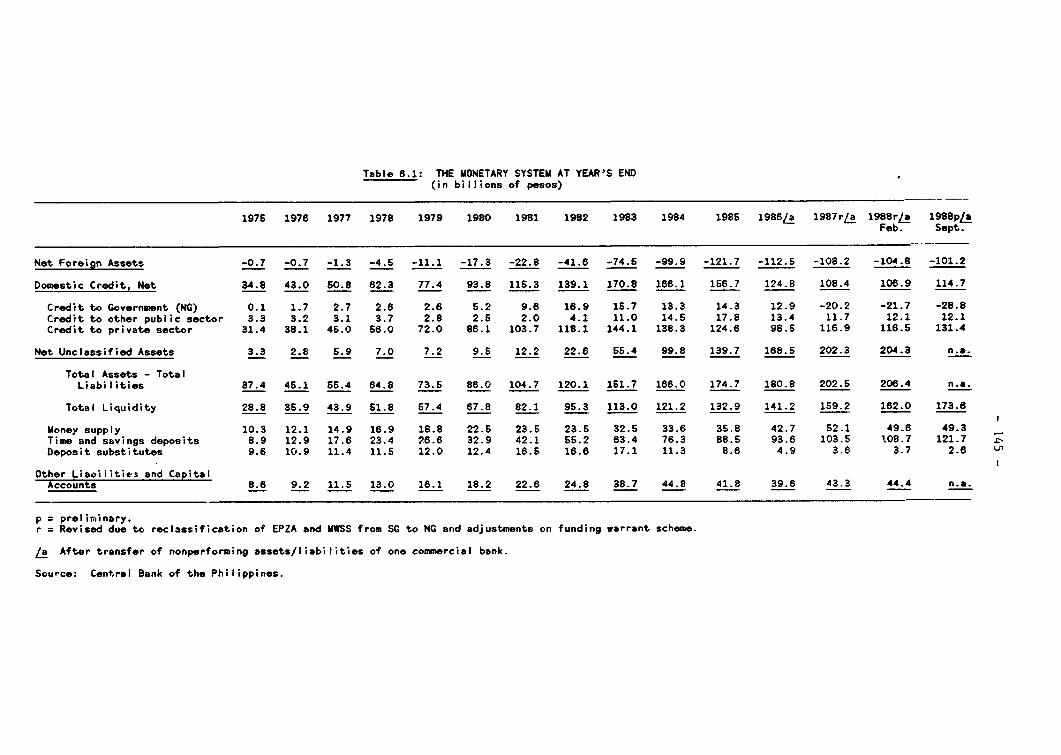
Table 6.1: THE MONETARY SYSTEM AT YEAR'S END(in billions of pesos)
1975 1976 1977 1978 1979 1980 1981 1982 1983 1984 1985 1986/a 1987r/a 1988r! 1988pLFeb. Sept.
Net Foreign Assets -0.7 -0.7 -1.3 -4.5 -11.1 -17.3 -22.8 -41.6 -74.5 -99.9 -121.7 -112.5 -108.2 -104.8 -101.2
Domestic Credit, Net 34.8 43.0 50.8 62.3 77.4 93.8 115.3 139.1 170.8 166.1 156.7 124.8 108.4 106.9 114.7
Credit to Government (NG) 0.1 1.7 2.7 2.6 2.6 5.2 9.6 16.9 15.7 13.3 14.3 12.9 -20.2 -21.7 -28.8Credit to other public sector 3.3 3.2 3.1 3.7 2.8 2.5 2.0 4.1 11.0 14.5 17.8 13.4 11.7 12.1 12.1Credit to private sector 31.4 38.1 45.0 56.0 72.0 86.1 103.7 118.1 144.1 138.3 124.6 98.5 116.9 116.5 131.4
Net Unclassified Assets 3.3 2.8 5.9 7.0 7.2 9.5 12.2 22.6 56.4 99.8 139.7 168.5 202.3 204.3 n.a.
Total Assets - TotalLiabilities 37.4 45.1 55.4 64.8 73.5 86.0 104.7 120.1 151.7 166.0 174.7 180.8 202.5 206.4 n.a.
Total Liquidity 28.8 35.9 43.9 51.8 57.4 67.8 82.1 95.3 113.0 121.2 132.9 141.2 159.2 162.0 173.6
Money supply 10.3 12.1 14.9 16.9 18.8 22.5 23.5 23.5 32.5 33.6 35.8 42.7 52.1 49.6 49.3Time and savings deposits 8.9 12.9 17.6 23.4 26.6 32.9 42.1 55.2 63.4 76.3 88.5 93.6 103.5 108.7 121.7Deposit substitutes 9.6 10.9 11.4 11.5 12.0 12.4 16.5 16.6 17.1 11.3 8.6 4.9 3.6 3.7 2.6
Other Liaoilities and CapitalAccounts 8.6 9.2 11.5 13.0 16.1 18.2 22.6 24.8 38.7 44.8 41.8 39.6 43.3 44.4 n.a.
p = preliminary.r = Revised due to reclassification of EPZA and MWSS from SG to NG and adjustments on funding warrant scheme.
/ After transfer of nonperforming assets/liabilities of one commercial bank.
Source: Central Bank of the Philippines.
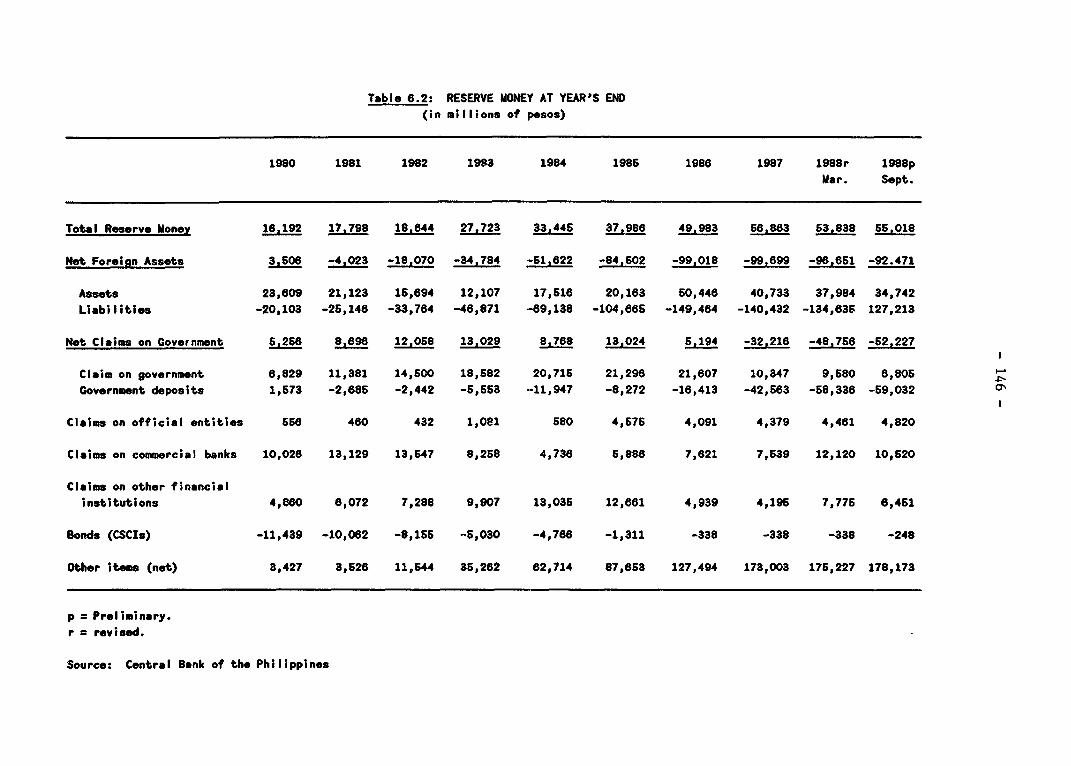
Table 6.2: RESERVE MONEY AT YEAR'S END(in millions of pesos)
1980 1981 1982 1983 1984 1985 1986 1987 1988r 1988p
Mar. Sept.
Total Reserve Money 16,192 17.798 18.844 27.723 33.445 37.986 49.983 s6,s83 63,838 55,018
Net Foreign Assets 3.506 -4,023 -18.070 -34.784 -51.822 -84,502 -99,018 -99,699 -9s,651 -92.471
Assets 23,809 21,123 15,694 12,107 17,516 20,163 50,446 40,733 37,984 34,742Liabilities -20,103 -25,146 -33,764 -48,871 -69,138 -104,865 -149,464 -140,432 -134,635 127,213
Net Claims on Government 5.256 8s.98 12.058 13,029 8,768 13,024 5.194 -32,216 -48.756 -52.227
Claim on government 6,829 11,381 14,500 18,582 20,715 21,296 21,807 10,347 9,580 6,805Government deposits 1,573 -2,685 -2,442 -5,553 -11,947 -8,272 -16,413 -42,563 -58,338 -59,032 a%
Claims on official entities 558 480 432 1,081 580 4,575 4,091 4,379 4,461 4,820
Claims on commercial banks 10,028 13,129 13,547 8,258 4,738 6,888 7,821 7,539 12,120 10,520
Claims on other financialinstitutions 4,860 8,072 7,288 9,907 13,035 12,661 4,939 4,195 7,775 6,451
Bonds (CSCIs) -11,439 -10,082 -8,155 -5,030 -4,788 -1,311 -338 -338 -338 -248
Other Items (net) 3,427 3,526 11,544 35,262 62,714 87,853 127,494 173,003 175,227 178,173
p = Preliminary.
r = revised.
Source: Central Bank of the Philippines
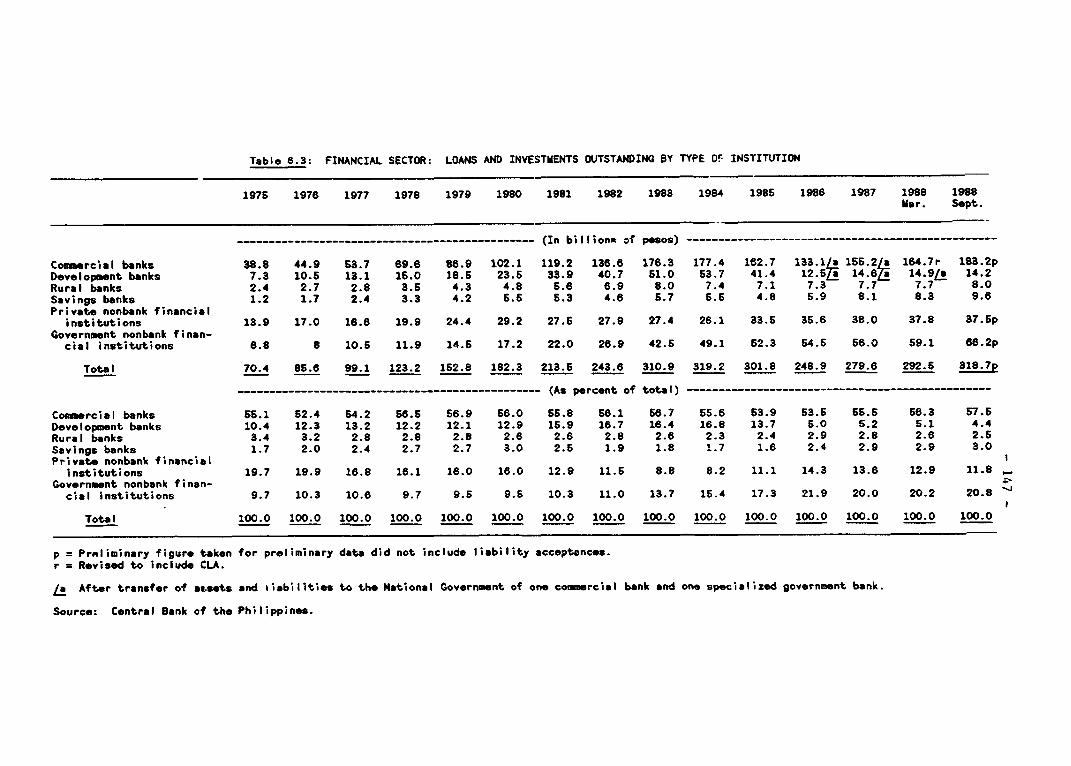
Table 6.3: FINANCIAL SECTOR: LOANS AND INVESTMENTS OUTSTANDING BY TYPE Or- INSTITUTION
1975 1976 1977 1978 1979 1980 1981 1982 1983 1984 1985 1988 1987 1988 1988Mar. Sept.
----------------------------------------------- (In billionn of pesos) --------------------------------------------…-…
Commerceal banks 38.8 44.9 53.7 69.6 86.9 102.1 119.2 136.6 176.3 177.4 162.7 133.1/a 155.2/a 164.7r 183.2pDevelopment banks 7.3 10.5 13.1 16.0 18.6 23.5 33.9 40.7 51.0 53.7 41.4 12.5/ 14.6a 14.9/a 14.2Rural banks 2.4 2.7 2.8 3.5 4.3 4.8 5.6 6.9 8.0 7.4 7.1 7.3 7.7 7.7 8.0Savings banks 1.2 1.7 2.4 3.3 4.2 5.5 5.3 4.6 6.7 5.5 4.8 5.9 8.1 8.3 9.6Private nonbank financial
institutions 13.9 17.0 16.6 19.9 24.4 29.2 27.6 27.9 27.4 26.1 33.5 36.6 38.0 37.8 37.6pGovernment nonbank finan-
cial institutions 6.8 8 10.5 11.9 14.6 17.2 22.0 26.9 42.6 49.1 62.3 64.5 56.0 59.1 66.2p
Total 70.4 86.6 99.1 123.2 162.8 182.3 213.6 243.6 310.9 319.2 301.8 248.9 279.6 292.6 318.7p
------------------------------------------------ (As percent of total) ---------------------------------
Commercial banks 65.1 52.4 64.2 56.5 56.9 56.0 55.8 66.1 66.7 55.6 63.9 53.5 SS.5 56.3 57.5
Development banks 10.4 12.3 13.2 12.2 12.1 12.9 15.9 16.7 16.4 16.8 13.7 5.0 5.2 5.1 4.4Rural banks 3.4 3.2 2.8 2.8 2.8 2.6 2.6 2.8 2.6 2.3 2.4 2.9 2.8 2.6 2.5Savings banks 1.7 2.0 2.4 2.7 2.7 3.0 2.5 1.9 1.8 1.7 1.6 2.4 2.9 2.9 3.0Private nonbank financial
institutions 19.7 19.9 16.8 16.1 16.0 16.0 12.9 11.5 8.8 8.2 11.1 14.3 13.6 12.9 11.8 Government nonbank finan-cial institutions 9.7 10.3 10.6 9.7 9.5 9.6 10.3 11.0 13.7 15.4 17.3 21.9 20.0 20.2 20.8
Total 100.0 100.0 100.0 100.0 100.0 100.0 100.0 100.0 100.0 100.0 100.0 100.0 100.0 100.0 100.0
p = Preliminary figure taken for preliminary data did not include liability acceptances.r = Revised to include CLA.
/a After transfer of aesets and kiabilities to the National Government of one commercial bank and one specialized government bank.
Source: Central Bank of the Philippines.
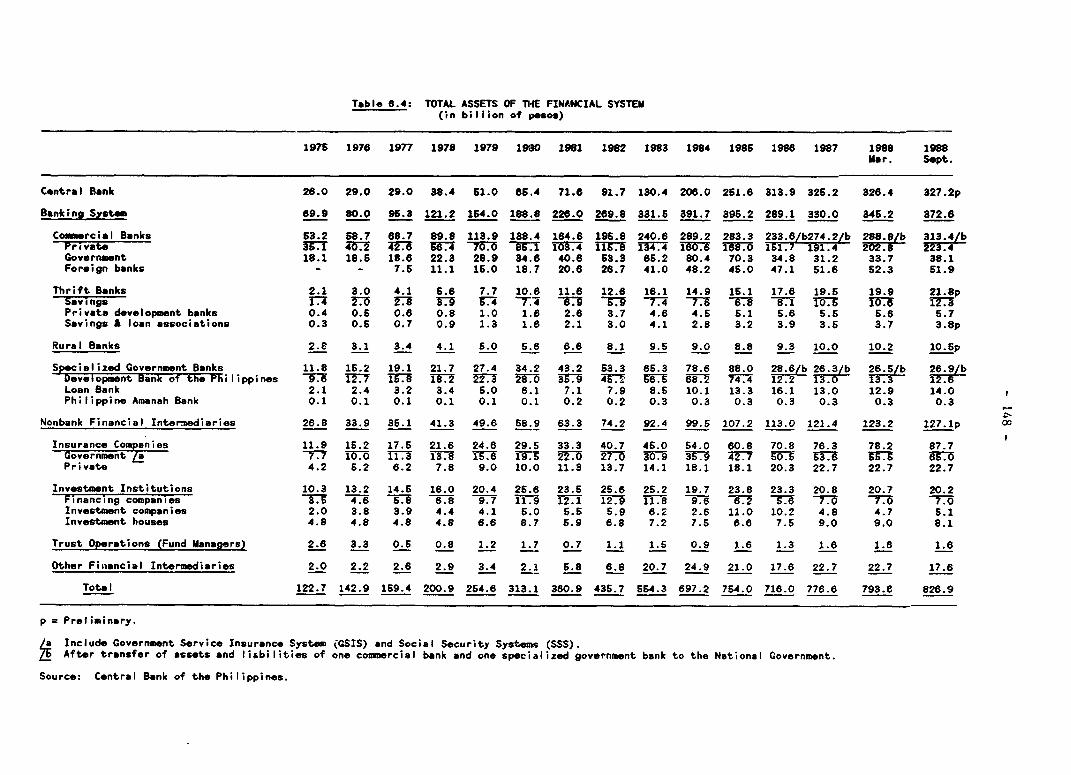
Table 6.4: TOTAL ASSETS OF T14E FINANCIAL SYSTEM(in billion of pesos)
1975 1976 1977 1978 1979 1980 1981 1982 1983 1984 1985 1986 1987 1988 1989Mar. sept.
Central Bank 26.0 29.0 29.0 38.4 51.0 65.4 71.6 91.7 130.4 206.0 251.6 313.9 325.2 326.4 327.2pBanking System 69.9 80.0 95.3 121.2 154.0 188.8 226.0 269.8 331.6 391.7 396.2 289.1 330.0 346.2 372.6Comaercial Banks 53.2 58.7 68.7 89.8 113.9 138.4 164.6 195.8 240.6 289.2 283.3 233:b2§74 b 288.8/b 3.JbPrivote 3f 40.2 W4 F4 =6 -5.1 103.4 fl 134.4 160.6 168.0 151.7 19. f20f2.8 223.4Governm_nt 18.1 18.5 18.6 22.3 28.9 34.6 40.6 63.3 65.2 80.4 70.3 34.8 31.2 33.7 38.1Foreign banks - - 7.6 11.1 16.0 18.7 20.6 26.7 41.0 48.2 45.0 47.1 61.6 52.3 61.9Thrift Banks 2.1 3.0 4.1 5.6 7.7 10.6 11.6 12.6 16.1 14.9 15.1 17.6 19.5 19.9 2 1.8pSavings TiT Y-. 3 7 6.9 1 -TT - -" -MT 7.8 6.8 81 1.TT 1I0 12TPrivata development banks 0.4 0.5 0.6 0.8 1.0 1.6 2.6 3.7 4.6 4.6 5.1 5.6 5.5 5.6 5.7Savings & loan associations 0.3 0.5 0.7 0.9 1.3 1.6 2.1 3.0 4.1 2.8 3.2 3.9 3.6 3.7 3.8pRural Banks 2.8 3.1 3.4 4.1 5.0 5.6 6.6 8.1 9.5 9.0 8.8 9.3 10.0 10.2 10.SpSoecialized Government Banks 11.8 15.2 19.1 21.7 27.4 34.2 43.2 63.3 65.3 78.6 88.0 28.6/b 26.3/b 26.5/b 26.9/bDevelopment Bank of the Philippines 9.6 12.7 15.8 18.2 22.3 WIT0 13 45.2 56.5 IT82 74.4 12.2 13.0 133 12Loan Bank 2.1 2.4 3.2 3.4 5.0 6.1 7.1 7.9 8.5 10.1 13.3 16.1 13.0 12.9 14.0 1Philippine Amanah Bank 0.1 0.1 0.1 0.1 0.1 0.1 0.2 0.2 0.3 0.3 0.3 0.3 0.3 0.3 0.3
Nonbank Financial Inter-sediaries 26.8 33.9 35.1 41.3 49.6 58.9 63.3 74.2 92.4 99.5 107.2 113.0 121.4 123.2 127.1p ooInsurance Comeanies 11.9 15.2 17.5 21.6 24.6 29.5 33.3 40.7 45.0 54.0 60.8 70.8 76.3 78.2 87.7Government to . iU 1.37 -1T.8 -1" Mg5 -22. "T 30.9 Y". -42.7 50. 563.6 F§7C -sil_Private 4.2 5.2 6.2 7.8 9.0 10.0 11.3 13.7 14.1 18.1 18.1 20.3 22.7 22.7 22.7Investment Institutions 10.3 13.2 14.5 18.0 20.4 25.6 23.5 25.6 25.2 19.7 23.8 23.3 20.8 20.7 20.2Financing companies 3.5 4.6 5.8 6.8 9.7 11.9 12.1 12.9 11.8 9.6 --.2 5.6 7.0 -7-0 7.0Investment companies 2.0 3.8 3.9 4.4 4.1 5.0 5.5 5.9 6.2 2.6 11.0 10.2 4.8 4.7 5.1Investment houses 4.8 4.8 4.8 4.8 6.6 8.7 6.9 6.8 7.2 7.5 6.6 7.5 9.0 9.0 8.1Trust Operations (Fund Managers) 2.6 3.3 0.5 0.8 1.2 1.7 0.7 1.1 1.5 0.9 1.6 1.3 1.6 1.6 1.6Other Financial Intermediaries 2.0 2.2 2.6 2.9 3.4 2.1 5.8 6.8 20.7 24.9 21.0 17.6 22.7 22.7 17.6
Total 122.7 142.9 159.4 200.9 254.6 313.1 380.9 435.7 554.3 697.2 754.0 716.0 776.6 793.6 826.9
p = Preliminary.
/ Include Government Service Insurance System (GSIS) and Social Security Systems (SSS).After transfer of assets and liabilities of one commercial bank and one specialized government bank to the National Government.Source: Central Bank of the Philippines.
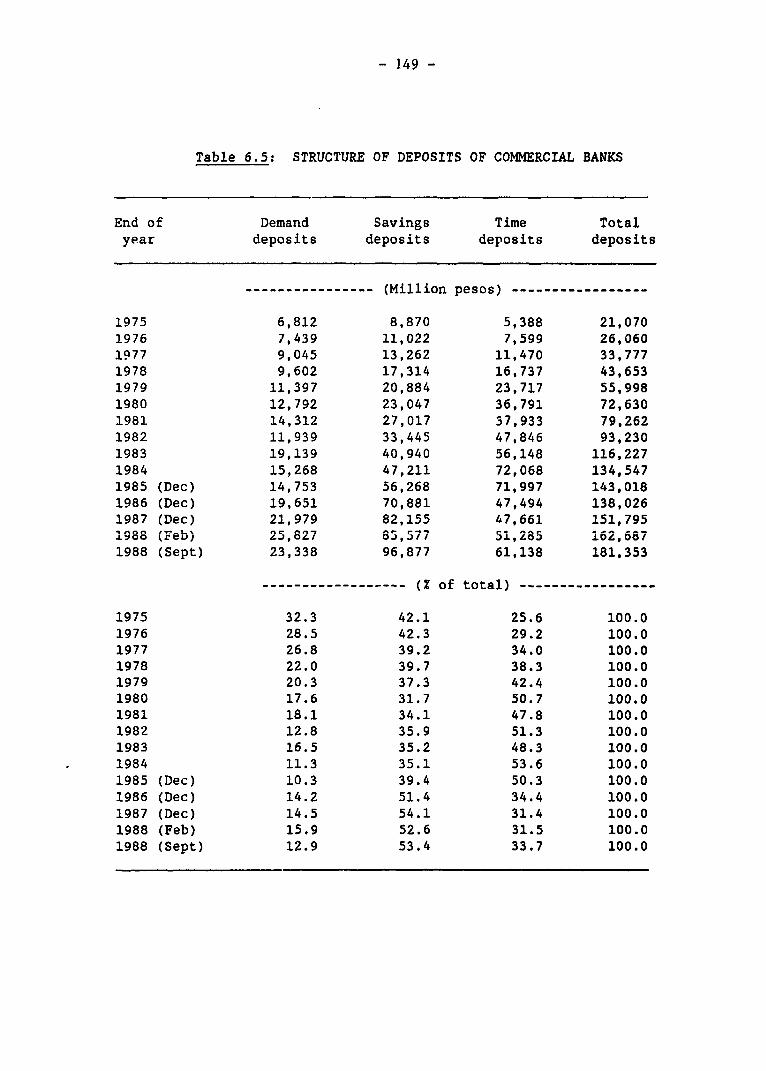
- 149 -
Table 6.5: STRUCTURE OF DEPOSITS OF COMMERCIAL BANKS
End of Demand Savings Time Totalyear deposits deposits deposits deposits
…--___---------- (Million pesos) -----------------
1975 6,812 8,870 5,388 21,0701976 7,439 11,022 7,599 26,0601977 9,045 13,262 11,470 33,7771978 9,602 17,314 16,737 43,6531979 11,397 20,884 23,717 55,9981980 12,792 23,047 36,791 72,6301981 14,312 27,017 37,933 79,2621982 11,939 33,445 47,846 93,2301983 19,139 40,940 56,148 116,2271984 15,268 47,211 72,068 134,5471985 (Dec) 14,753 56,268 71,997 143,0181986 (Dec) 19,651 70,881 47,494 138,0261987 (Dec) 21,979 82,155 47,661 151,7951988 (Feb) 25,827 85,577 51,285 162,6871988 (Sept) 23,338 96,877 61,138 181,353
-_________________ (Z of total) -----------------
1975 32.3 42.1 25.6 100.01976 28.5 42.3 29.2 100.01977 26.8 39.2 34.0 100.01978 22.0 39.7 38.3 100.01979 20.3 37.3 42.4 100.01980 17.6 31.7 50.7 100.01981 18.1 34.1 47.8 100.01982 12.8 35.9 51.3 100.01983 16.5 35.2 48.3 100.01984 11.3 35.1 53.6 100.01985 (Dec) 10.3 39.4 50.3 100.01986 (Dec) 14.2 51.4 34.4 100.01987 (Dec) 14.5 54.1 31.4 100.01988 (Feb) 15.9 52.6 31.5 100.01988 (Sept) 12.9 53.4 33.7 100.0
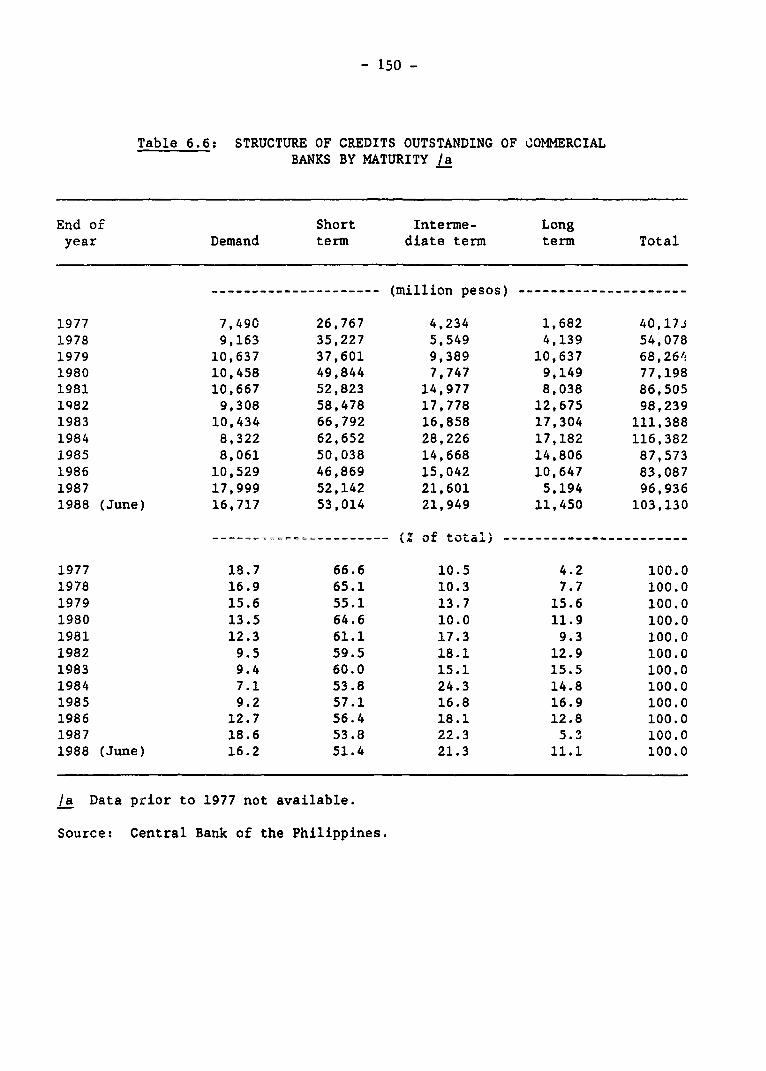
- 150 -
Table 6.6: STRUCTURE OF CREDITS OUTSTANDING OF COMMERCIALBANKS BY MATURITY /a
End of Short Interme- Longyear Demand term diate term term Total
--------------------- (million pesos) ---------------------
1977 7,490 26,767 4,234 1,682 40,17i1978 9,163 35,227 5,549 4,139 54,0781979 10,637 37,601 9,389 10,637 68,2641980 10,458 49,844 7,747 9,149 77,1981981 10,667 52,823 14,977 8,038 86,5051982 9,308 58,478 17,778 12,675 98,2391983 10,434 66,792 16,858 17,304 111,3881984 8,322 62,652 28,226 17,182 116,3821985 8,061 50,038 14,668 14,806 87,5731986 10,529 46,869 15,042 10,647 83,0871987 17,999 52,142 21,601 5,194 96,9361988 (June) 16,717 53,014 21,949 11,450 103,130
~~~--------- (2 of total;. -----------------------
1977 18.7 66.6 10.5 4.2 100.01978 16.9 65.1 10.3 7.7 100.01979 15.6 55.1 13.7 15.6 100.01980 13.5 64.6 10.0 11.9 100.01981 12.3 61.1 17.3 9.3 100.01982 9.5 59.5 18.1 12.9 100.01983 9.4 60.0 15.1 15.5 100.01984 7.1 53.8 24.3 14.8 100.01985 9.2 57.1 16.8 16.9 100.01986 12.7 56.4 18.1 12.8 100.01987 18.6 53.8 22.3 5.3 100.01988 (June) 16.2 51.4 21.3 11.1 100.0
/a Data prior to 1977 not available.
Source: Central Bank of the Philippines.
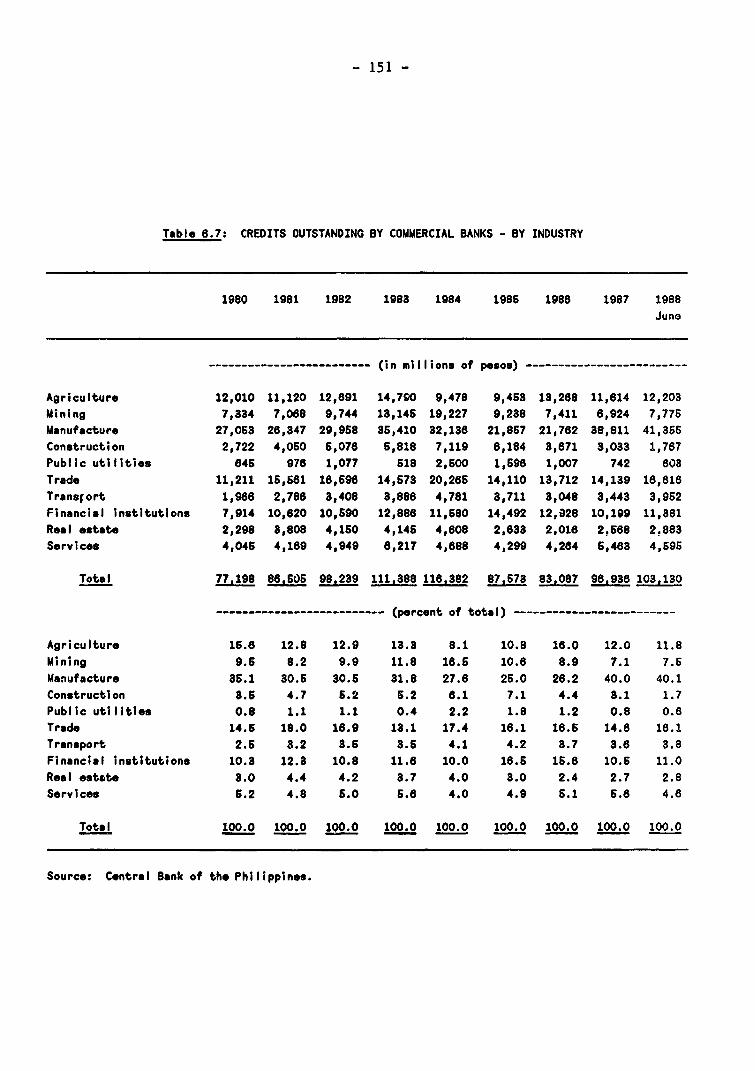
- 151 -
Table 8.7: CREDITS OUTSTANDING BY COMMERCIAL BANKS - BY INDUSTRY
1980 1981 1982 1983 1984 1985 1986 1987 1988
Juno
…(----------------------- (in millions of pesos) -----------…-------------
Agriculture 12,010 11,120 12,891 14,790 9,478 9,453 18,268 11,814 12,203
Mining 7,334 7,068 9,744 13,145 19,227 9,238 7,411 6,924 7,776
Manufacture 27,053 28,347 29,958 35,410 32,138 21,857 21,762 38,811 41,366
Construction 2,722 4,050 5,076 5,818 7,119 6,184 3,671 3,033 1,767
Public utilities 645 976 1,077 518 2,500 1,596 1,007 742 803
Trade 11,211 15,561 16,598 14,673 20,266 14,110 13,712 14,139 16,616
Transrort 1,966 2,786 3,408 3,888 4,781 3,711 3,048 3,443 3,962
Financial institutions 7,914 10,620 10,690 12,888 11,580 14,492 12,928 10,199 11,381
Real estate 2,298 8,808 4,150 4,145 4,608 2,633 2,016 2.668 2,883
Services 4,045 4,169 4,949 8,217 4,688 4,299 4,284 5,483 4,596
Total 77.198 86.505 98.239 111,388 116.382 87.573 83.087 98,936 103,130
-------------------------- (percent of total) -------------------------
Agriculture 16.6 12.8 12.9 13.3 8.1 10.8 16.0 12.0 11.8
Mining 9.5 8.2 9.9 11.8 18.5 10.8 8.9 7.1 7.5
Manufacture 35.1 30.5 30.6 31.8 27.8 25.0 26.2 40.0 40.1
Construction 3.6 4.7 6.2 6.2 8.1 7.1 4.4 3.1 1.7
Public utilities 0.8 1.1 1.1 0.4 2.2 1.8 1.2 0.8 0.8
Trade 14.5 18.0 18.9 13.1 17.4 18.1 18.6 14.6 16.1Transport 2.5 3.2 3.5 3.5 4.1 4.2 3.7 3.6 3.8
Financial institutions 10.3 12.3 10.8 11.6 10.0 18.5 15.6 10.6 11.0Real est&te 3.0 4.4 4.2 3.7 4.0 3.0 2.4 2.7 2.8Services 5.2 4.8 6.0 6.6 4.0 4.9 5.1 5.6 4.6
Total 100.0 100.0 100.0 100.0 100.0 100.0 100.0 100.0 100.0
Source: Central Bank of the Philippines.
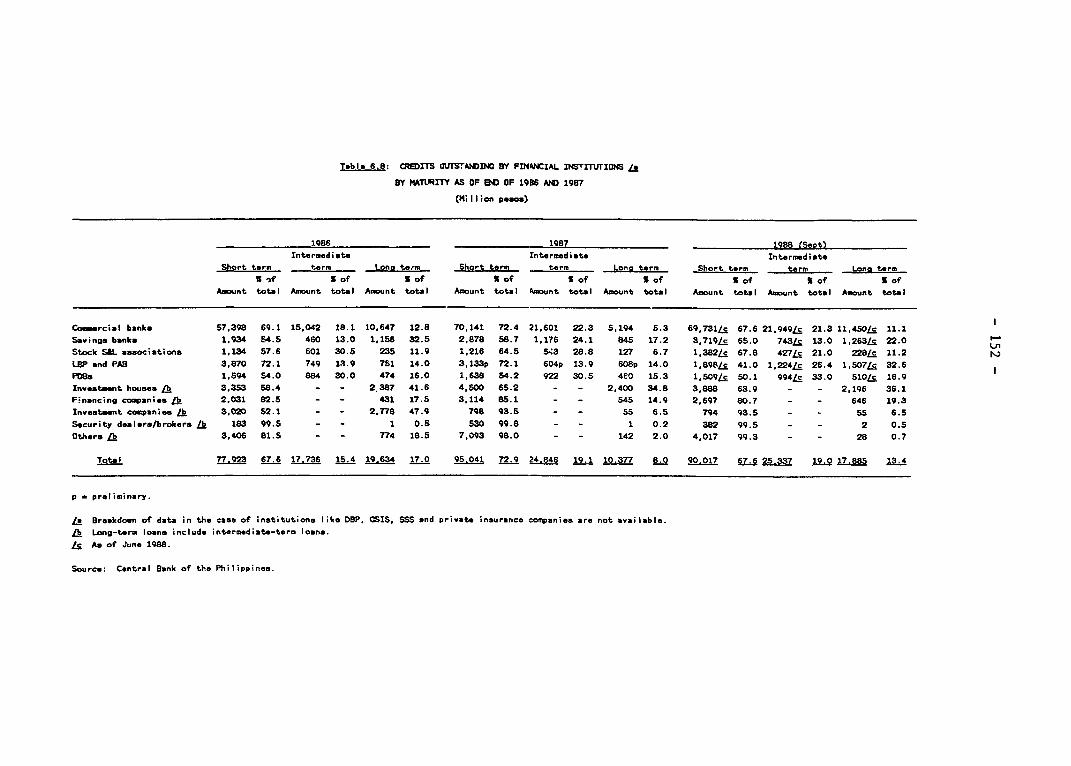
Tab l. 6.8: CREDrTS WrS*AlINO BY FINONCIAL INSTITVrIONS 0?
BrY MATLRrY AS OF END OF 19B6 AND 1987
Mi llion pesos)
1986 1987 1988 (Seot)
Intermediate Intermediate Intermediato
Short term term Lono teem Short term term Lonr term Short term term Lona term
s -f S of I of S of S of S of S of S of S of
Amount total Amount tote l Amount totel Amount total mount total Amount tot l Amount totel Amount tota l Amount total
Commercial banks 57,398 69.1 15,042 18.1 10,647 12.8 70,141 72.4 21,601 22.3 5,194 5.3 69,731c 67.6 21,949/c 21.3 11,4SOLc 11.1
Savings banks 1.934 S4.5 460 13.0 1,156 32.5 2,878 58.7 1,176 24.1 845 17.2 3.719/c 65.0 743Lc 13.0 1,263Lc 22.0 Ul
Stock S&L aesociations 1,134 57.6 601 30.5 235 11.9 1.216 64.5 53 28.8 127 6.7 1,382Lc 67.8 427Lc 21.0 228jc 11.2 L
LBP and PAS 3,870 72.1 749 13.9 751 14.0 3,133p 72.1 604p 13.9 608p 14.0 1,898Lc 41.0 1,224/c 26.4 1,507Lc 32.6
P08. 1,594 54.0 884 30.0 474 16.0 1,638 54.2 922 30.5 4eo 15.3 1 ,509L 50.1 994/c 33.0 51OLc 16.9
Investment houses /b 3,353 58.4 - - 2.387 41.6 4,500 65.2 - - 2.400 34.8 3,888 63.9 - - 2,196 36.1
Financing companies fl 2,031 82.5 - - 431 17.5 3,114 85.1 - - 545 14.9 2.697 80.7 - - 646 19.3
Investment companies & 5,020 52.1 - - 2,778 47.9 798 93.5 - - 55 6.5 794 93.5 - - 55 6.5
Security deolare/brokers /b 183 99.5 - - 1 0.5 530 99.8 - - 1 0.2 382 99.5 - - 2 0.5
Othora /b 3,406 81.5 - - 774 18.5 7,093 98.0 - - 142 2.0 4,017 99.3 - - 28 0.7
Total 77.923 67.6 17.736 15.4 19.634 17.0 95.041 72.9 24.846 19.1 10.377 8.0 90.017 67.6 25.337 19.0 17.885 13.4
p - preliminary.
j Breakdown of date in the case of institutions like DBP, OSIS, SSS and private insurance companies are not available.
1k Long-term loans include intermediate-term loans.Le Am of June 1988.
Source: Central Bank of the Philippines.
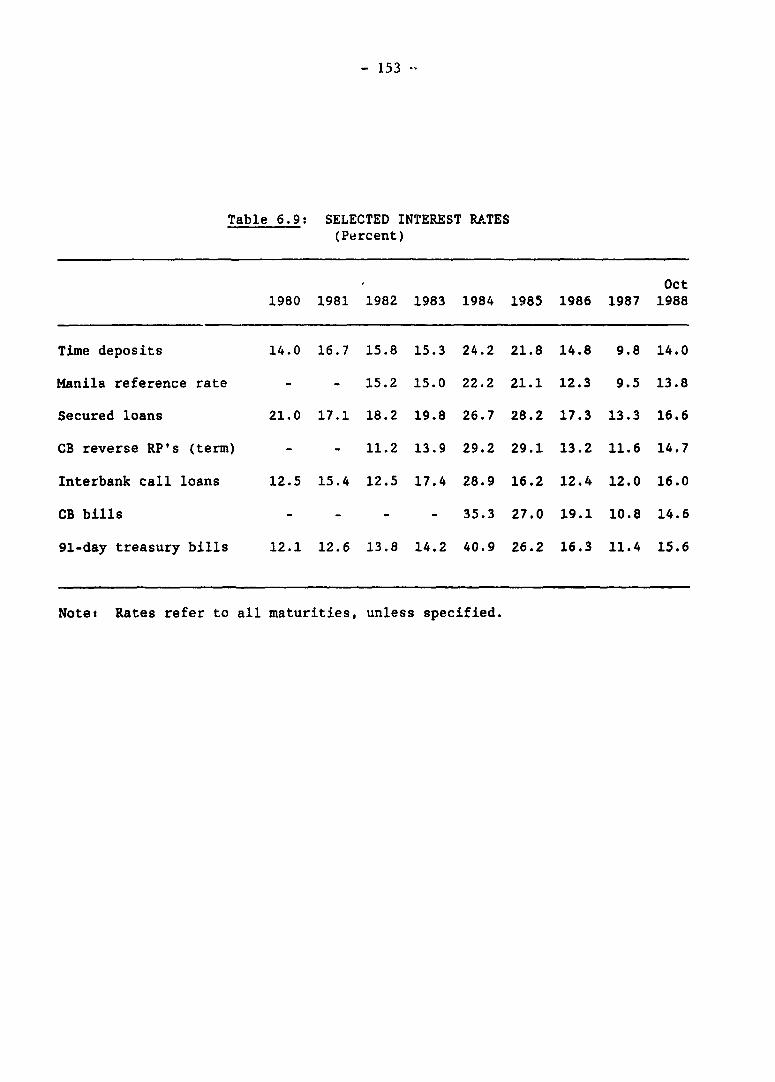
- 153 -
Table 6.9: SELECTED INTEREST RA.TES(Percent)
Oct1980 1981 1982 1983 1984 1985 1986 1987 1988
Time deposits 14.0 16.7 15.8 15.3 24.2 21.8 14.8 9.8 14.0
Manila reference rate - - 15.2 15.0 22.2 21.1 12.3 9.5 13.8
Secured loans 21.0 17.1 18.2 19.8 26.7 28.2 17.3 13.3 16.6
CB reverse RP's (term) - - 11.2 13.9 29.2 29.1 13.2 11.6 14.7
Interbank call loans 12.5 15.4 12.5 17.4 28.9 16.2 12.4 12.0 16.0
CB bills - - - - 35.3 27.0 19.1 10.8 14.6
91-day treasury bills 12.1 12.6 13.8 14.2 40.9 26.2 16.3 11.4 15.6
Note: Rates refer to all maturities, unless specified.
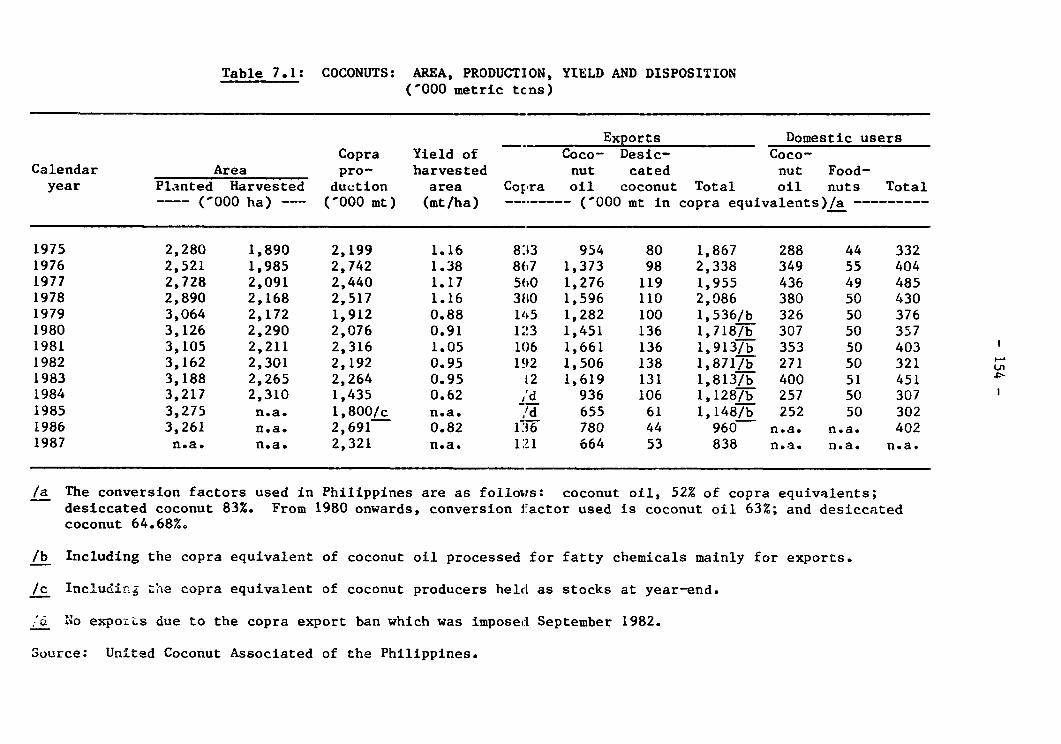
Table 7.1: COCONUTS: AREA, PRODUCTION, YIELD AND DISPOSITION('000 metric tcns)
Exports Domestic usersCopra Yield of Coco- Desic- Coco-
Calendar Area pro- harvested nut cated nut Food-year Planted Harvested duction area Copra oil coconut Total oil nuts Total
---- ( 000 ha) --- ('000 mt) (mt/ha) ('000 mt in copra equivalents)/a ---------
1975 2,280 1,890 2,199 1.16 8:;3 954 80 1,867 288 44 3321976 2,521 1,985 2,742 1.38 807 1,373 98 2,338 349 55 4041977 2,728 2,091 2,440 1.17 560 1,276 119 1,955 436 49 4851978 2,890 2,168 2,517 1.16 38l0 1,596 110 2,086 380 50 4301979 3,064 2,172 1,912 0.88 14i5 1,282 100 1,536/b 326 50 3761980 3,126 2,290 2,076 0.91 123 1,451 136 1,718/b 307 50 3571981 3,105 2,211 2,316 1.05 106 1,661 136 1,913/b 353 50 4031982 3,162 2,301 2,192 0.95 192 1,506 138 1,871/b 271 50 3211983 3,188 2,265 2,264 0.95 12 1,619 131 1,813/b 400 51 4511984 3,217 2,310 1,435 0.62 ,'d 936 106 1,1287W 257 50 3071985 3,275 n.a. 1,800/c n.a. ,'d 655 61 1,148/b 252 50 3021986 3,261 n.a. 2,691 0.82 1J36 780 44 960 n.a. n.a. 4021987 n.a. n.a. 2,321 n.a. 121 664 53 838 n.a. n.a. n.a.
/a The conversion factors used in Philippines are as follows: coconut oil, 52% of copra equivalents;desiccated coconut 83%. From 1980 onwards, conversion iactor used is coconut oil 63%; and desiccatedcoconut 64.68%.
/b Including the copra equivalent of coconut oil processed for fatty chemicals mainly for exports.
/c Includir,7 the copra equivalent of coconut producers held as stocks at year-end.
;'d No expo!Ls due to the copra export ban which was imposed September 1982.
Source: United Coconut Associated of the Philippines.
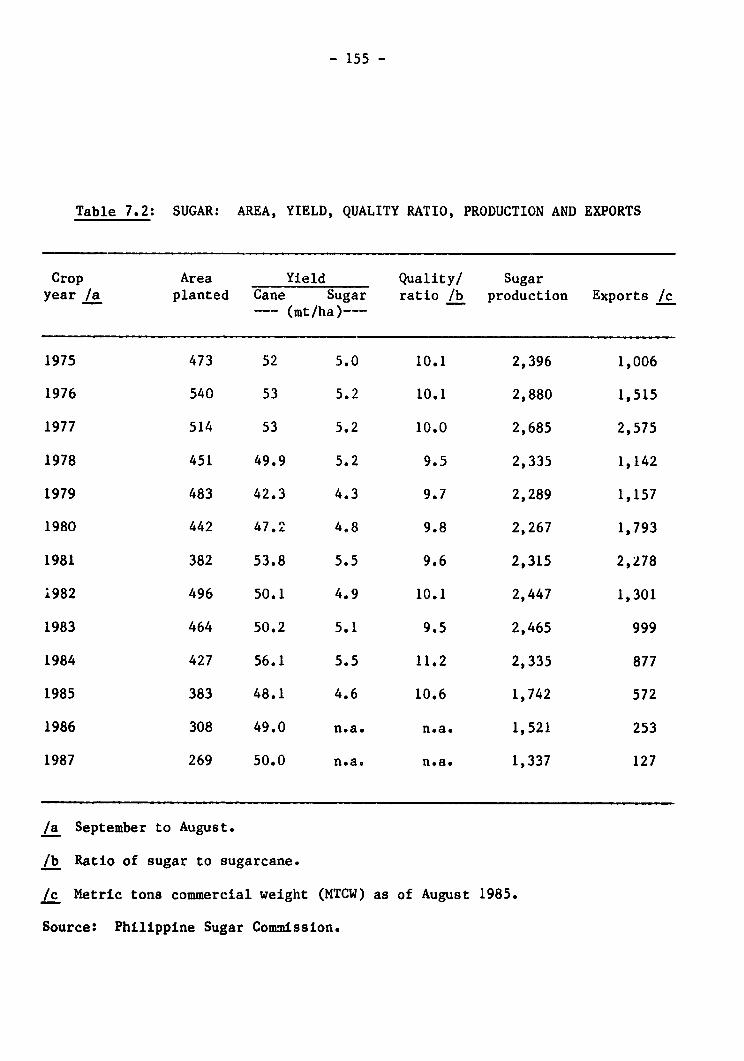
- 155 -
Table 7.2: SUGAR: AREA, YIELD, QUALITY RATIO, PRODUCTION AND EXPORTS
Crop Area Yield Quality/ Sugaryear /a planted Cane Sugar ratio /b production Exports /c
--- (mt/ha)---
1975 473 52 5.0 10.1 2,396 1,006
1976 540 53 5.2 10.1 2,880 1,515
1977 514 53 5.2 10.0 2,685 2,575
1978 451 49.9 5.2 9.5 2,335 1,142
1979 483 42.3 4.3 9.7 2,289 1,157
1980 442 47.2 4.8 9.8 2,267 1,793
1981 382 53.8 5.5 9.6 2,315 2,278
i982 496 50.1 4.9 10.1 2,447 1,301
1983 464 50.2 5.1 9.5 2,465 999
1984 427 56.1 5.5 11.2 2,335 877
1985 383 48.1 4.6 10.6 1,742 572
1986 308 49.0 n.a. n.a. 1,521 253
1987 269 50.0 n.a. n.a. 1,337 127
/a September to August.
/b Ratio of sugar to sugarcane.
/c Metric tons commercial weight (MTCW) as of August 1985.
Source: Philippine Sugar Commission.
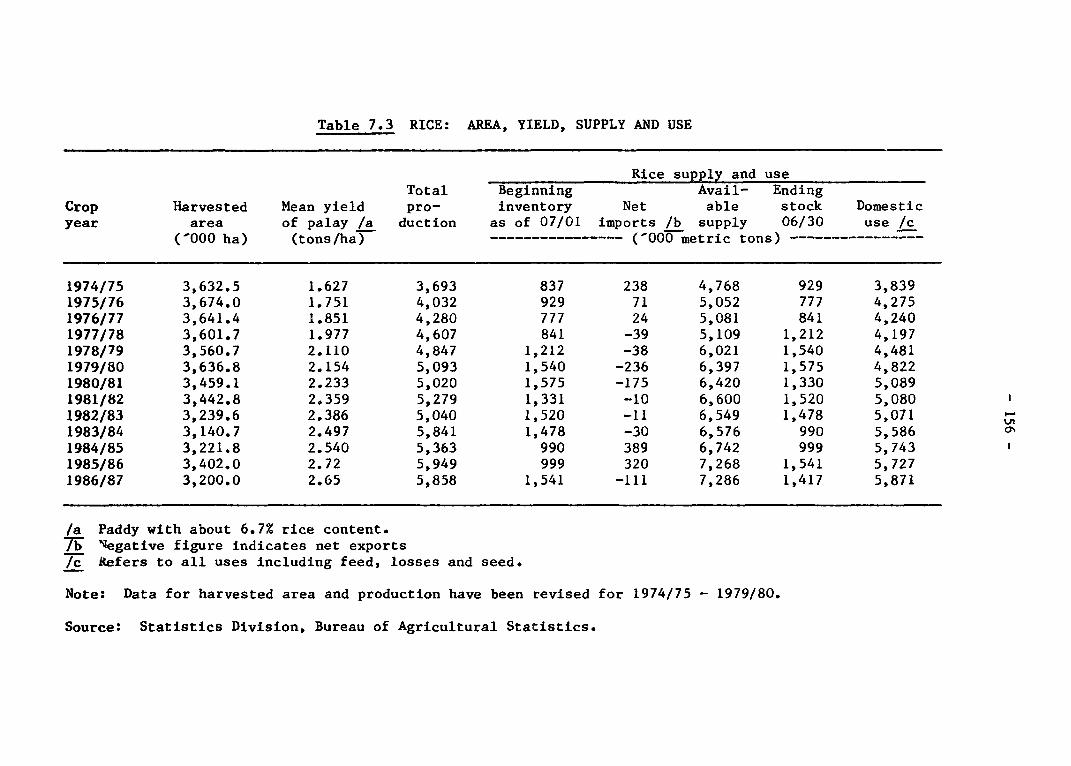
Table 7.3 RICE: AREA, YIELD, SUPPLY AND USE
Rice supply and useTotal Beginning Avail- Ending
Crop Harvested Mean yield pro- inventory Net able stock Domesticyear area of palay /a duction as of 07/01 imports /b supply 06/30 use /c
(-000 ha) (tons/ha) --------- -…--- (-000 metric tons) --------------
1974/75 3,632.5 1.627 3,693 837 238 4,768 929 3,8391975/76 3,674.0 1.751 4,032 929 71 5,052 777 4,2751976/77 3,641.4 1.851 4,280 777 24 5,081 841 4,2401977/78 3,601.7 1.977 4,607 841 -39 5,109 1,212 4,1971978/79 3,560.7 2.110 4,847 1,212 -38 6,021 1,540 4,4811979/80 3,636.8 2.154 5,093 1,540 -236 6,397 1,575 4,8221980/81 3,459.1 2.233 5,020 1,575 -175 6,420 1,330 5,0891981/82 3,442.8 2.359 5,279 1,331 -10 6,600 1,520 5,080 11982/83 3,239.6 2.386 5,040 1,520 -11 6,549 1,478 5,0711983/84 3,140.7 2.497 5,841 1,478 -30 6,576 990 5,586 01984/85 3,221.8 2.540 5,363 990 389 6,742 999 5,7431985/86 3,402.0 2.72 5,949 999 320 7,268 1,541 5,7271986/87 3,200.0 2.65 5,858 1,541 -111 7,286 1,417 5,871
/a Paddy with about 6.7% rice content.7W '[egative figure indicates net exports/c Refers to all uses including feed, losses and seed.
Note: Data for harvested area and production have been revised for 1974/75 - 1979/80.
Source: Statistics Division, Bureau of Agricultural Statistics.
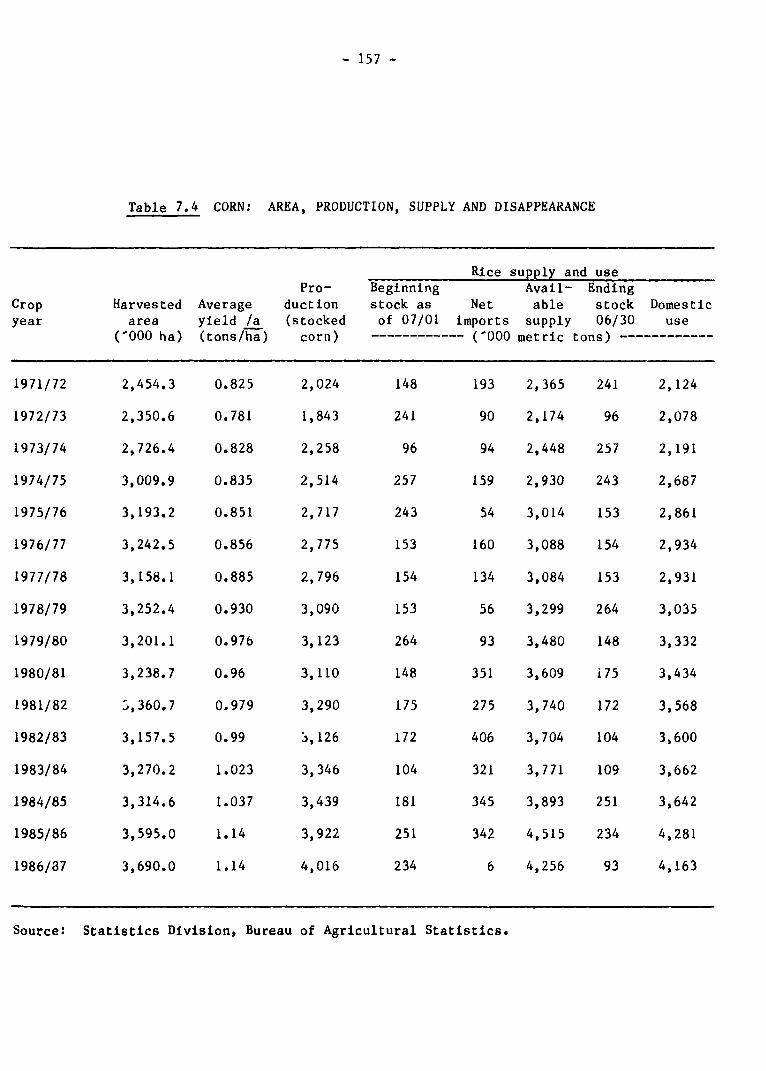
- 157 -
Table 7.4 CORN: AREA, PRODUCTION, SUPPLY AND DISAPPEARANCE
Rice supply and usePro- Beginning Avail- Ending
Crop Harvested Average duction stock as Net able stock Domesticyear area yield /a (stocked of 07/01 imports supply 06/30 use
('000 ha) (tons/ha) corn) …-…--------- (-000 metric tons) ------------
1971/72 2,454.3 0.825 2,024 148 193 2,365 241 2,124
1972/73 2,350.6 0.781 1,843 241 90 2,174 96 2,078
1973/74 2,726.4 0.828 2,258 96 94 2,448 257 2,191
1974/75 3,009.9 0.835 2,514 257 159 2,930 243 2,687
1975/76 3,193.2 0.851 2,717 243 54 3,014 153 2,861
1976/77 3,242.5 0.856 2,775 153 160 3,088 154 2,934
1977/78 3,158.1 0.885 2,796 154 134 3,084 153 2,931
1978/79 3,252.4 0.930 3,090 153 56 3,299 264 3,035
1979/80 3,201.1 0.976 3,123 264 93 3,480 148 3,332
1980/81 3,238.7 0.96 3,110 148 351 3,609 i75 3,434
1981/82 i,360.7 0.979 3,290 175 275 3,740 172 3,568
1982/83 3,157.5 0.99 j,126 172 406 3,704 104 3,600
1983/84 3,270.2 1.023 3,346 104 321 3,771 109 3,662
1984/85 3,314.6 1.037 3,439 181 345 3,893 251 3,642
1985/86 3,595.0 1.14 3,922 251 342 4,515 234 4,281
1986/87 3,690.0 1.14 4,016 234 6 4,256 93 4,163
Source: Statistics Division, Bureau of Agricultural Statistics.
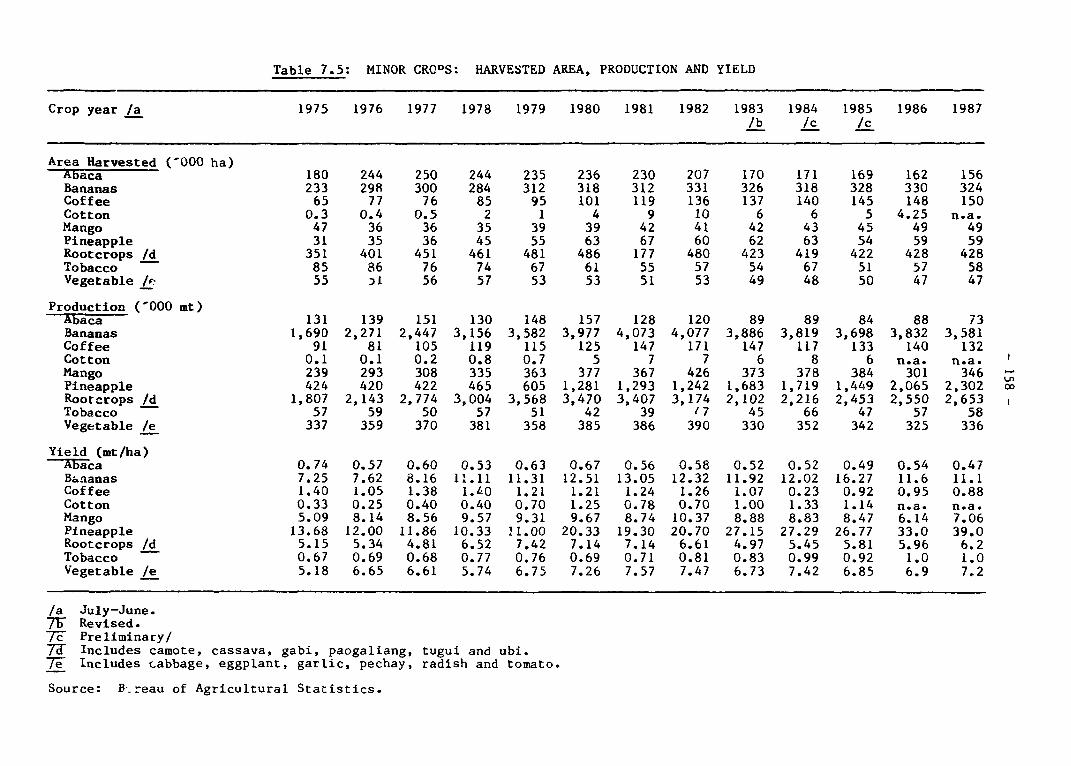
Table 7.5: MINOR CRODS: HARVESTED AREA, PRODUCTION AND YIELD
Crop year /a 1975 1976 1977 1978 1979 1980 1981 1982 1983 1984 1985 1986 1987/b /c /c
Area Harvested (-000 ha)Abaca 180 244 250 244 235 236 230 207 170 171 169 162 156Bananas 233 298 300 284 312 318 312 331 326 318 328 330 324Coffee 65 77 76 85 95 101 119 136 137 140 145 148 150Cotton 0.3 0.4 0.5 2 1 4 9 10 6 6 5 4.25 n.a.Mango 47 36 36 35 39 39 42 41 42 43 45 49 49Pineapple 31 35 36 45 55 63 67 60 62 63 54 59 59Rootcrops /d 351 401 451 461 481 486 177 480 423 419 422 428 428Tobacco 85 86 76 74 67 61 55 57 54 67 51 57 58Vegetable /e 55 :) 56 57 53 53 51 53 49 48 50 47 47
Production ('000 mt)Abaca 131 139 151 130 148 157 128 120 89 89 84 88 73Bananas 1,690 2,271 2,447 3,156 3,582 3,977 4,073 4,077 3,886 3,819 3,698 3,832 3,581Coffee 91 81 105 119 115 125 147 171 147 117 133 140 132Cotton 0.1 0.1 0.2 0.8 0.7 5 7 7 6 8 6 n.a. n.a.Mango 239 293 308 335 363 377 367 426 373 378 384 301 346Pineapple 424 420 422 465 605 1,281 1,293 1,242 1,683 1,719 1,449 2,065 2,302 oRootcrops /d 1,807 2,143 2,774 3,004 3,568 3,470 3,407 3,174 2,102 2,216 2,453 2,550 2,653Tobacco 57 59 50 57 51 42 39 17 45 66 47 57 58Vegetable _e 337 359 370 381 358 385 386 390 330 352 342 325 336
Yield (mt/ha)A'Faac a 0.74 0.57 0.60 0.53 0.63 0.67 0.56 0.58 0.52 0.52 0.49 0.54 0.47Bananas 7.25 7.62 8.16 1'.11 11.31 12.51 13.05 12.32 11.92 12.02 16.27 11.6 11.1Coffee 1.40 1.05 1.38 1.410 1.21 1.21 1.24 1.26 1.07 0.23 0.92 0.95 0.88Cotton 0.33 0.25 0.40 0.40 0.70 1.25 0.78 0.70 1.00 1.33 1.14 n.a. n.a.Mango 5.09 8.14 8.56 9.57 9.31 9.67 8.74 10.37 8.88 8.83 8.47 6.14 7.06Pineapple 13.68 12.00 11.86 10.33 H1.00 20.33 19.30 20.70 27.15 27.29 26.77 33.0 39.0Rootcrops /d 5.15 5.34 4.81 6.52 7.42 7.14 7.14 6.61 4.97 5.45 5.81 5.96 6.2Tobacco 0.67 0.69 0.68 0.77 0.76 0.69 0.71 0.81 0.83 0.99 0.92 1.0 1.0Vegetable /e 5.18 6.65 6.61 5.74 6.75 7.26 7.57 7.47 6.73 7.42 6.85 6.9 7.2
/a July-June.7W Revised.7T Preliminary/IT Includes camote, cassava, gabi, paogaliang, tugui and ubi.75e Includes cabbage, eggplant, garlic, pechay, radish and tomato.
Source: B--reau of Agricultural Statistics.

- 159 -
Table 7.6: PRODUCTION OF SELECTED LIVESTOCK AND FISHERY PRODUCTS
Calendar year 1978 1979 1980 1981 1982 1983 1984 1985 1986 1987
Livestock Inventory(mln of heads)
Chickens 58.89 49.32 52.76 57.72 59.71 62.25 59.20 52.10 53.00 52.93Hogs 6.91 7.44 7.93 7.76 7.79 7.98 7.61 7.30 7.27 7.1!Cattle 1.82 1.83 1.88 1.94 1.94 1.94 1.85 1.79 1.81 1.75Carabao 2.96 2.80 2.87 2.85 2.90 2.95 3.02 2.98 2.98 2.87
Production ( 000 mt)
Livestock and dairy 524.7 559.6 655.9 757.5 739.5 768.4 807.5 745.2 849.2 906.6Hogs (pork) 467.3 508.7 464.4 5(68.0 542.2 584.0 610.9 526.9 610.7 650.0Cattle (beef) 57.4 50.9 114.7 114.6 111.2 99.2 107.1 121.3 135.7 144.CCarabao (carabeef) - - 55.1 50.7 55.0 50.6 55.6 57.4 61.7 70.0Coat (chevon) - - 19.3 21.6 28.5 32.1 31.4 37.1 38.6 40.0Milk - - 2.5 2.6 2.6 2.6 2.5 2.5 2.5 2.6
Poultry and eggs 306.5 267.1 3.2o.5 370.0 387.4 388.1 384.6 !24.6 139.4 362.5Chicken 179.4 138.6 189.0 212.0 218.5 222.1 218.2 192.4 203.0 213.6Duck 13.1 13.5 7.4 8.9 10.7 9.3 8.3 5.4 5.7 5.6Eggs 114.0 115.0 130.1 149.2 158.3 156.7 158.0 126.8 130.8 143.3
Fisheries ('000 mt)
Commercial (marine) 506 501 488 495 526 519 513 512 546 559Municipal (coastal) /a 858 839 895 939 978 1,146 1,089 1,045 1,072 1,081Fishponds /b 217 241 289 339 392 445 4i8 494 471 550
/a Since 1976 adjustments were made a.d municipal fisheries include fishing done in coastaland inland areas with or hithout boat of 3 gross tonnage or less.
/b Since 1976 adjustments were made and aquaculture include three subsectors (namelymariculture for oyster, mussel and seaweeds; brackishwater culture for fishpond; andfreshwater culture for fishpen, fish cage and fishpond).
Source: Bureau of Agricultural Statistics, Bureau of Fisheries and Aquatic Resources.
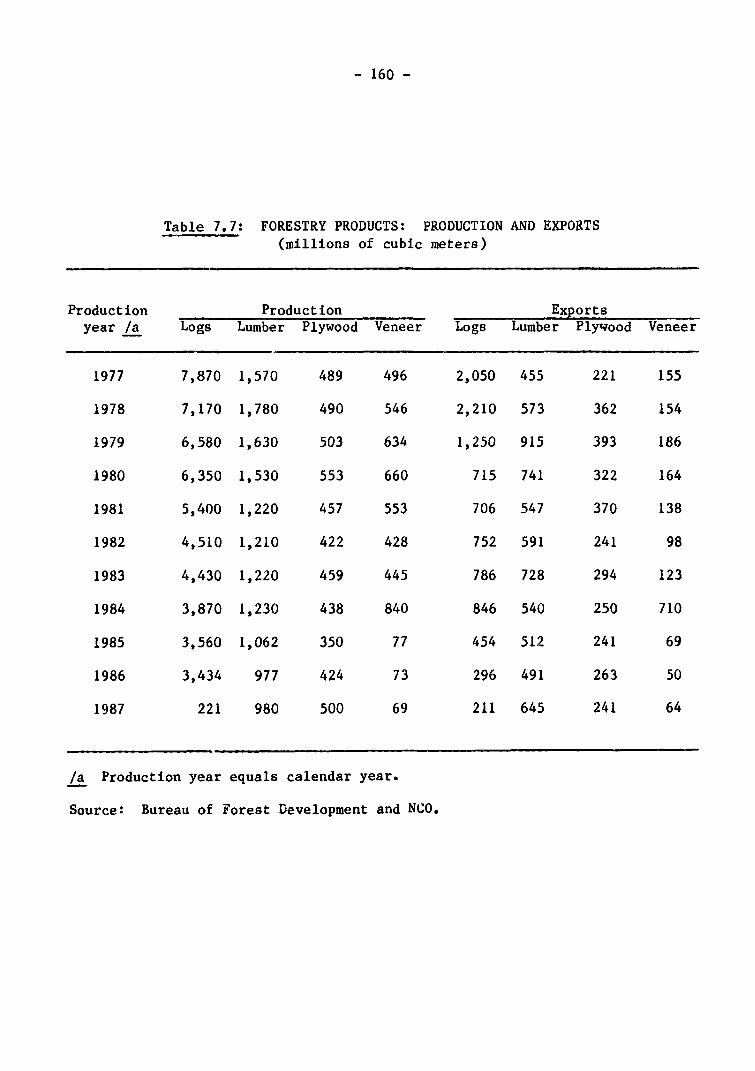
- 160 -
Table 7.7: FORESTRY PRODUCTS: PRODUCTION AND EXPORTS(millions of cubic meters)
Production Production Exportsyear /a Logs Lumber Plywood Veneer Logs Lumber Plywood Veneer
1977 7,870 1,570 489 496 2,050 455 221 155
1978 7,170 1,780 490 546 2,210 573 362 154
1979 6,580 1,630 503 634 1,250 915 393 186
1980 6,350 1,530 553 660 715 741 322 164
1981 5,400 1,220 457 553 706 547 370 138
1982 4,510 1,210 422 428 752 591 241 98
1983 4,430 1,220 459 445 786 728 294 123
1984 3,870 1,230 438 840 846 540 250 710
1985 3,560 1,062 350 77 454 512 241 69
1986 3,434 977 424 73 296 491 263 50
1987 221 980 500 69 211 645 241 64
/a Production year equals calendar year.
Source: Bureau of Forest Development and NCO.
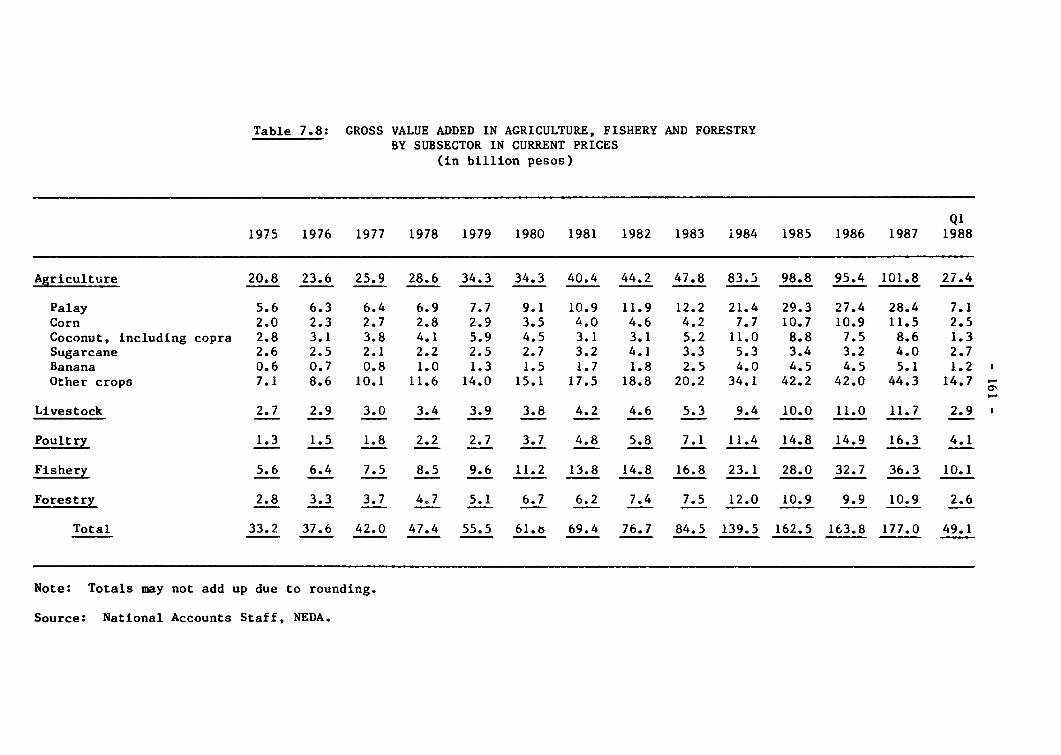
Table 7.8: GROSS VALUE ADDED IN AGRICULTURE, FISHERY AND FORESTRYBY SUBSECTOR IN CURRENT PRICES
(in billion pesos)
Q11975 1976 1977 1978 1979 1980 1981 1982 1983 1984 1985 1986 1987 1988
Agriculture 20.8 23.6 25.9 28.6 34.3 34.3 40.4 44.2 47.8 83.5 98.8 95.4 101.8 27.4
Palay 5.6 6.3 6.4 6.9 7.7 9.1 10.9 11.9 12.2 21.4 29.3 27.4 28.4 7.1Corn 2.0 2.3 2.7 2.8 2.9 3.5 4.0 4.6 4.2 7.7 10.7 10.9 11.5 2.5Coconut, including copra 2.8 3.1 3.8 4.1 5.9 4.5 3.1 3.1 5.2 11.0 8.8 7.5 8.6 1.3Sugarcane 2.6 2.5 2.1 2.2 2.5 2.7 3.2 4.1 3.3 5.3 3.4 3.2 4.0 2.7Banana 0.6 0.7 0.8 1.0 1.3 1.5 1.7 1.8 2.5 4.0 4.5 4.5 5.1 1.2Other crops 7.1 8.6 10.1 11.6 14.0 15.1 17.5 18.8 20.2 34.1 42.2 42.0 44.3 14.7
Livestock 2.7 2.9 3.0 3.4 3.9 3.8 4.2 4.6 5.3 9.4 10.0 11.0 11.7 2.9
Poultry 1.3 1.5 1.8 2.2 2.7 3.7 4.8 5.8 7.1 11.4 14.8 14.9 16.3 4.1
Fishery 5.6 6.4 7.5 8.5 9.6 11.2 13.8 14.8 16.8 23.1 28.0 32.7 36.3 10.1
Forestry 2.8 3.3 3.7 4.7 5.1 6.7 6.2 7.4 7.5 12.0 10.9 9.9 10.9 2.6
Total 33.2 37.6 42.0 47.4 55.5 61.b 69.4 76.7 84.5 139.5 162.5 163.8 177.0 49.1
Note: Totals may not add up due to rounding.
Source: National Accounts Staff, NEDA.
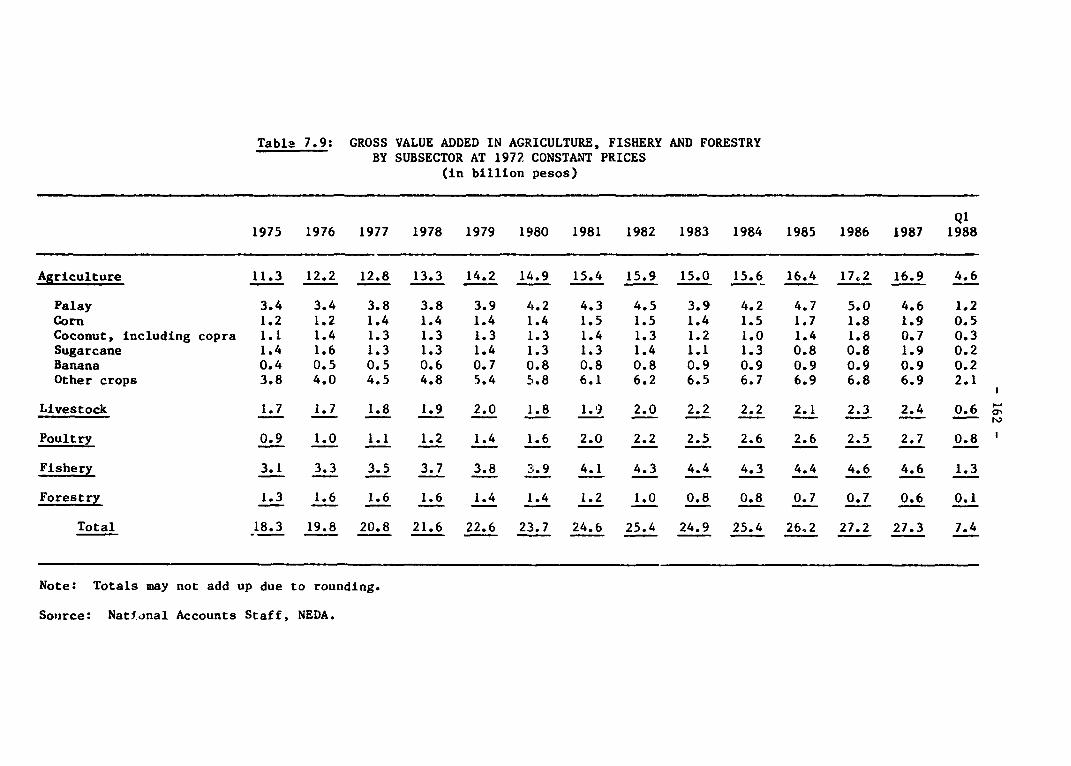
Table 7.9: GROSS VALUE ADDED IN AGRICULTURE, FISHERY AND FORESTRYBY SUBSECTOR AT 1972 CONSTANT PRICES
(in billion pesos)
Ql1975 1976 1977 1978 1979 1980 1981 1982 1983 1984 1985 1986 1987 1988
Agriculture 11.3 12.2 12.8 13.3 14.2 14.9 15.4 15.9 15.0 15.6 16.4 17.2 16.9 4.6
Palay 3.4 3.4 3.8 3.8 3.9 4.2 4.3 4.5 3.9 4.2 4.7 5.0 4.6 1.2Corn 1.2 1.2 1.4 1.4 1.4 1.4 1.5 1.5 1.4 1.5 1.7 1.8 1.9 0.5Coconut, including copra 1.1 1.4 1.3 1.3 1.3 1.3 1.4 1.3 1.2 1.0 1.4 1.8 0.7 0.3Sugarcane 1.4 1.6 1.3 1.3 1.4 1.3 1.3 1.4 1.1 1.3 0.8 0.8 1.9 0.2Banana 0.4 0.5 0.5 0.6 0.7 0.8 0.8 0.8 0.9 0.9 0.9 0.9 0.9 0.2Other crops 3.8 4.0 4.5 4.8 5.4 5.8 6.1 6.2 6.5 6.7 6.9 6.8 6.9 2.1
Livestock 1.7 1.7 1.8 1.9 2.0 1.8 1.9 2.0 2.2 2.2 2.1 2.3 2.4 0.6
Poultry 0.9 1.0 1.1 1.2 1.4 1.6 2.0 2.2 2.5 2.6 2.6 2.5 2.7 0.8
Fishery 3.1 3.3 3.5 3.7 3.8 3.9 4.1 4.3 4.4 4.3 4.4 4.6 4.6 1.3
Forestry 1.3 1.6 1.6 1.6 1.4 1.4 1.2 1.0 0.8 0.8 0.7 0.7 0.6 0.1
Total 18.3 19.8 20.8 21.6 22.6 23.7 24.6 25.4 24.9 25.4 26.2 27.2 27.3 7.4
Note: Totals may not add up due to rounding.
Source: Nati.onal Accounts Staff, NEDA.

- 163 -
Table 7.10: AGRARIAN REFORM PROGRAM: OPERATION LAND TRANSFER AT END-YEAR(in thousands)
1985 1986 1987
Land Transfer
No. of EP generated/distributed 37.7 43.6 131.1
No. of tenant recipients 28.8 33.2 99.3
.Hectares 28.2 33.2 113.3
Land Compensation
Claims Received and Verified
No. of landowners 13.6 14 .' 14.3
No. of tenants 179.3 183.9 186.1
Hectares 286.9 294.4 298.9
Claims Approved for Paymentby LBP
No. of landowners 12.0 12.6 13.1
No. of tenants 134.4 138.2 141.6
Source: Ministry of Agrarian Reform.
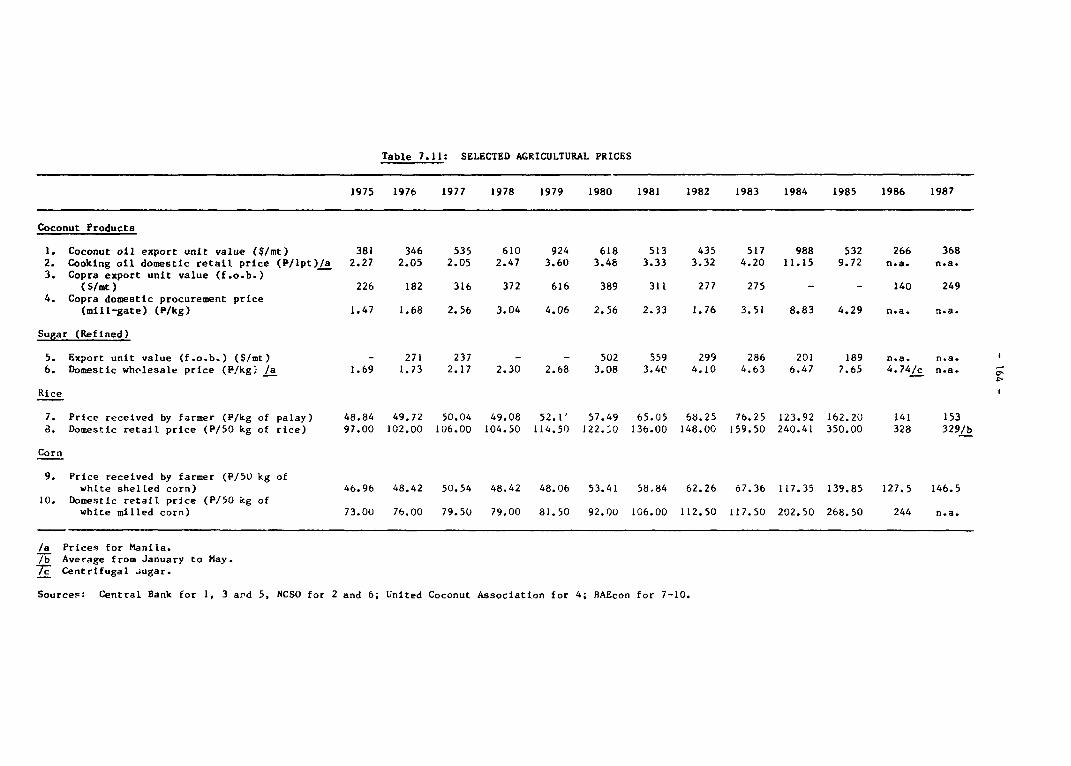
Table 7.11: SELECTED AGRICULTURAL PRICES
1975 1976 1977 1978 1979 1980 1981 1982 1983 1984 1985 1986 1987
Coconut Products
1. Coconut oil export unit value (S/mt) 381 346 535 610 924 618 513 435 517 988 532 266 3682. Cooking oil domestic retail price (P/Ipt)/a 2.27 2.05 2.05 2.47 3.60 3.48 3.33 3.32 4.20 11.15 9.72 n.a. n.a.3. Copra export unit value (f.o.b.)(Smt) 226 182 316 372 616 389 311 277 275 - - 140 2494. Copra domestic procurement price(mill-gate) (P/kg) 1.47 1.68 2.56 3.04 4.06 2.56 2.33 1.76 3.51 8.83 4.29 n.a. n.a.
Sugar (Refined)
5. Export unit value (f.o.b.) (S/mt) - 271 237 - - 502 559 299 286 201 189 n.a. n.a.6. Domestic wholesale price (P/kg, /a 1.69 1.73 2.17 2.30 2.68 3.08 3.40 4.10 4.63 6.47 7.65 4.7 4
/c n.a.
Rice
7. Price received by farmer (P/kg of palay) 48.84 49.72 50.04 49.08 52.1' 57.49 65.05 68.25 76.25 123.92 162.20 141 1538. Domestic retail price (P/50 kg of rice) 97.00 102.00 106.00 104.50 114.50 122._0 136.00 148.00 159.50 240.41 350.00 328 329/b
Corn
9. Price received by farmer (P/5O kg ofwhite shelled corn) 46.96 48.42 50.54 48.42 48.06 53.41 58.84 62.26 67.36 117.35 139.85 127.5 146.510. Domestic retail price (P/50 kg ofwhite milled corn) 73.00 76.00 79.50 79.00 81.50 92.00 106.00 112.50 117.50 202.50 268.50 244 n.a.
/a Prices for Manila./b Average from January to May.77 Centrifugal augar.
Sources: Central Bank for 1, 3 ard 5, NCSO for 2 and 6; United Coconut Association for 4; HAEcon for 7-10.
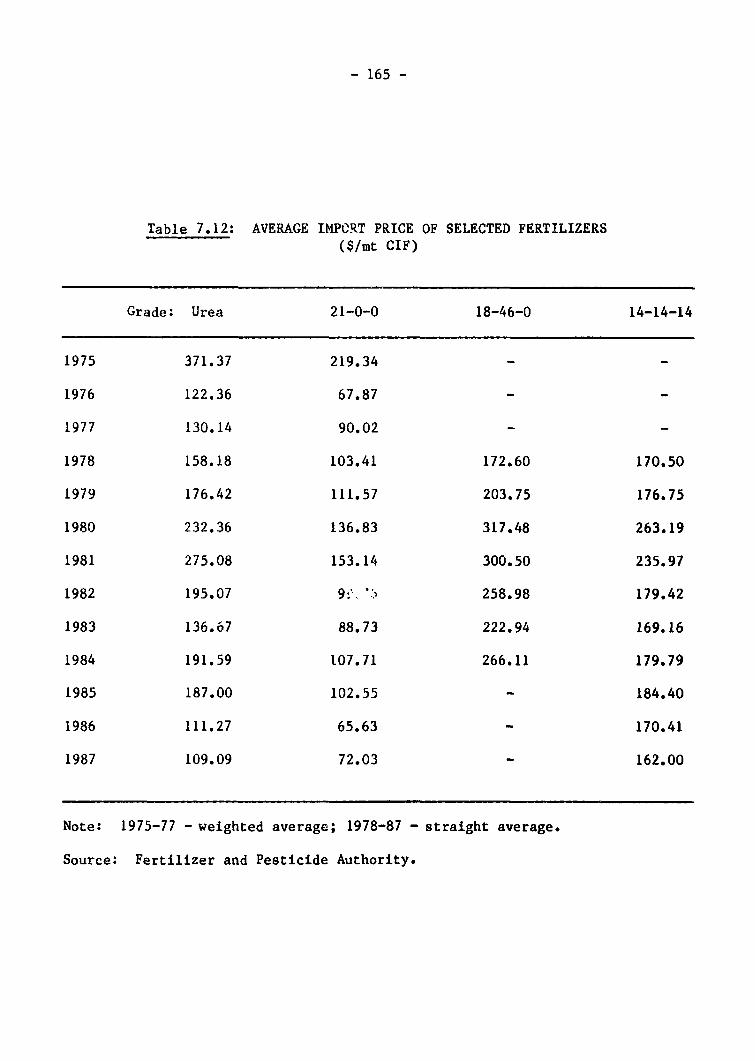
- 165 -
Table 7.12: AVERAGE IMPORT PRICE OF SELECTED FERTILIZERS($/mt CIF)
Grade: Urea 21-0-0 18-46-0 14-14-14
1975 371.37 219.34 - -
1976 122.36 67.87
1977 130.14 90.02 -
1978 158.18 103.41 172.60 170.50
1979 176.42 111.57 203.75 176.75
1980 232.36 136.83 317.48 263.19
1981 275.08 153.14 300.50 235.97
1982 195.07 9 '. 258.98 179.42
1983 136.67 88.73 222.94 169.16
1984 191.59 107.71 266.11 179.79
1985 187.00 102.55 - 184.40
1986 111.27 65.63 170.41
1987 109.09 72.03 162.00
Note: 1975-77 - weighted average; 1978-87 - straight average.
Source: Fertilizer and Pesticide Authority.
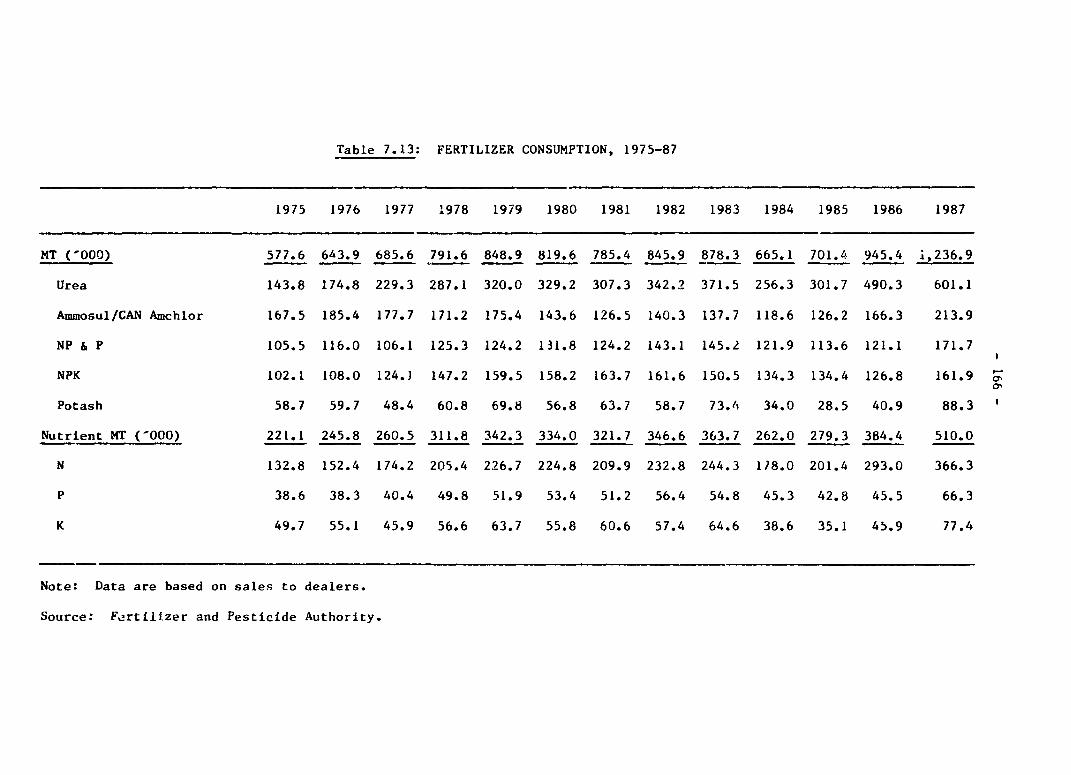
Table 7.13: FERTILIZER CONSUMPTION, 1975-87
1975 1976 1977 1978 1979 1980 1981 1982 1983 1984 1985 1986 1987
MT ('000) 577.6 643.9 685.6 791.6 848.9 819.6 785.4 845.9 878.3 665.1 701.4 945.4 i,236.9
Urea 143.8 174.8 229.3 287.1 320.0 329.2 307.3 342.2 371.5 256.3 301.7 490.3 601.1
Ammosul/CAN Amchlor 167.5 185.4 177.7 171.2 175.4 143.6 126.5 140.3 137.7 118.6 126.2 166.3 213.9
NP & P 105.5 116.0 106.1 125.3 124.2 131.8 124.2 143.1 145.2 121.9 113.6 121.1 171.7
NPK 102.1 108.0 124.1 147.2 159.5 158.2 163.7 161.6 150.5 134.3 134.4 126.8 161.9 '
Potash 58.7 59.7 48.4 60.8 69.8 56.8 63.7 58.7 73.4 34.0 28.5 40.9 88.3
Nutrient MT (-000) 221.1 245.8 260.5 311.8 342.3 334.0 321.7 346.6 363.7 262.0 279.3 384.4 510.0
N 132.8 152.4 174.2 205.4 226.7 224.8 209.9 232.8 244.3 1)8.0 201.4 293.0 366.3
p 38.6 38.3 40.4 49.8 51.9 53.4 51.2 56.4 54.8 45.3 42.8 45.5 66.3
K 49.7 55.1 45.9 56.6 63.7 55.8 60.6 57.4 64.6 38.6 35.1 45.9 77.4
Note: Data are based on sales to dealers.
Source: Fertilizer and Pesticide Authority.
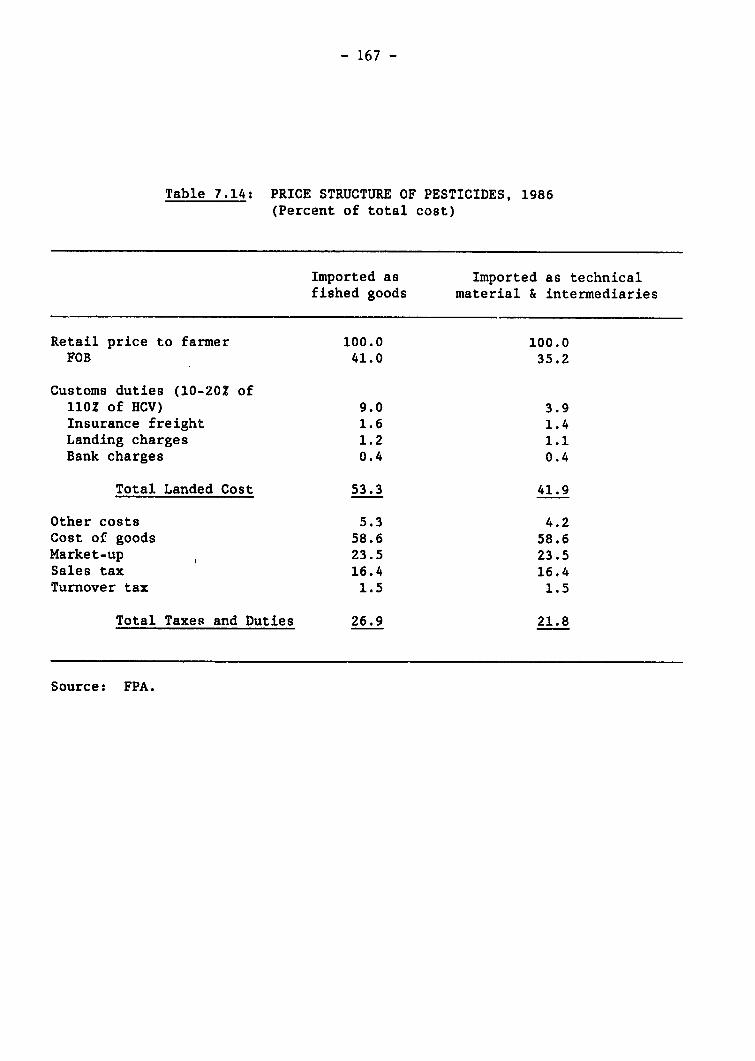
- 167 -
Table 7.14: PRICE STRUCTURE OF PESTICIDES, 1986(Percent of total cost)
Imported as Imported as technicalfished goods material & intermediaries
Retail price to farmer 100.0 100.0FOB 41.0 35.2
Customs duties (10-20Z of11OZ of HCV) 9.0 3.9Insurance freight 1.6 1.4Landing charges 1.2 1.1Bank charges 0.4 0.4
Total Landed Cost 53.3 41.9
Other costs 5.3 4.2Cost of goods 58.6 58.6Market-up 23.5 23.5Sales tax 16.4 16.4Turnover tax 1.5 1.5
Total Taxes and Duties 26.9 21.8
Source: FPA.
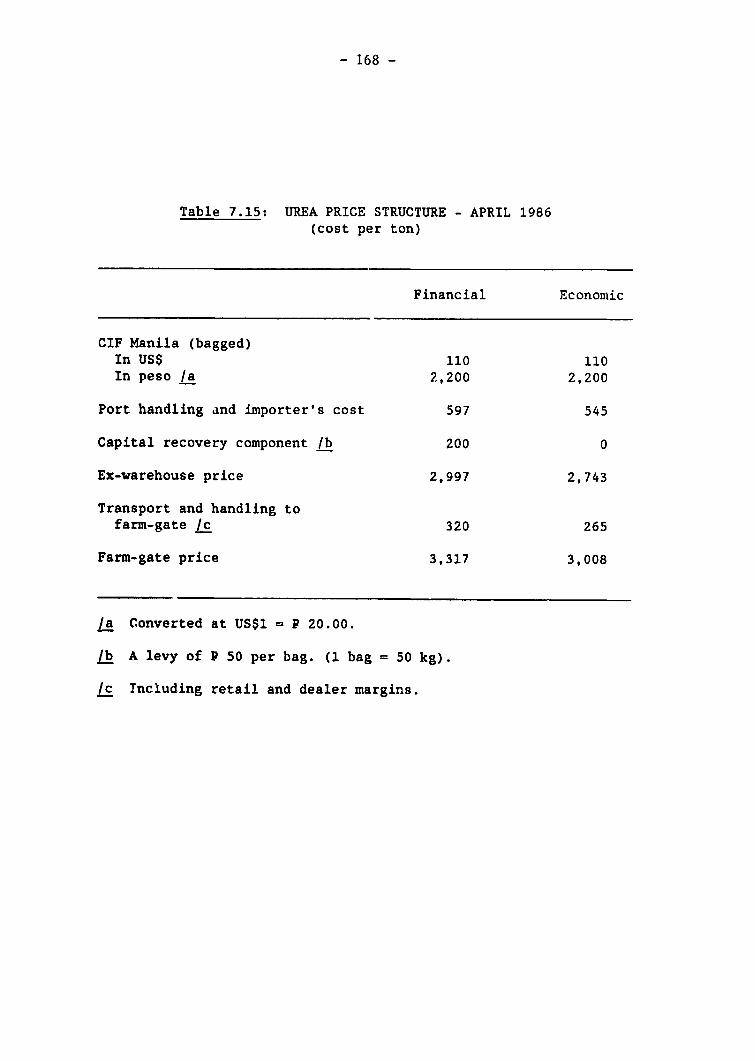
- 168 -
Table 7.15: UREA PRICE STRUCTURE - APRIL 1986(cost per ton)
Financial Economic
CIF Manila (bagged)In USS 110 110In peso /a 2,200 2,200
Port handling and importer's cost 597 545
Capital recovery component /b 200 0
Ex-warehouse price 2,997 2,743
Transport and handling tofarm-gate /c 320 265
Farm-gate price 3,317 3,008
/a Converted at US$1 = P 20.00.
/b A levy of P 50 per bag. (1 bag = 50 kg).
/c Including retail and dealer margins.
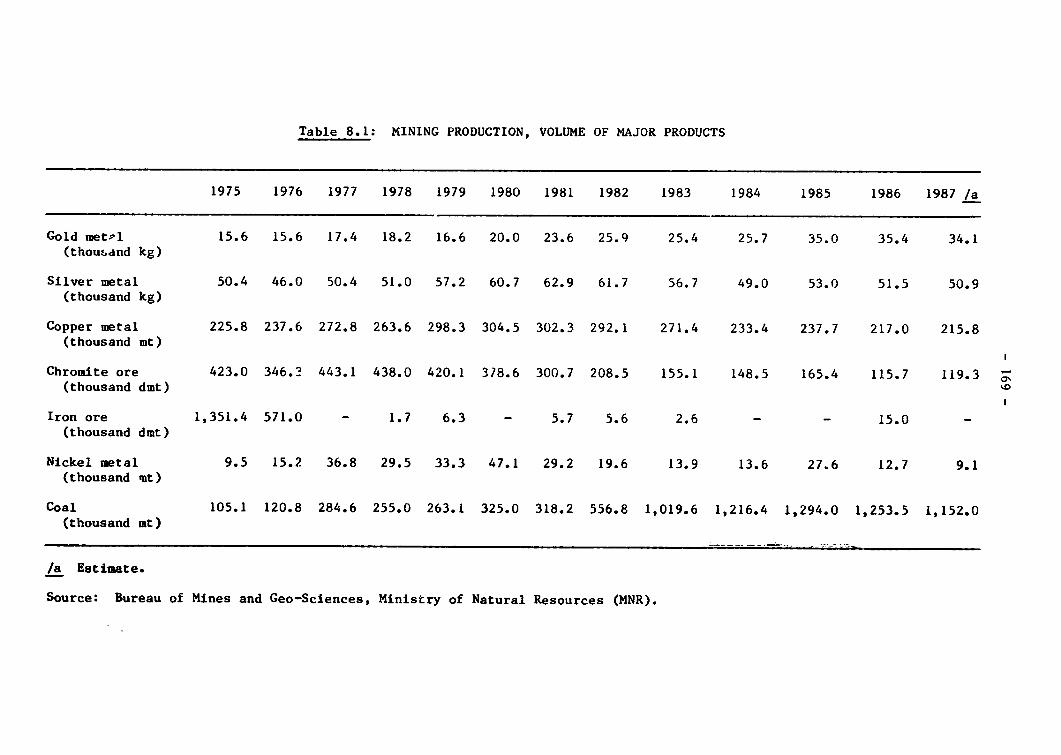
Table 8.1: MINING PRODUCTION, VOLUME OF MAJOR PRODUCTS
1975 1976 1977 1978 1979 1980 1981 1982 1983 1984 1985 1986 1987 /a
Gold metrl 15.6 15.6 17.4 18.2 16.6 20.0 23.6 25.9 25.4 25.7 35.0 35.4 34.1(thousdnd kg)
Silver metal 50.4 46.0 50.4 51.0 57.2 60.7 62.9 61.7 56.7 49.0 53.0 51.5 50.9(thousand kg)
Copper metal 225.8 237.6 272.8 263.6 298.3 304.5 302.3 292.1 271.4 233.4 237.7 217.0 215.8(thousand mt)
Chromite ore 423.0 346.3 443.1 438.0 420.1 378.6 300.7 208.5 155.1 148.5 165.4 115.7 119.3 >(thousand dmt)
Iron ore 1,351.4 571.0 - 1.7 6.3 - 5.7 5.6 2.6 - - 15.0 -(thousand dmt)
Nickel metal 9.5 15.2 36.8 29.5 33.3 47.1 29.2 19.6 13.9 13.6 27.6 12.7 9.1(thousand mt)
Coal 105.1 120.8 284.6 255.0 263.1 325.0 318.2 556.8 1,019.6 1,216.4 1,294.0 1,253.5 1,152.0(thousand mt)
/a Estimate.
Source: Bureau of Mines and Geo-Sciences, Ministry of Natural Resources (MNR).
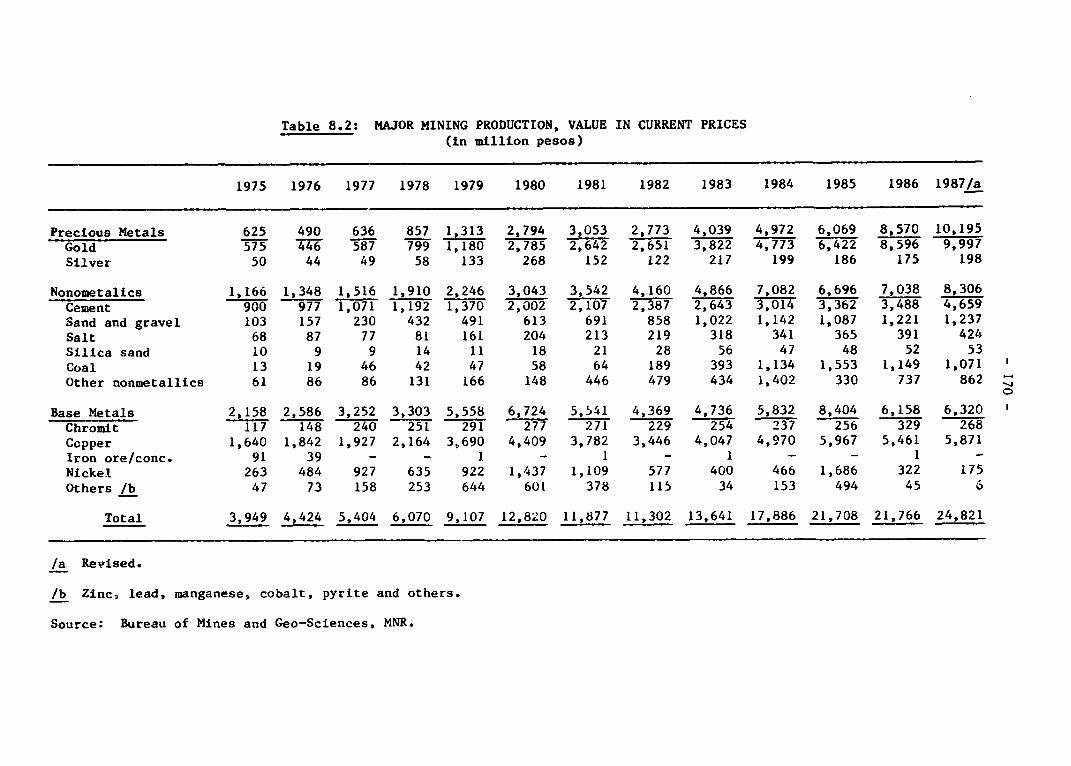
Table 8.2: MAJOR MINING PRODUCTION, VALUE IN CURRENT PRICES(in million pesos)
1975 1976 1977 1978 1979 1980 1981 1982 1983 1984 1985 1986 1987/a
Precious Metals 625 490 636 857 1,313 2,794 3,053 2,773 4,039 4,972 6,069 8,570 10,195Gold 575 446 587 799 1,180 2,785 2,642 2,651 3,822 4,773 6,422 8,596 9,997Silver 50 44 49 58 133 268 152 122 217 199 186 175 198
Nonometalics 1,166 1,348 1,516 1,910 2,246 3,043 3,542 4,160 4,866 7,082 6,696 7,038 8,306Cement 900 977 1,071 1,192 1,370 2,002 2,107 2,387 2,643 3,014 3,362 3,488 4,659Sand and gravel 103 157 230 432 491 613 691 858 1,022 1,142 1,087 1,221 1,237Salt 68 87 77 81 161 204 213 219 318 341 365 391 424Silica sand 10 9 9 14 11 18 21 28 56 47 48 52 53Coal 13 19 46 42 47 58 64 189 393 1,134 1,553 1,149 1,071Other nonmetallics 61 86 86 131 166 148 446 479 434 1,402 330 737 862 4
Base Metals 2,158 2,586 3,252 3,303 5,558 6,724 5,541 4,369 4,736 5,832 8,404 6,158 6,320Chromit 117 148 240 251 291 277 271 229 254 237 256 329 268Copper 1,640 1,842 1,927 2,164 3,690 4,409 3,782 3,446 4,047 4,970 5,967 5,461 5,871Iron ore/conc. 91 39 - - 1 - 1 - 1 - - 1 -Nickel 263 484 927 635 922 1,437 1,109 577 400 466 1,686 322 175Others /b 47 73 158 253 644 601 378 115 34 153 494 45 6
Total 3,949 4,424 5,404 6,070 9,107 12,820 11,877 11,302 13,641 17,886 21,708 21,766 24,821
/a Revised.
/b Zinc, lead, manganese, cobalt, pyrite and others.
Source: Bureau of Mines and Geo-Sciences, MNR.
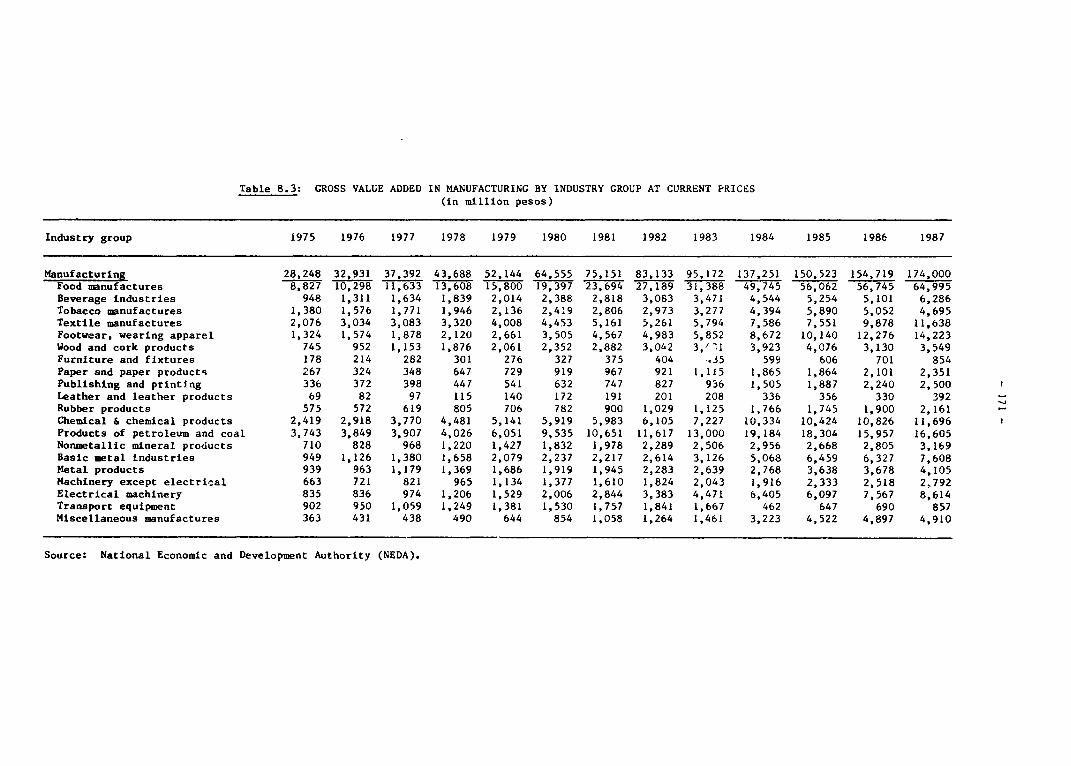
Table 8.3: GROSS VALUE ADDED IN MANUFACTURING BY INDUSTRY GROUP AT CURRENT PRICES(in million pesos)
Industry group 1975 1976 1977 1978 1979 1980 1981 1982 1983 1984 1985 1986 1987
Manufacturing 28,248 32,931 37,392 43,688 52,144 64,555 75,151 83,133 95,172 137,251 150,523 154,719 174,000Food manufactures 8,827 10,298 11,633 13,608 15,800 19,397 23,694 27,189 31,388 49,745 56,062 56,745 64,995Beverage industries 948 1,311 1,634 1,839 2,014 2,388 2,818 3,083 3,471 4,544 5,254 5,101 6,286Tobacco manufactures 1,380 1,576 1,771 1,946 2,136 2,4:9 2,806 2,973 3,277 4,394 5,890 5,052 4,695Textile manufactures 2,076 3,034 3,083 3,320 4,008 4,453 5,161 5,261 5,794 7,586 7,551 9,878 11,638Footwear, wearing apparel 1,324 1,574 1,878 2,120 2,661 3,505 4,567 4,983 5,852 8,672 10,140 12,276 14,223Wood and cork products 745 952 1,153 1,876 2,061 2,352 2,882 3,062 3,/'1 3,923 4,076 3,130 3,549Furniture and fixtures 178 214 282 301 276 327 375 404 ,35 599 606 701 854Paper and paper products 267 324 348 647 729 919 967 921 1,115 1,865 1,864 2,101 2,351Publishing and printing 336 372 398 447 541 632 747 827 936 1,505 1,887 2,240 2,500Leather and leather products 69 82 97 115 140 172 191 201 208 336 356 330 392Rubber products 575 572 619 805 706 782 900 1,029 1,125 1,766 1,745 1,900 2,161 -Chemical & chemical products 2,419 2,918 3,770 4,481 5,141 5,919 5,983 6,105 7,227 10,334 10,424 10,826 11,696Products of petroleum and coal 3,743 3,849 3,907 4,026 6,051 9,535 10,651 11,617 13,000 19,184 18,304 15,957 16,605Nonmetallic mineral products 710 828 968 1,220 1,427 1,832 1,978 2,289 2,506 2,956 2,668 2,805 3,169Basic metal industries 949 1,126 1,380 1,658 2,079 2,237 2,217 2,614 3,126 5,068 6,459 6,327 7,608Metal products 939 963 1,179 1,369 1,686 1,919 1,945 2,283 2,639 2,768 3,638 3,678 4,105Machinery except electrical 663 721 821 965 1,134 1,377 1,610 1,824 2,043 1,916 2,333 2,518 2,792Electrical machinery 835 836 974 1,206 1,529 2,006 2,844 3,383 4,471 6,405 6,097 7,567 8,614Transport equipment 902 950 1,059 1,249 1,381 1,530 1,757 1,841 1,667 462 647 690 857Miscellaneous manufactures 363 431 438 490 644 854 1,058 1,264 1,461 3,223 4,522 4,897 4,910
Source: National Economic and Development Authority (NEDA).
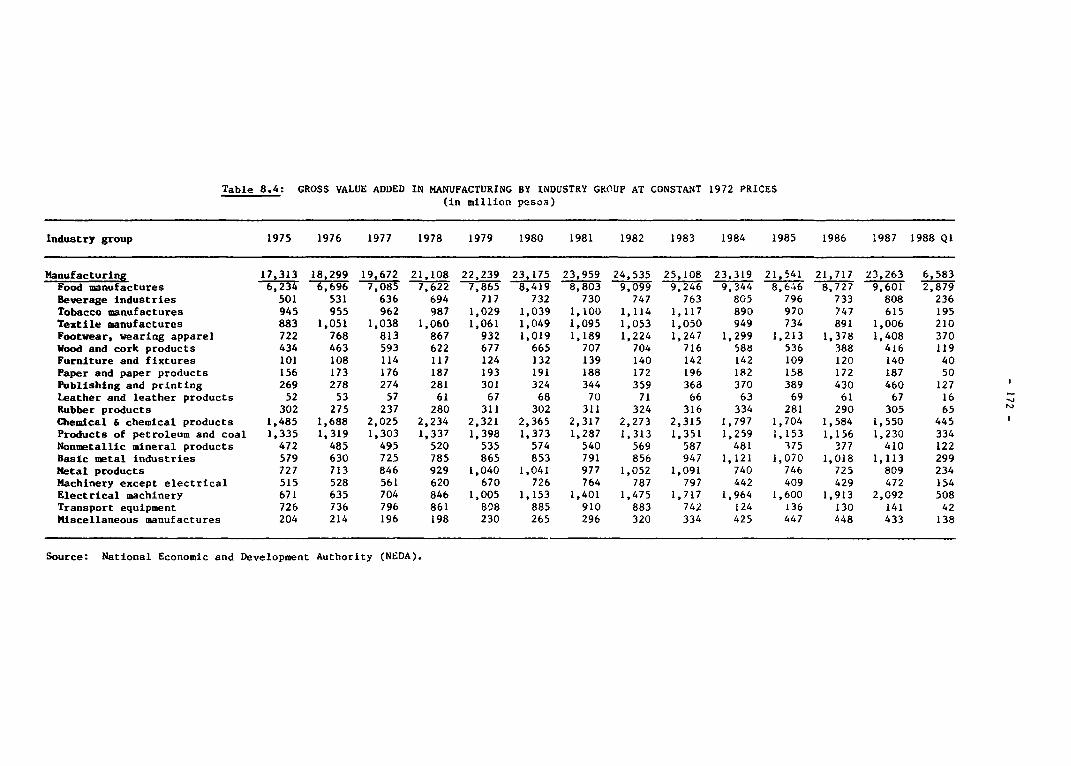
Table 8.4: GROSS VALUE ADDED IN MANUFACTURING BY INDUSTRY GROUP AT CONSTANT 1972 PRICES(in million pesos)
Industry group 1975 1976 1977 1978 1979 1980 1981 1982 1983 1984 1985 1986 1987 1988 Q1
Manufacturing 17,313 18,299 19,672 21,108 22,239 23,175 23,959 24,535 25,108 23,319 21,541 21,717 23,263 6,583Food manufactures 6,234 6,696 7,085 7,622 7,865 8,419 8,803 9,099 9,246 9,344 8,646 8,727 9,601 2,879Beverage industries 501 531 636 694 717 732 730 747 763 805 796 733 808 236Tobacco manufactures 945 955 962 987 1,029 1,039 1,100 1,114 1,117 890 970 747 615 195Textile manufactures 883 1,051 1,038 1,060 1,061 1,049 1,095 1,053 1,050 949 734 891 1,006 210Footwear, wearing apparel 722 768 813 867 932 1,019 1,189 1,224 1,247 1,299 1,213 1,378 1,408 370Wood and cork products 434 463 593 622 677 665 707 704 716 588 536 388 416 119Furniture and fixtures 101 108 114 117 124 132 139 140 142 142 109 120 140 40Paper and paper products 156 173 176 187 193 191 188 172 196 182 158 172 187 50Publishing and printing 269 278 274 281 301 324 344 359 368 370 389 430 460 127Leather and leather products 52 53 57 61 67 68 70 71 66 63 69 61 67 16Rubber products 302 275 237 280 311 302 311 324 316 334 281 290 305 65Chemical & chemical products 1,485 1,688 2,025 2,234 2,321 2,365 2,317 2,273 2,315 1,797 1,704 1,584 1,550 445Products of petroleum and coal 1,335 1,319 1,303 1,337 1,398 1,373 1,287 1,313 1,351 1,259 1,153 1,156 1,230 334Nonmetallic mineral products 472 485 495 520 535 574 540 569 587 481 375 377 410 122Basic metal industries 579 630 725 785 865 853 791 856 947 1,121 1,070 1,018 1,113 299Metal products 727 713 846 929 1,040 1,041 977 1,052 1,091 740 746 725 809 234Machinery except electrical 515 528 561 620 670 726 764 787 797 442 409 429 472 154Electrical machinery 671 635 704 846 1,005 1,153 1,401 1,475 1,717 1,964 1,600 1,913 2,092 508Transport equipment 726 736 796 861 898 885 910 883 742 124 136 130 141 42Miscellaneous manufactures 204 214 196 198 230 265 296 320 334 425 447 448 433 138
Source: National Economic and Development Authority (NEDA).
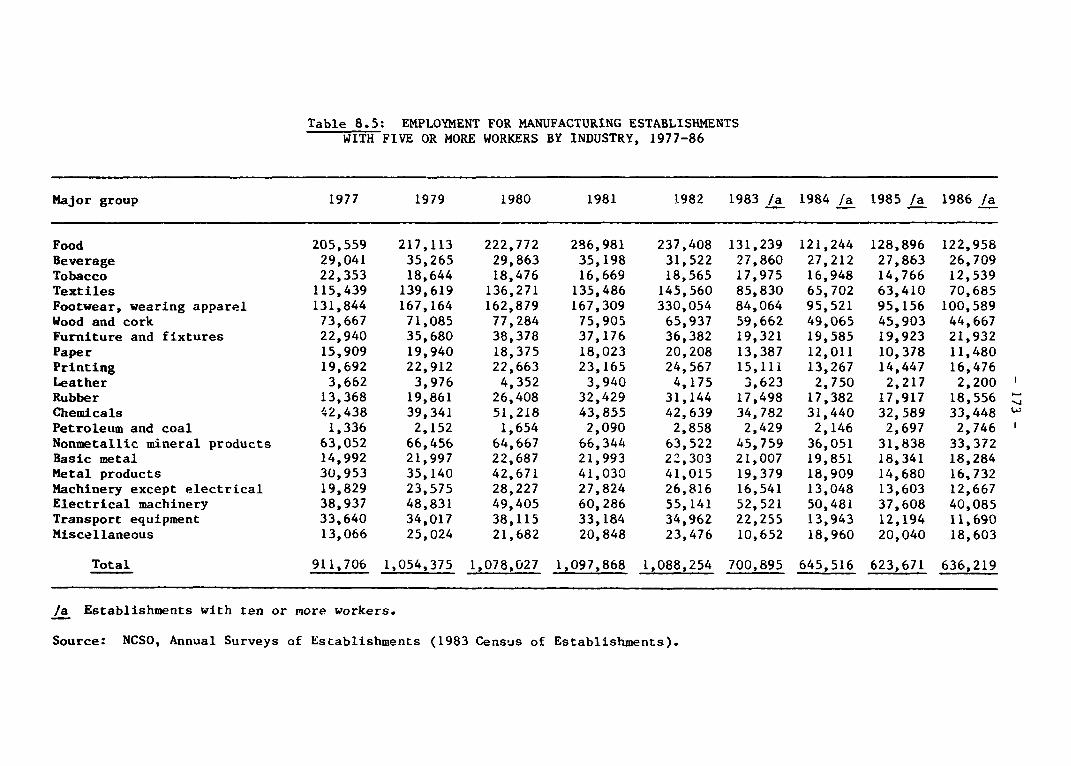
Table 8.5: EMPLOYMENT FOR MANUFACTURING ESTABLISHMENTSWITH FIVE OR MORE WORKERS BY INDUSTRY, 1977-86
Major group 1977 1979 1980 1981 1982 1983 /a 1984 /a 1985 /a 1986 /a
Food 205,559 217,113 222,772 286,981 237,408 131,239 121,244 128,896 122,958Beverage 29,041 35,265 29,863 35,198 31,522 27,860 27,212 27,863 26,709Tobacco 22,353 18,644 18,476 16,669 18,565 17,975 16,948 14,766 12,539Textiles 115,439 139,619 136,271 135,486 145,560 85,830 65,702 63,410 70,685Footwear, wearing apparel 131,844 167,164 162,879 167,309 330,054 84,064 95,521 95,156 100,589Wood and cork 73,667 71,085 77,284 75,905 65,937 59,662 49,065 45,903 44,667Furniture and fixtures 22,940 35,680 38,378 37,176 36,382 19,321 19,585 19,923 21,932Paper 15,909 19,940 18,375 18,023 20,208 13,387 12,011 10,378 11,480Printing 19,692 22,912 22,663 23,165 24,567 15,111 13,267 14,447 16,476Leather 3,662 3,976 4,352 3,940 4,175 3,623 2,750 2,217 2,200 1Rubber 13,368 19,861 26,408 32,429 31,144 17,498 17,382 17,917 18,556 -Chemicals 42,438 39,341 51,218 43,855 42,639 34,782 31,440 32,589 33,448 -Petroleum and coal 1,336 2,152 1,654 2,090 2,858 2,429 2,146 2,697 2,746 1Nonmetallic mineral products 63,052 66,456 64,667 66,344 63,522 45,759 36,051 31,838 33,372Basic metal 14,992 21,997 22,687 21,993 22,303 21,007 19,851 18,341 18,284Metal products 30,953 35,140 42,671 41,030 41,015 19,379 18,909 14,680 16,732Machinery except electrical 19,829 23,575 28,227 27,824 26,816 16,541 13,048 13,603 12,667Electrical machinery 38,937 48,831 49,405 60,286 55,141 52,521 50,481 37,608 40,085Transport equipment 33,640 34,017 38,115 33,184 34,962 22,255 13,943 12,194 11,690Miscellaneous 13,066 25,024 21,682 20,848 23,476 10,652 18,960 20,040 18,603
Total 911,706 1,054,375 1,078,027 1,097,868 1,088,254 700,895 645,516 623,671 636,219
/a Establishments with ten or more workers.
Source: NCSO, Annual Surveys of Establishments (1983 Census of Establishments).
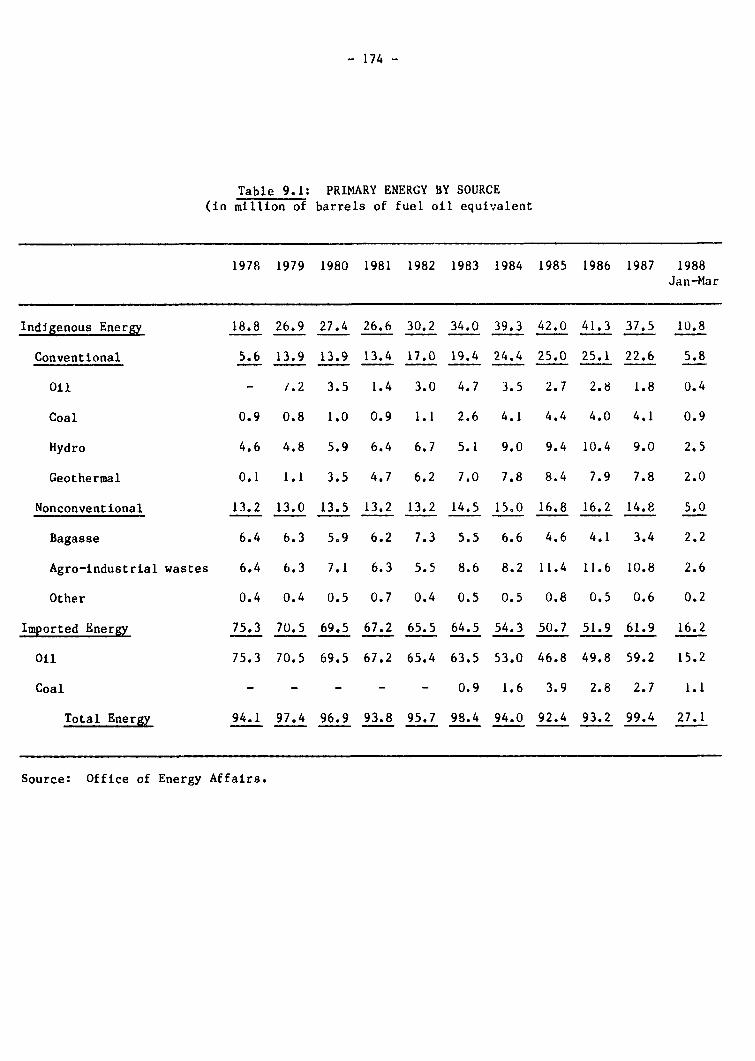
- 174 -
Table 9.1: PRIMARY ENERGY BY SOURCE(in million of barrels of fuel oil equivalent
1978 1979 1980 1981 1982 1983 1984 1985 1986 1987 1988Jan-Mar
Indigenous Energy 18.8 26.9 27.4 26.6 30.2 34.0 39.3 42.0 41.3 37.5 10.8
Conventional 5.6 13.9 13.9 13.4 17.0 19.4 24.4 25.0 25.1 22.6 5.8
Oil - /.2 3.5 1.4 3.0 4.7 3.5 2.7 2.8 1.8 0.4
Coal 0.9 0.8 1.0 0.9 1.1 2.6 4.1 4.4 4.0 4.1 0.9
Hydro 4.6 4.8 5.9 6.4 6.7 5.1 9.0 9.4 10.4 9.0 2.5
Geothermal 0.1 1.1 3.5 4.7 6.2 7.0 7.8 8.4 7.9 7.8 2.0
Nonconventional 13.2 13.0 13.5 13.2 13.2 14.5 15,0 16.8 16.2 14.8 5.0
Bagasse 6.4 6.3 5.9 6.2 7.3 5.5 6.6 4.6 4.1 3.4 2.2
Agro-industrial wastes 6.4 6.3 7.1 6.3 5.5 8.6 8.2 11.4 11.6 10.8 2.6
Other 0.4 0.4 0.5 0.7 0.4 0.5 0.5 0.8 0.5 0.6 0.2
Imported Energy 75.3 70.5 69.5 67.2 65.5 64.5 54.3 50.7 51.9 61.9 16.2
Oil 75.3 70.5 69.5 67.2 65.4 63.5 53.0 46.8 49.8 59.2 15.2
Coal - - - - - 0.9 1.6 3.9 2.8 2.7 1.1
Total Energy 94.1 97.4 96.9 93.8 95.7 98.4 94.0 92.4 93.2 99.4 27.1
Source: Office of Energy Affairs.
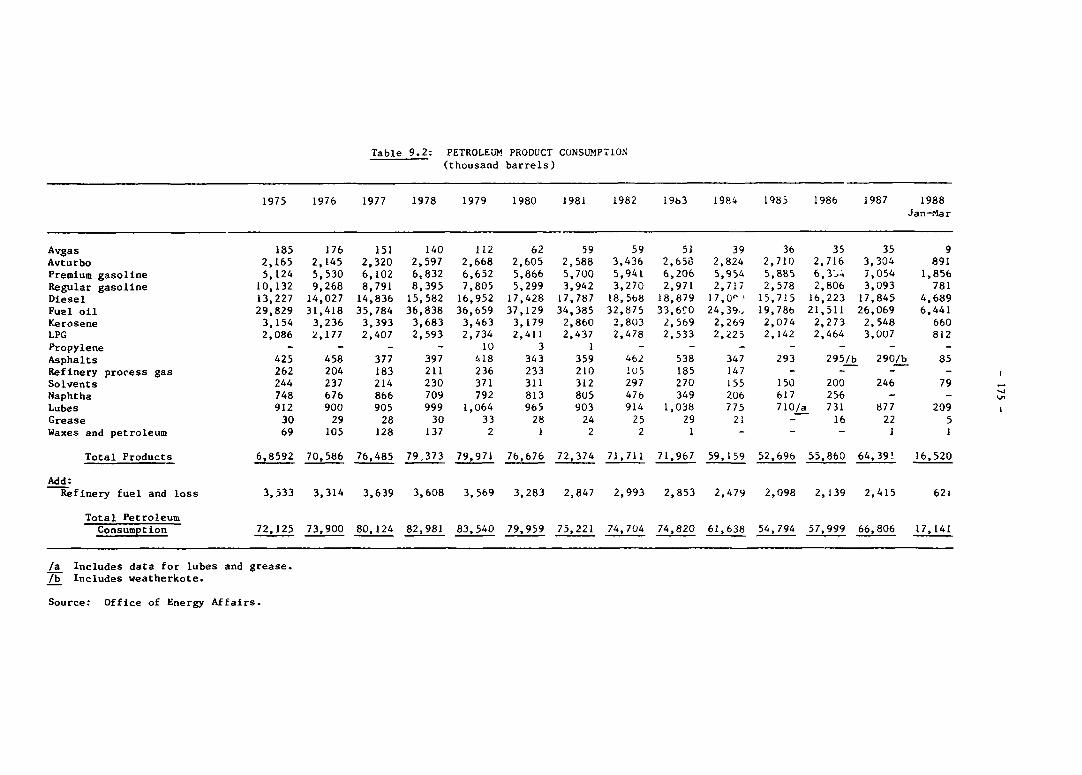
Table 9.2: PETROLEUM PRODUCT CONSUMPTION(thousand barrels)
1975 1976 1977 1978 1979 1980 1981 1982 19b3 1984 1985 1986 1987 1988Jan-tiar
Avgas 185 176 151 140 112 62 59 59 51 39 36 35 35 9Avturbo 2,165 2,145 2,320 2,597 2,668 2,605 2,588 3,436 2,653 2,824 2,710 2,716 3,304 891Premium gasoline 5,124 5,530 6,102 6,832 6,652 5,866 5,700 5,941 6,206 5,954 5,885 6,3;_ 7,054 1,856Regular gasoline 10,132 9,268 8,791 8,395 7,805 5,299 3,942 3,270 2,971 2,717 2,578 2,806 3,093 781Diesel 13,227 14,027 14,836 15,582 16,952 17,428 17,787 18,568 18,879 17,0-' 15,715 16,223 17,845 4,689Fuel oil 29,829 31,418 35,784 36,838 36,659 37,129 34,385 32,875 33,690 24,39., 19,786 21,511 26,069 6,441Kerosene 3,154 3,236 3,393 3,683 3,463 3,179 2,860 2,803 2,569 2,269 2,074 2,273 2,548 660LPG 2,086 2,177 2,407 2,593 2,734 2,411 2,437 2,478 2,533 2,225 2,142 2,464 3,007 812Propylene - - - - 10 3 1 - - - - - - -Asphalts 425 458 377 397 418 343 359 462 538 347 293 295/b 290/b 85Refinery process gas 262 204 183 211 236 233 210 105 185 147 - - - -Solvents 244 237 214 230 371 311 312 297 270 155 150 200 246 79Naphtha 748 676 866 709 792 813 805 476 349 206 617 256 - -Lubes 912 900 905 999 1,064 965 903 914 1,038 775 710/a 731 877 209Grease 30 29 28 30 33 28 24 25 29 21 - 16 22 5Waxes and petroleum 69 105 128 137 2 1 2 2 1 - - - I I
Total Products 6,8592 70,586 76,485 79,373 79,971 76,676 72,374 71,711 71,967 59,159 52,696 55,860 64,39' 16,520
Add:Refinery fuel and loss 3,333 3,314 3,639 3,608 3,569 3,283 2,847 2,993 2,853 2,479 2,098 2,139 2,415 621
Total PetroleumConsumption 72,125 73,900 80,124 82,981 83,540 79,959 75,221 74,704 74,820 61,638 54,794 57,999 66,806 17,141
/a Includes data for lubes and grease.|b Includes weatherkote.
Source: Office of Energy Affairs.

Table 9.3: DEPENDENCE OF ENERGY CONSUMPTION ON IMPORTED ENERGY(in millions of barrels of oil fuel equivalent)
1978 1979 1980 1981 1982 1983 1984 1985 1986 1987 1988Jan-Mar
Energy Consumption 94.13 97.42 96.88 93.46 95.58 98.47 93.58 92.39 93.28 99.35 27.08
Petroleum Used for Energy /a 75.34 77.68 72.96 68.53 68.32 68.19 56.21 49.52 52.61 60.93 15.59From imports 75.34 70.50 69.45 67.16 65.37 63.54 52.67 46.82 49.7$ 59.18 15.17From domestic production - 7.18 3.51 1.37 2.95 4.65 3.54 2.70 2.85 1.75 0.42
Coal Used for Energy /b 0.93 0.82 0.96 0.90 1.11 3.54 5.67 8.28 6.19 6.78 1.98From imports - - - - - 0.91 1.61 3.90 2.17 2.70 1.08From domestic production 0.93 0.82 0.96 0.90 1.11 2.63 4.06 4.38 4.02 4.08 0.90
Total Imported Energy(MBOE) 75.34 70.50 69.45 67.16 65.37 64.45 54.28 50.72 51.93 61.88 16.25
Dependence on total importedenergy (%) /c 80 72 72 72 68 65 58 55 56 62 60
/a Excludes nonenergy petroleum consumption which has been about 2.8 million barrels annually. It isassumed that all domestic petroleum production is used for energy.
/b One MT coal (at 10,000 Btu/lb) is equivalent to 3.53 BOE.
/c Ratio of total imported energy to total energy consumption.
Sources: Office of Energy Affairs.
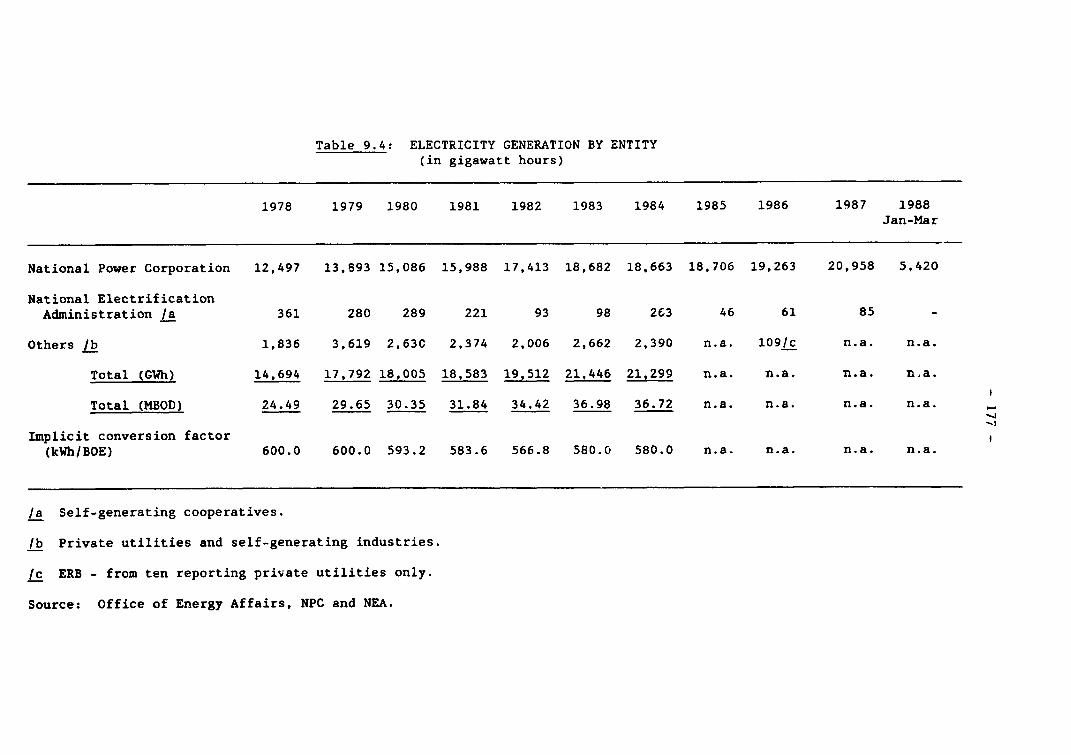
Table 9.4: ELECTRICITY GENERATION BY ENTITY(in gigawatt hours)
1978 1979 1980 1981 1982 1983 1984 1985 1986 1987 1988Jan-Mar
National Power Corporation 12,497 13,893 15,086 15,988 17,413 18,682 18,663 18,706 19,263 20,958 5,420
National ElectrificationAdministration /a 361 280 289 221 93 98 263 46 61 85 -
Others lb 1,836 3,619 2,63C 2,374 2,006 2,662 2,390 n.a. 109/c n.a. n.a.
Total (GWh) 14,694 17,792 18,005 18,583 19,512 21,446 21,299 n.a. n.a. n.a. n.a.
Total (MBOD) 24.49 29.65 30.35 31.84 34.42 36.98 36.72 n.a. n.a. n.a. n.a.
Implicit conversion factor(kWh/BOE) 600.0 600.0 593.2 583.6 566.8 580.0 580.0 n.a. n.a. n.a. n.a.
/a Self-generating cooperatives.
/b Private utilities and self-generating industries.
/c ERB - from ten reporting private utilities only.
Source: Office of Energy Affairs, NPC and NEA.
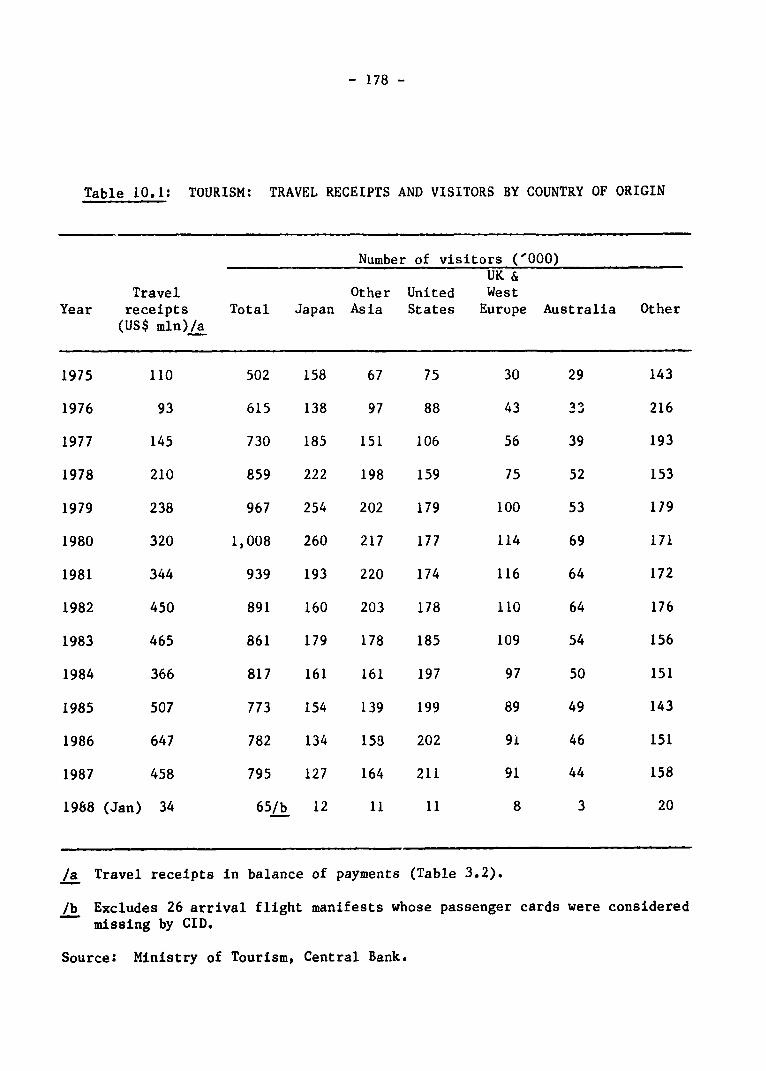
- 178 -
Table 10.1: TOURISM: TRAVEL RECEIPTS AND VISITORS BY COUNTRY OF ORIGIN
Number of visitors ('000)UK &
Travel Other United WestYear receipts Total Japan Asia States Europe Australia Other
(US$ mln)/a
1975 110 502 158 67 75 30 29 143
1976 93 615 138 97 88 43 3 216
1977 145 730 185 151 106 56 39 193
1978 210 859 222 198 159 75 52 153
1979 238 967 254 202 179 100 53 179
1980 320 1,008 260 217 177 114 69 171
1981 344 939 193 220 174 116 64 172
1982 450 891 160 203 178 110 64 176
1983 465 861 179 178 185 109 54 156
1984 366 817 161 161 197 97 50 151
1985 507 773 154 139 199 89 49 143
1986 647 782 134 153 202 9i 46 151
1987 458 795 127 164 211 91 44 158
1988 (Jan) 34 65/b 12 11 11 8 3 20
/a Travel receipts in balance of payments (Table 3.2).
/b Excludes 26 arrival flight manifests whose passenger cards were consideredmissing by CID.
Source: Ministry of Tourism, Central Bank.
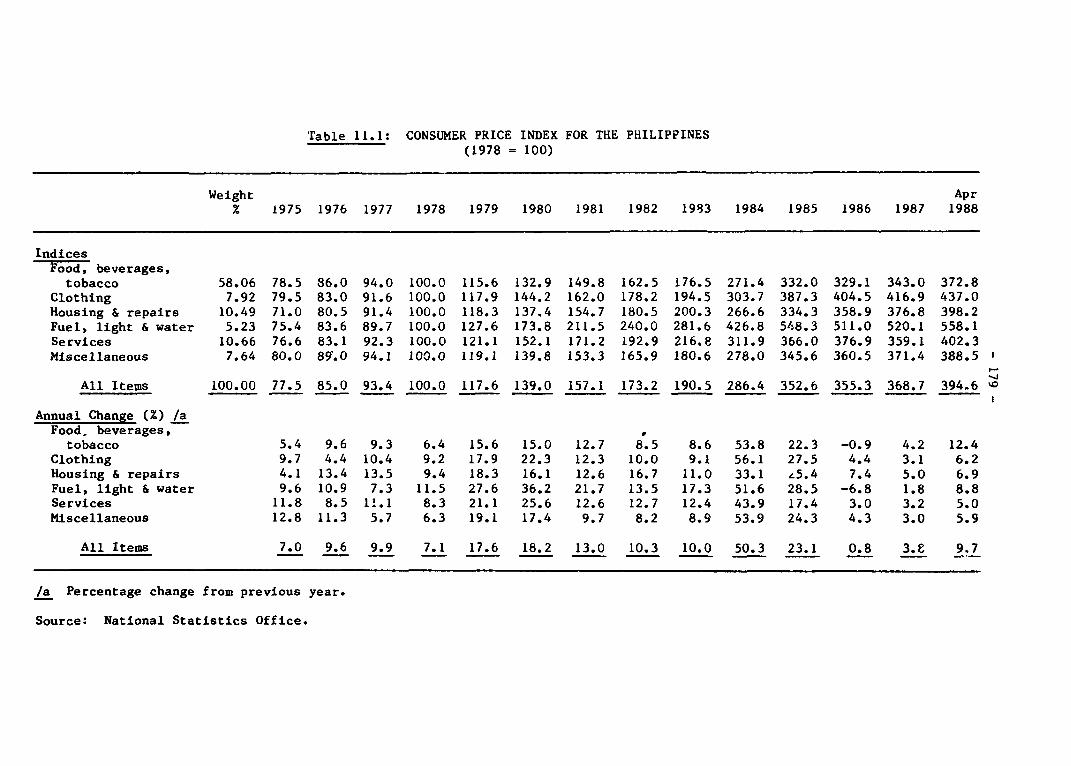
Table 11.1: CONSUMER PRICE INDEX FOR THE PHILIPPINES(1978 = 100)
Weight AprX 1975 1976 1977 1978 1979 1980 1981 1982 1983 1984 1985 1986 1987 1988
IndicesFood, beverages,tobacco 58.06 78.5 86.0 94.0 100.0 115.6 132.9 149.8 162.5 176.5 271.4 332.0 329.1 343.0 372.8
Clothing 7.92 79.5 83.0 91.6 100.0 117.9 144.2 162.0 178.2 194.5 303.7 387.3 404.5 416.9 437.0Housing & repairs 10.49 71.0 80.5 91.4 100.0 118.3 137.4 154.7 180.5 200.3 266.6 334.3 358.9 376.8 398.2Fuel, light & water 5.23 75.4 83.6 89.7 100.0 127.6 173.8 211.5 240.0 281.6 426.8 548.3 511.0 520.1 558.1Services 10.66 76.6 83.1 92.3 100.0 121.1 152.1 171.2 192.9 216.8 311.9 366.0 376.9 359.1 402.3Miscellaneous 7.64 80.0 89.0 94.1 100.0 119.1 139.8 153.3 165.9 180.6 278.0 345.6 360.5 371.4 388.5
All Items 100.00 77.5 85.0 93.4 100.0 117.6 139.0 157.1 173.2 190.5 286.4 352.6 355.3 368.7 394.6
Annual Change (%) /aFood. beverages, 0tobacco 5.4 9.6 9.3 6.4 15.6 15.0 12.7 8.5 8.6 53.8 22.3 -0.9 4.2 12.4
Clothing 9.7 4.4 10.4 9.2 17.9 22.3 12.3 10.0 9.1 56.1 27.5 4.4 3.1 6.2Housing & repairs 4.1 13.4 13.5 9.4 18.3 16.1 12.6 16.7 11.0 33.1 z5.4 7.4 5.0 6.9Fuel, light & water 9.6 10.9 7.3 11.5 27.6 36.2 21.7 13.5 17.3 51.6 28.5 -6.8 1.8 8.8Services 11.8 8.5 1!.1 8.3 21.1 25.6 12.6 12.7 12.4 43.9 17.4 3.0 3.2 5.0Miscellaneous 12.8 11.3 5.7 6.3 19.1 17.4 9.7 8.2 8.9 53.9 24.3 4.3 3.0 5.9
All Items 7.0 9.6 9.9 7.1 17.6 18.2 13.0 10.3 10.0 50.3 23.1 0.8 3.8 9.7
/a Percentage change from previous year.
Source: National Statistics Office.

Table 11.2: WHOLESALE PRICE INDICES FOR METRO MANILA(1978 =100)
1978 1979 1980 1981 1982 1983 1984 1985 1986 1987 1988Mar
IndicesFood 100.0 116.2 133.2 156.5 178.4 207.2 357.3 457.9 465.9 501.6 567.5Beverages and tobacco 100.0 115.0 134.6 147.2 160.2 178.2 265.9 322.1 359.4 428.7 459.8Crude materials, inedible except fuel 100.0 125.3 137.9 139.6 164.9 217.7 356.0 325.3 310.1 367.4 449.5Mineral fuels 100.0 128.4 203.0 255.1 260.9 331.0 503.7 562.4 491.8 467.2 479.5Chemicals 100.0 121.1 135.4 137.7 147.5 183.2 333.9 337.5 324.1 374.7 417.8Manufactured goods 100.0 121.0 146.1 162.8 170.3 184.3 294.6 356.3 373.7 399.6 434.1Machinery & transport equipment 100.0 110.7 123.9 136.9 155.2 173.3 274.1 351.0 371.1 392.4 423.1Miscellaneous manufactured articles 100.0 115.3 140.0 157.7 173.6 189.8 333.1 441.0 474.1 495.7 525.1
All Items 100.0 119.0 140.8 159.2 176.3 208.0 346.5 409.3 410.6 444.0 496.1 00
Annual Change ()/aFood 16.2 14.6 17.5 14.0 16.1 72.4 28.2 1.7 7.7 22.3Beverages and tobacco 15.0 17.0 9.4 8.8 11.2 49.2 21.1 11.6 19.3 10.2Crude materials, inedible except fuel 25.3 10.1 1.2 18.1 32.0 63.5 -8.6 -4.7 18.5 30.6Mineral fuels 28.4 58.1 25.7 2.3 26.9 52.2 11.6 -12.6 -5.0 3.5Chemicals 21.1 11.8 1.7 7.1 24.2 82.3 1.1 -4.0 15.6 16.6Manufactured goods 21.0 20.7 11.4 4.6 8.2 59.8 20.9 4.9 6.9 12.2Machinery & transport equipment 10.7 11.9 10.5 13.4 11.7 58.2 28.0 5.7 5.7 9.2Miscellaneous manufactured articles 15.3 21.4 12.6 10.1 9.3 75.5 32.4 7.5 4.6 7.7
All Items 19.0 18.3 13.1 10.7 18.0 66.6 18.1 0.3 8.1 17.9
/a Percentage change from previous year.
Source: National Statistics Office.
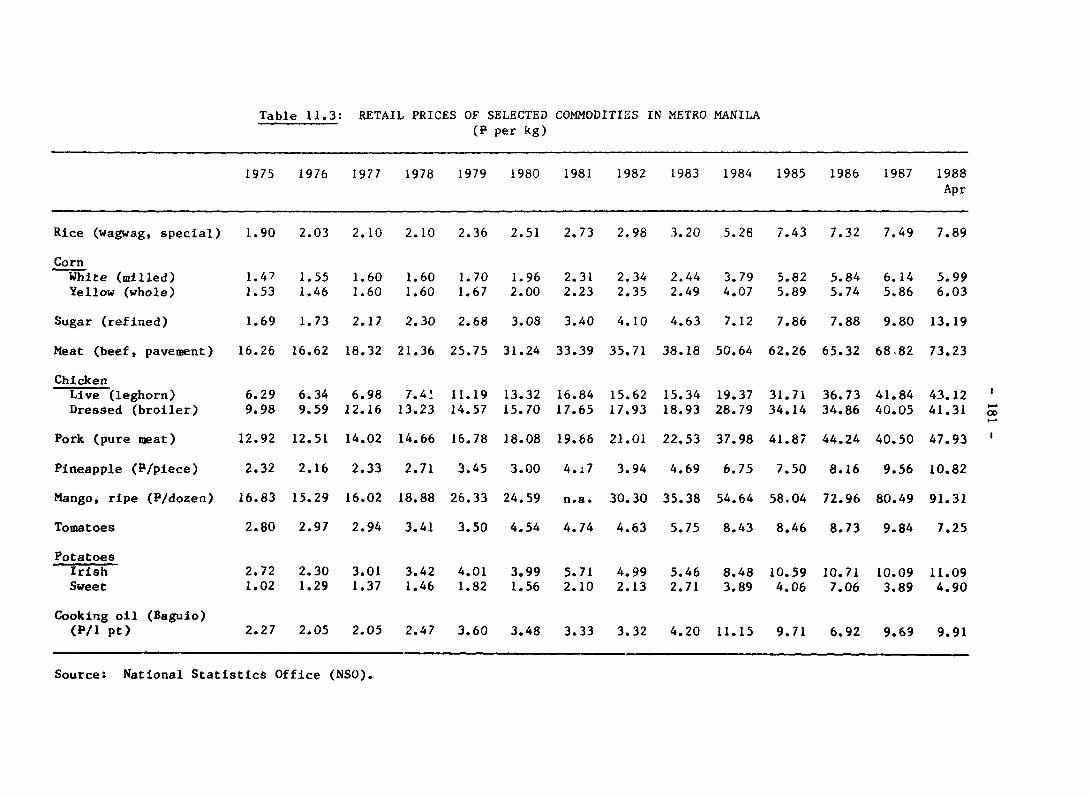
Table 11.3: RETAIL PRICES OF SELECTED COMMODITIES IN METRO MANILA(P per kg)
1975 1976 1977 1978 1979 1980 1981 1982 1983 1984 1985 1986 1987 1988Apr
Rice (wagwag, special) 1.90 2.03 2.10 2.10 2.36 2.51 2.73 2.98 3.20 5.28 7.43 7.32 7.49 7.89CornWhite (milled) 1.47 1.55 1.60 1.60 1.70 1.96 2.31 2.34 2.44 3.79 5.82 5.84 6.14 5.99Yellow (whole) 1.53 1.46 1.60 1.60 1.67 2.00 2.23 2.35 2.49 4.07 5.89 5.74 5.86 6.03
Sugar (refined) 1.69 1.73 2.17 2.30 2.68 3.08 3.40 4.10 4.63 7.12 7.86 7.88 9.80 13.19Meat (beef, pavement) 16.26 16.62 18.32 21.36 25.75 31.24 33.39 35.71 38.18 50.64 62.26 65.32 68 82 73.23ChickenLive (leghorn) 6.29 6.34 6.98 7.4! 11.19 13.32 16.84 15.62 15.34 19.37 31.71 36.73 41.84 43.12 1Dressed (broiler) 9.98 9.59 12.16 13.23 14.57 15.70 17.65 17.93 18.93 28.79 34.14 34.86 40.05 41.31 X
Pork (pure meat) 12.92 12.51 14.02 14.66 16.78 18.08 19.66 21.01 22.53 37.98 41.87 44.24 40.50 47.93Pineapple (P/piece) 2.32 2.16 2.33 2.71 3.45 3.00 4.:7 3.94 4.69 6.75 7.50 8.16 9.56 10.82Mango, ripe (P/dozen) 16.83 15.29 16.02 18.88 26.33 24.59 n.a. 30.30 35.38 54.64 58,04 72.96 80.49 91.31Tomatoes 2.80 2.97 2.94 3.41 3.50 4.54 4.74 4.63 5.75 8.43 8.46 8.73 9.84 7.25PotatoesIrish 2.72 2.30 3.01 3.42 4.01 3.99 5.71 4.99 5.46 8.48 10.59 10.71 10.09 11.09Sweet 1.02 1.29 1.37 1.46 1.82 1.56 2.10 2.13 2.71 3.89 4.06 7.06 3.89 4.90
Cooking oil (Baguio)(P/1 Pt) 2.27 2.05 2.05 2.47 3.60 3.48 3.33 3.32 4.20 11.15 9.71 6.92 9.69 9.91
Source: National Statistics Office (NSO).
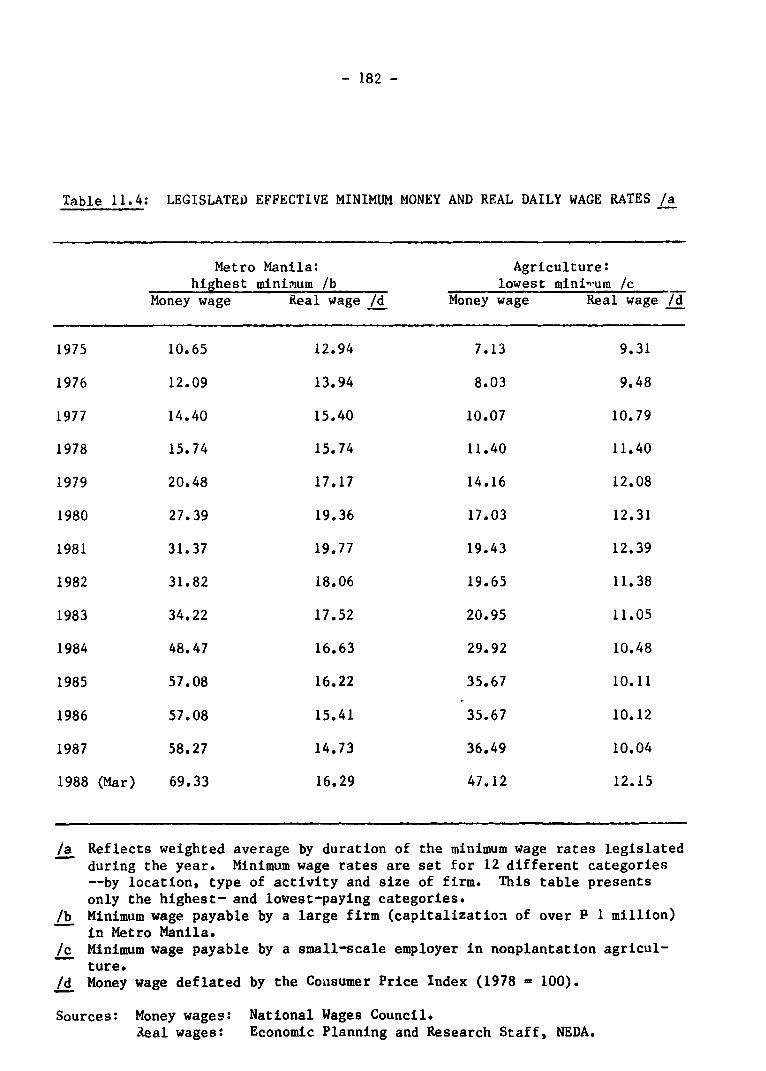
- 182 -
Table 11.4: LEGISLATED EFFECTIVE MINIMUM MONEY AND REAL DAILY WAGE RATES /a
Metro Manila: Agriculture:highest minimum /b lowest mini"um /c
Money wage Real wage /d Money wage Real wage /d
1975 10.65 12.94 7.13 9.31
1976 12.09 13.94 8.03 9.48
1977 14.40 15.40 10.07 10.79
1978 15.74 15.74 11.40 11.40
1979 20.48 17.17 14.16 12.08
1980 27.39 19.36 17.03 12.31
1981 31.37 19.77 19.43 12.39
1982 31.82 18.06 19.65 11.38
1983 34.22 17.52 20.95 11.05
1984 48.47 16.63 29.92 10.48
1985 57.08 16.22 35.67 10.11
1986 57.08 15.41 35.67 10.12
1987 58.27 14.73 36.49 10.04
1988 (Mar) 69.33 16.29 47.12 12.15
/a Reflects weighted average by duration of the minimum wage rates legislatedduring the year. Minimum wage rates are set for 12 different categories--by location, type of activity and size of firm. This table presentsonly the highest- and lowest-paying categories.
/b Minimum wage payable by a large firm (capitalization of over E 1 million)in Metro Manila.
/c Minimum wage payable by a small-scale employer in nonplantation agricul-ture.
/d Money wage deflated by the Consumer Price Index (1978 = 100).
Sources: Money wages: National Wages Council.deal wages: Economic Planning and Research Staff, NEDA.
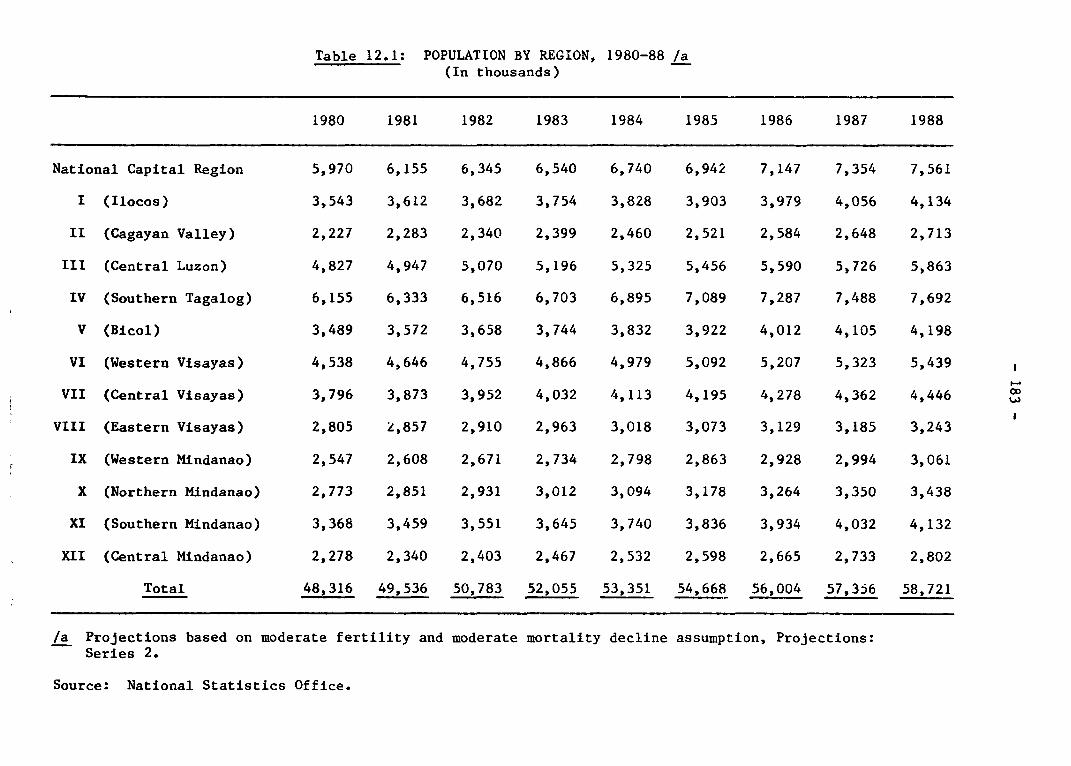
Table 12.1: POPULATION BY REGION, 1980-88 /a(In thousands)
1980 1981 1982 1983 1984 1985 1986 1987 1988
National Capital Region 5,970 6,155 6,345 6,540 6,740 6,942 7,147 7,354 7,561
I (Ilocos) 3,543 3,612 3,682 3,754 3,828 3,903 3,979 4,056 4,134
II (Cagayan Valley) 2,227 2,283 2,340 2,399 2,460 2,521 2,584 2,648 2,713
III (Central Luzon) 4,827 4,947 5,070 5,196 5,325 5,456 5,590 5,726 5,863
IV (Southern Tagalog) 6,155 6,333 6,516 6,703 6,895 7,089 7,287 7,488 7,692
V (Bicol) 3,489 3,572 3,658 3,744 3,832 3,922 4,012 4,105 4,198
VI (Western Visayas) 4,538 4,646 4,755 4,866 4,979 5,092 5,207 5,323 5,439
VII (Central Visayas) 3,796 3,873 3,952 4,032 4,113 4,195 4,278 4,362 4,446
VIII (Eastern Visayas) 2,805 Z,857 2,910 2,963 3,018 3,073 3,129 3,185 3,243
IX (Western Mindanao) 2,547 2,608 2,671 2,734 2,798 2,863 2,928 2,994 3,061
X (Northern Mindanao) 2,773 2,851 2,931 3,012 3,094 3,178 3,264 3,350 3,438
XI (Southern Mindanao) 3,368 3,459 3,551 3,645 3,740 3,836 3,934 4,032 4,132
XII (Central Mindanao) 2,278 2,340 2,403 2,467 2,532 2,598 2,665 2,733 2,802
Total 48,316 49,536 50,783 52,055 53,351 54,668 56,004 57,3i6 58,721
/a Projections based on moderate fertility and moderate mortality decline assumption, Projections:Series 2.
Source: National Statistics Office.
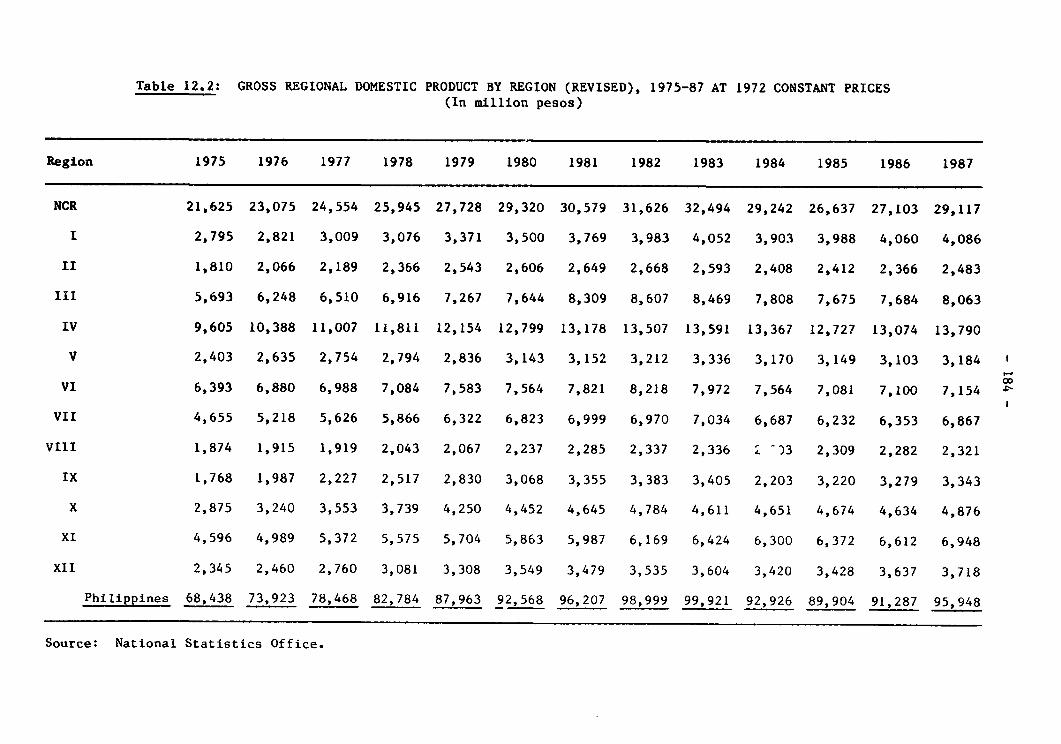
Table 12.2: GROSS REGIONAL DOMESTIC PRODUCT BY REGION (REVISED), 1975-87 AT 1972 CONSTANT PRICES(In million pesos)
Region 1975 1976 1977 1978 1979 1980 1981 1982 1983 1984 1985 1986 1987
NCR 21,625 23,075 24,554 25,945 27,728 29,320 30,579 31,626 32,494 29,242 26,637 27,103 29,117
I 2,795 2,821 3,009 3,076 3,371 3,500 3,769 3,983 4,052 3,903 3,988 4,060 4,086
II 1,810 2,066 2,189 2,366 2,543 2,606 2,649 2,668 2,593 2,408 2,412 2,366 2,483
III 5,693 6,248 6,510 6,916 7,267 7,644 8,309 8,607 8,469 7,808 7,675 7,684 8,063
IV 9,605 10,388 11,007 11,811 12,154 12,799 13,178 13,507 13,591 13,367 12,727 13,074 13,790
V 2,403 2,635 2,754 2,794 2,836 3,143 3,152 3,212 3,336 3,170 3,149 3,103 3,184
VI 6,393 6,880 6,988 7,084 7,583 7,564 7,821 8,218 7,972 7,564 7,081 7,100 7,154
VII 4,655 5,218 5,626 5,866 6,322 6,823 6,999 6,970 7,034 6,687 6,232 6,353 6,867
VIlI 1,874 1,915 1,919 2,043 2,067 2,237 2,285 2,337 2,336 2 -)3 2,309 2,282 2,321
IX 1,768 1,987 2,227 2,517 2,830 3,068 3,355 3,383 3,405 2,203 3,220 3,279 3,343
X 2,875 3,240 3,553 3,739 4,250 4,452 4,645 4,784 4,611 4,651 4,674 4,634 4,876
XI 4,596 4,989 5,372 5,575 5,704 5,863 5,987 6,169 6,424 6,300 6,372 6,612 6,948
XII 2,345 2,460 2,760 3,081 3,308 3,549 3,479 3,535 3,604 3,420 3,428 3,637 3,718
Philippines 68,438 73,923 78,468 82,784 87,963 92,568 96,207 98,999 99,921 92,926 89,904 91,287 95,948
Source: National Statistics Office.
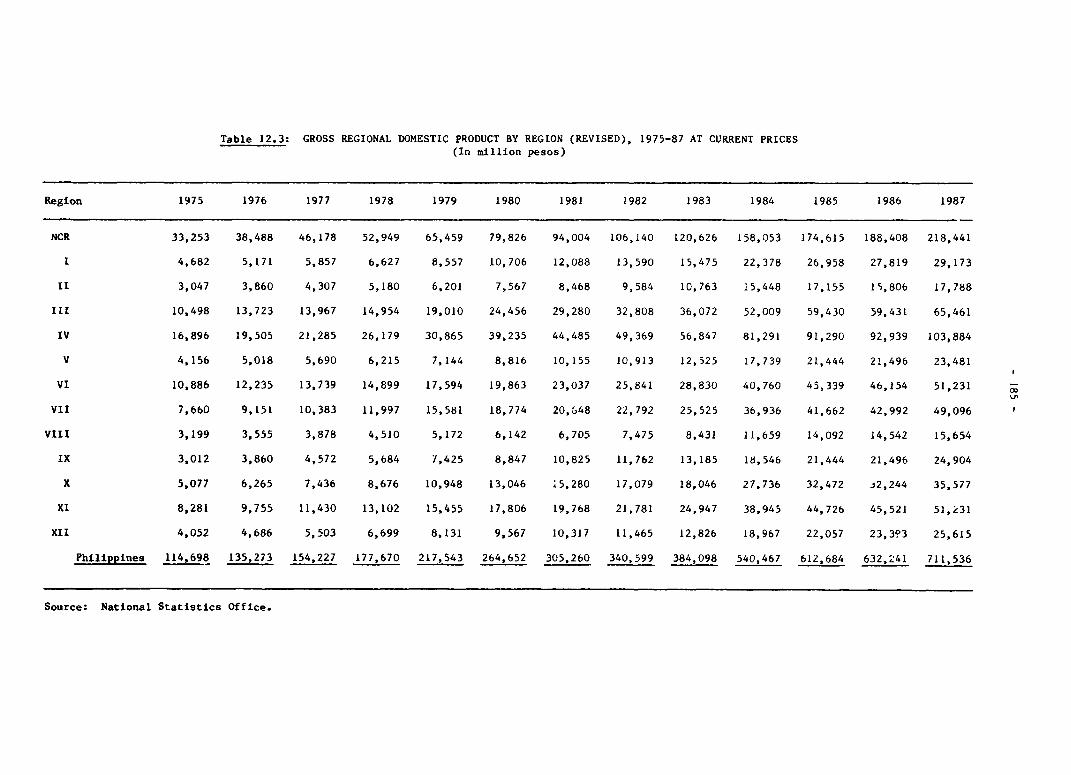
Table 12.3: GROSS REGIONAL DOMESTIC PRODUCT BY REGION (REVISED), 1975-87 AT CURRENT PRICES(In million pesos)
Region 1975 1976 1977 1978 1979 1980 1981 1982 1983 1984 1985 1986 1987
NCR 33,253 38,488 46,178 52,949 65,459 79,826 94,004 106,140 120,626 158,053 174,615 188,408 218,441
1 4,682 5,171 5,857 6,627 8,557 10,706 12,088 13,590 15,475 22,378 26,958 27,819 29,173II 3,047 3,860 4,307 5,180 6,201 7,567 8,468 9,584 10,763 15,448 17,155 15,806 17,788
III 10,498 13,723 13,967 14,954 19,010 24,456 29,280 32,808 36,072 52,009 59,430 59,431 65,461IV 16,896 19,505 21,285 26,179 30,865 39,235 44,485 49,369 56,847 81,291 91,290 92,939 103,884
V 4,156 5,018 5,690 6,215 7,144 8,816 10,155 10,913 12,525 17,739 21,444 21,496 23,481
VI 10,886 12,235 13,739 14,899 17,594 19,863 23,037 25,841 28,830 40,760 45,339 46,154 51,231
VII 7,660 9,151 10,383 11,997 15,581 18,774 20,848 22,792 25,525 36,936 41,662 42,992 49,096
VIII 3,199 3,555 3,878 4,510 5,172 6,142 6,705 7,475 8,431 11,659 14,092 14,542 15,654
IX 3,012 3,860 4,572 5,684 7,425 8,847 10,825 11,762 13,185 18,546 21,444 21,496 24,904
X 5,077 6,265 7,436 8,676 10,948 13,046 ;5,280 17,079 18,046 27,736 32,472 i2,244 35,577XI 8,281 9,755 11,430 13,102 15,455 17,806 19,768 21,781 24,947 38,945 44,726 45,521 51,Ž31
XII 4,052 4,686 5,503 6,699 8,131 9,567 10,317 11,465 12,826 18,967 22,057 23,393 25,615
Philippines 114,698 135,273 154,227 177,670 217,543 264,652 305,260 340,599 384,098 540,467 612,684 632,241 711,536
Source: National Statistics Office.
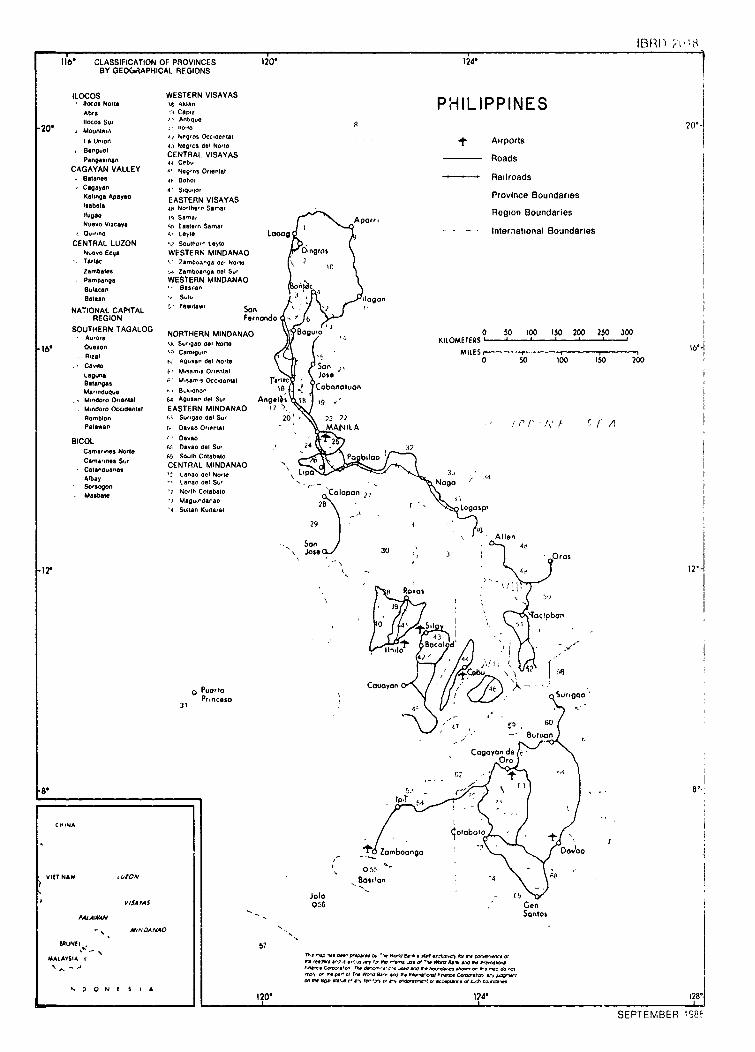
IBRI) t '1811`6 CLASSIFICATION OF PROVINCES 120' 124
BY GEOGAAPHICAL REGIONS
ILOCOS WESTERN VISAYASllocos Nort U3 Akia. P HI L I P PINE SA'a bs Cao
20' Moo,ta 2 Ant,auc P0'
a4 t3"n , tag'os o0,0rtal t Airports43 Ngcs de'l Nolol
.Beogoet CENTRAt. VISAYAS __RoadsPanoga,nao 4, Cebo
CAGAYAN VALLEY A' Nos Onentat-aitnes ,6F Bobo0 RailroadsCagavan 4 Srqu'lo'Kalloga Apayoa EASTERN VISAYAS Province Boundariessabelat 4h No'the'r Sa,a RegIon Boundarieslope to SOA'a, ApoU'N.eoo V'ecaya casre,I, Same, I - - - interiational BojndarlesO-."ne Letts Laoag
CENTRAL LUZON 12 SOothe"' Ltt eNwe,o Ec.Ia WESTERN MINDANAO 09,00 \Teasc ' Zan,bo,,ogo do Nomlt
Zambales 'A ZSb.bo.ng. oel S.'PamWpotoa WESTERN MINDANAOBolactl 95,,
1tw4C
Batsan SOl J logo.
NA.IONAL CAPITAL 5' Ta.WdIa.. Son / '2REGION Fernando '
SOUTHERN TAGALOG N ORTHERNogu o 80900 0 50 1,0 I50 200 250 300*A.'o'sNRHRNMNAA KILOMETERS
16 O.ozon 'oSo'*gao del NoneMIES
R.zal AF.^ A0ar4 dcl No'te n 5 00 200
Lag.na 6 M On-s 0-1al01 Jossnaoga. 6 MW,, O,c (oeamal r 'cMa'lndeUae . B-onof t6 .) CobonatuanM.dIIO O6oiti Li AotsaraS'al Angelis I18 9M.,do,o omdeotat EASTERN MINDANAO ,Romblon s S'. geo del So, 20 2 22 22Palta.n 6. Daao 0,'e,tal MANILA ' / ' [ ' '
BICOL * D,ao'Cman"nss Node 6F DaYao del S. 24 32
Cana'.nes So,, 69 Sooth Colabalo P b-loo* Catado~nes CENTRAL MINDANAO
Alb' Le.ao a del No't e L pSoreogon 66040L-a del S,',N
so'sogon ~ ~ ?NO,tt Cot.abotnoogMasbate ; 2 i'1 Magb rdaro 2et .o
4 SolIaO Koda,at >s p,
29
-. N Son, 2.1-Joase 30 ,Oras 14
I. Roxas
-' 'taclobo'n
Pr,mceso I n7 -o
31~ ~ ~ ~~ ~~ ~~~~~~~~~~~~~~~~~~~~'
< 4w r4, 60(
42'B,'tJon~~~~~~~~~ P0 0., 0 Od Couyo '
B' ~ ~ ~ ~ ~ ~ ~ f '+ . '
CI' NA 1 ± Zoosboo~~~~~~~~~~~~ ~~~~~~~~~~ngo O8vflac *
IVIET NAM UadON
Joloa (91,I5AI'AS 056 Ger
PALAWAAN Scntos
- \ Af.NOANA40O
RUNEI 57
MFALAYSIA r 063w .t.-n' .0. * ' rta 06 toa
x~~~~~~~~~~~~~~~~~~~~~~~0 _' O",J 76 COV. O r.' 6 nt r rdvel'' Oawr. Owra.',JD rc,
SD O N 5E S 120- 124' ,28
SEPTEMBER 198r