report on the findings of - new york state education ... · an external alignment study for . new...
TRANSCRIPT

Report on the Findings of
An External Alignment Study for New York State’s
Regents Examination in Integrated Algebra May 2008
Prepared by
Educational Testing Service for
Assistant Commissioner David Abrams Office for Standards, Assessment and Reporting
New York State Education Department
www.ets.org

Table of Contents
Executive Summary …………………………………………………..…………………………..3 Introduction ……………………………………………………………………..………………… 4 Process …………………………………………………………………..………...…………..…...9 Methodology ……………………………………………………………..………...…..…………10 General Findings………………………………………………….……………….………...…...12 Summary of Findings……………….………………..……....................................................16 References …………………………………………………….………….……….………………17 Appendix A …………………………………………………….………….………………………18 Appendix B …………………………………………………….………….………………………20 Appendix C …………………………………………………….………….………………………23
- 2 -

Executive Summary A study of the alignment of the New York State Algebra curriculum standards and the new Regents Examination in Integrated Algebra was conducted by Educational Testing Service (ETS) from November 2007 through May 2008. This report is intended to be the first in a series of three such reports. The second and third studies are scheduled to follow the first operational administration of the new Regents Examination in Geometry (2009) and Algebra II/Trigonometry (2010). A team of ETS assessment specialists evaluated the 2008 form of the Regents Examination in Integrated Algebra while on site at the New York State Education Department (NYSED) offices in Albany. An adaptation of the Webb alignment analysis process was used to conduct the analysis. This process entailed the comparison of this algebra examination with state mathematics curriculum standards on the following three criteria: 1. Categorical Concurrence – Does the assessment measure content that is consistent
with the standards? 2. Depth of Knowledge Consistency – Are the cognitive demands of the assessment
consistent with the demands as stated in the standards? 3. Range of Knowledge Correspondence – Does the assessment measure the extent of
knowledge consistent with the span of knowledge required by the standards? The results indicate that the Regents Examination in Integrated Algebra and the curriculum standards are in full agreement; in other words, they are totally aligned to each other. Table 1 indicates that the alignment holds true even when analyzing the assessment against the finer grain of the five content strands for Integrated Algebra. NYSED is to be commended for having recognized the importance of aligning their assessments to the state curriculum standards when developing the new Regents Examination in Integrated Algebra. Table 1. Summary of Alignment Results
Standards Categorical Concurrence
Depth of Knowledge
Range of Knowledge
Number Sense & Operations Yes Yes Yes
Algebra Yes Yes Yes
Geometry Yes Yes Yes
Measurement Yes Yes Yes
Statistics & Probability Yes Yes Yes
- 3 -

Introduction The No Child Left Behind Act (NCLB) represents the most comprehensive reform of the Elementary and Secondary Education Act since its enactment in 1965. As a result of this legislation, each state must implement challenging educational standards as well as a statewide accountability system that includes the annual assessment of all public school students in grades 3 – 8 and in no less than one high school grade. These assessments must measure the specific state’s standards in both reading and mathematics. In addition, assessments measuring the state’s science standards must be administered in at least one grade at the elementary, middle school, and high school levels. States are required to demonstrate that their standards and assessments meet the criteria for alignment (i.e., consistency of content and conceptual challenge between assessments and standards). Under Title I of the Elementary and Secondary Education Act, the United States Department of Education (USDOE) is required to peer review each state’s standards and accountability systems to ensure compliance with NCLB requirements. This report relates directly to Section 5, critical elements 5.1 – 5.5 of the Standards and Assessments Peer Review Guidance document1. Educational Testing Service (ETS) was first contracted by the New York State Education Department (NYSED) to conduct an external alignment study of their assessment programs in 2006. It was known at that time that a new set of curriculum standards for mathematics that extends the key ideas and performance indicators of Standard 3 to specific grade-level content for each performance indicator (NYS Mathematics Core Curriculum, Revised March 2005) had been adopted by the Board of Regents. As such, ETS did not anticipate the mathematics assessments (which were developed under the previous standards) to be closely aligned to the new standards. However, the 2006 mathematics assessments were determined to be adequately aligned with Standard 3. Nevertheless, as part of the ongoing effort to strengthen student performance in mathematics of New York students, a decision was made to create three new high school mathematics assessments: Integrated Algebra, Geometry, and Algebra 2 / Trigonometry. These new assessments are in the process of being phased in to replace the Mathematics A and Mathematics B Regents examinations that measured standards from the previous core mathematics curriculum. This report is intended to be the first in a series of three reports; one to follow after each new Regents examination has been operationally administered to students in the state of New York. The Regents Examination in Integrated Algebra is the first completed Regents examination to be administered. By June 2010, it is expected that all three new commencement-level mathematics Regents examinations will be operational and that students will be required to successfully pass any one of them in order to meet graduation requirements.
1 Standards and Assessments Peer Review Guidance: Information and Examples for Meeting Requirements of the No Child Left Behind Act of 2001, April 28, 2004. U.S. Department of Education, Office of Elementary and Secondary Education, Washington, D.C.
- 4 -

For the purposes of this study, NYS Mathematics Core Curriculum standards (Revised March 2005) associated with Integrated Algebra were evaluated along with the 2008 Regents Examination in Integrated Algebra. Alignment of student standards and assessments is an integral part of an effective standards-based educational system (Webb, 2002). Alignment between standards and assessments helps to guide an educational system toward the goal of increased student achievement of challenging standards. Additionally, the results of this alignment study will provide relevant data for the state to submit in response to several of the critical elements delineated by the peer review process as required by NCLB. An adaptation of the Webb alignment analysis process2 was used to conduct this study. This process entails the comparison of a state assessment with state standards on the following three criteria:
1. Categorical Concurrence – Does the assessment measure content that is consistent
with the standards? 2. Depth of Knowledge Consistency – Are the cognitive demands of the assessment
consistent with the demands as stated in the standards? 3. Range of Knowledge Correspondence – Does the assessment measure the extent of
knowledge consistent with the span of knowledge required by the standards? Four assessment specialists from ETS, including two lead investigators, were charged with conducting the analysis of these alignment criteria with respect to the Regents Examination in Integrated Algebra 2008 test form and corresponding mathematics core curriculum standards. The review team consisted of assessment specialists with extensive mathematics expertise. Brief cameos for the reviewers and investigators are provided in Appendix A. Regardless of the content expertise raters may have, Herman, Webb & Zuniga (2007) found that different groups of raters may produce varying alignment results. Consequently, they recommend extensive rater/reviewer training prior to conducting an alignment study in order to minimize this effect. Therefore, even though each of our reviewers have had previous training and experience with coding items and standards for DOK and content, training was again provided prior to the evaluation of the assessment. This additional training occurred on March 11, 2008, and was specifically related to the overall alignment process, as well as the understanding and use of Webb’s Depth-of-Knowledge (DOK) taxonomy and the K-12 Mathematics Taxonomy for content coding presented in Appendix B. Following the training,
2 Webb, Norman L. Alignment Study in Language Arts, Mathematics, Science, and Social Studies of State Standards and Assessments for Four States. Council of the Chief State School Officers. December 2002.
- 5 -

reviewers went on-site to the NYSED offices in Albany to evaluate the current Regents Examination in Integrated Algebra test form. This alignment study began with an evaluation of the examination in order to determine the level of cognitive complexity of the test items based upon Norman L. Webb’s Depth of Knowledge (DOK) model. The standards, strands, and performance indicators measured by this test had been previously evaluated and coded by a team of ETS reviewers using the identical methodology during an alignment study in 2006. This current study was conducted by members of the original evaluation team in order to ensure consistency between the two analyses. Most state assessment programs adhere to the widely accepted Standards for Educational and Psychological Testing with respect to guidelines for constructing test forms, and the State of New York is no exception. However, less guidance is available to states when it comes to evaluating the cognitive demands of assessments and standards. According to Norman L. Webb, “Interpreting and assigning depth-of-knowledge levels to objectives both within the standards and the assessment items are essential requirements of the alignment process. Depth-of-knowledge consistency between standards and assessments indicates alignment if what is elicited from students on the assessment is as demanding cognitively as what students are expected to know and be able to do as stated in the standards.” In judging the complexity of the performance indicators, reviewers were instructed to consider them in relation to the typical high school student in an algebra course. According to Webb, while the definition of each DOK level varies among the different subject areas, in general, Level 1 represents “recall or simple reproduction of information,” Level 2 represents “use of skills and concepts,” Level 3 represents “strategic thinking,” and Level 4 represents “extended thinking” (Webb, 2002). In other words, Level 1 represents the least cognitive challenge and Level 4 represents the greatest cognitive challenge. It should be noted that Level 4 activities will often require extended periods of time to complete. It is not atypical to find few, if any, Level 4 items on standardized statewide assessments. A description of Webb’s Depth of Knowledge for mathematics (Webb, 2002) is provided on the following page.
- 6 -

Mathematics Depth of Knowledge Descriptions
Level 1 Level 2 Level 3 Level 4
Requires students to recall or observe facts, definitions, terms. Involves simple one-step procedures. Involves computing simple algorithms (e.g., sum, quotient). Examples: ♦ Recall or recognize
a fact, term or property
♦ Represent in words, pictures, or symbols in a math object or relationship
♦ Perform routine procedure, such as measuring
Requires students to make decisions on how to approach a problem. Requires students to compare, classify, organize, estimate, or order data. Typically involves two-step procedures. Examples:
♦ Specify and explain relationship between facts, terms, properties, or operations
♦ Select procedure according to criteria and perform it
♦ Solve routine multiple-step problems
Requires reasoning, planning, or use of evidence to solve problem or algorithm. May involve activity with more than one possible answer. Requires conjecture or restructuring of problems. Involves drawing conclusions from observations, citing evidence and developing logical arguments for concepts. Uses concepts to solve non-routine problems. Examples: ♦ Analyze similarities
and differences between procedures
♦ Formulate original problem given situation
♦ Formulate mathematical model for complex situation
Requires complex reasoning, planning, developing, and thinking. Typically requires extended time to complete the problem, but time not spent on repetitive tasks. Requires students to make several connections and apply one approach among many to solve the problem. Involves complex restructuring of data, establishing and evaluating criteria to solve problems. Examples: ♦ Apply mathematical
model to illuminate a problem, situation
♦ Conduct a project that specifies a problem, identifies solution paths, solves the problem, and reports results
♦ Design a mathematical model to inform and solve a practical or abstract situation
- 7 -

In addition to assigning a DOK level to each performance indicator and test item, raters assigned a content topic code to each. It should be noted that these content topics were not developed expressly for the NYSED Regents Examination in Integrated Algebra. The topic codes utilized for this analysis are those topics used in the Surveys of Enacted Curriculum (SEC) alignment methodology. The SEC model produces alignment analyses of standards and assessments through the use of this common taxonomy that allow comparisons to be made across districts or states. Table 2 provides the general content areas used in this taxonomy. The complete taxonomy is found in Appendix B. Table 2. K-12 Mathematics Content Areas
100 Nbr. Sense/Properties/Relationships 900 Data Displays
200 Operations 1000 Statistics
300 Measurement 1100 Probability
400 Consumer Applications 1200 Analysis
500 Basic Algebra 1300 Trigonometry
600 Advanced Algebra 1400 Special Topics
700 Geometric Concepts 1500 Functions
800 Advanced Geometry 1600 Instructional Technology
- 8 -

Process During an earlier alignment study conducted by ETS for NYSED in 2006, the NYSED Core Performance Indicators, upon which the Regents Examination in Integrated Algebra is based, were evaluated and coded for content and cognitive complexity. The results of this evaluation were verified again and then merged with the new data collected for this specific analysis. Raters worked as a team in order to assign content topic codes and DOK levels to both the performance indicators and the test items. While the raters worked together in a group, each rater completed an individual rating sheet to record their designations for the performance indicators within each strand and for each test item. The individual rating sheets were subsequently compiled into summary files, which serve as the basis for the data presented herein. To determine the level of alignment for the content portion of the study, the summary files were analyzed in order to identify consensus between raters. An agreement of 67% or greater was required for an item to “count” and be included in the alignment profile. This level of consensus was considered critical due to the small number of raters. “If raters do not agree on what topic or objective an item addresses, then the content of the item resides in the minds of individual raters and not within the item itself, and the content judgment depends on the rater not the substance of the item itself.”3 The consensus codes were captured and assigned to the performance indicator or item as the final content designation. In addition to the content codes, all performance indicators were assigned a cognitive level by each member of the team. While consensus was not required, the team worked together and discussed their judgments and rationales for their decisions. A similar process was used to evaluate the items on the Regents Examination in Integrated Algebra test form. In order to determine Depth of Knowledge Consistency, the percent of each DOK level on the test form was compared to the percent of each DOK level assigned to the corresponding performance indicators. The item format was taken into consideration in that the maximum score point was used to weight the items prior to determining the frequencies of DOK levels (Wilson, 2005). In other words, an item that was worth four points was given a weight of four and consequently, the DOK levels assigned to the item were also weighted by four.
3 Herman, J. L., Webb, N. M., & Zuniga, S. A. (2007). Measurement Issues in the Alignment of Standards and Assessments: A Case Study. Applied Measurement in Education, 20(1), 101 – 126.
- 9 -

Methodology
For this alignment study, data were analyzed in terms of the following alignment criteria: Categorical Concurrence Categorical Concurrence refers to the extent that an assessment measures content that is consistent with the content in the standards. In order to evaluate Categorical Concurrence, the topic codes assigned to items were compared to the codes assigned to the corresponding grade-level and subject-area performance indicators. Up to six content topic codes were assigned to the performance indicators by each reviewer. Likewise, the test items were evaluated and given up to three topic codes by each rater. When two or more raters (67%) agreed upon a designation for an item’s or performance indicator’s topic codes, those consensus codes were captured and assigned to the performance indicator or item as the final content designations. For each topic code assigned to a performance indicator that was also assigned to an item, a “hit” was recorded. The criteria of Categorical Concurrence was considered met when the number of hits for a standard, or in this case, for a strand, is six or greater. This criterion is based on an estimate of the number of items that would be needed to produce a reasonably reliable and reportable subscore (Webb, 1999, 2002, 2006). Depth of Knowledge Consistency Depth of Knowledge Consistency refers to the extent that the cognitive demands of the assessment are consistent with the demands required by the standards. The evaluation of Depth of Knowledge Consistency entailed a comparison of the percent of each DOK level on the test to the percent of each level in the corresponding grade-level and subject-area performance indicators. For this analysis, item format was taken into consideration in that the maximum score point for polytomous items was used to weight the items prior to determining the frequencies of DOK levels (Wilson, 2005). In other words, an item that was worth four points was given a weight of four and consequently, the DOK levels assigned to the item were also weighted by four. The NYSED weights each multiple-choice item on the test by two; however, since the multiple-choice items are dichotomous, they were not weighted for this analysis. Once the items were weighted, each reviewer’s DOK designations were then totaled and a percent was calculated for each level. For purposes of this study, when the percentage of DOK levels for the standards and for the test differed by no more than 20%, the Depth of Knowledge Consistency criterion was met. This criterion is the same as that used for the previous alignment studies of New York assessments and serves to establish a reasonable level of consistency between the assessments and standards.
- 10 -

Range of Knowledge Correspondence Range of Knowledge Correspondence refers to the degree the assessment measures the extent of knowledge required by the standards. Range of Knowledge Correspondence was determined by comparing the number of items on the Regents Examination in Integrated Algebra aligned to each strand to the total number of performance indicators assigned to the corresponding strand. For this analysis, the content topic codes for the items and the performance indicators were collapsed into the global topics of the taxonomy. For example, when analyzing mathematics assessments and standards, the more specific topic code 907 (scatter plots) was collapsed into the broader topic code 900 (data displays). When the percent of items measuring a strand was greater than or equal to 50%, this criterion was met (Webb, 2002). To illustrate, if ten performance indicators were associated with a particular strand, it would take at least five items on the test measuring that strand to meet the Range of Knowledge Correspondence criterion. Webb (2007) has identified several challenges to state assessment programs achieving Range of Knowledge Correspondence. First, the number of items on a test places an upper limit on the number of objectives or performance indicators that can be assessed. Secondly, the greater the number of standards and objectives, the more difficult it is to meet the Range of Knowledge criterion. Another challenge that states face in determining the alignment of their assessments and standards is the greater emphasis placed upon some objectives over others under the same standard (Webb 2006, 2007). As Webb points out, “It is reasonable that some standards will be more important than other standards and that some objectives under a standard will be more important than other objectives.”4
4 Webb, N.L. (2007) Issues Related to Judging the Alignment of Curriculum Standards and Assessments. Applied Measurement in Education, 20(1), 7-25.
- 11 -

General Findings In March 2005, the New York State Board of Regents adopted new curriculum standards for mathematics that extend the key ideas and performance indicators of Standard 3 to specific grade-level content for each performance indicator, as well as three high school mathematics courses (NYS Mathematics Core Curriculum, Revised March 2005). Mathematics, Science, and Technology - Standard 3 is the comprehensive standard that represents the broad content requirements for grade-level and course-specific expectations from kindergarten through high school. Standard 3 is provided below.
Mathematics, Science, and Technology - Standard 3 Students will:
• understand the concepts of and become proficient with the skills of mathematics; • communicate and reason mathematically; • become problem solvers by using appropriate tools and strategies;
through the integrated study of number sense and operations, algebra, geometry, measurement, and statistics and probability.
Within Standard 3, the core curriculum for Integrated Algebra is further divided into the following five content strands and the more specific content bands within each strand. Each band is further broken down into performance indicators. For example, the following is a performance indicator under the Algebra (strand) and Variables and Expressions (band): “Translate a quantitative verbal phrase into an algebraic expression.” It is at this finest grain that reviewers analyzed the curriculum standards and test items associated with the Regents Examination in Integrated Algebra in order to provide the most useful information to NYSED and its stakeholders.
♦ Number Sense and Operations (N) o Number Theory o Operations
♦ Algebra (A) o Variables and Expressions o Equations and Inequalities o Patterns, Relations, and Functions o Coordinate Geometry o Trigonometric Functions
♦ Geometry (G) o Shapes o Coordinate Geometry
♦ Measurement (M) o Units of Measurement o Error and Magnitude
♦ Statistics and Probability (S) o Organization and Display of Data o Analysis of Data o Predictions from Data o Probability
- 12 -

Categorical Concurrence Categorical Concurrence was analyzed for the five strands under Standard 3 as they relate to the 2008 Regents Examination in Integrated Algebra. The number of hits within each strand, Number Sense and Operations (N), Algebra (A), Geometry (G), Measurement (M), and Statistics (S), is presented in Table 3. As can be seen in the table, the criterion for Categorical Concurrence is met because the minimum of six items per strand was exceeded. The total number of hits shown in the table exceeds the number of items on the test because reviewers could assign up to three content topic codes for each item. Table 3. Integrated Algebra Categorical Concurrence
Integrated Algebra Hits N
Hits A
HitsG
HitsM
HitsS
Categorical Concurrence
2008 13 18 17 7 10 Yes
Depth of Knowledge Consistency The Depth of Knowledge (DOK) was evaluated for both the performance indicators and the assessment items. Each reviewer’s DOK designations were then totaled, and a percent was calculated for each level. Figure 1 presents the results of the analysis of Depth of Knowledge Consistency between the content strands (standards) and the test. As can be seen in the table, the largest discrepancy (8%) between the standards and the assessment is for DOK Level 1. This indicates that the assessment has a somewhat smaller percentage of Level 1 items than that assigned to the content strands, and consequently, a somewhat larger percentage of Levels 2 and 3 items. Figure 1. Integrated Algebra DOK Consistency – 2008
- 13 -
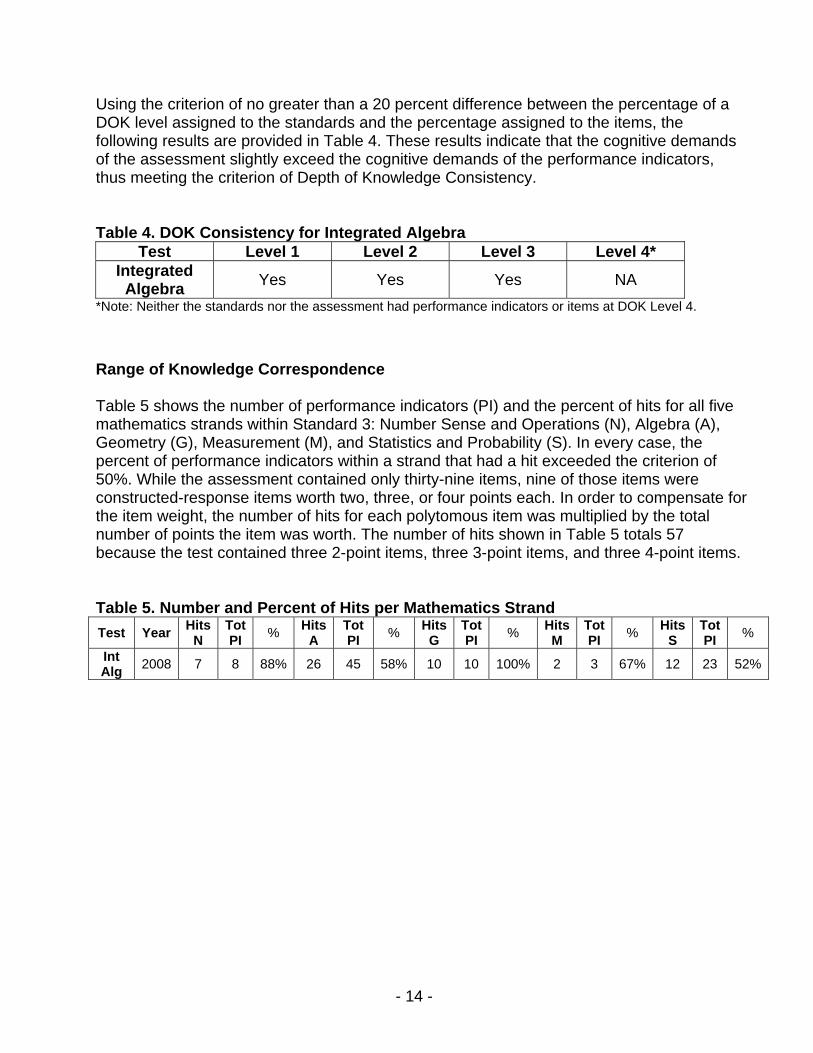
Using the criterion of no greater than a 20 percent difference between the percentage of a DOK level assigned to the standards and the percentage assigned to the items, the following results are provided in Table 4. These results indicate that the cognitive demands of the assessment slightly exceed the cognitive demands of the performance indicators, thus meeting the criterion of Depth of Knowledge Consistency. Table 4. DOK Consistency for Integrated Algebra
Test Level 1 Level 2 Level 3 Level 4* Integrated
Algebra Yes Yes Yes NA *Note: Neither the standards nor the assessment had performance indicators or items at DOK Level 4. Range of Knowledge Correspondence Table 5 shows the number of performance indicators (PI) and the percent of hits for all five mathematics strands within Standard 3: Number Sense and Operations (N), Algebra (A), Geometry (G), Measurement (M), and Statistics and Probability (S). In every case, the percent of performance indicators within a strand that had a hit exceeded the criterion of 50%. While the assessment contained only thirty-nine items, nine of those items were constructed-response items worth two, three, or four points each. In order to compensate for the item weight, the number of hits for each polytomous item was multiplied by the total number of points the item was worth. The number of hits shown in Table 5 totals 57 because the test contained three 2-point items, three 3-point items, and three 4-point items. Table 5. Number and Percent of Hits per Mathematics Strand Test Year Hits
N Tot PI % Hits
A Tot PI % Hits
G TotPI % Hits
M Tot PI % Hits
S Tot PI %
Int Alg 2008 7 8 88% 26 45 58% 10 10 100% 2 3 67% 12 23 52%
- 14 -

Figure 2 shows the correspondence between the Regents Examination in Integrated Algebra and the performance indicators (standards). The greatest discrepancy (10%) in topic-code assignment occurred for Basic Algebra (500), where there appears to be a greater emphasis on this particular topic in the performance indicators (standards) than on the assessment. While this discrepancy is not great, it may be partially explained by the fact that the assessment places a greater emphasis on Advanced Algebra (600). The next largest discrepancies (8%) occurred for Measurement (300) and Functions (1500). In all cases, these discrepancies were well within the acceptable range of 20%. Figure 2. Integrated Algebra Range of Knowledge Correspondence - 2008
- 15 -

Summary of Findings This study conducted by Educational Testing Service for the New York State Education Department provides rich information about the alignment of the state’s core curriculum standards for mathematics and the newly developed Regents Examination in Integrated Algebra. This alignment study examined the assessment and the standards in relation to the following criteria: Categorical Concurrence This criterion relates to the degree the assessment measures content that is consistent with the standards. This analysis determined there is a high degree of Categorical Concurrence for the Regents Examination in Integrated Algebra. The criterion of Categorical Concurrence was met. Depth of Knowledge Consistency The Depth of Knowledge criterion relates to the degree the assessments place cognitive demands on students that are consistent with the expectations found in the standards. This analysis determined there is a strong degree of DOK consistency between the Regents Examination in Integrated Algebra and the mathematics curriculum standards. Where minor discrepancies were identified, the assessment required a higher level of cognitive demand than found in the standards. The criterion of Depth of Knowledge Consistency was met. Range of Knowledge Correspondence This criterion relates to the degree the assessment measures the extent of knowledge required by the standards. A strong degree of Range of Knowledge Correspondence was found for the Regents Examination in Integrated Algebra. The criterion of Range of Knowledge Correspondence was met.
- 16 -

References
American Educational Research Association, American Psychological Association, National Council on Measurement in Education (1999). Standards for Educational and Psychological Testing, Washington, DC: American Educational Research Association. Johnson, Diane F. (July, 2005). Harcourt Assessment Report: Aligning ELP Assessments to ELP Standards. Rothman, Robert (March, 2003). Imperfect Matches: The Alignment of Standards and Tests. Center for Education. Paper commissioned by the Committee on Test Design for K-12 Science Achievement Center for Education, National Research Council. Surveys of Enacted Curriculum (SEC): Coding Procedures for Curriculum Content Analyses. Available on the web at http://seconline.wceruw.org/resources.asp. Webb, N.L. Alignment Analysis of Mathematics Standards and Assessments: Wisconsin Grades 3 – 8 and 10 (2006). Report submitted to the State of Wisconsin. Madison: Alignment Analysis Institute. Webb, Norman L. (April, 1997). Research Monograph No. 6: Criteria for alignment of expectations and assessments in mathematics and science education. A publication of the Council of Chief State School Officers (CCSSO). Webb, Norman L. (January, 1997). Determining alignment of expectations and assessments in mathematics and science education. National Institute for Science Education, Vol. 1, No. 2. Webb, Norman L. (1999). Alignment of science and mathematics standards and assessments in four states. A publication of the Council of Chief State School Officers (CCSSO). Webb, Norman L. (2002). Alignment study in language arts, mathematics, science, and social studies of state standards and assessments for four states – A study of the State Collaborative on Assessment & Student Standards (SCASS) Technical Issues in Large-Scale Assessment (TILSA). A publication of the Council of Chief State School Officers (CCSSO).
Webb, N.M., Herman, J.L., & Webb, N.L. Alignment of Mathematics and State-Level Standards and Assessments: The Role of Reviewer Agreement. Educational Measurement: Issues and Practice. Summer 2007, 17 – 29. Wilson, Linda D. (September, 2005). Findings of an Alignment Study in Delaware Student Testing Program Mathematics for Grades 2, 4, 6, 7, and 9. Assessment and Analysis and Accountability Branch, Delaware Department of Education.
- 17 -

Appendix A
NYSED Alignment Team
Judy Hickman, Lead Investigator Judy Hickman joined the Assessment Development division of ETS in May of 2005, where she works as an Assessment Specialist in the area of elementary and secondary mathematics. Her background includes teaching high school and college mathematics courses for over 20 years. For the six years prior to joining ETS, she served as the Florida Comprehensive Assessment Test (FCAT) coordinator for the Florida Department of Education (FDOE). Judy also served the United States Department of Education as a peer reviewer for states’ NCLB compliance submissions and as an alignment team member for various Surveys of Enacted Curriculum (SEC) and CCSSO state assessment reviews. Her most recent work with ETS includes both leadership and/or supporting roles in the development of large-scale assessment programs for Virginia, Maryland, and Ontario. She also served as a principal investigator for two previous alignment studies for the New York State Education Department (2006, 2007). Laura Melvin (Ph.D.), Lead Investigator Laura Melvin joined the Assessment Development division of ETS in 2005, where she works as an Assessment Specialist III for English Language Arts. As an assessment specialist, Dr. Melvin provides leadership for test development activities for statewide and local assessment programs including constructed-response and multiple-choice item development and review, test construction, item analysis, interpretive product development, and development of hand-scoring training materials. She has served as the ELA development lead for the following state programs: Indiana (English 11 end-of-course), Georgia (American Literature and Grade 9 Literature end-of-course), Oklahoma (grades 3 – 8 Core Curriculum Tests), and Educational Records Bureau (grades 1 – 10). She also served as a principal investigator for two alignment studies for the New York State Education Department (2006, 2007). Dr. Melvin’s education credentials include a B.A. in English from the University of Miami, a masters degree in special education from Florida International University, and a doctorate in educational measurement and evaluation from Florida State University.
- 18 -

Appendix A
Michael Renz has worked at ETS since 2002. He holds a B.A. in secondary mathematics education from the University of Connecticut and an M.A.R. and M.Div. from Westminster Theological Seminary. Mr. Renz serves as an Assessment Specialist III for Elementary and Secondary Education at ETS. He has been instrumental in the development of assessments in mathematics for large-scale assessment programs in Virginia, The Province of Ontario, California, Indiana, Los Angeles Unified School District, Maryland, New Jersey, and The Commonwealth of Puerto Rico. Mr. Renz has extensive teaching experience. He has taught mathematics in middle school, high school, and as an adjunct professor for several colleges. Marlene Supernavage has a Master of Science degree and is an Assessment Specialist II in the Assessment Development Division at ETS, Princeton, New Jersey. Her area of specialization is Mathematics, and she is applying this knowledge currently in the development of examinations that measure quantitative reasoning skills. She is responsible for the mathematics section of the SAT Reasoning Test. She has also worked on a wide variety of other testing programs as an item writer and reviewer, including NAEP, GRE, Praxis, the SAT Math Subject test, and several state testing programs. Ms. Supernavage has written curriculum materials and assessments for the College Board Pacesetter Pre-calculus program and for Algebridge, a diagnostic and instructional program for pre-algebra students. She is currently working on the development of CBAL (Cognitively Based Assessment of, for, and as Learning), a possible alternative to current state testing programs. Ms. Supernavage has given presentations about mathematics instruction and assessment at conferences such as the NCTM annual meeting. Before coming to ETS, she taught high school mathematics for 10 years.
- 19 -

Appendix B
K-12 Mathematics Taxonomy
100 Number Sense/Properties/Relationships 300 Measurement 101 Place Value 301 Use of measuring instruments 102 Whole numbers 302 Theory (arbitrary, standard units, unit size) 103 Operations 303 Conversions 104 Fractions 304 Metric (SI) system 105 Decimals 305 Length, perimeter 106 Percents 306 Area, volume 107 Ratio, proportion 307 Surface Area 108 Patterns 308 Direction, Location, Navigation 109 Real numbers 309 Angles 110 Exponents, scientific notation 310 Circles (i.e., pi, radius, area) 111 Factors, multiples, divisibility 311 Mass (weight) 112 Odds/evens/primes/composites/square nbrs. 312 Time, temperature 113 Estimate 313 Money 114 Number Comparisons (order, relative size, 314 Derived measures (e.g., rate/speed)
inverse, opposites, equivalent forms, scale) 315 Calendar 115 Order of operations 390 Accuracy, Precision 116 Computational Algorithms 400 Consumer Applications 117 Relationships between operations 401 Simple interest 118 Number Theory, non base-ten systems 402 Compound interest 119 Mathematical properties (e.g., distr. property) 403 Rates (e.g., discount, commission) 190 Other 404 Spreadsheets
200 Operations 490 Other 201 Add, subtract whole numbers 500 Basic Algebra 202 Multiplication whole numbers 501 Absolute Value 203 Division whole numbers 502 Use of variables 204 Combinations of operations on whole numbers 503 Evaluation of formulas, expressions, equations 205 Equivalent/non-equivalent fractions 504 One-step equations 206 Add, subtract fractions 505 Coordinate Plane 207 Multiply fractions 506 Patterns 208 Divide fractions 507 Multi-step equations 209 Combinations of operations on fractions 508 Inequalities 210 Ratio, proportion 509 Linear, non-linear relations 211 Representations of fractions 510 Rate of change/slope/line 212 Equivalence of decimals, fractions, % 511 Operations of polynomials 213 Add, subtract decimals 512 Factoring 214 Multiply decimals 513 Square roots & radicals 215 Divide decimals 514 Operations on radicals 216 Combinations of operations on decimals 515 Rational expressions 217 Computing with percents 516 Multiple representations 218 Computation with exponents, radicals 590 Other 290 Other
- 20 -

Appendix B
K-12 Mathematics Taxonomy
600 Advanced Algebra 900 Data Displays 601 Quadratic equations 901 Summarize data in a table or graph 602 Systems of equations 902 Bar graph, histogram 603 Systems of inequalities 903 Pie charts, circle graphs 604 Compound inequalities 904 Pictographs 605 Matrices, determinants 905 Line graphs 606 Conic sections 906 Stem and Leaf plots 607 Rational, negative exponents/radicals 907 Scatter plots 608 Rules for exponents 908 Box plots 609 Complex numbers 909 Line plots 610 Binomial theorem 910 Classification, Venn diagrams 611 Factor/remainder theorem 911 Tree Diagrams 612 Field properties of real number system 990 Other 613 Multiple representations 1000 Statistics 690 Other 1001 Mean, median, mode
700 Geometric Concepts 1002 Variability, standard deviation 701 Basic terminology 1003 Line of best fit 702 Points, lines, rays, segments, and vectors 1004 Quartiles, percentiles 703 Patterns 1005 Bivariate distribution 704 Congruence 1006 Confidence intervals 705 Similarity 1007 Correlation 706 Parallels 1008 Hypothesis testing 707 Triangles 1009 Chi Square 708 Quadrilaterals 1010 Data Transformation 709 Circles 1011 Central Limit Theory 710 Angles 1090 Other 711 Polygons 1100 Probability 712 Polyhedra 1101 Simple probability 713 Models 1102 Compound probability 714 3-D relationships 1103 Conditional probability 715 Symmetry 1104 Empirical probability 716 Transformations (e.g., flips, turns) 1105 Sampling, Sample spaces 717 Pythagorean Theorem 1106 Independent/dependent events 790 Other 1107 Expected value
800 Advanced Geometry 1108 Binomial distribution 801 Logic, reasoning, proof 1109 Normal curve 802 Loci 1190 Other 803 Spheres, cones, cylinders 804 Coordinate Geometry 805 Vectors 806 Analytic Geometry 807 Non-Euclidean Geometry 808 Topology 890 Other
- 21 -

Appendix B
K-12 Mathematics Taxonomy 1200 Analysis 1500 Functions 1201 Sequences and series 1501 Notation 1202 Limits 1502 Relations 1203 Continuity 1503 Linear 1204 Rates of change 1504 Quadratic 1205 Maxima, minima 1505 Polynomial 1206 Differentiation 1506 Rational 1207 Integration 1507 Logarithmic 1290 Other 1508 Exponential 1300 Trigonometry 1509 Trigonometric/circular 1301 Basic ratios 1510 Inverse 1302 Radian measure 1511 Composition 1303 Right triangle trigonometry 1590 Other 1304 Laws of Sines, Cosines 1600 Instructional Technology 1305 Identities 1601 Use of calculators 1306 Trigonometric equations 1602 Use of graphing calculators 1307 Polar coordinates 1603 Use of computers and internet 1308 Periodicity 1604 Computer programming 1309 Amplitude 1690 Other 1390 Other 1400 Special Topics 1401 Sets 1402 Logic 1403 Mathematical induction 1404 Linear programming 1405 Networks 1406 Iteration, recursion 1407 Permutations, combinations 1408 Simulations 1409 Fractals 1490 Other
- 22 -

Appendix C
Integrated Algebra Frequency Tables for DOK and Content Representation
- 23 -