report on the state of financial inclusion in the philippines inclusion.pdf · philippines is part...
TRANSCRIPT

Report on the State of Financial Inclusion
in the Philippines
2017
SES FinInc Form No. 02-001 * Version 0 * Updated 29 Jun 2017

The Report on the State of Financial Inclusion in the
Philippines is part of the stock-taking exercise of the BSP to
assess the levels and trends in financial inclusion in the
country. The 2017 report provides supply-side data on
financial inclusion in terms of access and usage, sourced from
BSP-supervised institutions and other sources such as the
Cooperative Development Authority (CDA) and Insurance
Commission (IC). It further presents comparison across other
jurisdictions.
The report, which is the seventh edition since the maiden
release in 2011, also serves as an inventory of the progress
made in the past seven years (2011-2017). Year-on-year
comparisons versus 2016 data and latest available figures as
of June 2018 are likewise highlighted for relevant sections.
The report is structured as follows: Section I describes the
financial access situation by discussing the reach of banks and
other financial service access points at the national and
subnational level. Section II covers usage of formal financial
products and services in terms of deposits, loans,
microfinance, microinsurance, and electronic money. The
supporting annexes contain additional information on the
different financial inclusion indicators.
Previous reports can be accessed at:
http://www.bsp.gov.ph/about/advocacies_reports.asp
SES FinInc Form No. 02-001 * Version 0 * Updated 29 Jun 2017
Background

List of Abbreviations and Acronyms
AFI Alliance for Financial Inclusion
ARMM Autonomous Region in Muslim Mindanao
ASEAN Association of Southeast Asian Nations
ATM Automated Teller Machine
BSP Bangko Sentral ng Pilipinas
BDA Basic Deposit Account
CALABARZON Cavite, Laguna, Batangas, Rizal, Quezon
CAR Cordillera Administrative Region
CDA Cooperative Development Authority
CLIA Center for Learning and Inclusion Advocacy
EFT Electronic Fund Transfer
E-Money Electronic Money
EMI E-Money Issuer
FAS Financial Access Survey
FII Financial Inclusion Index
FIDWG Financial Inclusion Data Working Group
FSP Financial Service Provider
FXD/MC/RTC Foreign Exchange Dealer/Money Changer/Remittance and Transfer Company
IC Insurance Commission
IMF International Monetary Fund
LGU Local Government Unit
MBO Micro-banking Office
MF NGO Microfinance NGO
MIMAROPA Mindoro, Marinduque, Romblon, Palawan
NBFI Non-bank Financial Institution
NIR Negros Island Region
NRPS National Retail Payments System
NSSLA Non-stock Savings and Loans Association
P2P Person-to-Person
PSA Philippine Statistics Authority
R/CB Rural and Cooperative Bank
SME Small and Medium Enterprise
SOCCSKSARGEN South Cotabato, Cotabato, Sultan Kudarat, Sanagani, General Santos City
TB Thrift Bank
U/KB Universal and Commercial Bank
W2W Wallet-to-Wallet
SES FinInc Form No. 02-001 * Version 0 * Updated 29 Jun 2017

a/ Philippine Statistics Authorityb/ National Mapping and Resource Information Authorityc/ Bangko Sentral ng Pilipinasd/ Commission on Filipinos Oversease/ Groupe Speciale Mobile Association (GSMA)f/ International Telecommunication Union (ITU)
Population (2015) a/ 101 million
Land area a/ 300,000 km2
Number of islands b/ 7,641
Main islands Luzon, Visayas, Mindanao
Capital Manila
Administrative Units a/ 17 regions, 81 provinces,
145 cities, 1,489 municipalities
Official languages Filipino, English
Simple literacy (2013) a/ 96.5%
Employment rate (July 2018) a/ 94.6%
Poverty incidence of population (2015) a/ 21.6%
Average annual family income (Oct 2016) a/ PhP 267,000
Gross Domestic Product (GDP) full year growth (2017) a/ 6.7%
Inflation rate (Oct 2018) c/ 6.7%
Exchange rate (Oct 2018) c/ USD 1 ≈ PhP 53
Number of overseas Filipinos (2013) d/ 10.2 million
Amount of cash remittances (2017) c/ USD 28 billion
Number of unique mobile subscribers (2015) e/ 51 million
SIM penetration (2017) e/ 113%
Smartphone penetration (2017) e/ 63%
Percentage of individuals using the internet (2016) f/ 55.5%
The PhilippinesAn Overview
SES FinInc Form No. 02-001 * Version 0 * Updated 29 Jun 2017

Financial Access
SES FinInc Form No. 02-001 * Version 0 * Updated 29 Jun 2017

32
1ARMM
IV-BCAR
37
274279
32
1ARMM
CARXIII
19
177215
The number of banks continue to increase, with
11,744 banking offices nationwide as of
end-2017. From 2011 to 2017, the growth of
banking offices translated to an average annual
rate of 5%, or equivalently around 455 new
banking offices that are being put up every
year. 1
ATMs likewise continued to grow, reaching
20,276 units as of end-2017. ATMs exhibited a
faster rate of growth in the past seven years as
compared to banking offices. With an 11%
average annual growth, this indicates that
roughly 1,600 new ATMs are being set up
yearly.2
Number of banks and automated teller machines (ATMs)
2011 2012 2013 2014 2015 2016 2017
Banks 9,015 9,375 9,884 10,315 10,710 11,129 11,744
ATMs 10,658 12,224 14,528 15,692 17,314 19,081 20,276
0
5,000
10,000
15,000
20,000
25,000
Number of banking offices and ATMs
Similar to 2016, the concentration of banks and ATMs
in 2017 remained in NCR, followed by Regions IV-A
(CALABARZON) and III (Central Luzon). CAR and ARMM
were both at the bottom three in terms of both bank
and ATM penetration.
Geographic distribution of banks and ATMs
Average Annual Growth
(2011-2017)
5%banking offices
11%ATMs
Other underserved regions were Region
XIII (Caraga) in terms of bank count, and
Region IV-B (MIMAROPA) in terms of ATM
count.
1 Banking office count excludes 48 banking offices located outside the Philippines which primarily cater to overseas Filipinos.2 ATM count excludes 3 ATMs located outside the Philippines which primarily cater to overseas Filipinos. Of the total ATMs, 56% were on-site while 44%
were off-site. On-site ATMs are located in the banking office while off-site ATMs are stand-alone units located in convenient areas such as shopping
malls, train stations, and other public places.
Banking Offices
12
3
To
p
Bo
tto
m
NCR
IV-A
III
12
3
To
p
Bo
tto
mNCR
IV-A
III
ATMs
3,648
1,737
1,210
7,989
3,023
1,910
2SES FinInc Form No. 02-001 * Version 0 * Updated 29 Jun 2017

Branch-lite is a concept which allows banks to
perform banking activities and services chosen
from an expanded menu of transactional and
non-transactional activities. This gives the bank
the flexibility to determine the appropriate size
and model of a banking office for a specific area
or locality based on market needs.
3 Figures for 2016 and 2017 are not directly comparable due to the abolition of the Negros Island Region (NIR), and the return of Negros Occidental and
Negros Oriental to Regions VI and VII, respectively.
The number of banks increased in all regions except in ARMM where no
additional banking offices were established. The number of ATMs grew in all
regions. It is worth noting that growth in banks and ATMs were higher in regions
outside the top three.3
2016 2017 2016-17
Growth
2016 2017 2016-17
Growth
NCR 3,504 3,648 4.1% 7,669 7,989 4.2%
CAR 165 177 7.3% 255 279 9.4%
I Ilocos Region 520 584 12.3% 614 677 10.3%
II Cagayan Valley 358 388 8.4% 354 400 13.0%
III Central Luzon 1,146 1,210 5.6% 1,748 1,910 9.3%
IV-A CALABARZON 1,665 1,737 4.3% 2,848 3,023 6.1%
IV-B MIMAROPA 267 278 4.1% 250 274 9.6%
V Bicol Region 428 464 8.4% 479 527 10.0%
VI Western Visayas 455 690 * 550 965 *
VII Central Visayas 628 789 * 1,302 1,511 *
VIII Eastern Visayas 210 227 8.1% 291 323 11.0%
NIR Negros Island Region 297 * * 466 * *
IX Zamboanga Peninsula 220 225 2.3% 291 309 6.2%
X Northern Mindanao 383 396 3.4% 497 544 9.5%
XI Davao Region 424 447 5.4% 776 814 4.9%
XII SOCCSKSARGEN 232 250 7.8% 396 411 3.8%
XIII Caraga 208 215 3.4% 260 283 8.8%
ARMM 19 19 0.0% 35 37 5.7%
11,129 11,744 5.5% 19,081 20,276 6.3%
Region
Philippines
Banks ATMs
Branch-lite network
In 2017, there were 919 MBOs operating in 538
local government units or LGUs (i.e., cities and
municipalities), of which 99 LGUs were being
served by MBOs alone. With their presence in
areas where it may not yet be feasible for a branch
to serve, MBOs served as a means for banks to
reach previously unbanked LGUs.
MBOs were indeed effective solutions to physical
barriers in banking. However, previous regulations
restrict MBOs only to banks with microfinance
operations. BSP issued a regulation to expand and
replicate the success of MBOs to all banks.
From micro-banking offices (MBOs) to branch-lite…
or locality based on market needs.
BSP Circular No. 987 dated 28 December 2017
liberalized the classifications of banking offices
under the branch-lite framework.
3SES FinInc Form No. 02-001 * Version 0 * Updated 29 Jun 2017
Top 3 Bottom 3
Legend

As of June 2018, out of 581 banks (head offices),
155 banks have tapped branch-lite to expand
physical outreach at lower cost. There were
1,751 branch-lite units operating in 738 LGUs, of
which 151 LGUs were being served by branch-
lite alone.
At the regional level, branch-lite units were
mostly found in CALABARZON, Bicol, Central
Luzon, and Ilocos. There are still untapped
opportunities in terms of expanding financial
access through branch-lite since ARMM only has
one branch-lite while more than half of the
regions have less than 100 branch-lite units
(regional average).ARMM
CAR
IX
XII
VIII
II
XIII
XI
X
IV-B
NCR
VI
VII
I
III
V
IV-A
1
33
38
38
53
58
60
77
78
92
114
137
143
144
149
166
370
Regional distribution of branch-lite units
100 (regional average)
In 2017, 554 LGUs were unbanked or 33.9% of the total.4 While this is an improvement from 37.3% in
2011, the percentage share of unbanked LGUs declined at an average rate of only 1.6% from 2011 to
2017.
Unbanked situation
4 List of unbanked LGUs available at http://www.bsp.gov.ph/banking/directories.asp
One city (Canlaon City, Negros Oriental) out
of 145 cities is still unbanked. The income
level of a municipality is a significant
determinant of banking presence. Only 12%
of first class municipalities were unbanked,
while 100% of 6th class municipalities were
unbanked.
4SES FinInc Form No. 02-001 * Version 0 * Updated 29 Jun 2017
As income class decreases, the percentage share of unbanked municipalities increases.
Income classUnbanked
municipalities
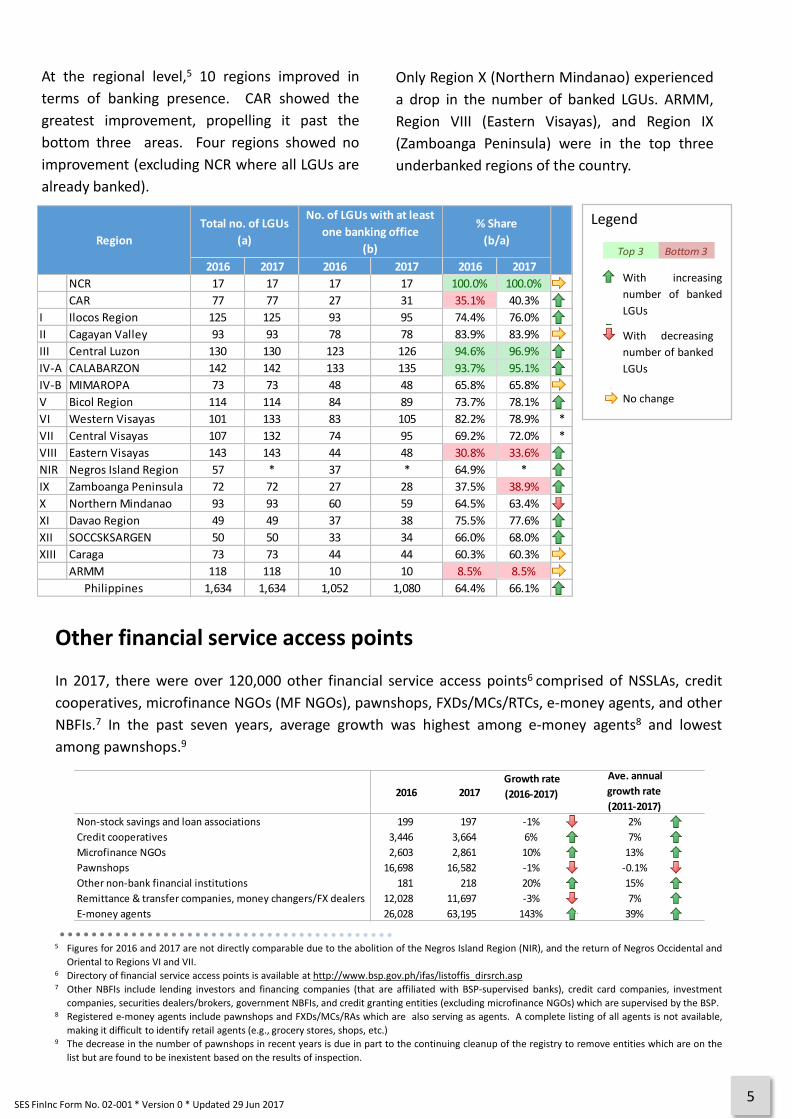
At the regional level,5 10 regions improved in
terms of banking presence. CAR showed the
greatest improvement, propelling it past the
bottom three areas. Four regions showed no
improvement (excluding NCR where all LGUs are
already banked).
5 Figures for 2016 and 2017 are not directly comparable due to the abolition of the Negros Island Region (NIR), and the return of Negros Occidental and
Oriental to Regions VI and VII.6 Directory of financial service access points is available at http://www.bsp.gov.ph/ifas/listoffis_dirsrch.asp7 Other NBFIs include lending investors and financing companies (that are affiliated with BSP-supervised banks), credit card companies, investment
companies, securities dealers/brokers, government NBFIs, and credit granting entities (excluding microfinance NGOs) which are supervised by the BSP.8 Registered e-money agents include pawnshops and FXDs/MCs/RAs which are also serving as agents. A complete listing of all agents is not available,
making it difficult to identify retail agents (e.g., grocery stores, shops, etc.)9 The decrease in the number of pawnshops in recent years is due in part to the continuing cleanup of the registry to remove entities which are on the
list but are found to be inexistent based on the results of inspection.
2016 2017 2016 2017 2016 2017
NCR 17 17 17 17 100.0% 100.0%
CAR 77 77 27 31 35.1% 40.3%
I Ilocos Region 125 125 93 95 74.4% 76.0%
II Cagayan Valley 93 93 78 78 83.9% 83.9%
III Central Luzon 130 130 123 126 94.6% 96.9%
IV-A CALABARZON 142 142 133 135 93.7% 95.1%
IV-B MIMAROPA 73 73 48 48 65.8% 65.8%
V Bicol Region 114 114 84 89 73.7% 78.1%
VI Western Visayas 101 133 83 105 82.2% 78.9% *
VII Central Visayas 107 132 74 95 69.2% 72.0% *
VIII Eastern Visayas 143 143 44 48 30.8% 33.6%
NIR Negros Island Region 57 * 37 * 64.9% *
IX Zamboanga Peninsula 72 72 27 28 37.5% 38.9%
X Northern Mindanao 93 93 60 59 64.5% 63.4%
XI Davao Region 49 49 37 38 75.5% 77.6%
XII SOCCSKSARGEN 50 50 33 34 66.0% 68.0%
XIII Caraga 73 73 44 44 60.3% 60.3%
ARMM 118 118 10 10 8.5% 8.5%
1,634 1,634 1,052 1,080 64.4% 66.1%
% Share
(b/a)
Philippines
Region
No. of LGUs with at least
one banking office
(b)
Total no. of LGUs
(a)
Only Region X (Northern Mindanao) experienced
a drop in the number of banked LGUs. ARMM,
Region VIII (Eastern Visayas), and Region IX
(Zamboanga Peninsula) were in the top three
underbanked regions of the country.
Top 3 Bottom 3
Legend
With increasing
number of banked
LGUs
With decreasing
number of banked
LGUs
No change
Improvement
No. of banked LGUs decreased
No changeImprovement
No. of banked LGUs decreased
No change
Improvement
No. of banked LGUs decreased
No change
In 2017, there were over 120,000 other financial service access points6 comprised of NSSLAs, credit
cooperatives, microfinance NGOs (MF NGOs), pawnshops, FXDs/MCs/RTCs, e-money agents, and other
NBFIs.7 In the past seven years, average growth was highest among e-money agents8 and lowest
among pawnshops.9
Other financial service access points
5SES FinInc Form No. 02-001 * Version 0 * Updated 29 Jun 2017
2016 2017 Growth rate
(2016-2017)
Ave. annual
growth rate
(2011-2017)
Non-stock savings and loan associations 199 ## 197 ## -1% -1% 2% 2%
Credit cooperatives 3,446 ## 3,664 ## 6% 6% 7% 7%
Microfinance NGOs 2,603 ## 2,861 ## 10% 10% 13% 13%
Pawnshops 16,698 ## 16,582 ## -1% -1% -0.1% 0%
Other non-bank financial institutions 181 ## 218 ## 20% 20% 15% 15%
Remittance & transfer companies, money changers/FX dealers 12,028 ## 11,697 ## -3% -3% 7% 7%
E-money agents 26,028 ## 63,195 ## 143% ### 39% 39%

Despite their slow growth in recent years,
pawnshops were still the most accessible with
presence in 73% of the 1,634 LGUs, followed by
cooperatives with 71%. Pawnshops and cooperatives
had wider reach than banks. Other NBFIs and
NSSLAs, on the other hand, had least physical reach
at 6% and 4%, respectively.
In terms of presence in unbanked areas,
cooperatives were the most common access points
with 47% reach, followed by pawnshops with 44%
and MF NGOs with 40%.
Pawnshops
Cooperatives with credit operations
Presence in
unbanked areas
MF NGOs
Physical reach
73%
71%
66%
44%
47%
40%
E-money Agents
60% 35%
FXDs/MCs/RTCs
59% 27%
While 34% of 1,634 LGUs were unbanked, the
percentage would drop to 8% if other access points
were considered. In the succeeding maps, this is
most evident in CAR and Region VIII (Eastern Visayas)
where the portion of “red areas” was significantly
reduced from Map A to Map B.
Indeed, non-bank FSPs help provide basic financial
services and can be channels to broader financial
inclusion in unbanked areas. It is only in ARMM
where red areas were still prominent in the two
maps, indicating that many LGUs in ARMM remained
unserved.
Ma
p A
Ma
p B
6SES FinInc Form No. 02-001 * Version 0 * Updated 29 Jun 2017
(% of LGUs) (% of LGUs)
Usage of Financial Products and Services
SES FinInc Form No. 02-001 * Version 0 * Updated 29 Jun 2017

Deposit in banks
In 2017, there were 57.1 million deposit
accounts from 45.3 million depositors with
outstanding balance of P11.7 trillion.
From 2011 to 2017, the number of deposit
accounts and depositors in banks increased at an
average annual rate of 5% and 6%, respectively.
The total amount of deposits grew at an average
rate of 14% during the same period.
The number of accounts is 11.8 million more than
the number of depositors which indicates
ownership of multiple accounts for some
depositors.11
2011 2012 2013 2014 2015 2016 2017
Accounts (LHS) 43.6 41.9 45.1 47.4 50.9 53.5 57.1
Depositors (LHS) 31.4 34.2 36.1 37.6 40.4 41.8 45.3
Total deposits (RHS) 5.4 5.8 7.6 8.5 9.2 10.5 11.7
0
2
4
6
8
10
12
14
0
10
20
30
40
50
60
in t
rilli
on
pes
os
in m
illio
ns
Bank deposits: number of accounts, depositors, and amount
Geographic distribution of bank deposits12
NCR held 40% of the total number
of deposit accounts, followed by
CALABARZON with 14% and
Central Luzon with 8%. The bottom
three regions were CAR, Caraga,
and ARMM with 0.9%, 0.8%, and
0.1% share, respectively.
In terms of amount, deposits were
heavily concentrated in NCR which
accounted for two-thirds (67%) of
the total. Caraga and ARMM were
again at the bottom.
11 Deposit data is subject to multiple counting because a person may have two or more accounts in a bank or in several banks.12 Figures for 2016 and 2017 are not directly comparable due to the abolition of the Negros Island Region (NIR), and the return of Negros Occidental and
Negros Oriental to Regions VI and VII, respectively.
NCR
IV-A
III
VII
VI
XI
I
X
V
II
XII
CAR
VIII
IX
IV-B
XIII
ARMM
7,879
812
602
583
320
240
204
172
140
128
124
110
109
108
80
79
13
Amount of deposits (in billion PhP)
NCR
IV-A
III
VII
VI
I
XI
V
X
XII
IV-B
II
IX
VIII
CAR
XIII
ARMM
22.9
7.7
4.6
3.6
3.0
2.1
2.1
1.9
1.5
1.3
1.2
1.2
1.0
0.9
0.9
0.8
0.1
Number of deposit accounts (in millions)
8SES FinInc Form No. 02-001 * Version 0 * Updated 29 Jun 2017

The 2017 figures are generally reflective of trends observed for 2016. The only exemption is the
replacement of Eastern Visayas with CAR in the bottom three in terms of number of deposit accounts.
2016 2017 Growth 2016 2017
NCR 7,069.1 7,879.2 11.5% 67.4% 67.3%
CAR 96.4 110.2 14.3% 0.9% 0.9%
I Ilocos Region 185.4 204.1 10.1% 1.8% 1.7%
II Cagayan Valley 114.0 128.3 12.5% 1.1% 1.1%
III Central Luzon 527.3 601.8 14.1% 5.0% 5.1%
IV-A CALABARZON 731.3 812.4 11.1% 7.0% 6.9%
IV-B MIMAROPA 65.1 80.3 23.5% 0.6% 0.7%
V Bicol Region 124.6 140.3 12.6% 1.2% 1.2%
VI Western Visayas 167.9 319.5 * 1.6% 2.7%
VII Central Visayas 505.4 582.7 * 4.8% 5.0%
VIII Eastern Visayas 94.3 109.2 15.7% 0.9% 0.9%
NIR Negros Island Region 160.3 * * 1.5% *
IX Zamboanga Peninsula 95.9 107.7 12.3% 0.9% 0.9%
X Northern Mindanao 152.8 172.4 12.8% 1.5% 1.5%
XI Davao Region 214.8 240.4 11.9% 2.0% 2.1%
XII SOCCSKSARGEN 108.1 124.5 15.2% 1.0% 1.1%
XIII Caraga 69.3 78.6 13.5% 0.7% 0.7%
ARMM 10.0 13.1 30.6% 0.1% 0.1%
10,491.8 11,704.7 11.6% 100.0% 100.0%
% Share to Total
Philippines
Region
Amount of deposits
(in billion pesos)
SES FinInc Form No. 02-001 * Version 0 * Updated 29 Jun 20179
Top 3 Bottom 3
Legend
2016 2017 Growth 2016 2017
NCR 22.2 22.9 3.2% 41.2% 40.2%
CAR 0.9 0.9 5.5% 1.6% 1.6%
I Ilocos Region 1.9 2.1 8.7% 3.5% 3.6%
II Cagayan Valley 1.1 1.2 8.5% 2.0% 2.1%
III Central Luzon 4.3 4.6 7.1% 8.0% 8.1%
IV-A CALABARZON 7.2 7.7 7.3% 13.4% 13.6%
IV-B MIMAROPA 1.1 1.2 12.6% 2.0% 2.1%
V Bicol Region 1.8 1.9 7.7% 3.3% 3.4%
VI Western Visayas 1.8 3.0 * 3.4% 5.3%
VII Central Visayas 3.0 3.6 * 5.6% 6.2%
VIII Eastern Visayas 0.9 0.9 9.1% 1.6% 1.6%
NIR Negros Island Region 1.3 * * 2.4% *
IX Zamboanga Peninsula 0.9 1.0 6.7% 1.8% 1.8%
X Northern Mindanao 1.5 1.5 6.0% 2.7% 2.7%
XI Davao Region 2.0 2.1 4.9% 3.7% 3.6%
XII SOCCSKSARGEN 1.1 1.3 10.5% 2.1% 2.2%
XIII Caraga 0.8 0.8 4.1% 1.5% 1.4%
ARMM 0.1 0.1 10.7% 0.2% 0.2%
53.80 56.85 5.7% 100.0% 100.0%
% Share to TotalRegion
Total
Number of deposit accounts
(in millions)

Bank deposits by bucket size
Deposit accounts amounting to P5,000 and below made up 62% of all deposit accounts in banks. While
only 4% of the number of accounts were above the maximum deposit insurance coverage of P500,000,
they held 88% of total deposits in terms of amount.
Deposits from individuals
Nearly half (48%) of the total value of deposits
came from individuals. The remaining half were
deposits of government institutions, banks, and
private corporations.
2016 2017 Growth 2016 2017 Growth
P 5,000 and below 33.2 35.4 6.3% 23.9 26.5 10.9%
P 5,000.01 - P 40,000 10.9 11.7 7.6% 151.2 168.6 11.5%
P 40,000.01 - P 500,000 7.4 7.9 7.2% 1,002.3 1,084.3 8.2%
Over P 500,000 2.0 2.1 8.7% 8,055.3 9,229.8 14.6%
Total 53.5 57.1 6.8% 9,232.8 10,509.2 13.8%
Deposit Size
Number of deposit accounts
(in millions)
Amount of deposits
(in billion pesos)
All Banks U/KBs TBs R/CBs
48% 46%61%
92%
Deposits from individuals, by bank type
From Individuals From Non-individuals
10SES FinInc Form No. 02-001 * Version 0 * Updated 29 Jun 2017
Deposits from individuals increased by 11% to
P5.6 trillion in 2017 from P5.1 trillion in 2016.
Individual deposits had the largest share in R/CBs
(92%) and lowest share in U/KBs (46%), reflecting
the clientele that each bank type serves.
48%
Individuals
52%
Non-individuals
Depositor share on total value of deposits
Dormant accounts
The amount of dormant accounts decreased by 2% to P90 billion in 2017 from P92 billion in 2016.
Dormant accounts made up less than 1% of the total amount of deposits.

Among non-banks, growth was highest among
microfinance NGOs where the total amount of
outstanding loans increased by 39% to P28.6
billion in 2017 from P20.6 billion in 2016.17
Loans in MF NGOs and pawnshops were
relatively small compared to the amount of
outstanding loans in NSSLAs and cooperatives.15
Deposits in non-banks
In 2017, deposits in NSSLAs amounted to P43
billion.13 From 2011 to 2017, the amount of
deposits in NSSLAs increased at an average
annual rate of 13%, comparable with that of
bank deposits.
Loans in banks
Outstanding loans in the banking sector
amounted to P8 trillion in 2017, with average
annual growth of 17% in the past seven years.14
NCR accounted for 85% of the total amount of
loans outstanding in the banking sector.
Loans in non-banks
13 Only the amount of deposits in NSSLAs is available, there are no data on the number of deposit accounts.14 Existing data on the amount of loans include all loans granted by banks, interbank loans and reverse repurchase with the BSP and other banks.15 Based only on a sample of 14 MF NGOs in 2016 and 11 MF NGOs in 2017
Microfinance in the banking sector
In 2017, there were 162 banks with microfinance
operation serving almost 2 million borrowers
with loans outstanding amounting to P17 billion.
From 2011 to 2017, the banks’ microfinance loan
portfolio and number of microfinance borrowers
grew at an average annual rate of 15% and 13%,
respectively. 2011 2012 2013 2014 2015 2016 2017
Loans 7,568 8,414 8,701 11,373 11,256 13,741 17,111
Borrowers 0.98 1.14 1.05 1.23 1.47 1.47 1.96
0.0
0.5
1.0
1.5
2.0
2.5
0
2
4
6
8
10
12
14
16
18in
mill
ion
s
in b
illio
n p
eso
s
Amount of outstanding microfinance loans and number of microfinance borrowers
NSSLAs Pawnshops Cooperatives MicrofinanceNGOs
2016 137.5 27.6 162.4 20.6
2017 153.2 23.3 157.1 28.6
Loans in some non-banks
11SES FinInc Form No. 02-001 * Version 0 * Updated 29 Jun 2017
22%
Real estate activities
Share of loans according to economic activity(Top three)
16%
Wholesale and retail trade, motor vehicle,
motorcycle
14%
Manufacturing

Banks’ offering of different microfinance products generally improved. While the number of banks
providing microenterprise loans decreased, outstanding loans for different types of microfinance
products experienced sustained growth.
2016 2017 Growth
Banks 156 150 -3.8%
Borrowers 1,436,371 1,660,846 15.6%
Amount (in million pesos) 11,956.6 14,234.6 19.1%
Banks 32 37 15.6%
Borrowers 5,537 8,390 51.5%
Amount (in million pesos) 404.4 776.5 92.0%
Banks 26 27 3.8%
Borrowers 39,987 72,480 81.3%
Amount (in million pesos) 303.3 720.9 137.7%
Banks 17 17 0.0%
Borrowers 131,375 138,380 5.3%
Amount (in million pesos) 875.6 1,002.5 14.5%
Microfinance Plus
Micro-Agri Loans
Housing Microfinance Loans
Microenterprise Loans
Seventy five (75) banks have opened micro-deposit
accounts to 4 million microfinance clients with
outstanding balance of P9.7 billion in 2017. The
number and amount of micro-deposits increased
at an average annual rate of 30% and 33%
respectively from 2012 to 2016, faster than the
growth of regular deposit accounts.
Majority of micro-deposit accounts came from
clients with outstanding loans (i.e., compulsory
savings). Nonetheless, clients availing of micro-
deposits only also accounted for a significant share
of the total number of micro-deposit accounts and
total amount of micro-deposits, at 43% and 30%,
respectively.
While micro-deposits have been able to expand
financial access, the very focused and niche
approach resulted in a relatively limited offering by
banks with microfinance operations.
In 2018, the BSP introduced a more general basic
deposit account (BDA) that will address current
limitations and incorporate new features that
characterize ease, accessibility, convenience, and
______
From micro-deposits to basic deposit accounts (BDAs)…
reasonable cost for both banks and clients. Under
Circular No. 992 on the Framework for BDAs,
banks may offer accounts with 0 percent reserve
requirement, liberalized customer onboarding,
opening balance of not more than PHP 100
(approx. USD 2), and the waiver of minimum
maintaining balance and dormancy charges.
To date, a number of banks have already
expressed interest in offering BDAs.
12SES FinInc Form No. 02-001 * Version 0 * Updated 29 Jun 2017
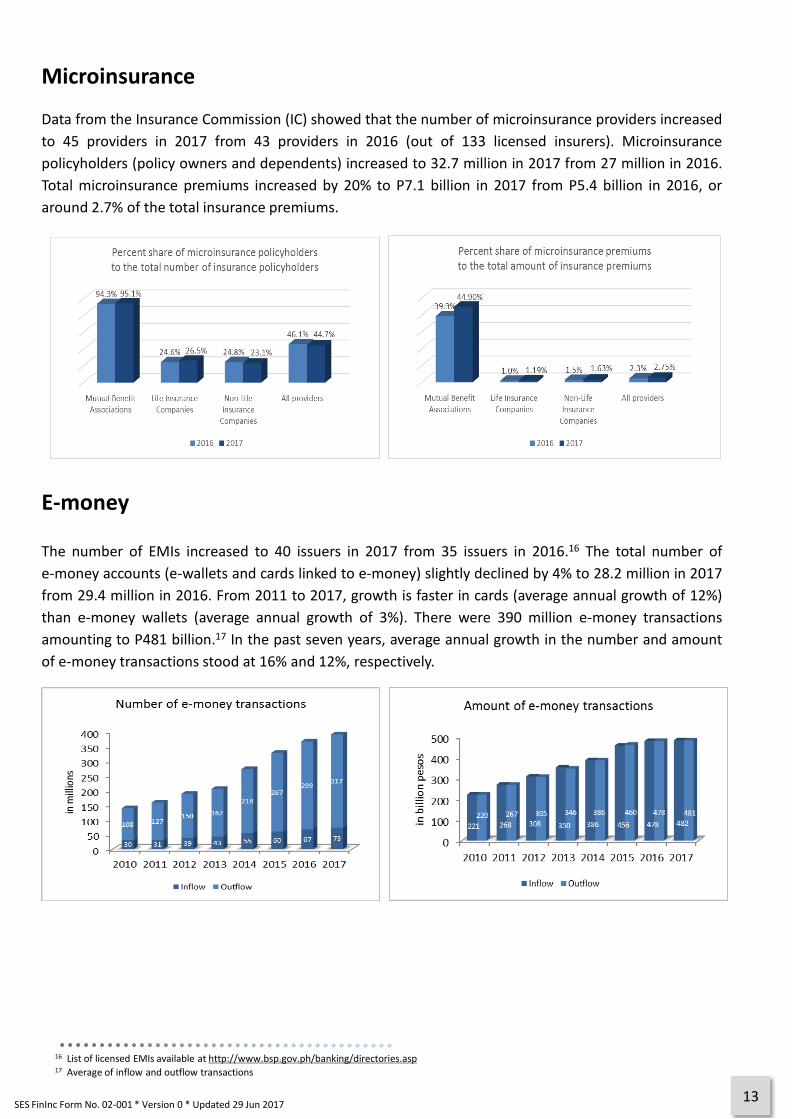
Microinsurance
Data from the Insurance Commission (IC) showed that the number of microinsurance providers increased
to 45 providers in 2017 from 43 providers in 2016 (out of 133 licensed insurers). Microinsurance
policyholders (policy owners and dependents) increased to 32.7 million in 2017 from 27 million in 2016.
Total microinsurance premiums increased by 20% to P7.1 billion in 2017 from P5.4 billion in 2016, or
around 2.7% of the total insurance premiums.
16 List of licensed EMIs available at http://www.bsp.gov.ph/banking/directories.asp17 Average of inflow and outflow transactions
E-money
The number of EMIs increased to 40 issuers in 2017 from 35 issuers in 2016.16 The total number of
e-money accounts (e-wallets and cards linked to e-money) slightly declined by 4% to 28.2 million in 2017
from 29.4 million in 2016. From 2011 to 2017, growth is faster in cards (average annual growth of 12%)
than e-money wallets (average annual growth of 3%). There were 390 million e-money transactions
amounting to P481 billion.17 In the past seven years, average annual growth in the number and amount
of e-money transactions stood at 16% and 12%, respectively.
13SES FinInc Form No. 02-001 * Version 0 * Updated 29 Jun 2017

E-money was mainly used for person-to-person (P2P) or wallet-to-wallet (W2W) transfers with
111 million transactions amounting to P161 billion in 2017. Next were merchant and bills payments, but
the volume and value were smaller compared to fund transfers. The number of e-money transactions for
merchant payments increased by almost three-fold from 5 million transactions in 2016 to 14 million
transactions in 2017.
14SES FinInc Form No. 02-001 * Version 0 * Updated 29 Jun 2017
The BSP initiatives on digital finance, particularly the National Retail Payment System (NRPS), present an
increasing opportunity to further improve acceptance and scale of electronic means of transactions such
as e-money. With the PESONet18 and InstaPay19, payments and transfers can be done electronically in a
safe, efficient, and reliable manner.
18 PESONet is the batch electronic fund transfer credit (EFT) payment stream that provides an electronic alternative to the still widely used paper-based
check system.19 InstaPay was launched as an EFT service that allows customers to transfer PHP funds almost instantly between accounts of participating
BSP-supervised banks and non-bank e-money issuers in the Philippines.

Annexes
A. Cross-country comparison
In comparison with ASEAN peers,20 the Philippines continues to fare in the middle group in terms of
number of financial institutions21 and ATMs per 10,000 adults. While the Philippines is below the ASEAN
median of 4.2 ATMs per 10,000 adults, it is slightly above the ASEAN median of 1.6 financial institutions
per 10,000 adults.
On the geographic indicators per 100 square kilometers,22 the country ranked highly which indicates
shorter distance to the nearest branch or ATM. For both indicators, it falls way above the ASEAN median
of 1.4 financial institutions and 5.5 ATMs per 100 square kilometers.
20 Raw data were sourced from the 2017 IMF Financial Access Survey (FAS)21 Includes head offices and branches of commercial banks, credit unions, financial cooperatives, deposit-taking MFIs, and other deposit takers22 IMF uses total land area in computing the indicator23 Data were sourced from the 2017 World Bank Global Findex
When it comes to usage, the percentage of adults
with a formal account23 in the Philippines likewise
ranked in the middle amongst peers at 34.5%. This
level of account ownership serves as the median
percentage of adults with a formal account
amongst the ASEAN countries. However, this
figure fell short of the average for East Asia and
the Pacific at 70.6% and lower middle income
countries at 57.8%.
15SES FinInc Form No. 02-001 * Version 0 * Updated 29 Jun 2017

Background indicators such as adult population,
land area, and per capita Gross Domestic Product
(GDP) should be taken into account in making
cross-country comparison.
Brunei ranked highly in demographic indicators
(per 10,000 adults) because of its small population.
On the other hand, Singapore ranked highly in
geographic indicators (per 100 sq. km) because of
its small land area in relation to the number of
financial institutions and ATMs, aside from the fact
that these two countries had the highest per capita
GDP in ASEAN.
16SES FinInc Form No. 02-001 * Version 0 * Updated 29 Jun 2017
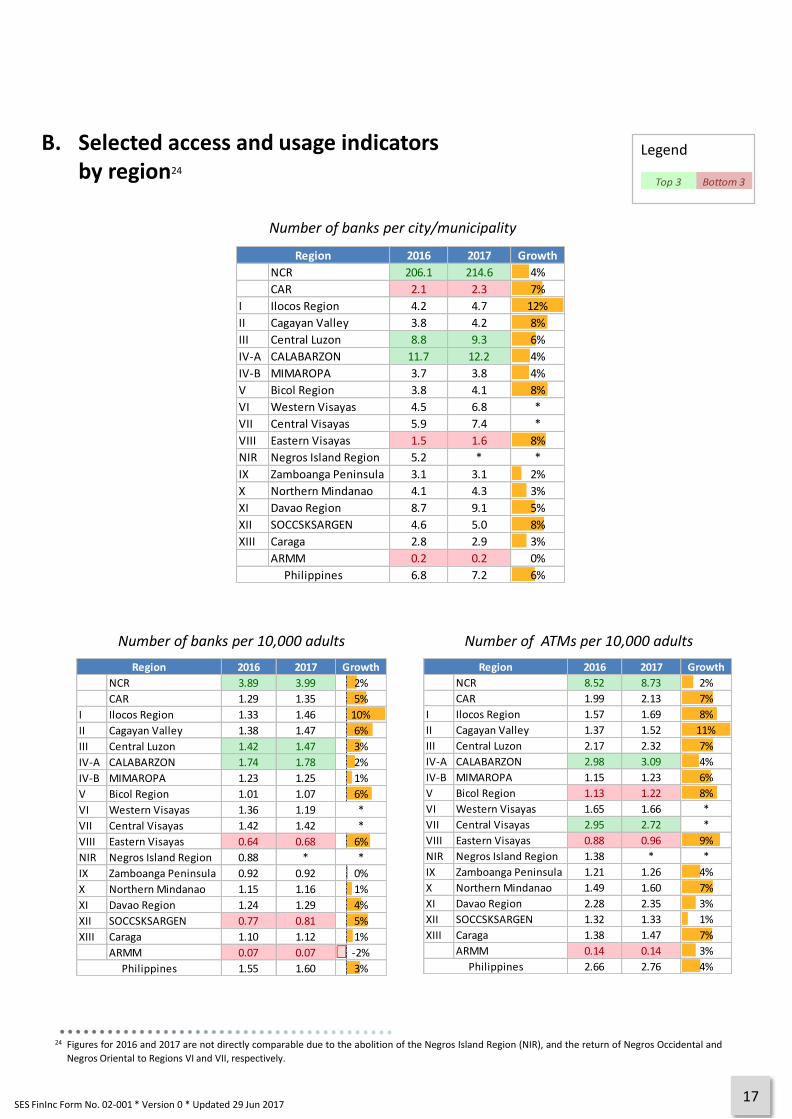
B. Selected access and usage indicatorsby region24
Number of banks per city/municipality
2016 2017 Growth
NCR 206.1 214.6 4%
CAR 2.1 2.3 7%
I Ilocos Region 4.2 4.7 12%
II Cagayan Valley 3.8 4.2 8%
III Central Luzon 8.8 9.3 6%
IV-A CALABARZON 11.7 12.2 4%
IV-B MIMAROPA 3.7 3.8 4%
V Bicol Region 3.8 4.1 8%
VI Western Visayas 4.5 6.8 *
VII Central Visayas 5.9 7.4 *
VIII Eastern Visayas 1.5 1.6 8%
NIR Negros Island Region 5.2 * *
IX Zamboanga Peninsula 3.1 3.1 2%
X Northern Mindanao 4.1 4.3 3%
XI Davao Region 8.7 9.1 5%
XII SOCCSKSARGEN 4.6 5.0 8%
XIII Caraga 2.8 2.9 3%
ARMM 0.2 0.2 0%
6.8 7.2 6%
Region
Philippines
2016 2017 Growth
NCR 3.89 3.99 2%
CAR 1.29 1.35 5%
I Ilocos Region 1.33 1.46 10%
II Cagayan Valley 1.38 1.47 6%
III Central Luzon 1.42 1.47 3%
IV-A CALABARZON 1.74 1.78 2%
IV-B MIMAROPA 1.23 1.25 1%
V Bicol Region 1.01 1.07 6%
VI Western Visayas 1.36 1.19 *
VII Central Visayas 1.42 1.42 *
VIII Eastern Visayas 0.64 0.68 6%
NIR Negros Island Region 0.88 * *
IX Zamboanga Peninsula 0.92 0.92 0%
X Northern Mindanao 1.15 1.16 1%
XI Davao Region 1.24 1.29 4%
XII SOCCSKSARGEN 0.77 0.81 5%
XIII Caraga 1.10 1.12 1%
ARMM 0.07 0.07 -2%
1.55 1.60 3%
Region
Philippines
2016 2017 Growth
NCR 8.52 8.73 2%
CAR 1.99 2.13 7%
I Ilocos Region 1.57 1.69 8%
II Cagayan Valley 1.37 1.52 11%
III Central Luzon 2.17 2.32 7%
IV-A CALABARZON 2.98 3.09 4%
IV-B MIMAROPA 1.15 1.23 6%
V Bicol Region 1.13 1.22 8%
VI Western Visayas 1.65 1.66 *
VII Central Visayas 2.95 2.72 *
VIII Eastern Visayas 0.88 0.96 9%
NIR Negros Island Region 1.38 * *
IX Zamboanga Peninsula 1.21 1.26 4%
X Northern Mindanao 1.49 1.60 7%
XI Davao Region 2.28 2.35 3%
XII SOCCSKSARGEN 1.32 1.33 1%
XIII Caraga 1.38 1.47 7%
ARMM 0.14 0.14 3%
2.66 2.76 4%Philippines
Region
Number of banks per 10,000 adults Number of ATMs per 10,000 adults
Top 3 Bottom 3
Legend
24 Figures for 2016 and 2017 are not directly comparable due to the abolition of the Negros Island Region (NIR), and the return of Negros Occidental and
Negros Oriental to Regions VI and VII, respectively.
17SES FinInc Form No. 02-001 * Version 0 * Updated 29 Jun 2017

Number of banks per 100 sq. km.
Top 3 Bottom 3
Legend
2016 2017 Growth
NCR 726.49 756.34 4%
CAR 4.82 5.17 7%
I Ilocos Region 6.41 7.20 12%
II Cagayan Valley 3.68 3.99 8%
III Central Luzon 9.51 10.04 6%
IV-A CALABARZON 15.83 16.51 4%
IV-B MIMAROPA 2.67 2.78 4%
V Bicol Region 3.50 3.80 8%
VI Western Visayas 5.53 8.39 *
VII Central Visayas 8.90 11.19 *
VIII Eastern Visayas 2.05 2.21 8%
NIR Negros Island Region 3.48 * *
IX Zamboanga Peninsula 3.25 3.32 2%
X Northern Mindanao 4.68 4.84 3%
XI Davao Region 5.75 6.06 5%
XII SOCCSKSARGEN 3.18 3.42 8%
XIII Caraga 3.82 3.95 3%
ARMM 0.30 0.30 0%
7.84 8.27 6%
Region
Philippines
2016 2017 Growth
NCR 1,590.02 1,656.37 4%
CAR 7.45 8.15 9%
I Ilocos Region 7.57 8.35 10%
II Cagayan Valley 3.64 4.11 13%
III Central Luzon 14.51 15.86 9%
IV-A CALABARZON 27.07 28.74 6%
IV-B MIMAROPA 2.50 2.74 10%
V Bicol Region 3.92 4.31 10%
VI Western Visayas 6.69 11.73 *
VII Central Visayas 18.46 21.42 *
VIII Eastern Visayas 2.84 3.15 11%
NIR Negros Island Region 5.45 * *
IX Zamboanga Peninsula 4.30 4.57 6%
X Northern Mindanao 6.08 6.65 9%
XI Davao Region 10.52 11.04 5%
XII SOCCSKSARGEN 5.42 5.63 4%
XIII Caraga 4.77 5.19 9%
ARMM 0.56 0.59 6%
13.44 14.28 6%
Region
Philippines
Number of ATMs per 100 sq. km.
*Based on habitable land area
Number of deposit accounts per 10,000 adults
2016 2017 Growth
NCR 24,623 24,998 2%
CAR 6,800 7,013 3%
I Ilocos Region 4,868 5,173 6%
II Cagayan Valley 4,188 4,462 7%
III Central Luzon 5,357 5,615 5%
IV-A CALABARZON 7,534 7,898 5%
IV-B MIMAROPA 4,860 5,319 9%
V Bicol Region 4,220 4,453 6%
VI Western Visayas 5,446 5,168 *
VII Central Visayas 6,829 6,395 *
VIII Eastern Visayas 2,612 2,791 7%
NIR Negros Island Region 3,797 * *
IX Zamboanga Peninsula 3,950 4,132 5%
X Northern Mindanao 4,372 4,531 4%
XI Davao Region 5,788 5,967 3%
XII SOCCSKSARGEN 3,801 4,100 8%
XIII Caraga 4,161 4,248 2%
ARMM 489 528 8%
7,492 7,750 3%
Region
Philippines
18SES FinInc Form No. 02-001 * Version 0 * Updated 29 Jun 2017

C. Financial Inclusion Index
National
Regional
Provincial
19SES FinInc Form No. 02-001 * Version 0 * Updated 29 Jun 2017
Top 10 Provinces FII Bottom 10 Provinces FII
LAGUNA 0.941 ROMBLON 0.179
BENGUET 0.936 DINAGAT ISLANDS 0.178
DAVAO DEL SUR 0.870 NORTHERN SAMAR 0.163
BATANGAS 0.794 DAVAO OCCIDENTAL 0.114
CAVITE 0.776 SARANGANI 0.111
CEBU 0.772 SULU 0.089
PAMPANGA 0.764 TAWI-TAWI 0.082
BATAAN 0.719 LANAO DEL SUR 0.066
MISAMIS ORIENTAL 0.710 BASILAN 0.044
ZAMBALES 0.707 MAGUINDANAO 0.030
Dimension Indicator 2011 2012 2013 2014 2015 2016 2017
Banks per 10,000 adults 1.40 1.42 1.47 1.50 1.52 1.55 1.60
Other FSPs per 10,000 adults 4.09 5.16 5.35 5.28 5.43 5.93 7.15
Banks per 100 sq. km 6.35 6.60 6.96 7.27 7.55 7.84 8.27
Other FSPs per 100 sq. km 18.52 23.94 25.38 25.59 26.88 30.00 36.95
Deposit accounts per 10,000 adults 6,776 6,328 6,730 6,886 7,090 7,492 7,750
Deposit-to-GDP ratio 0.55 0.54 0.65 0.67 0.69 0.71 0.74
Credit-to-GDP ratio 0.33 0.34 0.37 0.40 0.44 0.47 0.51
0.622 0.624 0.663 0.683 0.701 0.705 0.711
Access
Usage
FII
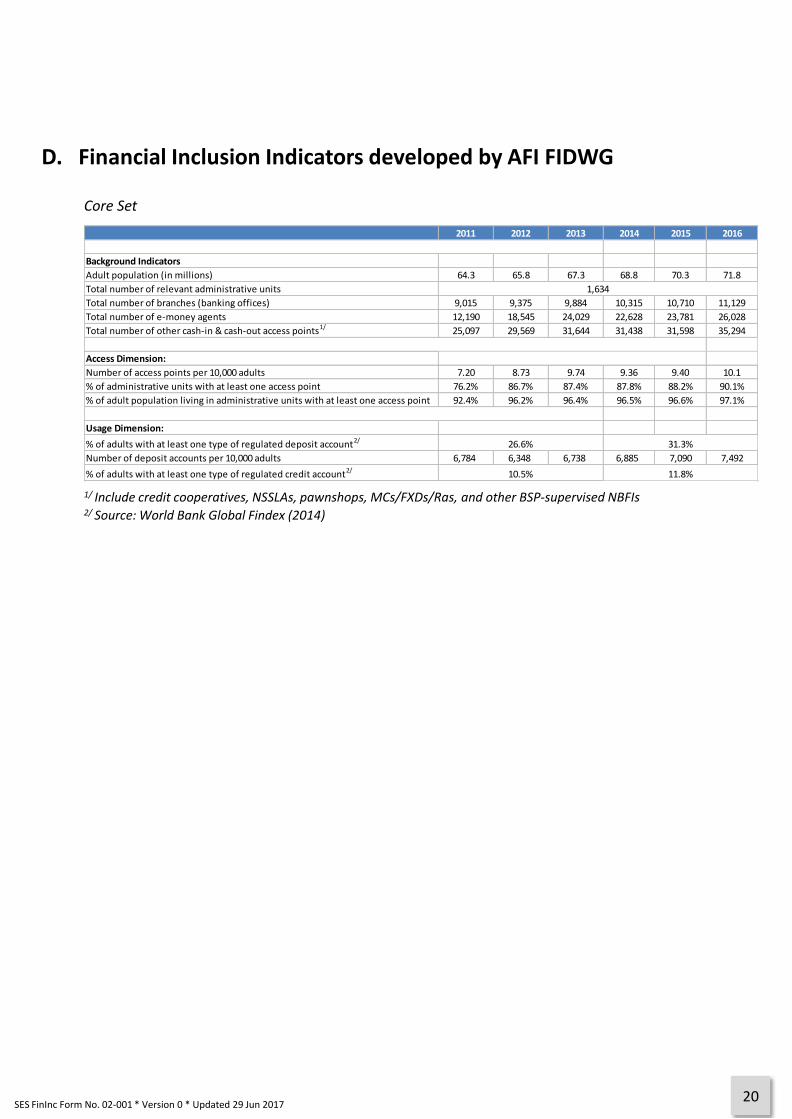
D. Financial Inclusion Indicators developed by AFI FIDWG
Core Set
2011 2012 2013 2014 2015 2016
Background Indicators
Adult population (in millions) 64.3 65.8 67.3 68.8 70.3 71.8
Total number of relevant administrative units
Total number of branches (banking offices) 9,015 9,375 9,884 10,315 10,710 11,129
Total number of e-money agents 12,190 18,545 24,029 22,628 23,781 26,028
Total number of other cash-in & cash-out access points1/ 25,097 29,569 31,644 31,438 31,598 35,294
Access Dimension:
Number of access points per 10,000 adults 7.20 8.73 9.74 9.36 9.40 10.1
% of administrative units with at least one access point 76.2% 86.7% 87.4% 87.8% 88.2% 90.1%
% of adult population living in administrative units with at least one access point 92.4% 96.2% 96.4% 96.5% 96.6% 97.1%
Usage Dimension:
% of adults with at least one type of regulated deposit account2/
Number of deposit accounts per 10,000 adults 6,784 6,348 6,738 6,885 7,090 7,492
% of adults with at least one type of regulated credit account2/
26.6%
10.5%
1,634
31.3%
11.8%
1/ Include credit cooperatives, NSSLAs, pawnshops, MCs/FXDs/Ras, and other BSP-supervised NBFIs2/ Source: World Bank Global Findex (2014)
20SES FinInc Form No. 02-001 * Version 0 * Updated 29 Jun 2017

About the Center for Learning and Inclusion Advocacy (CLIA)
CLIA was created in October 2018 to strengthen the capability of the Bangko Sentral ng Pilipinas (BSP) toachieve its strategic objective of building an inclusive financial system through a unified, standardized, andsustainable execution of its financial advocacy strategy. It is composed of two (2) functional groups: theFinancial Inclusion Group (FIG) and Consumer Empowerment Group (CEG).
FIG is responsible for the analysis of financial inclusionand consumer empowerment data to support evidence-based policymaking, development of regulations, andprogress monitoring of initiatives; and responsible forthe design and implementation of advocacy programs,conduct of knowledge exchanges and management ofdonor relations, providing technical and secretariatsupport to the National Strategy for Financial Inclusion,and engagement in national, regional and globalassociations/fora to cultivate the BSP's status asthought leader in financial inclusion.
CEG is responsible for the implementation ofthe BSP Consumer Assistance Mechanism,design and execution of policies and programson consumer protection, data management, andreports preparation and also responsible for themanagement of strategic partnerships topromote financial education, design andimplementation of policies and programs onfinancial education, and development oflearning materials with focus on digital contentcreation.
SES FinInc Form No. 02-001 * Version 0 * Updated 29 Jun 2017

Report on the State of Financial Inclusionin the Philippines 2017
Bangko Sentral ng PilipinasA. Mabini cor. P. Ocampo Streets, Malate, Manila 1004
http://www.bsp.gov.ph/about/[email protected]
SES FinInc Form No. 02-001 * Version 0 * Updated 29 Jun 2017