report to the school board
TRANSCRIPT

2015-16
Report to the School Board February 18, 2016 – Goal 1 (Strategies 1-4) • Dr. Francisco Durán, Chief Academic Officer
FCPS STRATEGIC PLAN

2015-16
2
THE FOUR GOALS ARE:
Student Success We commit to reach, challenge, and prepare every student for success in school and life.
Caring Culture We commit to foster a responsive, caring, and inclusive culture where all feel valued, supported, and hopeful.
Premier Workforce We commit to invest in our employees, encourage innovation, and celebrate success.
Resource Stewardship We commit to champion the needs of our school communities and be responsible stewards of the public’s investment.
FAIRFAX COUNTY PUBLIC SCHOOLS STRATEGIC PLAN

3
GOAL 1 STUDENT SUCCESS We commit to reach, challenge, and prepare every student for success in school and life.
“It is the supreme art of the teacher to awaken joy in creative expression and knowledge”
Albert Einstein

2015-16
Enhance instructional practices to ensure that all students receive an education in a dynamic environment designed to foster life-long learning and support them in achieving their full potential
OVERARCHING Strategy 1
4
The curriculum will reflect Portrait of a Graduate outcomes in all content areas,
where students are appropriately challenged
DESIRED OUTCOME:
2015-16
Enhance instructional practices to ensure that all students receive an education in a dynamic environment designed to foster life-long learning and support them in achieving their full potential
OVERARCHING Strategy 1
5
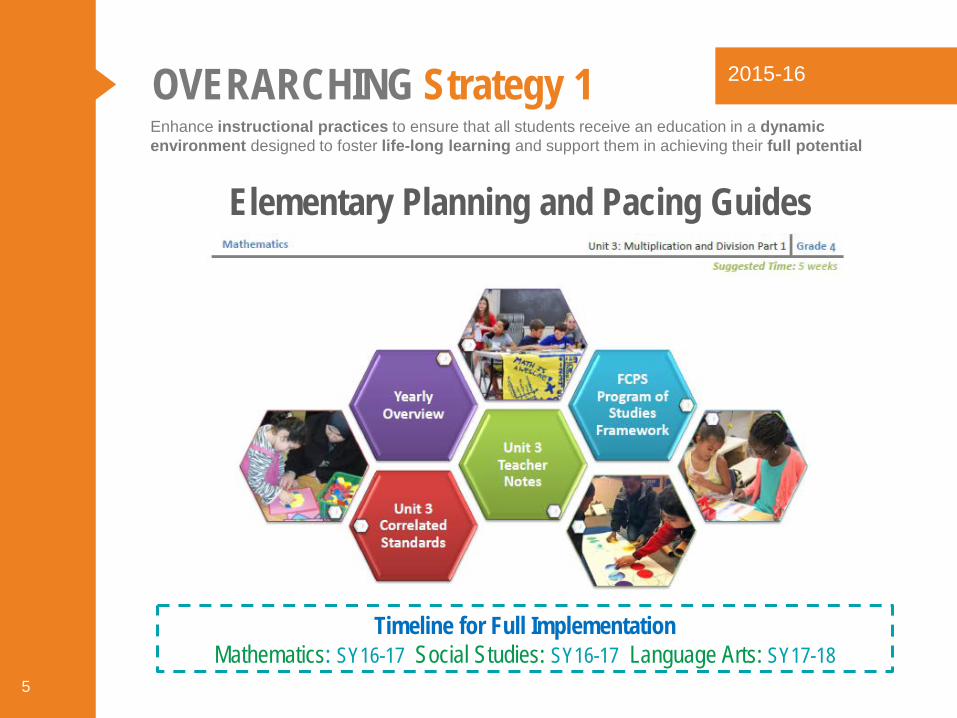
Elementary Planning and Pacing Guides
Timeline for Full Implementation Mathematics: SY16-17 Social Studies: SY16-17 Language Arts: SY17-18

2015-16
Enhance instructional practices to ensure that all students receive an education in a dynamic environment designed to foster life-long learning and support them in achieving their full potential
OVERARCHING Strategy 1
6
• Rubrics are in development for each of the POG attributes
• These will be flexible resources for teachers and students that will inform understanding of what each attribute might look like and to measure student growth
Portrait of a Graduate Rubrics

2015-16
Enhance instructional practices to ensure that all students receive an education in a dynamic environment designed to foster life-long learning and support them in achieving their full potential
OVERARCHING Strategy 1
7
Realizing this goal through professional learning: • Developed an Academy course that
has trained over 750 FCPS teachers
• Working with the Buck Institute to develop an implementation plan that will help us strategically reach our PBL goals
• Developing teacher leader capacity to provide job-embedded training in PBL work
Project Based Learning (PBL)

2015-16
Enhance instructional practices to ensure that all students receive an education in a dynamic environment designed to foster life-long learning and support them in achieving their full potential
OVERARCHING Strategy 1
8
Percentage overall and by subgroups of students successfully completing Advanced Placement (AP), International Baccalaureate (IB), or dual enrollment and honors courses, as well as percentage of students taking AP exams and their grades
2013 2014 2015All 70 70 70Asian 82 82 82Black 48 50 51Hispanic 51 50 51White 77 76 77
0
20
40
60
80
100
Perc
ent P
assi
ng
Percent of graduates who passed at least one AP/IB/Dual Enrollment course—by Ethnicity

2015-16
Enhance instructional practices to ensure that all students receive an education in a dynamic environment designed to foster life-long learning and support them in achieving their full potential
OVERARCHING Strategy 1
9
Percentage overall and by subgroups of students successfully completing Advanced Placement (AP), International Baccalaureate (IB), or dual enrollment and honors courses, as well as percentage of students taking AP exams and their grades
2013 2014 2015All 70 70 70Economically
Disadvantaged 48 50 50
Limited EnglishProficient 32 30 27
Students withDisabilities 20 20 19
0
20
40
60
80
100
Perc
ent P
assi
ng
Percent of graduates who passed at least one AP/IB/Dual Enrollment course—by Subgroup

2015-16
Enhance instructional practices to ensure that all students receive an education in a dynamic environment designed to foster life-long learning and support them in achieving their full potential
OVERARCHING Strategy 1
10
Graduation rates
Note: OGR Graduates are defined as students who earn Advanced Studies, Standard, Modified Standard, Special and General Achievement Diplomas. On-time graduates are graduates who earn diplomas within four years of the first time they entered the 9th grade.
Data Source: Virginia Department of Education, Virginia Cohort Reports
Class of 2011 Class of 2012 Class of 2013 Class of 2014 Class of 2015All 91.4 90.8 91.6 92.6 92.5Asian 95.2 94.5 94.9 95.7 95.6Black 87.5 87.6 88.0 90.7 89.8Hispanic 77.4 75.0 79.4 80.3 79.6White 96.3 96.5 95.9 97.1 97.1
0
20
40
60
80
100
Gra
duat
ion
Rat
e
On-Time Graduation Rate (OGR) Virginia’s Official Graduation Rate by Ethnicity

2015-16
Enhance instructional practices to ensure that all students receive an education in a dynamic environment designed to foster life-long learning and support them in achieving their full potential
OVERARCHING Strategy 1
11
Graduation rates
Note: OGR Graduates are defined as students who earn Advanced Studies, Standard, Modified Standard, Special and General Achievement Diplomas. On-time graduates are graduates who earn diplomas within four years of the first time they entered the 9th grade.
Data Source: Virginia Department of Education, Virginia Cohort Reports
Class of 2011 Class of 2012 Class of 2013 Class of 2014 Class of 2015All 91.4 90.8 91.6 92.6 92.5EconomicallyDisadvantaged 84.8 82.9 84.3 85.9 83.7
Limited EnglishProficient 77.3 70.0 66.1 68.4 62.8
Students withDisabilities 90.5 89.0 89.6 90.1 89.9
0
20
40
60
80
100
Gra
duat
ion
Rat
e
On-Time Graduation Rate (OGR) Virginia’s Official Graduation Rate by Subgroup
2015-16
Enhance instructional practices to ensure that all students receive an education in a dynamic environment designed to foster life-long learning and support them in achieving their full potential
OVERARCHING Strategy 1
12
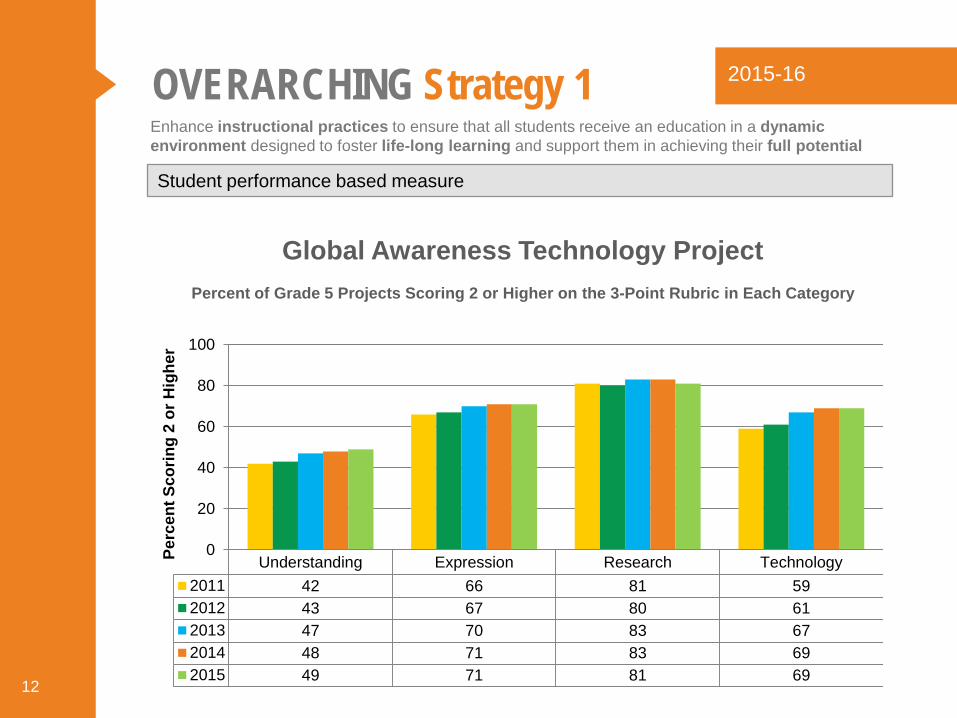
Global Awareness Technology Project
Percent of Grade 5 Projects Scoring 2 or Higher on the 3-Point Rubric in Each Category
Student performance based measure
Understanding Expression Research Technology2011 42 66 81 592012 43 67 80 612013 47 70 83 672014 48 71 83 692015 49 71 81 69
0
20
40
60
80
100
Perc
ent S
corin
g 2
or H
ighe
r

2015-16
Enhance instructional practices to ensure that all students receive an education in a dynamic environment designed to foster life-long learning and support them in achieving their full potential
OVERARCHING Strategy 1
13
• This data point has been incorporated into Overarching Strategy 4 and will be shared in that report.
Work in progress: • ISD is examining ways to assess college and
workforce readiness of our students in partnership with local colleges, universities, and business partners.
Percentage overall and by subgroups of students meeting college and workforce-readiness benchmarks on Division assessments
2015-16
Enhance instructional practices to ensure that all students receive an education in a dynamic environment designed to foster life-long learning and support them in achieving their full potential
OVERARCHING Strategy 1
14
• This data point has been incorporated into Overarching Strategy 4 and will be shared in that report.
Degree of performance above state and national averages on SAT and ACT

2015-16
Enhance instructional practices to ensure that all students receive an education in a dynamic environment designed to foster life-long learning and support them in achieving their full potential
OVERARCHING Strategy 1
15
Achievement gaps will be eliminated DESIRED OUTCOME:

2015-16
Enhance instructional practices to ensure that all students receive an education in a dynamic environment designed to foster life-long learning and support them in achieving their full potential
OVERARCHING Strategy 1
16
Strengthening Elementary Mathematics Program
Ensure all students with high math aptitude have access the most challenging curriculum
Ensure equal opportunities at every elementary school for access to Advanced Mathematics curriculum
Response to Mathematics
Study Findings Shared professional
development for school-based principals and teacher leaders
Build common understanding of teaching practices that promote deep learning of mathematics for all students.
Elementary Mathematics
Leaders Meetings

2015-16
Enhance instructional practices to ensure that all students receive an education in a dynamic environment designed to foster life-long learning and support them in achieving their full potential
OVERARCHING Strategy 1
17
Percentage overall and by subgroups of students successfully completing Algebra 1 by 8th grade
2011 2012 2013 2014 2015All 63 61 61 59 58Asian 76 78 78 77 77Black 41 39 38 37 38Hispanic 37 35 35 32 30White 73 70 70 68 69
0
20
40
60
80
100
Perc
ent
Succ
essf
ully
Com
plet
ing
Percent of Students Successfully Completing Algebra 1 (Passed both Course and SOL)
by the End of Grade 8—by Ethnicity
2009 Standards 2001 Standards

2015-16
Enhance instructional practices to ensure that all students receive an education in a dynamic environment designed to foster life-long learning and support them in achieving their full potential
OVERARCHING Strategy 1
18
Percentage overall and by subgroups of students successfully completing Algebra 1 by 8th grade
2011 2012 2013 2014 2015All 63 61 61 59 58EconomicallyDisadvantaged 36 35 33 33 29
Limited EnglishProficient 37 37 22 19 16
Students withDisabilities 20 17 15 13 13
0
20
40
60
80
100
Perc
ent
Succ
essf
ully
Com
plet
ing
Percent of Students Successfully Completing Algebra I (Passed both Course and SOL)
by the End of Grade 8—by Subgroup
2009 Standards 2001 Standards
2015-16
Enhance instructional practices to ensure that all students receive an education in a dynamic environment designed to foster life-long learning and support them in achieving their full potential
OVERARCHING Strategy 1
19
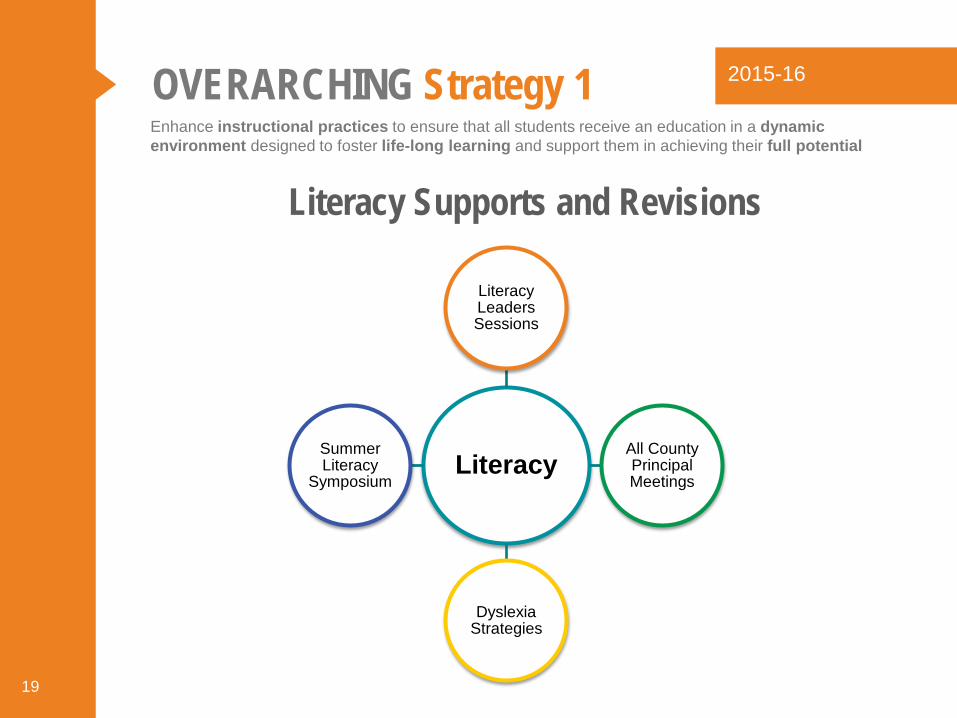
Literacy Supports and Revisions
Literacy
Literacy Leaders Sessions
All County Principal Meetings
Dyslexia Strategies
Summer Literacy
Symposium
2015-16
Enhance instructional practices to ensure that all students receive an education in a dynamic environment designed to foster life-long learning and support them in achieving their full potential
OVERARCHING Strategy 1
20
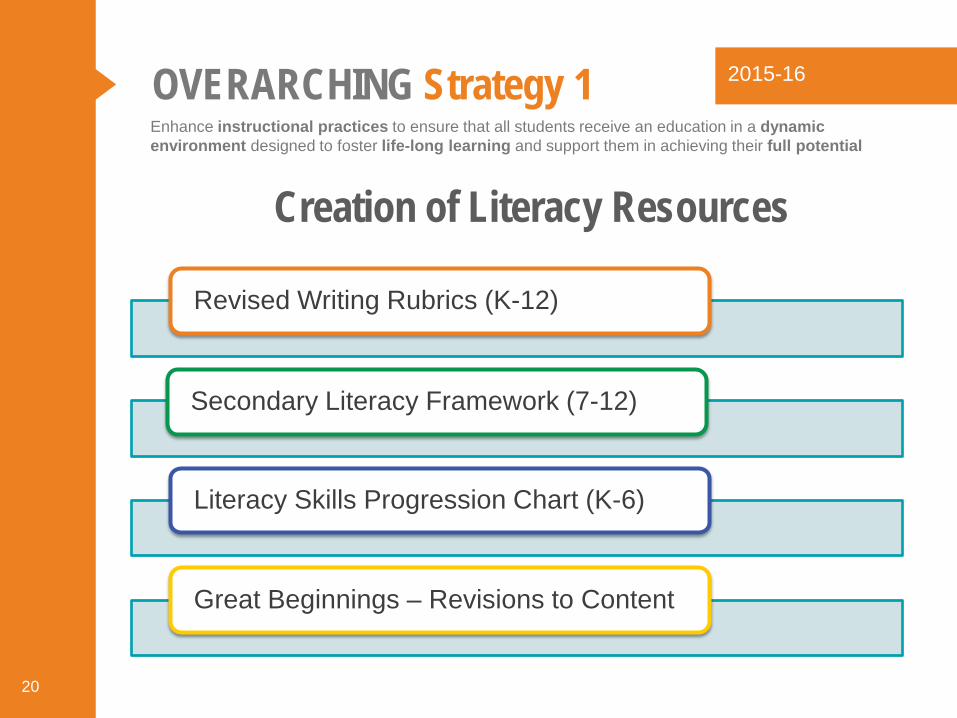
Revised Writing Rubrics (K-12)
Secondary Literacy Framework (7-12)
Literacy Skills Progression Chart (K-6)
Great Beginnings – Revisions to Content
Creation of Literacy Resources

2015-16
Enhance instructional practices to ensure that all students receive an education in a dynamic environment designed to foster life-long learning and support them in achieving their full potential
OVERARCHING Strategy 1
21
Grade level reading proficiency by the end of 3rd grade
2013 2014 2015All 79 74 81Asian 87 82 88Black 62 57 67Hispanic 67 60 69White 86 83 87
0
20
40
60
80
100
Perc
ent P
assi
ng
SOL Grade 3 Reading Pass Rates by Ethnicity—2013 to 2015
Data Source: Virginia Department of Education, Report Card data; includes SOL, VAAP, VGLA and substitute tests from previous year

2015-16
Enhance instructional practices to ensure that all students receive an education in a dynamic environment designed to foster life-long learning and support them in achieving their full potential
OVERARCHING Strategy 1
22
Grade level reading proficiency by the end of 3rd grade
2013 2014 2015All 79 74 81Economically
Disadvantaged 63 57 66
Limited EnglishProficient 69 64 70
Students withDisabilities 63 58 61
0
20
40
60
80
100
Perc
ent P
assi
ng
SOL Grade 3 Reading Pass Rates by Subgroup—2013 to 2015
Data Source: Virginia Department of Education, Report Card data; includes SOL, VAAP, VGLA and substitute tests from previous year

2015-16
Enhance instructional practices to ensure that all students receive an education in a dynamic environment designed to foster life-long learning and support them in achieving their full potential
OVERARCHING Strategy 1
23
• Opened pilot programs at Lee and Stuart HS using School within a School and Pathway to Graduation models
• Developed new course sequence and curriculum designed to create a four-year pathway to graduation for English learners
• Year 1 of pilot underway, planning for expansion to all high schools 2016-17
Enhanced ESOL Programming Pilot

2015-16
Enhance instructional practices to ensure that all students receive an education in a dynamic environment designed to foster life-long learning and support them in achieving their full potential
OVERARCHING Strategy 1
24
Percentage of English Language Learners who demonstrate competency and progress on WIDA ACCESS and VDOE growth measures
Progress 2012 to 2013 Progress 2013 to 2014 Progress 2014 to 2015Virginia 81 80FCPS All 82 81 81FCPS Grades 1-6 88 87 89FCPS Grades 7-12 67 65 63
0
20
40
60
80
100
Perc
ent
Percentage of ELL Students Who Meet or Exceed VDOE Progress Targets on Two Consecutive WIDA Tests
Not Available

2015-16
Enhance instructional practices to ensure that all students receive an education in a dynamic environment designed to foster life-long learning and support them in achieving their full potential
OVERARCHING Strategy 1
25
Closing the Achievement Gap

2015-16
Enhance instructional practices to ensure that all students receive an education in a dynamic environment designed to foster life-long learning and support them in achieving their full potential
OVERARCHING Strategy 1
26 2006—First year of reading tests in grades 4,6, and 7 2005 and 2006—Stanford English Language Proficiency Assessment (SELP) available for Limited English Proficient (LEP) students 2007—SELP or Virginia Grade Level Alternative (VGLA) not available for LEP students 2008 to 2015—VGLA available for LEP Students
Reduction in achievement gaps
2005 2006 2007 2008 2009 2010 2011 2012 2013 2014 2015All 87 91 87 92 93 93 93 94 82 81 85Asian 90 93 89 94 96 96 96 96 88 88 92Black 71 76 75 80 84 85 87 88 68 68 74Hispanic 76 82 69 84 87 86 86 87 66 64 70White 92 95 94 96 97 97 97 97 90 89 92
0
20
40
60
80
100
Perc
ent P
assi
ng
The Achievement Gap in Reading by Ethnicity—Pass Rate 2005 to 2015
2010 Standards 2002 Standards 1995
Standards

2015-16
Enhance instructional practices to ensure that all students receive an education in a dynamic environment designed to foster life-long learning and support them in achieving their full potential
OVERARCHING Strategy 1
27 2006—First year of mathematics tests in grades 4,6, and 7
Reduction in achievement gaps
2005 2006 2007 2008 2009 2010 2011 2012 2013 2014 2015All 89 82 84 87 90 92 92 78 79 81 83Asian 93 89 91 93 95 96 97 89 90 91 93Black 73 64 67 73 79 83 83 61 63 66 71Hispanic 77 66 68 73 78 82 85 60 61 64 68White 93 89 91 92 94 95 96 86 86 88 90
0
20
40
60
80
100
Perc
ent P
assi
ng
The Achievement Gap in Mathematics by Ethnicity—Pass Rate 2005 to 2015
2009 Standards 2001 Standards

2015-16
Enhance instructional practices to ensure that all students receive an education in a dynamic environment designed to foster life-long learning and support them in achieving their full potential
OVERARCHING Strategy 1
28 2006—First year of reading tests in grades 4,6, and 7 2005 and 2006—Stanford English Language Proficiency Assessment (SELP) available for Limited English Proficient (LEP) students 2007—SELP or Virginia Grade Level Alternative (VGLA) not available for LEP students 2008 to 2015—VGLA available for LEP Students
Reduction in achievement gaps
2005 2006 2007 2008 2009 2010 2011 2012 2013 2014 2015All 469 486 480 468 463 462 476 475 432 434 440Asian 476 495 486 473 472 476 491 492 448 453 460Black 426 444 437 424 417 414 431 435 399 402 413Hispanic 440 452 422 369 359 362 403 406 377 377 386White 486 526 504 505 503 501 509 507 458 460 464
300
350
400
450
500
550
600
Aver
age
SOL
Scal
ed S
core
The Achievement Gap in Reading by Ethnicity—Average SOL Scaled Score 2005 to 2015
2010 Standards 2002 Standards 1995 Standards

2015-16
Enhance instructional practices to ensure that all students receive an education in a dynamic environment designed to foster life-long learning and support them in achieving their full potential
OVERARCHING Strategy 1
29 2006—First year of mathematics tests in grades 4,6, and 7
Reduction in achievement gaps
2005 2006 2007 2008 2009 2010 2011 2012 2013 2014 2015All 478 467 472 474 476 477 483 436 437 443 451Asian 518 499 496 502 506 508 515 464 468 476 483Black 432 417 422 424 425 427 435 400 401 408 419Hispanic 446 423 425 423 422 423 437 400 399 403 416White 508 526 488 492 494 495 500 448 450 457 464
300
350
400
450
500
550
600
Aver
age
SOL
Scal
ed S
core
The Achievement Gap in Mathematics by Ethnicity—Average SOL Scaled Score 2005 to 2015
2009 Standards 2001 Standards
2015-16
Enhance instructional practices to ensure that all students receive an education in a dynamic environment designed to foster life-long learning and support them in achieving their full potential
OVERARCHING Strategy 1
30
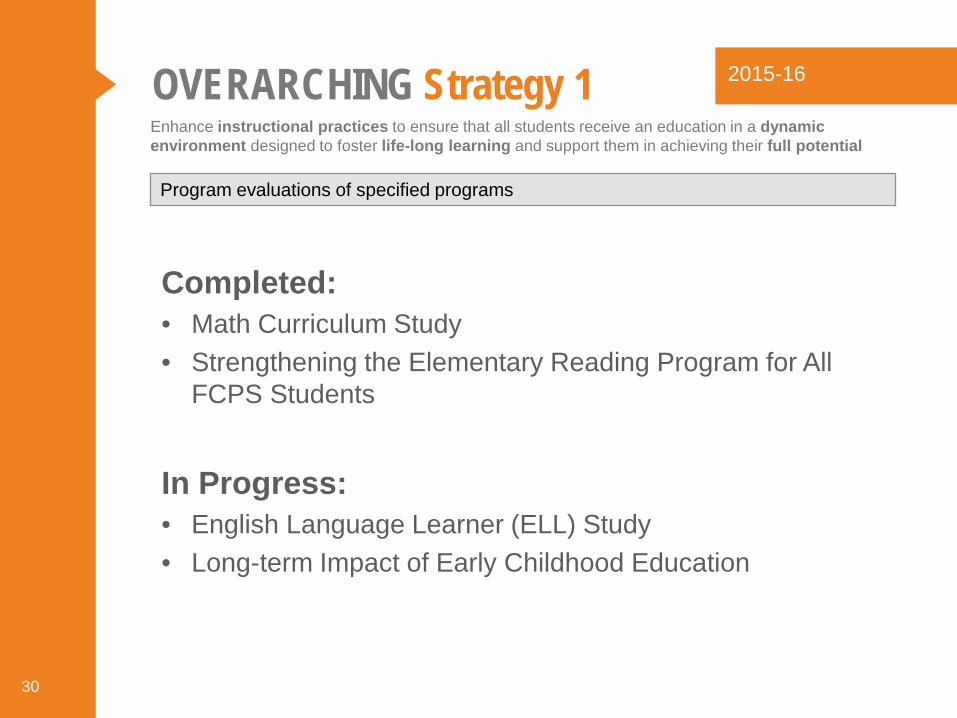
Completed: • Math Curriculum Study • Strengthening the Elementary Reading Program for All
FCPS Students
In Progress: • English Language Learner (ELL) Study • Long-term Impact of Early Childhood Education
Program evaluations of specified programs

2015-16
Enhance instructional practices to ensure that all students receive an education in a dynamic environment designed to foster life-long learning and support them in achieving their full potential
OVERARCHING Strategy 1
31
Teachers, students and parents will have access to contemporary and effective
technology resources
DESIRED OUTCOME:

2015-16
Enhance instructional practices to ensure that all students receive an education in a dynamic environment designed to foster life-long learning and support them in achieving their full potential
OVERARCHING Strategy 1
32
FCPS Digital Ecosystem

2015-16
Enhance instructional practices to ensure that all students receive an education in a dynamic environment designed to foster life-long learning and support them in achieving their full potential
OVERARCHING Strategy 1
33
Work in progress: • This metric will be available after work around digital
transformation is completed, including development of the standards, professional development, and the implementation of one to one. This data point is not currently collected in the teacher evaluation process.
Percentage of teachers effectively integrating technology into curriculum delivery as measured by the teacher evaluation process

2015-16
Enhance instructional practices to ensure that all students receive an education in a dynamic environment designed to foster life-long learning and support them in achieving their full potential
OVERARCHING Strategy 1
34
• 6 FCPS High Schools qualified o Annandale, Falls Church, Fairfax Adult, Lee, Mount Vernon, and
Stuart
• Criteria included student achievement, ESOL population and SES level
• Funds support ensuring all students have a computing device over the 4-year implementation
o All 9th grade students in year one o Staff development for teachers o Information for parents
eLearning Backpack Grant Project (1:1 Pilot)

2015-16
Enhance instructional practices to ensure that all students receive an education in a dynamic environment designed to foster life-long learning and support them in achieving their full potential
OVERARCHING Strategy 1
35
Digital Citizenship

2015-16
Enhance instructional practices to ensure that all students receive an education in a dynamic environment designed to foster life-long learning and support them in achieving their full potential
OVERARCHING Strategy 1
36
Centralized support will be available for schools and school staff based on student
achievement needs
DESIRED OUTCOME:

2015-16
Enhance instructional practices to ensure that all students receive an education in a dynamic environment designed to foster life-long learning and support them in achieving their full potential
OVERARCHING Strategy 1
37
Project Momentum Supports
Additional Funding
Extended Contracts
Battelle for Kids & ICLE
Strategic Job-
Embedded PD
Intensive Central Office
Support
Monthly Monitor Meetings

2015-16
All students will achieve their full potential through the use of assessment and data systems for decision making that support student attainment of the outcomes defined by the Portrait of a Graduate
OVERARCHING Strategy 2
38
A fully-developed balanced assessment system will reflect Portrait of a Graduate
outcomes in all content areas
DESIRED OUTCOME:

2015-16
All students will achieve their full potential through the use of assessment and data systems for decision making that support student attainment of the outcomes defined by the Portrait of a Graduate
OVERARCHING Strategy 2
39
• Promoting the expanded use of Performance-Based Assessments through professional development and ready to use assessments across subjects and grade levels
• Leveraging and refining existing tasks such as the Global Awareness Technology Project as we consider cornerstone and capstone projects
Performance-Based Assessments

2015-16
All students will achieve their full potential through the use of assessment and data systems for decision making that support student attainment of the outcomes defined by the Portrait of a Graduate
OVERARCHING Strategy 2
40
Passages Report
Grade 3 Grade 6 Grade 82011 84 86 912012 67 85 802013 63 79 742014 60 77 742015 66 80 76
0
20
40
60
80
100
Perc
ent P
assi
ng
Grades 3, 6, 8: Percent Passing Both Reading and Mathematics
Graduates2011 922012 872013 822014 792015 82
0
20
40
60
80
100
Graduates: Percent Taking and Passing All 5 Academic Core Subjects
2012—New standard in mathematics 2013—New standards in reading

2015-16
All students will achieve their full potential through the use of assessment and data systems for decision making that support student attainment of the outcomes defined by the Portrait of a Graduate
OVERARCHING Strategy 2
41
Data tools will be available to schools, school teams, and individual teachers to diagnose and monitor individual student
progress
DESIRED OUTCOME:

2015-16
All students will achieve their full potential through the use of assessment and data systems for decision making that support student attainment of the outcomes defined by the Portrait of a Graduate
OVERARCHING Strategy 2
42
• Collaboration between the departments of Special Services, Information Technology, and Instructional Services, along with the Region offices
• Tracks student performance to benchmarks
• Integration of intervention plan and progress monitoring
Data Tools to Diagnose and Monitor Individual Student Progress

2015-16
All students will achieve their full potential through the use of assessment and data systems for decision making that support student attainment of the outcomes defined by the Portrait of a Graduate
OVERARCHING Strategy 2
43
• Data team member assigned to each intensive school as part of school support team
• All targeted schools served by data team members
Project Momentum
Benchmarking Analysis

2015-16
All students will achieve their full potential through the use of assessment and data systems for decision making that support student attainment of the outcomes defined by the Portrait of a Graduate
OVERARCHING Strategy 2
44
Grading will be an accurate reflection of learning
DESIRED OUTCOME:

2015-16
All students will achieve their full potential through the use of assessment and data systems for decision making that support student attainment of the outcomes defined by the Portrait of a Graduate
OVERARCHING Strategy 2
45
• Continued work towards consistent and equitable practices that reflect student learning
• Involvement of stakeholders • Development of new policies
for fall 2016 implementation • Expand effort to address issues
related to homework
Secondary Grading and Reporting Project
2015-16
All students will achieve their full potential through the use of assessment and data systems for decision making that support student attainment of the outcomes defined by the Portrait of a Graduate
OVERARCHING Strategy 2
46
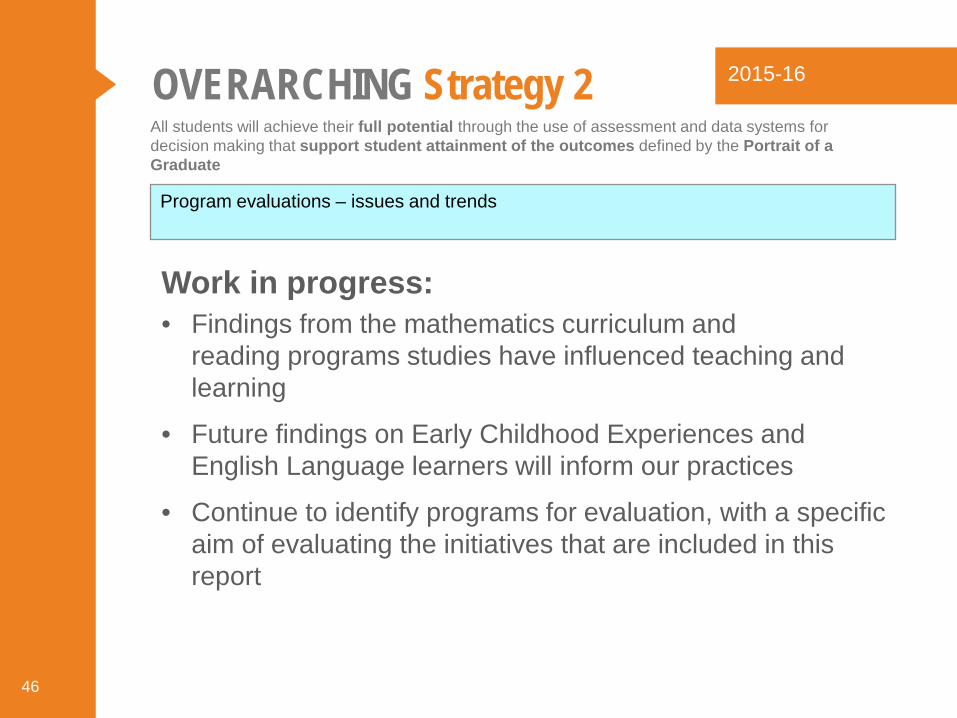
Work in progress: • Findings from the mathematics curriculum and elementary
reading programs studies have influenced teaching and learning
• Future findings on Early Childhood Experiences and English Language learners will inform our practices
• Continue to identify programs for evaluation, with a specific aim of evaluating the initiatives that are included in this report
Program evaluations – issues and trends

2015-16
Provide quality Early Childhood experiences aligned with Portrait of a Graduate outcomes that are designed to prepare students to successfully enter Kindergarten
OVERARCHING Strategy 3
47
All qualifying future FCPS students will have access to high quality early education
programs
DESIRED OUTCOME:

2015-16
Provide quality Early Childhood experiences aligned with Portrait of a Graduate outcomes that are designed to prepare students to successfully enter Kindergarten
OVERARCHING Strategy 3
48
Early Childhood Opportunities:
Center-Based
Family Child Care
Home
Pre-K
Experiences
FCPS and Fairfax County
FCPS and Fairfax County
FCPS and Fairfax County

2015-16
Provide quality Early Childhood experiences aligned with Portrait of a Graduate outcomes that are designed to prepare students to successfully enter Kindergarten
OVERARCHING Strategy 3
49
School Readiness = Quality + Access
2015-16
Provide quality Early Childhood experiences aligned with Portrait of a Graduate outcomes that are designed to prepare students to successfully enter Kindergarten
OVERARCHING Strategy 3
50
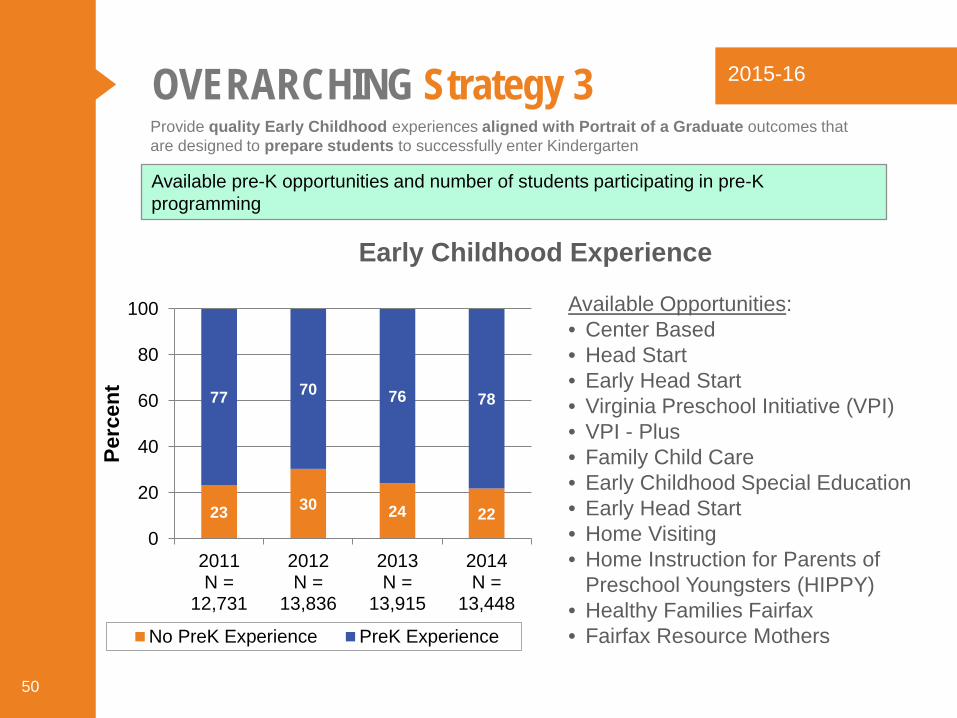
Early Childhood Experience
Available pre-K opportunities and number of students participating in pre-K programming
23 30 24 22
77 70 76 78
0
20
40
60
80
100
2011N =
12,731
2012N =
13,836
2013N =
13,915
2014N =
13,448
Perc
ent
No PreK Experience PreK Experience
Available Opportunities: • Center Based • Head Start • Early Head Start • Virginia Preschool Initiative (VPI) • VPI - Plus • Family Child Care • Early Childhood Special Education • Early Head Start • Home Visiting • Home Instruction for Parents of
Preschool Youngsters (HIPPY) • Healthy Families Fairfax • Fairfax Resource Mothers

2015-16
Provide quality Early Childhood experiences aligned with Portrait of a Graduate outcomes that are designed to prepare students to successfully enter Kindergarten
OVERARCHING Strategy 3
51
A comprehensive report on kindergarten students who received pre-school service
Work in Progress: • This report will be an outcome of the program evaluation
currently in progress, as reported in Overarching Strategies 1 and 2.
2015-16
Provide quality Early Childhood experiences aligned with Portrait of a Graduate outcomes that are designed to prepare students to successfully enter Kindergarten
OVERARCHING Strategy 3
52
All agencies will coordinate their efforts to provide similar early childhood experiences
DESIRED OUTCOME:

2015-16
Provide quality Early Childhood experiences aligned with Portrait of a Graduate outcomes that are designed to prepare students to successfully enter Kindergarten
OVERARCHING Strategy 3
53
Fairfax County Public Schools
School Readiness
Council VPI Head Start Early Head
Start VPI+ NSRT
Partnerships
2015-16
Provide quality Early Childhood experiences aligned with Portrait of a Graduate outcomes that are designed to prepare students to successfully enter Kindergarten
OVERARCHING Strategy 3
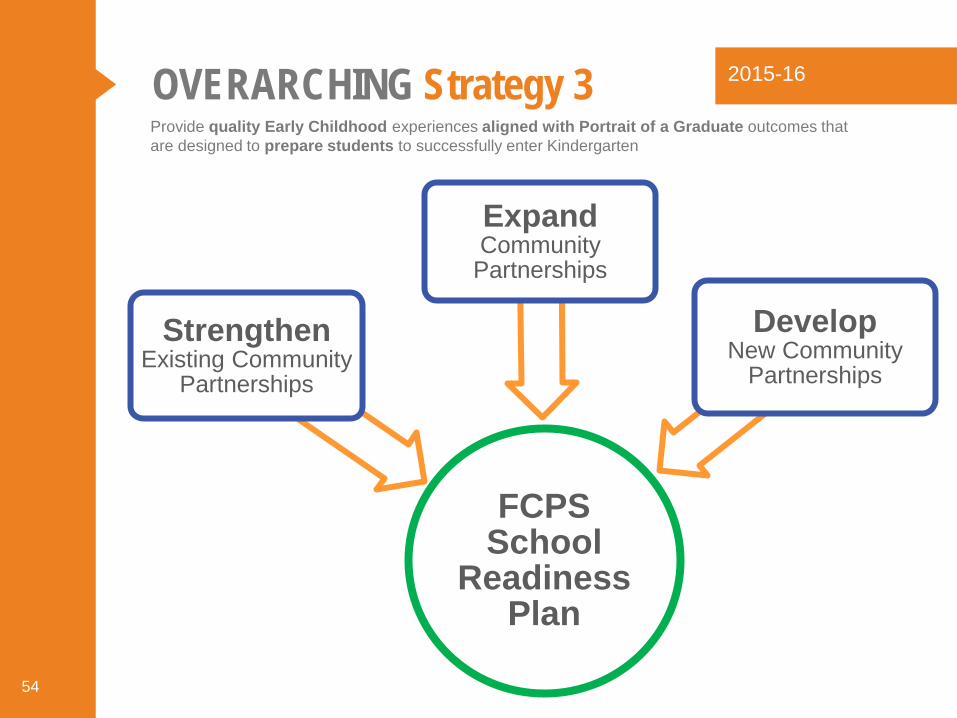
54
FCPS School
Readiness Plan
Strengthen Existing Community
Partnerships
Expand Community
Partnerships
Develop New Community
Partnerships
2015-16
Provide quality Early Childhood experiences aligned with Portrait of a Graduate outcomes that are designed to prepare students to successfully enter Kindergarten
OVERARCHING Strategy 3
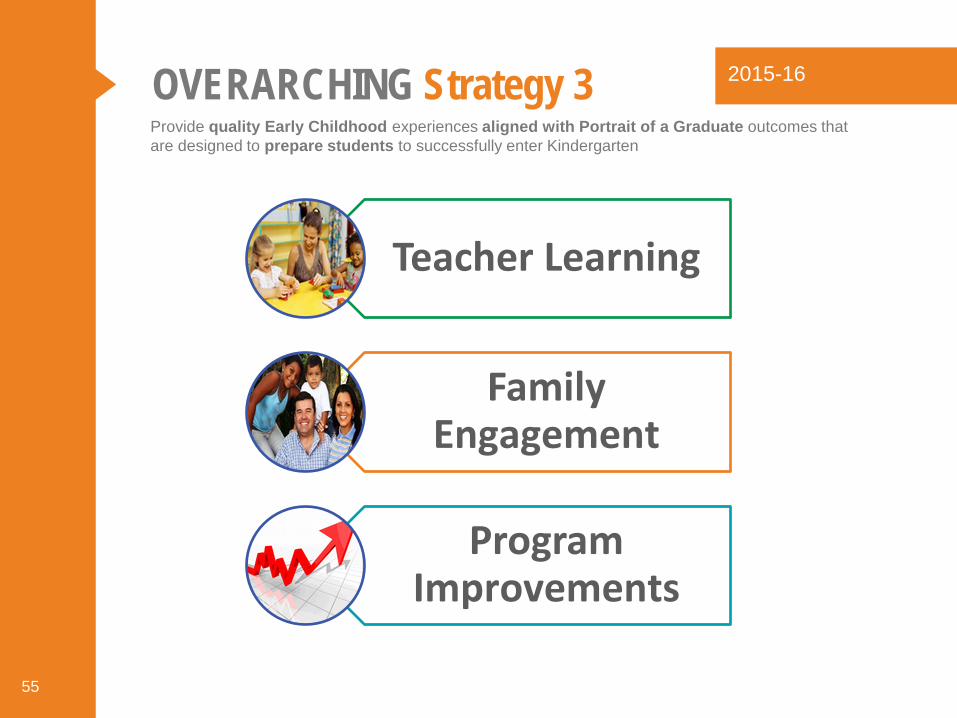
55
Teacher Learning
Family Engagement
Program Improvements

2015-16
Provide quality Early Childhood experiences aligned with Portrait of a Graduate outcomes that are designed to prepare students to successfully enter Kindergarten
OVERARCHING Strategy 3
56
Percent of SY 2014-2015 Kindergarten Students Meeting DRA2 Word Analysis Intervention Benchmark
Percentage of entering kindergarteners who demonstrate benchmark readiness skills as measured by FCPS readiness rubric
Identified
for Intervention
16% Not Identified for
Intervention 84%
Number of students tested: 13,381

2015-16
Provide quality Early Childhood experiences aligned with Portrait of a Graduate outcomes that are designed to prepare students to successfully enter Kindergarten
OVERARCHING Strategy 3
57
Longitudinal data for pre-K students through 6th grade
DRA 2 Longitudinal Data: 1st – 2nd Grade 2007 Head Start Cohort

2015-16
Provide quality Early Childhood experiences aligned with Portrait of a Graduate outcomes that are designed to prepare students to successfully enter Kindergarten
OVERARCHING Strategy 3
58
Longitudinal data for pre-K students through 6th grade
SOL Longitudinal Data: 3rd – 6th Grade 2007 Head Start Cohort

2015-16
Provide students with relevant opportunities to explore options and prepare for College and Career
OVERARCHING Strategy 4
59
A portfolio of school options will provide multiple pathways to a high school diploma
DESIRED OUTCOME:
College TechEd
Technology
Art Math

2015-16
Provide students with relevant opportunities to explore options and prepare for College and Career
OVERARCHING Strategy 4
60
Student Learning Plan

2015-16
Provide students with relevant opportunities to explore options and prepare for College and Career
OVERARCHING Strategy 4
61
Academies

2015-16
Provide students with relevant opportunities to explore options and prepare for College and Career
OVERARCHING Strategy 4
62
Cybersecurity • Cybersecurity courses are offered at
four schools: Chantilly Academy, Marshall Academy, Edison Academy, and Mount Vernon High School
• Four schools host teams for CyberPatriot, a national competition

2015-16
Provide students with relevant opportunities to explore options and prepare for College and Career
OVERARCHING Strategy 4
63
2015-16
Provide students with relevant opportunities to explore options and prepare for College and Career
OVERARCHING Strategy 4
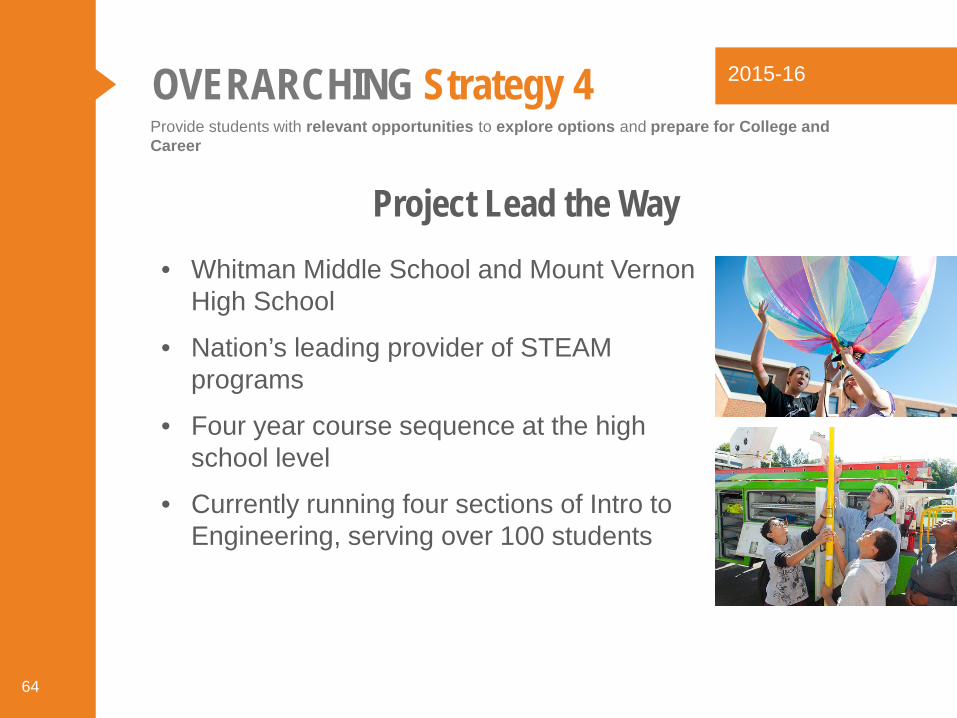
64
Project Lead the Way • Whitman Middle School and Mount Vernon
High School
• Nation’s leading provider of STEAM programs
• Four year course sequence at the high school level
• Currently running four sections of Intro to Engineering, serving over 100 students

2015-16
Provide students with relevant opportunities to explore options and prepare for College and Career
OVERARCHING Strategy 4
65
• Information technology work experience and training program being offered to students at six high schools beginning during the summer of 2016: Annandale, Falls Church, Lee, Mount Vernon, Stuart, and West Potomac
• Eight week summer training program and year-long work experience

2015-16
Provide students with relevant opportunities to explore options and prepare for College and Career
OVERARCHING Strategy 4
66
• For school year 2014-15: o 20,382 industry certification tests were passed o 36,246 CTE students in Grades 9-12 (duplicated enrollment)
• Graduates Earning One or More Industry
Certification o 2015: 72% o 2014: 31% o 2013: 24%
Career and Technical Education Industry Certifications
Number of Career and Technical Education (CTE) certificates received per number of students in CTE programs
2015-16
Provide students with relevant opportunities to explore options and prepare for College and Career
OVERARCHING Strategy 4
67
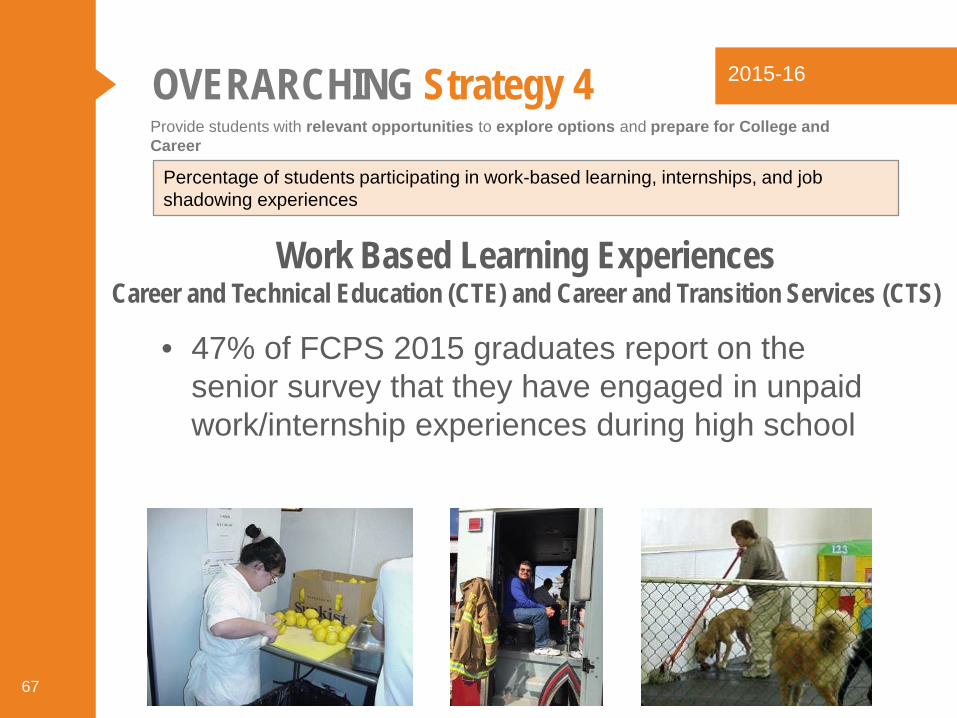
• 47% of FCPS 2015 graduates report on the senior survey that they have engaged in unpaid work/internship experiences during high school
Work Based Learning Experiences Career and Technical Education (CTE) and Career and Transition Services (CTS)
Percentage of students participating in work-based learning, internships, and job shadowing experiences

2015-16
Provide students with relevant opportunities to explore options and prepare for College and Career
OVERARCHING Strategy 4
68
• Currently this data is tracked only for Career and Transition Services, not all FCPS programs
• During SY 2014-15, CTS staff worked with 343 business partners supporting 1,122 students with disabilities in a community work experience
• Already this school year (2015-16), CTS has gained 51 additional business partners for community work experience and 46 students have obtained part-time paid employment through the support of Career and Transition Services
Number of internship sponsors
2015-16
Provide students with relevant opportunities to explore options and prepare for College and Career
OVERARCHING Strategy 4
69
College Success Program
• Advancement Via Individual Determination (AVID)
• The College Partnership Program (CPP)

2015-16
Provide students with relevant opportunities to explore options and prepare for College and Career
OVERARCHING Strategy 4
70
College Success Program
• The Early Identification Program (EIP) in partnership with George Mason University
• Pathway to the Baccalaureate and Pathway Connection in partnership with Northern Virginia Community College

2015-16
Provide students with relevant opportunities to explore options and prepare for College and Career
OVERARCHING Strategy 4
71
• In the class of 2015 Senior Exit Survey, 93% of the approximately 12,990 high school graduates indicated their intention to attend postsecondary educational institutions. Of this group: o 63% attend four-year colleges
o 28% attend two-year colleges
o 5% pursue military/employment
o 2% pursue other educational plans
Percentage of seniors prepared for post-high school as measured by senior exit survey, post-high survey, and feedback from select Virginia colleges and universities

2015-16
Provide students with relevant opportunities to explore options and prepare for College and Career
OVERARCHING Strategy 4
72
National Student Clearinghouse data
2007 2008 2009 2010 2011 2012 2013All Institutions 93 94 94 93 93 93 934-year Institutions 97 97 97 97 96 97 972-year Institutions 82 84 85 83 84 81 82
0
20
40
60
80
100
Perc
ent o
f Stu
dent
s R
e-en
rolli
ng
Percent of Students Enrolled in College the First Year After High School Who Returned For a Second Year (Freshman to Sophomore Persistence) by Institution Level
National Student Clearinghouse Data as of August 15, 2015

2015-16
Provide students with relevant opportunities to explore options and prepare for College and Career
OVERARCHING Strategy 4
73
Degree of performance above state and national averages on SAT, ACT, and PISA
2011 2012 2013 2014 2015FCPS 1654 1660 1663 1668 1669Virginia 1508 1510 1517 1520 1523Nation 1483 1477 1475 1471 1462
1200
1300
1400
1500
1600
1700
1800
Aver
age
Scor
e
SAT Combined Average Score: 2011-2015 FCPS, Virginia, and the Nation
SAT Combined includes Critical Reading, Mathematics, and Writing Data Source: College Board—All Public Schools Students

2015-16
Provide students with relevant opportunities to explore options and prepare for College and Career
OVERARCHING Strategy 4
74
Degree of performance above state and national averages on SAT, ACT, and PISA
2011 2012 2013 2014 2015All 73 75 75 76 77Asian 77 79 79 80 83Black 38 43 41 45 48Hispanic 50 52 53 53 51White 82 84 84 84 85
0
20
40
60
80
100
Perc
ent
Percent Above the National Average on SAT Combined By Ethnicity

2015-16
Provide students with relevant opportunities to explore options and prepare for College and Career
OVERARCHING Strategy 4
75
Degree of performance above state and national averages on SAT, ACT, and PISA
2011 2012 2013 2014 2015All 73 75 75 76 77Economically
Disadvantaged 43 44 42 46 47
Limited EnglishProficient 36 31 25 24 21
Students withDisabilities 31 35 37 43 38
0
20
40
60
80
100
Perc
ent
Percent Above the National Average on SAT Combined by Subgroup

2015-16
Provide students with relevant opportunities to explore options and prepare for College and Career
OVERARCHING Strategy 4
76
Degree of performance above state and national averages on SAT, ACT, and PISA
2011 2012 2013 2014 2015FCPS 24.4 24.5 24.9 24.9 25.5Virginia 22.3 22.4 22.6 22.8 23.1Nation 21.1 21.1 20.9 21.0 21.0
15
20
25
30
Aver
age
Scor
e
ACT Composite Average Score: 2013-2015 FCPS, Virginia, and the Nation
ACT Composite includes English, Mathematics, Reading, and Science Reasoning Data Source: ACT, Inc.

2015-16
Provide students with relevant opportunities to explore options and prepare for College and Career
OVERARCHING Strategy 4
77
Degree of performance above state and national averages on SAT, ACT, and PISA
2011 2012 2013 2014 2015All 72 73 76 75 76Asian 76 81 88 79 84Black 34 35 35 36 40Hispanic 50 54 60 57 54White 78 80 82 81 83
0
20
40
60
80
100
Perc
ent
Percent Above the National Average on ACT Composite By Ethnicity

2015-16
Provide students with relevant opportunities to explore options and prepare for College and Career
OVERARCHING Strategy 4
78
Degree of performance above state and national averages on SAT, ACT, and PISA
2011 2012 2013 2014 2015All 72 73 76 75 76Economically
Disadvantaged 60 39 46 41 42
Limited EnglishProficient 30 26 26 17 13
Students withDisabilities 27 30 33 37 35
0
20
40
60
80
100
Perc
ent
Percent Above the National Average on ACT by Subgroup

2015-16
Provide students with relevant opportunities to explore options and prepare for College and Career
OVERARCHING Strategy 4
79
Education System Average Score Switzerland 509 Macao-China 509 Belgium 509 Viet Nam 508 Germany 508 France 505 Norway 504 United Kingdom 499 United States 498 OECD average 496 Denmark 496 Czech Republic 493 Italy 490 Austria 490 Latvia 489 Hungary 488 Spain 488
Education System Average Score Shanghai-China 570 Hong Kong-China 545 Singapore 542 Japan 538 Korea 536 Finland 524 FAIRFAX DIVISION 523 Ireland 523 Canada 523 Chinese Taipei 523 Poland 518 Estonia 516 Liechtenstein 516 New Zealand 512 Australia 512 Global Learning Network Average 511 Netherlands 511
Degree of performance above state and national averages on SAT, ACT, and PISA
Reading Literacy Scale Average scores of 15-year-old students on PISA
NOTES: Education systems are ordered by average score on the 2012 administration of the PISA. The OECD average is the average for the 34 OECD countries that participated in PISA 2012, with each country weighted equally. Scores are reported on a scale from 0 to 1,000. The score for Fairfax and the average score for the Global Learning Network (GLN) are based on participation in the OECD Test for Schools (based on PISA) during the 2013-14 school year. The GLN average is for the 146 schools that participated in 2013-14, with each school weighted equally.
2015-16
Provide students with relevant opportunities to explore options and prepare for College and Career
OVERARCHING Strategy 4
80
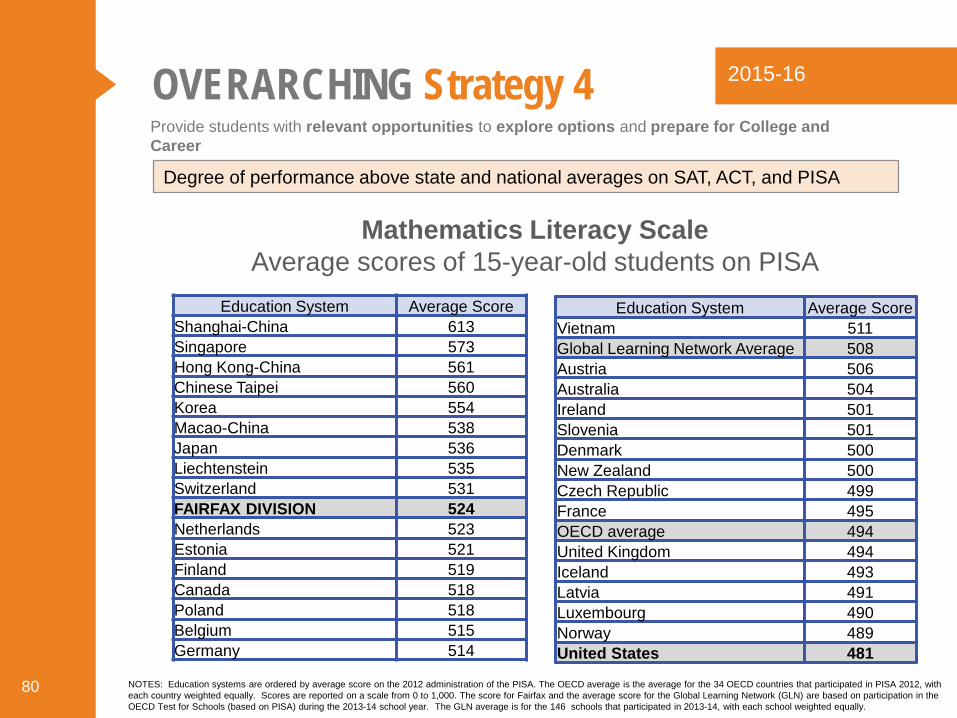
Degree of performance above state and national averages on SAT, ACT, and PISA
Education System Average Score Shanghai-China 613 Singapore 573 Hong Kong-China 561 Chinese Taipei 560 Korea 554 Macao-China 538 Japan 536 Liechtenstein 535 Switzerland 531 FAIRFAX DIVISION 524 Netherlands 523 Estonia 521 Finland 519 Canada 518 Poland 518 Belgium 515 Germany 514
Education System Average Score Vietnam 511 Global Learning Network Average 508 Austria 506 Australia 504 Ireland 501 Slovenia 501 Denmark 500 New Zealand 500 Czech Republic 499 France 495 OECD average 494 United Kingdom 494 Iceland 493 Latvia 491 Luxembourg 490 Norway 489 United States 481
Mathematics Literacy Scale Average scores of 15-year-old students on PISA
NOTES: Education systems are ordered by average score on the 2012 administration of the PISA. The OECD average is the average for the 34 OECD countries that participated in PISA 2012, with each country weighted equally. Scores are reported on a scale from 0 to 1,000. The score for Fairfax and the average score for the Global Learning Network (GLN) are based on participation in the OECD Test for Schools (based on PISA) during the 2013-14 school year. The GLN average is for the 146 schools that participated in 2013-14, with each school weighted equally.

2015-16
Provide students with relevant opportunities to explore options and prepare for College and Career
OVERARCHING Strategy 4
81
Degree of performance above state and national averages on SAT, ACT, and PISA
Education System Average Score Shanghai-China 580 Hong Kong-China 555 Singapore 551 Japan 547 Finland 545 Estonia 541 Korea 538 FAIRFAX DIVISION 531 Vietnam 528 Poland 526 Canada 525 Liechtenstein 525 Germany 524 Chinese Taipei 523 Global Learning Network Average 522 Netherlands 522 Ireland 522
Education System Average Score Australia 521 Macao-China 521 New Zealand 516 Switzerland 515 Slovenia 514 United Kingdom 514 Czech Republic 508 Austria 506 Belgium 505 Latvia 502 OECD average 501 France 499 Denmark 498 United States 497 Spain 496 Lithuania 496 Norway 495
Science Literacy Scale Average scores of 15-year-old students on PISA
NOTES: Education systems are ordered by average score on the 2012 administration of the PISA. The OECD average is the average for the 34 OECD countries that participated in PISA 2012, with each country weighted equally. Scores are reported on a scale from 0 to 1,000. The score for Fairfax and the average score for the Global Learning Network (GLN) are based on participation in the OECD Test for Schools (based on PISA) during the 2013-14 school year. The GLN average is for the 146 schools that participated in 2013-14, with each school weighted equally.

2015-16
Provide students with relevant opportunities to explore options and prepare for College and Career
OVERARCHING Strategy 4
82
Students will be fluent in two or more languages
DESIRED OUTCOME:

2015-16
Provide students with relevant opportunities to explore options and prepare for College and Career
OVERARCHING Strategy 4
83
• Continued development and implementation of new Language through Content (LTC) curriculum to replace Foreign Language in Elementary Schools (FLES)
• Currently working with Leadership Team and school administrators in determining readiness to add LTC or immersion programs for SY16-17
• American Sign Language is currently offered at the secondary level
• Language lab expansion will be a focus during the 2016-17 school year
World Language Expansion

2015-16
Provide students with relevant opportunities to explore options and prepare for College and Career
OVERARCHING Strategy 4
Student participation rates and achievement levels for fine arts, CTE, and world languages
84
No Credits 1 Credit 2 Credits 3 Credits 4 or MoreCredits
2013 30 22 14 10 252014 31 22 14 9 242015 33 23 13 8 23
0
20
40
60
80
100
Perc
ent
Graduates by Number of Credits in Fine Arts

2015-16
Provide students with relevant opportunities to explore options and prepare for College and Career
OVERARCHING Strategy 4
Student participation rates and achievement levels for fine arts, CTE, and world languages
85
No Credits 1 Credit 2 Credits 3 Credits 4 or MoreCredits
2013 10 5 9 34 432014 10 6 8 35 422015 9 5 8 37 41
0
20
40
60
80
100
Perc
ent
Graduates by Number of Credits in World Languages
2015-16
Provide students with relevant opportunities to explore options and prepare for College and Career
OVERARCHING Strategy 4
86
World Languages Opportunities

2015-16
87
QUESTIONS?