republic of mozambique - imf · country document for the republic of mozambique, ......
TRANSCRIPT

©2014 International Monetary Fund
IMF Country Report No. 14/147
REPUBLIC OF MOZAMBIQUE POVERTY REDUCTION STRATEGY PAPER—PROGRESS REPORT
Poverty Reduction Strategy Papers (PRSPs) are prepared by member countries in broad consultation with stakeholders and development partners, including the staffs of the World Bank and the IMF. Updated every three years with annual progress report, they describe the country’s macroeconomic, structural, and social policies in support of growth and poverty reduction, as well as associated external financing needs and major sources of financing. This country document for the Republic of Mozambique, dated April 2014, is the authorities’ first PRSP Progress Report 2011–2014. It is being made available on the IMF website by agreement with the Mozambican authorities, as a service to users of the IMF website.
Copies of this report are available to the public from
International Monetary Fund Publication Services PO Box 92780 Washington, D.C. 20090
Telephone: (202) 623-7430 Fax: (202) 623-7201 E-mail: [email protected] Web: http://www.imf.org
International Monetary Fund Washington, D.C.
May 2014

REPUBLIC OF MOZAMBIQUE
MAPUTO, APRIL 2014
Cabo Delgado
Zambézia
Niassa
.
Tete
Gaza
Maputo
Nampula
Manica
.
Inhambane
POVERTY REDUCTION
STRATEGY PAPER
PRSP 2011-2014
Progress Report

2
CONTENTS
1. INTRODUCTION ............................................................................................................................ 3
2. PROGRESS IN IMPLEMENTING THE PRSP OBJECTIVES ...................................................... 3
2.1 ANALYSIS OF PRSP PERFORMANCE IN 2013 ...................................................................... 3
2.2 PROGRESS IN PRSP IMPLEMENTATION BETWEEN 2011 AND 2013 .............................. 5
OBJECTIVE 1: INCREASED PRODUCTION AND PRODUCTIVITY IN THE
AGRICULTURE AND FISHERY SECTORS ................................................................................. 6
OBJECTIVE 2: PROMOTION OF EMPLOYMENT ...................................................................... 9
OBJECTIVE 3: HUMAN AND SOCIAL DEVELOPMENT ........................................................ 11
KEY ACHIEVEMENTS IN IMPLEMENTING THE SUPPORT PILLARS ................................ 14
3. CONCLUDING THOUGHTS ........................................................................................................... 15
4. PRSP MATRICES ......................................................................................................................... 17

3
1. INTRODUCTION
The 2011-2014 Poverty Reduction Strategy Paper (PRSP) contains the Mozambican
government’s medium-term strategy for implementing its 2010-2014 Five-Year Plan, and is
primarily oriented towards promoting inclusive economic growth and reducing poverty and
vulnerability in the country.
To achieve the objective of inclusive economic growth and thus be able to reduce poverty,
the government has defined general objectives on which to target its actions, as listed below.
(i) Increased production and productivity in the agriculture and fishery sectors;
(ii) Promotion of employment; and
(iii) Human and social development.
Efforts to attain these objectives are supported by pillars specifically targeted on governance
and macroeconomy and public finance management.
As less than one year remains of the PRSP implementation period, it is important to assess
the extent of its execution and analyze the progress achieved, with a view to creating
mechanisms to identify any gaps in the implementation process. Provision could also be
made for future reviews of the attainment of targets in relation to resources allocated.
A progress report was prepared for the first two years of PRSP implementation (2011 and
2012). Further assessments since then have been part of the annual evaluation of
government’s economic and social plan (Plano Económico e Social – PES) for PRSP
indicators. These assessments compare the targets set for each individual year, and their
achievement, but do not focus on achievements at the end of the instrument’s lifespan.
The PRSP implementation assessments have been based on data from various surveys, such
as the Demographic and Health Survey and the Household Budget Surveys, among other
sources. Data on implementation of the planned actions have also been supplied by
individual sectors at various levels. At the end of the PRSP period, an external evaluation
will be performed to analyze the results achieved in greater detail.
The current report reviews progress in PRSP implementation by comparing the achievement
of targets between 2011 and 2013 against the targets set for 2014, the year considered as the
end of the PRSP lifespan, or the end of the exercise, as referred to in this analysis.
2. PROGRESS IN IMPLEMENTING THE PRSP OBJECTIVES
The key goal of the 2011-2014 PRSP is to reduce the poverty rate from its level of 54
percent in 2009 to 42 percent in 2014, considering that government interventions primarily
focus on the poorest segments of the population.
2.1 ANALYSIS OF PRSP PERFORMANCE IN 2013
The monitoring of 62 output indicators of the 2013 PES showed that 44 percent of the
indicators have achieved the planned targets, 50 percent have not attained the targets but have
made significant progress, and the remaining 6 percent of the indicators are lagging far
behind.
4
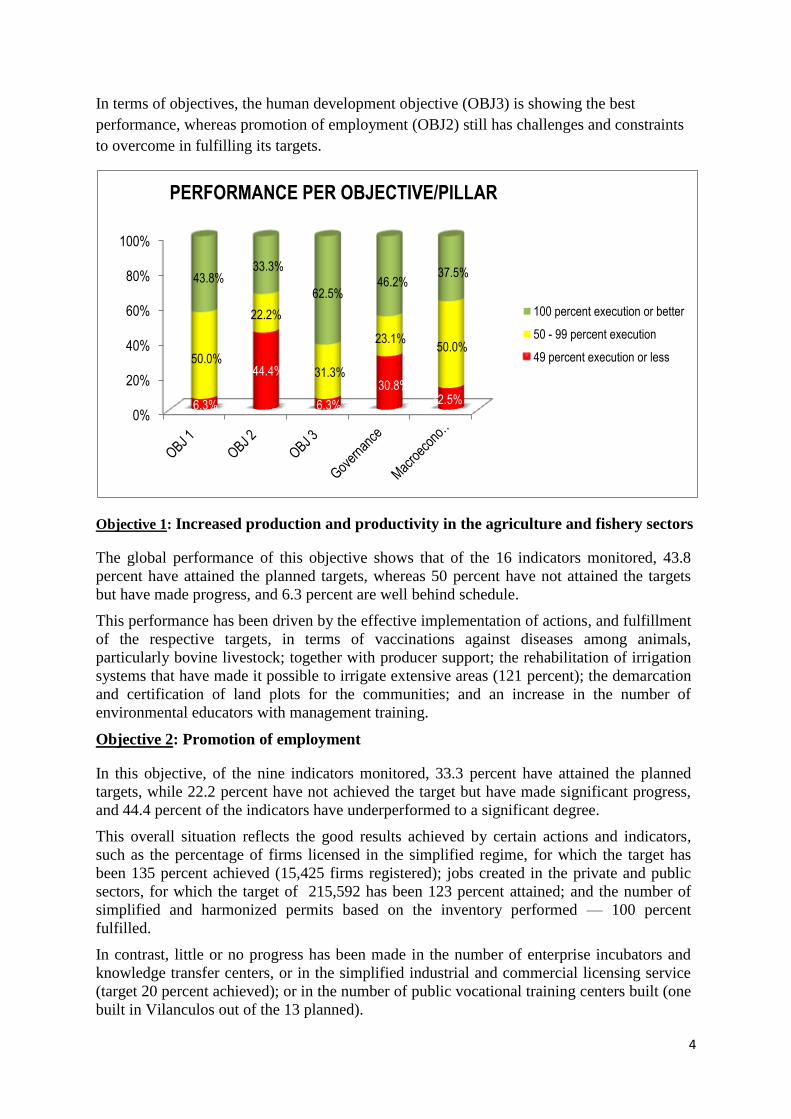
In terms of objectives, the human development objective (OBJ3) is showing the best
performance, whereas promotion of employment (OBJ2) still has challenges and constraints
to overcome in fulfilling its targets.
Objective 1: Increased production and productivity in the agriculture and fishery sectors
The global performance of this objective shows that of the 16 indicators monitored, 43.8
percent have attained the planned targets, whereas 50 percent have not attained the targets
but have made progress, and 6.3 percent are well behind schedule.
This performance has been driven by the effective implementation of actions, and fulfillment
of the respective targets, in terms of vaccinations against diseases among animals,
particularly bovine livestock; together with producer support; the rehabilitation of irrigation
systems that have made it possible to irrigate extensive areas (121 percent); the demarcation
and certification of land plots for the communities; and an increase in the number of
environmental educators with management training.
Objective 2: Promotion of employment
In this objective, of the nine indicators monitored, 33.3 percent have attained the planned
targets, while 22.2 percent have not achieved the target but have made significant progress,
and 44.4 percent of the indicators have underperformed to a significant degree.
This overall situation reflects the good results achieved by certain actions and indicators,
such as the percentage of firms licensed in the simplified regime, for which the target has
been 135 percent achieved (15,425 firms registered); jobs created in the private and public
sectors, for which the target of 215,592 has been 123 percent attained; and the number of
simplified and harmonized permits based on the inventory performed — 100 percent
fulfilled.
In contrast, little or no progress has been made in the number of enterprise incubators and
knowledge transfer centers, or in the simplified industrial and commercial licensing service
(target 20 percent achieved); or in the number of public vocational training centers built (one
built in Vilanculos out of the 13 planned).
0%
20%
40%
60%
80%
100%
6.3%
44.4%
6.3%
30.8% 12.5%
50.0%
22.2%
31.3%
23.1% 50.0%
43.8% 33.3%
62.5% 46.2%
37.5%
PERFORMANCE PER OBJECTIVE/PILLAR
100 percent execution or better
50 - 99 percent execution
49 percent execution or less

5
Objective 3: Human and social development
Of the 16 indicators monitored for this objective, 62.5 percent reported satisfactory
performance and have fulfilled the planned targets, whereas 31.3 percent have not attained
the target but have made progress, and 6.3 percent are lagging well behind schedule.
In this objective, the target for the percentage of children who have completed the
immunization program has been achieved; the target for the number of adults receiving
antiretroviral treatment is 136 percent achieved, with 438,255 recipients compared to
321,643 originally planned; the net school enrolment rate among six-year-olds in first grade
attained 77.4 percent among girls and 79.4 percent in total, compared to the 76 percent
target; the 119,815 latrines built represents 286 percent of the target; and the number of
disperse water sources operating in rural zones, 22,854, is also more than planned.
Support pillar: Governance
The overall performance of the governance pillar shows that 46.2 percent of the indicators
performed satisfactorily and have met the targets; whereas 23.1 percent have not attained the
target, but are making significant progress, despite implementation efforts aimed at fulfilling
the targets, and 30.8 percent are lagging well behind.
Achievement of the target of 46 percent has been supported by a start of effective
implementation of the anti-corruption legislative package, preparation of the resolution
approving the Optional Protocol to the Torture and Other Cruel, Inhuman or Degrading
Treatment, and the Decree Law defining the legal regime governing insolvency and recovery
of commercial enterprises; access to justice through cost-free assistance to economically
deprived citizens which is increasingly effective; and a gradual but significant reduction in
waiting time for accessing public services.
Support pillar: Macroeconomy and poverty
The overall performance of this pillar shows that 37.5 percent have attained the planned
targets, whereas 50 percent have not, but have made progress, and 2.5 percent have
substantially underperformed in relation to the target.
The following items made major contributions to the performance of this pillar: the General
State Account published on time; better implementation of procurement and asset
management processes, an action that involved the supervision of 230 procurement
management units (unidade gestora executora de aquisições – UGEAs) and beneficiary
management units (unidade gestora beneficiária – UGBs), representing 92 percent of the
planned targets; the allocation of 574,321 tax identification numbers (número único de
identificação tributário – NUIT), representing 115 percent of the target; the volume of
lending to the economy, 93 percent achieved; and expansion of the coverage of the financial
system.
2.2 PROGRESS IN PRSP IMPLEMENTATION BETWEEN 2011 AND 2013
This report analyses the progress made toward each of the three general objectives, by
comparing the results achieved, as measured by output indicators in each of the intermediary
years (2011, 2012, and 2013), with the targets set for 2014, which is the end of the 2011-
2014 PRSP implementation cycle. Although this analysis is based on the broadest possible
sample of PRSP indicators, it is not exhaustive, because not all of them are measured
annually through current performance appraisal processes.

6
OBJECTIVE 1: INCREASED PRODUCTION AND PRODUCTIVITY IN THE
AGRICULTURE AND FISHERY SECTORS
The priorities for this general objective are to: (1) improve and increase access to factors of
production; (2) facilitate market access; and (3) improve the sustainable management of
natural resources. The attainment of this objective is measured by four output indicators: the
percentage of producers assisted by extension activities; the number of fishermen receiving
assistance; the percentage of bovine livestock vaccinated; and the number of environmental
educators in priority localities.
The performance data show that in 2012 the targets set for the number of producers assisted
by extension activities was surpassed by more than half (25 percent compared to 12 percent);
and in 2013 the target was achieved as planned. Bearing in mind the targets achieved in
previous years, the target for the end of the exercise in 2014 is certainly attainable.
In 2012, a total of 1,235 fishermen received assistance, compared to a target for the year of
1,000. The target set for 2013 was 980, and this has been surpassed (2,833 fishermen
receiving assistance). Moreover, the cumulative target for the number of fishermen to be
assisted (2,930) between 2011 and 2014 has also been surpassed (4,068 assisted by 2013),
even though the specific target for last year was not attained. As a result, the overall target
has certainly been attained.
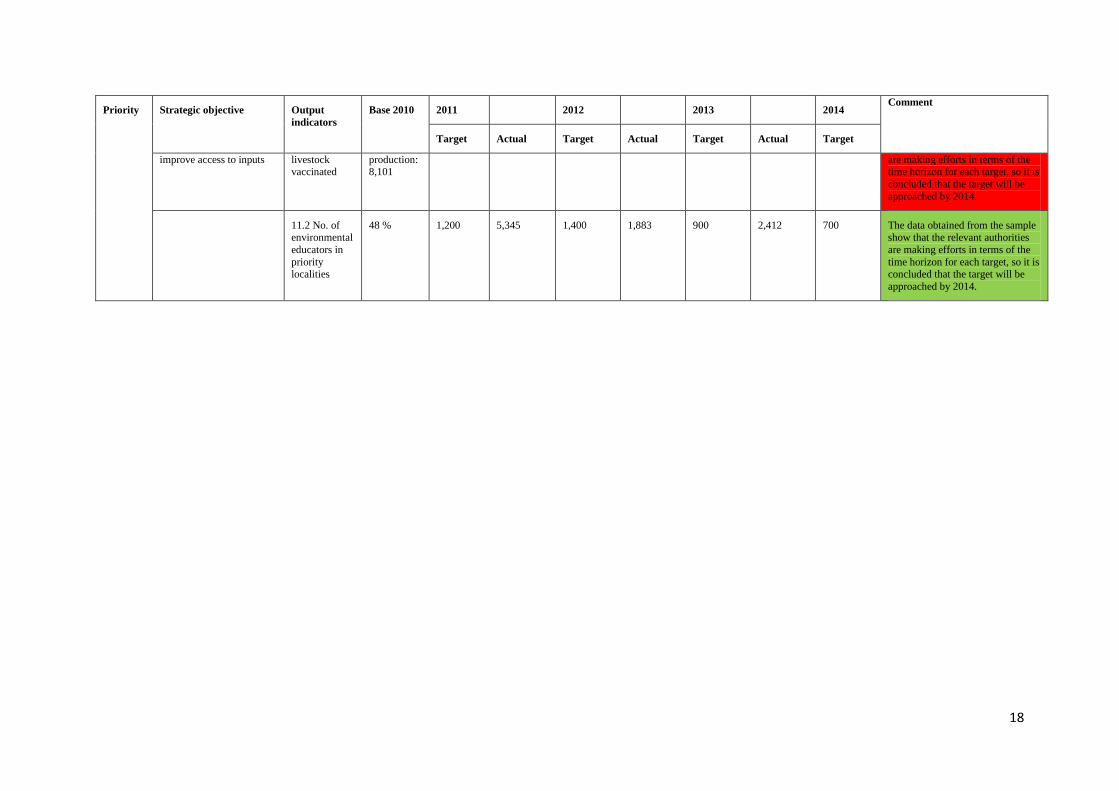
In terms of the number of environmental educators in priority localities, achievements each
year have always surpassed the targets, with the result that, cumulatively, this target has
already been achieved and surpassed (cumulative target of 4,200 environmental educators
between 2011 and 2014, compared to an actual number of 9,460 between 2011 and 2013).
Indicator 2011 2012 2013 2014
Target Actual Target Actual Target Actual Target
Number of environmental educators
in priority localities
1200 5,345 1,400 1,883 900 2,412 700
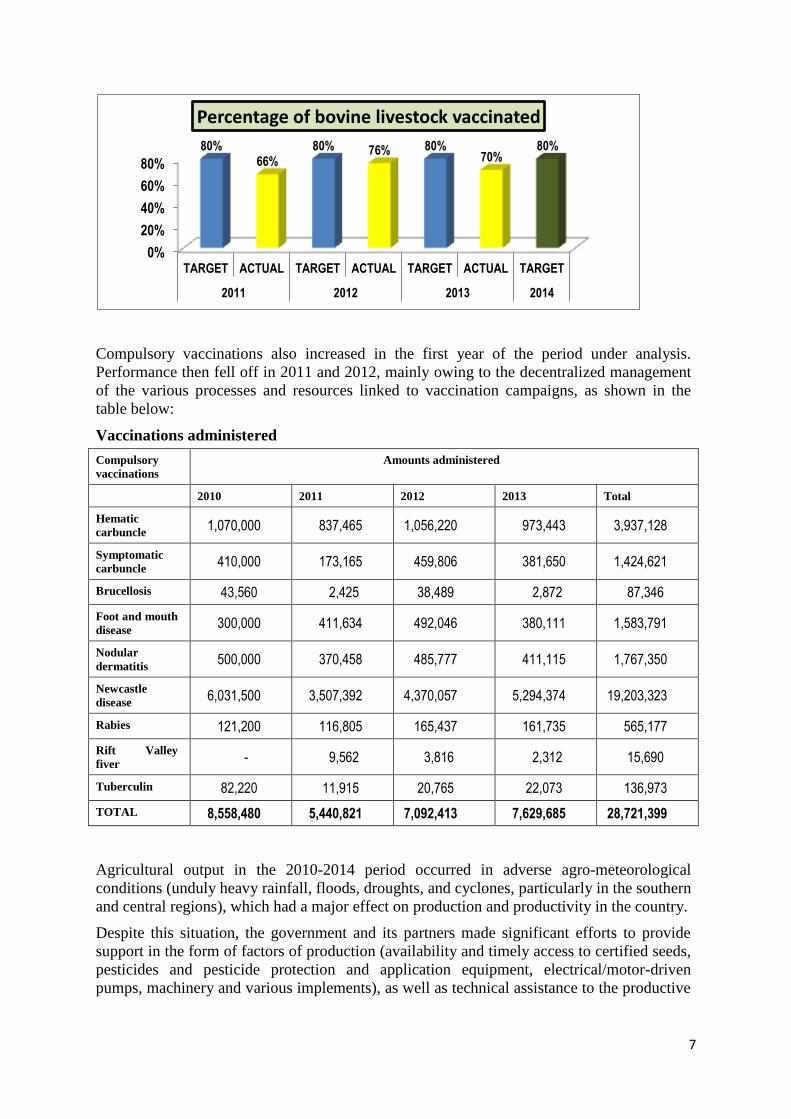
As regards the percentage of bovine livestock vaccinated, the data show that the targets set
for the four years have never been achieved, although in 2012 the percentage vaccination
rate was close to the planned level. Although this indicator does not lend itself to cumulative
conclusions, if the performance trend of previous years is maintained, the target may not be
achieved by the end of the PRSP lifespan.
7
Compulsory vaccinations also increased in the first year of the period under analysis.
Performance then fell off in 2011 and 2012, mainly owing to the decentralized management
of the various processes and resources linked to vaccination campaigns, as shown in the
table below:
Vaccinations administered
Compulsory
vaccinations
Amounts administered
2010 2011 2012 2013 Total
Hematic
carbuncle 1,070,000 837,465 1,056,220 973,443 3,937,128
Symptomatic
carbuncle 410,000 173,165 459,806 381,650 1,424,621
Brucellosis 43,560 2,425 38,489 2,872 87,346
Foot and mouth
disease 300,000 411,634 492,046 380,111 1,583,791
Nodular
dermatitis 500,000 370,458 485,777 411,115 1,767,350
Newcastle
disease 6,031,500 3,507,392 4,370,057 5,294,374 19,203,323
Rabies 121,200 116,805 165,437 161,735 565,177
Rift Valley
fiver - 9,562 3,816 2,312 15,690
Tuberculin 82,220 11,915 20,765 22,073 136,973
TOTAL 8,558,480 5,440,821 7,092,413 7,629,685 28,721,399
Agricultural output in the 2010-2014 period occurred in adverse agro-meteorological
conditions (unduly heavy rainfall, floods, droughts, and cyclones, particularly in the southern
and central regions), which had a major effect on production and productivity in the country.
Despite this situation, the government and its partners made significant efforts to provide
support in the form of factors of production (availability and timely access to certified seeds,
pesticides and pesticide protection and application equipment, electrical/motor-driven
pumps, machinery and various implements), as well as technical assistance to the productive
0%
20%
40%
60%
80%
TARGET ACTUAL TARGET ACTUAL TARGET ACTUAL TARGET
2011 2012 2013 2014
80% 66%
80% 76% 80% 70%
80%
Percentage of bovine livestock vaccinated

8
sector, which resulted in the production of 48,996,000 tons of food crops.1
The overall performance of this objective, namely to increase production and productivity in
the agriculture and fishery sectors, shows that of the four indicators analyzed, 50 percent
have achieved their targets, whereas 25 percent have not achieved the targets but have made
progress, and the remaining 25 percent are way behind the target planned for the end of the
period.
Year Indicator Crops
Cereals Leguminous Roots and Tubers
2010 Production (tons)
Yield/ ha
2,802,581
1.03
421,454
0.48
9,738,066
7.76
2011 Production (tons)
Yield/ ha
3,040,883
1.07
452,058
0.49
10,093,619
7.80
2012 Production (tons)
Yield/ ha
2,176,293
0.95
492,528
0.50
8,206,157
8.86
2013 Production (tons)
Yield/ ha
2,222,004
0.96
526,252
0.48
8,824,145
9,23
2011-2013 Production (tons)
Yield/ ha
10,241,761
0.99
1,892,292
0.49
36,861,987
8.63
The figures show that, apart from leguminous vegetables (consisting of beans and peanuts),
the other crop groups report a slight drop in production levels between 2011 and 2013. In
terms of yield (a proxy indicator for productivity) there is a downward trend in cereal crops
(maize, sorghum, millet, and wheat) and also in leguminous vegetables. In contrast, per-
hectare yields in the root and tuber group improved steadily between 2011 and 2013.
Growth in the production of cash crops slowed slightly during the first four years of the
1 The figures for agricultural growth need to be interpreted cautiously, since the statistical data collection
process was reformulated in 2012, thereby rendering the data on food crops (cereals, leguminous vegetables
and cassava) incomparable with the series for earlier periods.
0%
10%
20%
30%
40%
50%
Unlikely Likely Achieved
25% 25%
50%
Increase in production and productivity in the agriculture and fishery sectors (n=4)
9
2010-2014 period, to average 6.9 percent, except for sugar cane, citrus fruits, sesame, potato
and bananas.
In the fishery sector, overall catch volumes have increased sharply. An analysis of the entire
five-year period shows that between 2010 and 2013, fishery production amounted to 672,528
tons, compared to the objective of 150,000 tons set for the period, i.e. 449 percent of the
target.
Fishery catch
Output / Year
2010 2011 2012 2013 Total
Fish catch (tons) 165512 194361 94655 218000 672528
Total 165512 194361 94655 218000 672528
The employment promotion objective is not just a matter of creating new jobs; the most
important thing is to discover a social and economic system that guarantees security and
basic employment; upholds fundamental labor principles and rights, and provides for social
protection and dialogue; and is also capable of adapting to rapidly changing circumstances in
a highly competitive market.
Analysis of the implementation of the second PRSP objective, in terms of achieving the plan
target, considers the following priorities: (1) stimulate job creation; and (2) improve citizens’
employability. These are broken down into strategic objectives, outcome indicators and
output indicators.
In 2010 there were a about 5,000 firms licensed in the simplified regime; and the number
slipped to 4,997 in 2011 before growing very rapidly by about 400 percent in 2012 and
2013, to raise the cumulative total to 15,425 licensed firms, thereby surpassing the target of
9,500 set for 2014.
Indicator 2011 2012 2013 2014
Target Actual Target Actual Target Actual Target
Number of firms licensed in the
simplified regime
6,500 4,997 7,500 14,977 8,500 15,425 9,500
In relation to the number of firms using negative licensing, information is scarce and no
predictions can be made as to the achievement of the target each year, because the indicator
is hard to monitor. Progress for 2013 suggests a 20 percent achievement of the target.
In terms of improving Mozambique’s performance in the “Doing Business” ranking, the goal
was to raise its position from 126th in 2011 to 113th by 2014. Achievements in 2012 and
2013 showed progress in terms of reducing the number of procedures needed to start a
business, and the number of days it takes to obtain a building permit.
Information obtained from the “Doing Business” database shows that Mozambique is
currently ranked 139th out of a total of 189 countries, having risen by three places from last
year when it was 142nd. The country’s new ranking reflects the fact that it has implemented
two reforms this year in the areas of international trade and the obtaining of building permits
OBJECTIVE 2: PROMOTION OF EMPLOYMENT

10
(reduction in the number of days taken to obtain authorization to build and the creation of
facilities for undertaking cross-border trade).
Even after this improvement in its Doing Business ranking, Mozambique is still below its
best position of 126th achieved in 2011; and we are still far from the best-ranked country in
the Southern African Development Community (SADC), in terms of improving the business
environment by 2015, and the current ranking puts the achievement of the target at risk.
Source: Doing Business 2014.
Moreover, in terms of the number of enterprise incubators and knowledge transfer and
enterprise orientation centers created and put into operation, achievements between 2011 and
2013 have been scarce (below 50 percent), which puts the target set for 2014, and thus
attainment of the objective, in doubt.
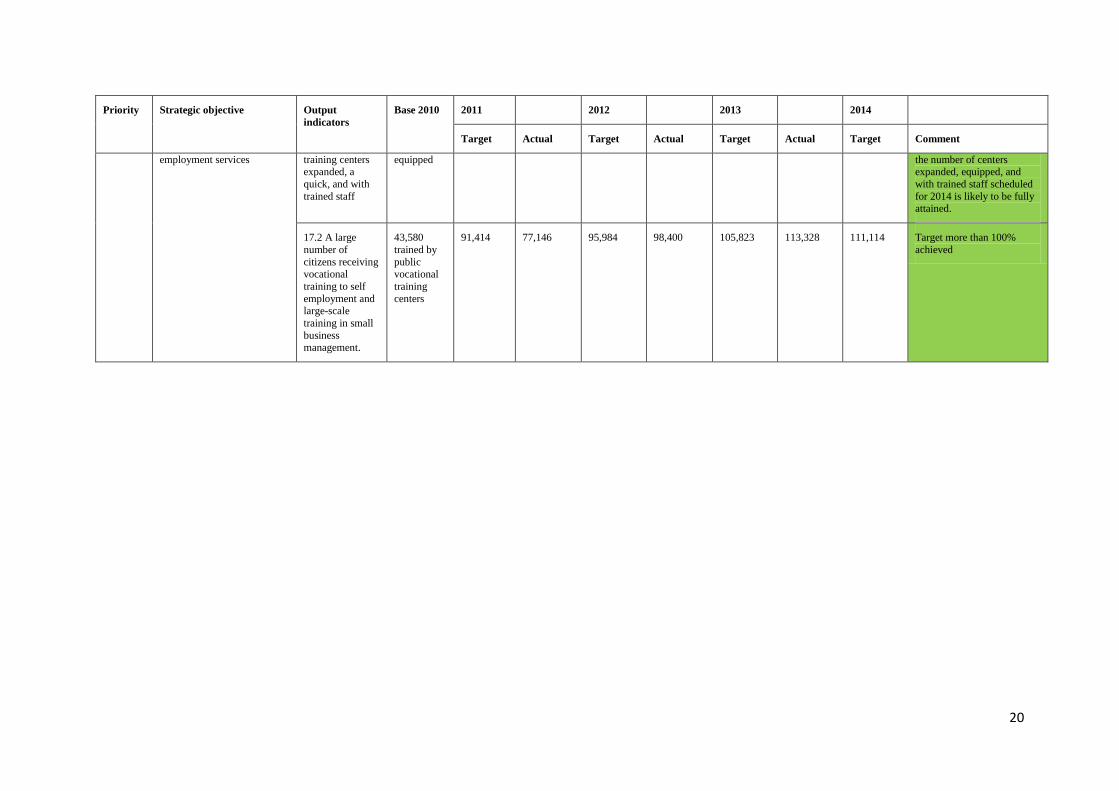
Specifically, the number of professional training centers expanded, equipped, and staffed
with trained employees, increased considerably from 2011 to 2013, having achieved 90
percent of the target set for 2014. This suggests positive progress and a target that is
achievable by the end of the exercise.
115 120 125 130 135 140 145
2009 2010 2011 2012 2013 2014
126th
139th 142nd
139th 142
139
Trend of Mozambique’s position in the Doing Business ranking
0
2
4
6
8
10
Target Actual Target Actual Target Actual Target
2011 2012 2013 2014
4 3
7 6
9 9 10
Number of professional training centers (CFPs) expanded, equipped, and staffed with trained employees

11
In terms of the number of citizens receiving professional training for self-employment and
small business management, the level achieved in 2013 already exceeds the target set for
2014.
Output indicator 2011 2012 2013 2014
Target Actual Target Actual Target Actual Target
A large number of citizens
receiving professional training for
self-employment and large-scale
training programs for small
business management
91,414 77,146 95,984 98,400 105,823 113,328 111,114
Global performance on this objective shows that, of the six indicators monitored, 50 percent
have achieved the planned targets, while 17 percent have not achieved the target but are
making good progress, and 33 percent of the indicators have performed well below the
planned level.
This performance includes good results in terms of the percentage of firms licensed in the
simplified regime and the number of individuals trained by public professional training
centers.
Generally speaking, progress made in achieving the targets suggest that the objective may
not be fully achievable by the end of the exercise.
For this general objective, the priorities are: (1) the availability of social services and quality
access to them; (2) basic social security; and (3) social infrastructures. Each of these
priorities has strategic objectives and targets set. Eight indicators are used to measure the
0%
10%
20%
30%
40%
50%
Unlikely Likely Achieved
33%
17%
50%
Objective 2 - Promotion of employment (No. of indicators=6)
OBJECTIVE 3: HUMAN AND SOCIAL DEVELOPMENT

12
attainment of this objective: the coverage of institutionalized childbirth; the percentage of
children that have completed the immunization program; the number of graduates in health
careers; the net school enrolment rate and the student-teacher ratio in primary education; the
number of families benefiting from social action programs; beneficiaries of productive social
action programs; and the number of water sources that are operational in rural zones.
In relation to institutionally attended childbirth, performance between 2011 and 2014 shows
that the target set for 2014 (66 percent) is achievable, because by 2013, just one year before
the end of the period, the 66 percent coverage rate for institutionalized childbirth had already
been achieved.
The proportion of children under one year old who are fully vaccinated was 78 percent in
2013, just two percentage points below the target set for the end of the period in 2014.
For the number of graduates in specific health careers, one can safely predict that the final
target will be achieved, because the individual targets have always been surpassed year by
year. Analyzing the targets for the entire period in relation to achievements in the
intervening years shows that the number of graduates is just 222 less than the 2014 target —
a much smaller shortfall than planned. This situation strengthens the view that the target is
highly likely to be achieved.
62.8%
63.8%
66.0% 66.0%
61.0%
62.0%
63.0%
64.0%
65.0%
66.0%
67.0%
Actual Actual Actual Target
2011 2012 2013 2014
Institutionalized childbirth coverage rate
73.2%
78.8% 78.0% 80.0%
68.0% 70.0% 72.0% 74.0% 76.0% 78.0% 80.0% 82.0%
Actual Actual Actual Target
2011 2012 2013 2014
Percentage of children under one year of age fully vaccinated
13
Indicator 2011 2012 2013 2014
Target Actual Target Actual Target Actual Target
Number of new graduates in specific
health careers
1,650 1,822 1,700 2,427 1,550 2,129 1,700
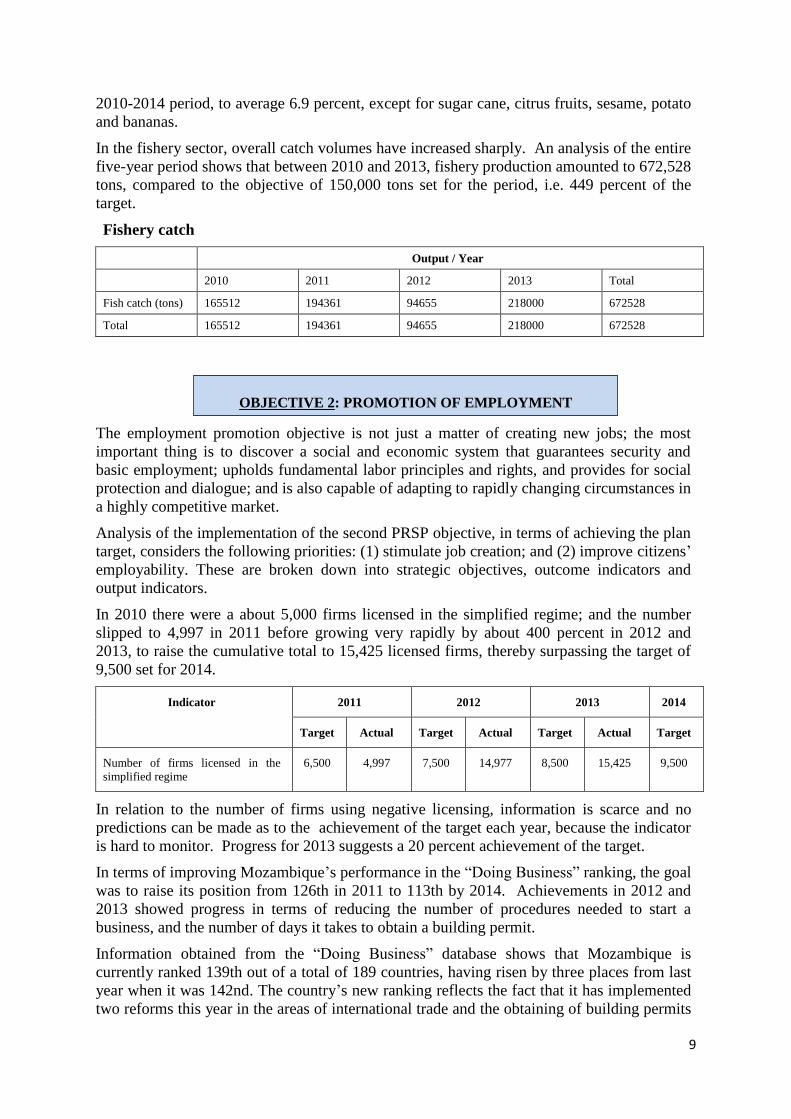
In terms of the primary school enrolment rate, the target has already been achieved before
the end of the PRSP lifespan (79.4 percent achievement already in 2013 compared to the 94
percent set for 2014). In addition, the target for primary school enrolment among girls (77.9
percent) was also achieved in 2013, surpassing the end-period target of 77 percent.
In the case of the student-teacher ratio, there are signs that the target might not be fully
achievable because it remains extremely challenging to reduce the primary school student-
teacher ratio. In fact, starting from a base of 66 percent in 2010, the ratio could only be
lowered to 63 percent by 2013, which is above the target of 60 percent.
The 2014 target for the number of family aggregates covered by social action programs was
set at around 372,000, starting from a base of 267,000 beneficiaries of direct social action in
2010. Nonetheless, by 2013, some 360,000 beneficiaries had been assisted through these
programs. If the pace of beneficiary growth seen over the years is maintained, this target
will be achieved and the corresponding objective will be attained.
Figures for the number of disperse water sources operating in rural zones show that there
were about 17,000 in 2010; and, as a result of the expansion of the water network and
construction of standpipes, the number had grown to about 23,000 by 2013. This
achievement already exceeds the target for the five-year period, set at just over 20,000
operational water sources in rural zones.
73%
70%
73% 72%
76%
79% 79%
64%
66%
68%
70%
72% 74%
76%
78%
80%
82%
Target Actual Target Actual Target Actual Target
2011 2012 2013 2014
Net primary school enrolment rate among six-year-olds

14
In general, the achievement of the targets set for this year suggest that the strategic
objectives for end-2014 can be attained.
Overall performance in relation to the human and social development objective shows that of
the eight indicators monitored, 37.5 percent reported significant performance and have met
the planned targets, whereas the other 62.5 percent have not achieved the target, but are
making progress, and it is highly likely that they will be achieved by 2014.
KEY ACHIEVEMENTS IN IMPLEMENTING THE SUPPORT PILLARS
Efforts to attain these objectives are supported by pillars specifically targeted on governance
and macroeconomy and public finance management. The following items are defined as
governance priorities: Improve access to, and the quality of, the provision of public services
to citizens throughout national territory; combat corruption in public institutions;
decentralization and local governance; and consolidation of the democratic rule of law. The
18,900 20,704
19,432 19,306 19,614
22,854
20,069
0
5,000
10,000
15,000
20,000
25,000
Target Actual Target Actual Target Actual Target
2011 2012 2013 2014
Number of operational water sources in rural zones
0%
10%
20%
30%
40%
50%
60%
70%
Unlikely Likely Achieved
0.0%
62.5%
37.5%
Human and social development (n=8)

15
macroeconomy and public finance management pillar prioritizes monetary and foreign
exchange policy and public finance management.
Achievements for these two pillars include the following:
Governance and macroeconomy
In the period 2011-2013, the waiting time for accessing public services was
reduced, through the ratification of instruments such as the African Charter on
Values and Principles of Public Service and Administration, which culminated with
the introduction of at least 27 service charters and the production of 2,000 brochures
and 6,000 CDs on new services.
In the same objective, the number of staff trained in public and local authority
administration each year has increased.
Also worthy of mention is the physical expansion and incorporation of more
services in one-stop facilities (Balcão de Atendimento Único – Baús) from one to
five located in Changara, Ulongué, Lumbo, and Nacala, increasing the number
offering services.
In terms of promotion of administrative and financial transparency and the integrity
of public administration systems, raising the individual accountability of civil
servants and government agents in the provision of quality services to citizens, the
proportion of institutions with state inspection recommendations implemented
(Inspecção Geral Administrativa do Estado – IGAE) has increased, and all of them
publish the corresponding reports for general consumption and access.
In the decentralization and local governance field, the aims of which are
institutional reform and capacity building in local administration, the provision of
key public utilities in the districts was improved during the period under analysis,
including the development of the District Development Monitoring System, which
was installed in just 30 districts in 2011 but is now present in 128.
In terms of raising the performance of the police services and improving the quality
of its personnel, including patriotic and civic education and greater professionalism,
measures to prevent and combat criminality were reinforced, and over 16,269 cases
of crimes reported to the police authorities were resolved.
Macroeconomy and public finance management
The volume of productive lending to the economy rose from about 28.2 percent of
GDP in 2011 to 31 percent in 2013.
In terms of the expansion of banking services, the number of bank branches
increased from 58 to 63 between 2011 and 2013.
3. CONCLUDING THOUGHTS
The analysis of progress made in implementing the PRSP shows that the main challenges
facing Mozambique still relate to increasing production and productivity in the agriculture
and fishery sectors. While evidence shows that the fishery production target is certainly
achievable, the scenario is less encouraging in agriculture. The analysis of available data
shows a prevalence of challenges facing production and productivity in the cereals segment,
a food group that forms part of the consumption basket of the poorest population groups. No
16
less important are leguminous vegetables which, despite growing in terms of production
levels, have lost productivity over the years. In contrast, productivity in the roots and tubers
group, which is also an important component of poor people’s consumption baskets
(particularly cassava), have been rising between 2011 and 2013.
The employment promotion objective has one third of its targets at high risk of not being
achieved by the end of the 2011-2014 PRSP period., Improvement of Mozambique’s
position in the Doing Business ranking remains a concern, despite the progress achieved in
this sphere, because the country is below its best level achieved (126th) and its current
ranking (139th) is even further from the target (113th).
The human and social development objective does not have targets that are unlikely to be
achieved. In fact, in this objective, most targets are likely to be attained, which makes it the
area most likely to achieve all targets by the end of the period. For this prospect to be
fulfilled, it will be necessary to ensure that all of the targets set for 2014 are actually met.

17
4. PRSP MATRICES
Priority Strategic objective Output
indicators
Base 2010 2011 2012 2013 2014 Comment
Target Actual Target Actual Target Actual Target
Objective 1- Increased production and productivity in the agriculture and fishery sectors
Imp
rove a
nd
in
crea
se a
cce
ss t
o f
acto
rs
of
pro
du
cti
on
Strengthen the capacity of research and extension
services in producing food
production technologies that are adapted to
Mozambique’s agro-
ecological characteristics
1.2 Percentage of producers
assisted by
extension services that
adopt new
technologies, and number of
fishermen
assisted.
(Indicator 1
of the 2012
Performance
Appraisal
Framework
(Quadro de
Avaliação do
Desempenho
– QAD))
38,901 Not applicable.
To be
monitored in 2012
10% 25% 12% 12% 15% The target will be successfully attained by 2014, despite data
obtained in 2011 showing that it is
not applicable and will be monitored in the following year.
Nonetheless, this could be
compensated by the actual figure for 2013, in which the target was
more than 100% achieved.
Fisheries: 1,000
producers
assisted
1,000 fishermen
assisted
Fisheries: 980
producers
assisted
2,833 producers
assisted
Fisheries: 950
producers
assisted
The target will be successfully attained by 2014, despite data
obtained in 2011 showing that it is
not applicable and will be monitored in the following year.
Nonetheless, this could be
compensated by the actual figure
for 2013, in which the target was
more than 100% achieved.
Imp
rove s
ust
ain
ab
le
reso
urce
s
ma
na
gem
en
t
Increase production and 3.1 Percentage of bovine
Bovine meat
80% 66% 80% 76% 80% 70% 80% The data obtained from the sample show that the relevant authorities
18
Priority Strategic objective Output
indicators
Base 2010 2011 2012 2013 2014 Comment
Target Actual Target Actual Target Actual Target
improve access to inputs livestock vaccinated
production: 8,101
are making efforts in terms of the time horizon for each target, so it is
concluded that the target will be
approached by 2014.
11.2 No. of environmental
educators in
priority localities
48 % 1,200 5,345 1,400 1,883 900 2,412 700 The data obtained from the sample show that the relevant authorities
are making efforts in terms of the
time horizon for each target, so it is concluded that the target will be
approached by 2014.

19
Priority Strategic objective Output
indicators
Base 2010 2011 2012 2013 2014
Target Actual Target Actual Target Actual Target Comment
Objective 2 - Promotion of employment
Sti
mu
late
jo
b c
rea
tio
n
Create an environment that encourages the establishment
and development of SMEs,
and attraction of domestic and foreign investment in labor-
intensive industries
13.2 No .of firms licensed in the
simplified regime
(Ministry of Industry and
Trade – MIC)
5,000 6,500 4,997 7,500 14,977 8,500 15,425 9,500 Target more than 100% achieved.
13.3 No. of firms
using negative licensing
0 0 Not
applicable (to be
monitored
in 2012)
0 No
information
500 20% 5,000 As this indicator is difficult
to monitor, there is insufficient information and
nothing can be predicted in
terms of achieving the target. The actual figure shown for
2013 is in relation to
progress.
13.4 Improve
Mozambique’s
performance in the “Doing
Business”
ranking
(Indicator of
the 2012 QAD)
0 0 No
information
Reduce the
number of
procedures needed to
start up a
business by 50%
90 Reduce the
number of
days needed to
obtain a
building permit by
50%
115 To be
defined
Considering the rapid
progress achieved in 2012
and 2013, Mozambique is steadily improving its
performance and raising its
“Doing Business” ranking. This could continue in 2014,
although the target remains
to be defined.
14.1 No. of
enterprise
incubators, knowledge
transfer centers
and entrepreneurship
guidance centers
created and operational
1 7 1 10 No
information
14 20% 17 Considering the weak results
achieved from 2011 to 2013,
the 2014 target is at risk.
Im pro
ve
cit
i
zen
em
plo
ya
b
ilit
y Improve the efficiency and
effectiveness of public
17.1 No. of
vocational
23
precariously
4 3 7 6 9 9 10 Bearing in mind the progress
achieved from 2011 to 2013,
20
Priority Strategic objective Output
indicators
Base 2010 2011 2012 2013 2014
Target Actual Target Actual Target Actual Target Comment
employment services training centers expanded, a
quick, and with
trained staff
equipped the number of centers expanded, equipped, and
with trained staff scheduled
for 2014 is likely to be fully attained.
17.2 A large
number of
citizens receiving vocational
training to self
employment and large-scale
training in small
business management.
43,580
trained by
public vocational
training
centers
91,414 77,146 95,984 98,400 105,823 113,328 111,114 Target more than 100%
achieved

21
Priority Strategic objective Output
indicators
Base 2010 2011 2012 2013 2014
Target Actual Target Actual Target Actual Target Comment
Objective 3 - Human and social development
Av
ail
ab
ilit
y a
nd
qu
ali
ty o
f acce
ss t
o s
oci
al
serv
ices
Promotion of equal access to
healthcare, prioritizing health
and nutrition among women and children and other
vulnerable groups
18.1
Institutionalized
childbirth coverage rate
(Indicator 11
of the 2012
QAD).
62.0% 62.6% 62.8% 63.0% 63.8% 65.0% 66.0% 66.0% Bearing in mind planning
for 2014, the targets for this
objective could be attained. The target for the coverage
of institutionalized
childbirth was already achieved in 2013.
19.2 Percentage
of children
under one year of age fully
vaccinated.
72.0% 73.0% 73.2% 76.0% 78.8% 78.0% 78.0% 80.0%
Improve human resource management, making services
more user-friendly, and
focusing on service with
quality and on satisfying users’
needs
20.1 No. of new graduates in
specific health
careers
2,180 1,650 1,822 1,700 2,427 1,550 2,129 1,700 The indicator shows that the target for this objective
is attainable, because the
individual targets over the
years have always been
surpassed.
Universal access to seven grades of primary education, of
a quality that guarantees the
learning the basic skills
21.1 Net school enrolment rate
among six year
olds in the first cycle - Total
and Girls
(Indicator 13
of the 2012
QAD).
69.8% 73.0% 69.7% 73.0% 71.8% 76.0% 79.4% 79.0% This objective may not be wholly achievable, because
it remains a major
challenge to reduce the student-teacher ratio in the
first primary school cycle
(EP1). In fact, from a base of 66%, by 2013 it had only
been reduced to 63%, so
still above the intended

22
Priority Strategic objective Output
indicators
Base 2010 2011 2012 2013 2014
Target Actual Target Actual Target Actual Target Comment
Girls 69.6% 72.0% 68.7% 71.0% 71.9% 74.0% 77.4% 77.0% target of 60%.
21.2 No. of
students per
teacher in the first cycle (1st
to 5th grade)
(daytime public education)
(Indicator 14
of the 2012
QAD).
65.8% 65.0% 62.9% 62.0% 63.0% 61.0% 63.0% 60.0%
Ba
sic s
ocia
l se
cu
rit
y
Increase in the coverage and
impact of direct social action programs, contributing to
economic and nutritional
security among the most vulnerable groups
24.1 No. of
family aggregates
covered by
direct social action programs
(Indicator 16
of the 2012
QAD).
264,511 302,081 302,748 302,243 308,013 335,302 355,990 371,618 If the pace of beneficiary
growth seen throughout the year is maintained, this
target will be achieved and
the corresponding objective will be attained.
Design and implementation of
a national Productive Social
Action Program in response to
chronic food insecurity and
vulnerability to climate shocks, price changes, and seasonality
in agricultural production.
25.1 No. of
aggregates
benefiting from
the Productive
Social Action Program
(Indicator 16
of the 2012
QAD).
0 Program
designed
and
approved
Program
designed
9,592 9,683 11,380 11,345 14,770 Achievement of the 2014
target will enable the
objectives set to be fully
attained.

23
Priority Strategic objective Output
indicators
Base 2010 2011 2012 2013 2014
Target Actual Target Actual Target Actual Target Comment
So
cia
l in
fra
stru
ctu
res
Increase access to, and the use
of, drinking water supply and
safe sanitation services in rural
zones and urban/periurban
zones
26.1 No. of
disperse water
sources
operating in
rural zones
(Indicator 18
of the 2012
QAD).
16,500 18,900 20,704 19,432 19,306 19,614 22,854 20,069 Starting from a base of
16,500 operational water
sources in rural areas in
2010, a target of 20,069
was set for 2014. By 2013
there were 22,854, i.e. surpassing the target for the
five-year period