requirements to be a teacher in brazil: effective or not? · resumo: a lei de diretrizes e bases de...
TRANSCRIPT
Requirements to be a teacher in Brazil: effective or not?
Marcelo Ponte Barbosa (UFC)*
Leandro Oliveira Costa (World Bank)**
Abstract: The national Law of Guidelines and Standards of Education of 1996 stablished 2007 as the
deadline for all Brazilian basic education teachers to have tertiary education level habilitation. This
implied a significant change in the profile of teachers in basic education, the change in the provision of
pre-service training, and it was expected to improve teaching quality and students’ achievement in Brazil.
The objective of this study is to investigate the effects of the increase in the share of public upper
secondary school teachers with higher education on students’ performance in math and Portuguese and
analyze the role of pre-service training framework on the quality of teachers in recent years. We carried
out an empirical analysis in which we estimate the Average Treatment Effect on Treated on public upper
secondary students through the combination of difference-in-difference and propensity score matching
method. We found no evidence of positive effects on Portuguese scores, and despite the statistically
significant positive effect of the rise in teachers with higher education on math scores, we find no effect
from specific math training. Finally, we discussed the possible reason for the ineffectiveness of teacher
pre-service training, such as the quality of the training delivered by distance learning modalities and the
low performance of secondary students that enter in the teacher schools.
Keywords: teacher quality; teacher education requirements; secondary education.
Resumo: A Lei de Diretrizes e Bases de Educação de 1996 estabeleceu que todos os professores da
educação básica apresentassem habilitação de nível superior até o ano de 2007. Isso implicou numa
mudança significativa no perfil dos professores na educação básica, a partir da qual se esperava uma
melhoria na qualidade do ensino e, consequentemente, no desempenho dos estudantes brasileiros. O
objetivo deste estudo é investigar os efeitos do aumento da proporção de professores do ensino médio
com formação de nível superior sobre o desempenho dos estudantes em matemática e português e analisar
o papel da formação inicial dos professores na qualidade do ensino. Estimou-se o efeito tratamento médio
para os estudantes do ensino médio por meio da combinação do método de diferenças em diferenças e
pareamento por escore de propensão. Não foram encontradas evidências de efeito positivo da formação de
nível superior dos professores sobre o desempenho dos estudantes em língua portuguesa e, apesar do
efeito positivo sobre as notas de matemática, não há indícios de que o treinamento específico nesta
disciplina tenha qualquer efeito. Por fim, discutimos possíveis explicações para a ineficácia da formação
inicial dos professores, como a qualidade das diferentes modalidades de cursos superiores e o
desempenho dos alunos do ensino médio que ingressam nos cursos de licenciatura.
Palavras-Chave: qualidade do ensino; formação de professores; ensino médio.
JEL Codes: I26; I28; J24.
Área 12 - Economia Social e Demografia Econômica
* Professor at Universidade Federal do Ceará (UFC/DA). E-mail: [email protected] .
**Senior Economist at The World Bank. E-mail: [email protected] .

2
1. Introduction
In the last two decades there has been a significant change in the profile of teachers in basic
education, resulted from tertiary education requirement for teaching established by the national Law of
Guidelines and Standards of Education of 1996 (Law No. 9394/96, LDB). This law defined the year 2007
as deadline for all Brazilian basic education teachers to have tertiary education level habilitation.1
School census data of the Ministry of Education (MEC) suggest that, although this goal has not
been fully achieved, this law appears to have influenced profoundly pre-service teachers’ education. From
1995 to 2007, the percentage of teachers of basic education with higher education increased from 49% to
68%, then reached 83% in 2015. For upper secondary school teachers, this percentage increased from
82% to 93% in the period between 1995 and 2007, remaining stable until 2015.
At the same time, there was a significant increase in coverage of upper secondary education of 5.4
to 8.1 million students from 1995 to 2015, which was achieved in detriment of improvements in quality.
National Assessment of Basic Education (SAEB) results show a drop in the percentage of graduates of
basic education with adequate levels of learning in mathematics, from 11.6% to 7.3% of students, and in
Portuguese, from 45.4% to 27.5% of students from 1995 to 2015. It is possible that the massive
incorporation into educational system of out of school’s children from lower background families have
negatively influenced the quality of elementary education at first and of secondary education years later.
This seems consistent with the trajectory of the Portuguese learning indicator, which fell sharply up to
2005, showed a slight improvement until 2011 and stagnation afterwards, but do not seem to have had the
same influence on math learning indicator. Thus, it is not clear whether the variation in enrollments was
able to counterbalance the positive effects expected from the improvement in teachers' schooling.
Figure 1 - Percentage of graduates of secondary education with adequate levels of learning in math and Portuguese and Enrollment in secondary education
Note. Minimum score on the SAEB scale that characterize adequate learning for students in 3
rd grade of secondary
education was 300 points for Portuguese and 350 points for math. Source. School Census and SAEB – INEP/MEC.
The literature has established the central role of teachers on students learning, but there is still no
consensus on how teachers’ pre-service training affects teacher performance. Studies that measure the
value-added of teachers in a school year find that students with a good teacher can achieve an average
gain of one year, and students with great teachers might gain 1.5 grade levels (Hanushek and Rivkin
2010). In addition, teachers critically impact not only children’s immediate learning progress, but also
their longer-term development and life choices (Bruns and Luque, 2015). However, studies based on the
educational production function estimates from cross-sectional data and on regression analysis of
aggregated levels of student performance fail to find statistically significant effects of teacher education
measures (Hanusheck, 2003). Other series of studies developed since 2000s, based on student-level
longitudinal data and involving broader sets of variables, and more recent researches that address non-
observed heterogeneity and selection bias problems, find positive effects for some disciplines and grades
and specific types of teacher pre-service education (Wayne and Youngs, 2003; Harris and Sass, 2011).
1 Repealed by Law No. 12796/13, which reintroduced the secondary level Normal course as minimum level of training for
teaching in early childhood education and in the first years of elementary school.
11.6
17.9
11.9 11.6 12.8 10.9 9.8 11.0 10.3 9.3 7.3
45.4
39.7
27.6 25.8 26.9 22.6 24.5
28.9 29.2 27.2 27.5 5.4
6.4
7.8 8.4
9.1 9.0 8.4 8.3 8.4 8.3 8.1
1995 1997 1999 2001 2003 2005 2007 2009 2011 2013 2015
Math Portuguese Enrollment (million)

3
The objective of this study is to investigate the effects of the increase in the share of public upper
secondary school teachers with higher education on students learning in math and Portuguese and analyze
the role of pre-service training framework on the quality of teachers in recent years. To this end, we first
present the recent changes on teachers’ pre-service training in Brazil and an overview of the empirical
literature on the subject. Subsequently we carry out an empirical analysis in which we estimate the
Average Treatment Effect on public upper secondary students and conclude with a discussion on how the
current policies affect the quality of teachers in Brazil.
2. Key issues on teachers pre-service training in Brazil
Since the publishing of the LDB in 1996, whose article 62 defined the minimum requirements for
teaching in basic education, a new regulation on pre-service training began to be stablished. Initially,
LDB determined that basic education teachers should be trained at the tertiary level, in licenciatura
courses. The exception was a specific upper secondary level training, called Normal course, for teaching
exclusively in early childhood and early grades of primary education. In 1999, the decree No. 3276/99
established that the training for teaching in specific fields of knowledge, such as math, biology, physics,
etc., would take place in specific courses (also licenciatura degree) designed specifically for this purpose.
The resolution CNE No. 02 of 2015, which defines the National Curriculum Guidelines for
Teacher Training, established three pre-service training options that habilitate teachers for basic
education: (i) licenciatura degree, with a duration of four academic years and a minimum of 3200 hours
of academic work; (ii) second licenciatura degree, for licenciatura degree holders that want to teach
another field, with a reduced minimum workload of 1200 hours; and (iii) pedagogical supplementation,
for bachelor degree holders, which require a minimum of 1000 for the completion depending on the
equivalence between graduation already obtained and the field of the intended pedagogical training.2
There are many questions about the quality of teachers in Brazil related to the framework of pre-
service training and the governance of the system. For example, what was the effect of the increase in
teacher education requirement on basic education students' learning? Is the public education system not
able to attract top performance secondary schools’ graduates? Do we have a problem of quality in teacher
training courses? Regarding pre-service training, there are two major vectors that may affect the quality
of teachers: the first considers aspects of the educational background of those interested in teaching
career; the second is regarded to the profile and structure of tertiary education (Bruns and Luque, 2015).3
The significant increase in coverage of primary and secondary education observed until the mid of
2000 in Brazil required hiring new teachers, which resulted in a change in the profile of the freshmen in
this career (Lerch et al, 2010). In response to the rapid increase in demand for teachers with degrees, there
was a boom in the provision of tertiary education programs. This led to the inclusion in the teacher career
of secondary education graduates from families of lower socioeconomic background.
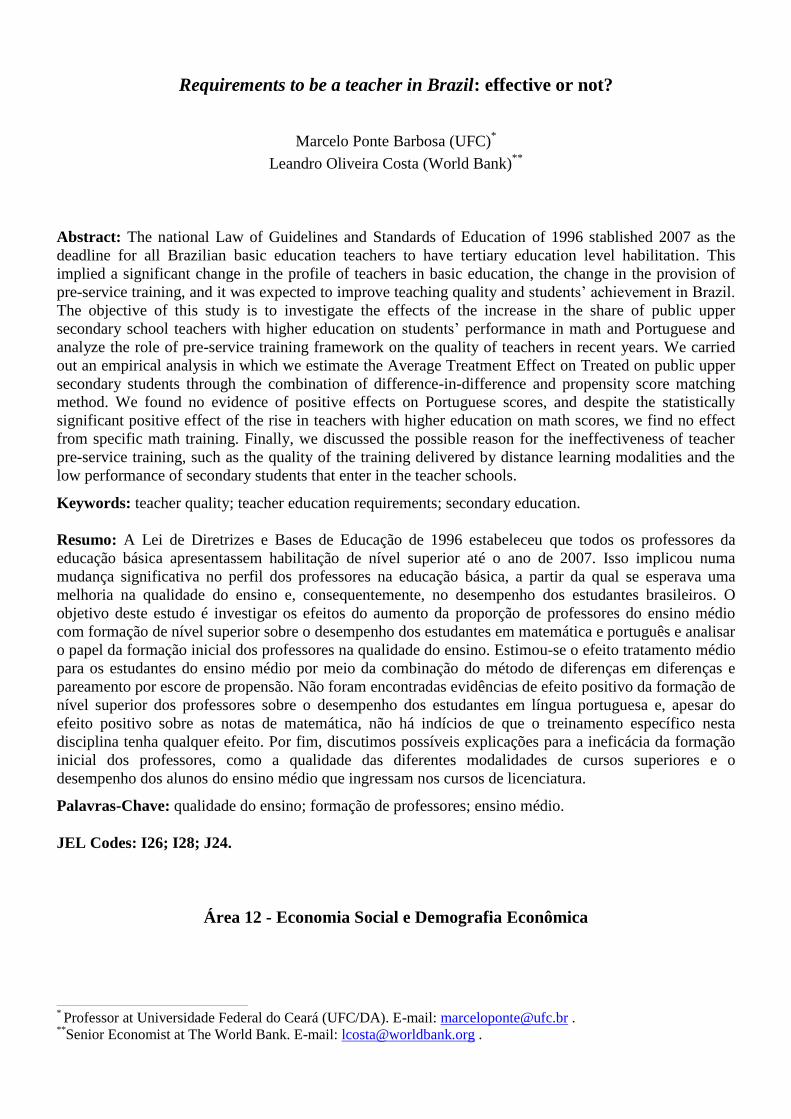
The percentage of public upper secondary education teachers with higher level increased from
82% to 93% in more than 20 years, mainly due to licenciatura degrees (Figure 2). However, there are still
teachers without higher education or with pedagogy degree, which is not focused on secondary education,
whose share corresponds to 7.6%. Also, due to a lack of minimum standards for teachers’ admission,
States and municipalities selected teachers with distinct profiles. All these teachers may have been trained
in different types of institutions that are practically autonomous to decide about their curriculum.
Louzano et al. (2010) investigate the profile and preferences of secondary school graduates who
declared themselves interested in teaching career in 2005.4 Only 10% of this group belonged to the top
performance students, and about a third were among the bottom performance students. These evidences
suggest that the teaching career in Brazil is attracting a high share of less-skilled students. In fact, the cut-
off ENEM score required for admission to public higher education institutions are much lower for
licenciatura courses in these universities. In year 2014 the mean cut-off score for licenciatura in specific
2 Pedagogical supplementation was instituted in 1997 as a provisional act and originally required a workload of 540 hours. Its
provisional nature is reversed 2017, and the certification is now recognized in LDB as valid requisite for teaching. 3 The authors find that Latin America countries are trapped in a low-level equilibrium with low standards for entry into teacher
training programs, which are not prepared to produce the set of competences found in high performance educational systems. 4 Based on socioeconomic questionnaire data of the National Examination of High School (ENEM).
4
disciplines and in pedagogy were, respectively, the 5th and the 2nd lowest in a classification of 75
courses.5 In addition, licenciatura offered by private institutions are among courses with less competition
for admission and therefore might be the choice of students with weaker educational background.6
Figure 2 - Percentage of Public Upper Secondary Schools Teachers with Higher Education
*Private institution indicates percentage of higher educated teachers that attended only private higher education Institution. Source. School Census, microdata, INEP/MEC.
Other factors that may be affecting the quality of trained teachers are related to the nature and
quality of teacher pre-service training programs. As pointed out by Bruns et al. (2012) and Carnoy et al.
(2008), teachers pre-service training, in general, give low relative importance to didactics and techniques
of teaching and classroom management. In order to shed light on these aspects we explore the changes in
teacher pre-service training programs in the last ten years.
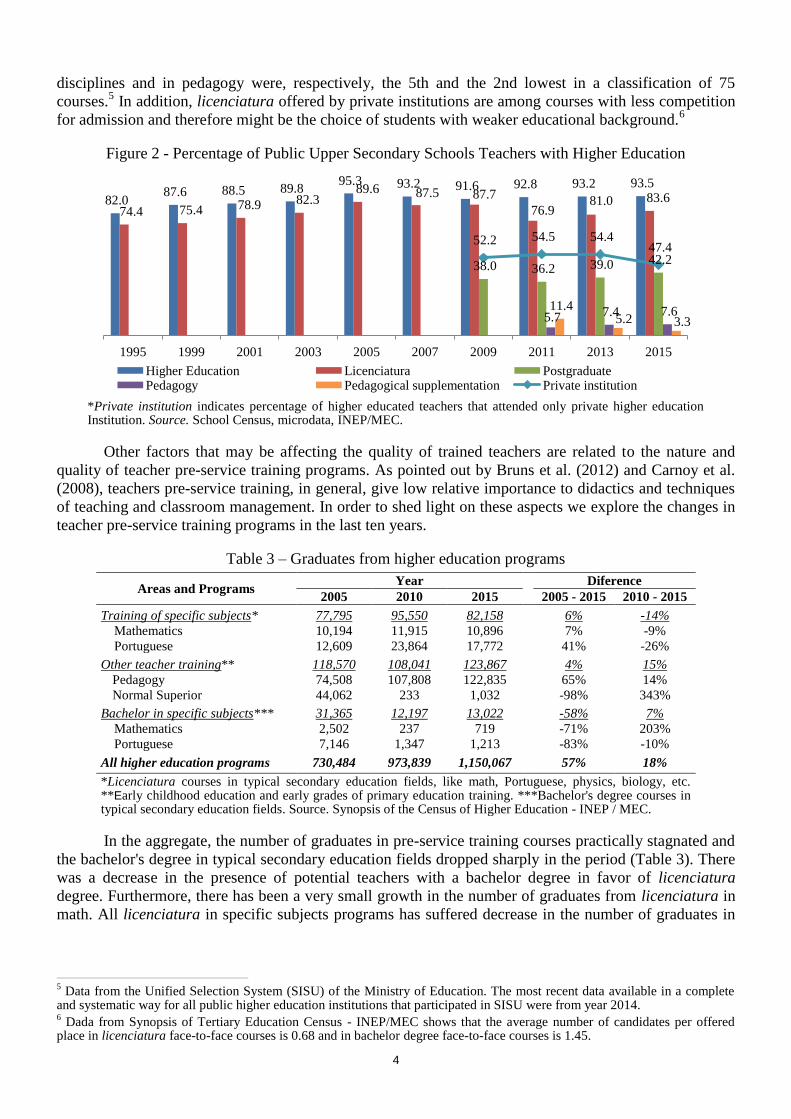
Table 3 – Graduates from higher education programs
Areas and Programs Year Diference
2005 2010 2015 2005 - 2015 2010 - 2015
Training of specific subjects* 77,795 95,550 82,158 6% -14%
Mathematics 10,194 11,915 10,896 7% -9%
Portuguese 12,609 23,864 17,772 41% -26%
Other teacher training** 118,570 108,041 123,867 4% 15%
Pedagogy 74,508 107,808 122,835 65% 14%
Normal Superior 44,062 233 1,032 -98% 343%
Bachelor in specific subjects*** 31,365 12,197 13,022 -58% 7%
Mathematics 2,502 237 719 -71% 203%
Portuguese 7,146 1,347 1,213 -83% -10%
All higher education programs 730,484 973,839 1,150,067 57% 18%
*Licenciatura courses in typical secondary education fields, like math, Portuguese, physics, biology, etc. **Early childhood education and early grades of primary education training. ***Bachelor's degree courses in typical secondary education fields. Source. Synopsis of the Census of Higher Education - INEP / MEC.
In the aggregate, the number of graduates in pre-service training courses practically stagnated and
the bachelor's degree in typical secondary education fields dropped sharply in the period (Table 3). There
was a decrease in the presence of potential teachers with a bachelor degree in favor of licenciatura
degree. Furthermore, there has been a very small growth in the number of graduates from licenciatura in
math. All licenciatura in specific subjects programs has suffered decrease in the number of graduates in
5 Data from the Unified Selection System (SISU) of the Ministry of Education. The most recent data available in a complete
and systematic way for all public higher education institutions that participated in SISU were from year 2014. 6 Dada from Synopsis of Tertiary Education Census - INEP/MEC shows that the average number of candidates per offered
place in licenciatura face-to-face courses is 0.68 and in bachelor degree face-to-face courses is 1.45.
82.0 87.6 88.5 89.8
95.3 93.2 91.6 92.8 93.2 93.5
74.4 75.4 78.9 82.3 89.6 87.5 87.7
76.9 81.0 83.6
38.0 36.2 39.0 42.2
5.7 7.4 7.6 11.4 5.2 3.3
52.2 54.5 54.4 47.4
1995 1999 2001 2003 2005 2007 2009 2011 2013 2015
Higher Education Licenciatura Postgraduate Pedagogy Pedagogical supplementation Private institution

5
the last five years, especially licenciatura in Portuguese.7 The stagnation in number of graduates in math
and the tendency to extinction of the Bachelor degree may be affecting the quality of math teaching. Note
that the percentage of bachelor degree teachers with pedagogical supplementation dropped from 11.4% to
3.3% between 2009 and 2015 (Figure 2).
Major changes have occurred on the composition of pre-service teaching programs in recent years,
which may have affected the profile of freshmen in this career. Figure 6 shows that the private institutions
increased their share on the provision of graduates in pedagogy and in Portuguese, but lost participation
for graduates in math and practically faced no change for other licenciatura in specific subjects. Federal
institutions, on the other hand, more than doubled their share in total number of graduates in licenciatura
in specific subjects, but lost participation in pedagogy. Nowadays, almost half of the graduates in
Portuguese and more than half in math and in other subjects come from public institutions programs.
Figure 6 - Pre-service training graduates by the type of higher education institutions
* Licenciatura in Physics, Chemistry, Biology, Geography and History. Source: Statistical summaries of the Higher Education Census 2005, 2010 and 2015 - INEP / MEC.
Figure 8 - Pre-service distance training graduates by the type of higher education institutions
* Licenciatura in Physics, Chemistry, Biology, Geography and History. Source: Statistical summaries of the Higher Education Census 2005, 2010 and 2015 - INEP / MEC.
The most remarkable change in the period was the emergence and growth of distance learning. In
the year 2015 about half of pedagogy graduates and one fourth of the graduates in specific subject
licenciatura attended this modality. Private institutions has been responsible for the highest shares in the
number of graduates from distance learning courses, remarkably in pedagogy, whose share has been kept
above 90% since 2010 (Figure 8). Despite this protagonist, the share of private institutions in distance
learning reduced among licenciatura in specific subjects, with exception to Portuguese, in which private
7
The increase in pedagogy and decrease in Normal superior course graduates is related to a new regulation in 2006, which allowed pedagogy degree holders to teach in early childhood education and initial years of primary education.
46720
89467 99806
5128 6167 4096 4943
14805 9273 8408
25928 18913
9298
8824 9365
1330 2315
3336 1347
3561 4372
2054
8001 11103
16758 8147 12247
3032 2810 2898
5645
4787 3641
5731
8366 9090
1732 1370 1417 704 623 566 674 711 486 1376 1747 1201
0%
20%
40%
60%
80%
100%
2005 2010 2015 2005 2010 2015 2005 2010 2015 2005 2010 2015
Pedagogy Math Portuguese Other*
Private Federal State Municipal
44838 55672
1948 1470
6048 3435 7987
7428
3481 2496
361 1064
3
687 394 1135
889 2334 550 355
1803 165 43 690
0%
20%
40%
60%
80%
100%
2010 2015 2010 2015 2010 2015 2010 2015
Pedagogy Math Portuguese Other*
Private Federal State Municipal

6
institutions showed a small increase. On the other hand, federal institutions increased their share in
distance learning in specific subjects programs. In particular, their participation in the total number of
graduates in math rose from 12.6% to 36.8% in the period, while private institutions reduced their share.
Among the graduates in Portuguese, the share of federal institutions went from none to 16% in the period.
To shed light on the potential effects of these recent changes on the quality of future teachers,
Tables 4 and 5 present the mean performance of graduates in ENADE8 exam and a measure of value-
added9 from public and private licenciatura programs in year 2014. In general, ENADE’s results show
that top performance students are enrolled in face-to-face federal university and private non-for-profit
institutions programs and the bottom performance are in state and private for-profit institutions. Also,
federal universities graduates performed better in both training modalities and graduates from private for-
profit institution programs showed the lowest results. Finally, besides the better performance of
licenciatura graduates in face-to-face programs as a whole, when restricting to distance learning modality
this difference almost disappears for graduates in math and pedagogy. In particular, in private institutions,
the performance of the distance learning programs was superior to face-to-face programs.
Table 4 – Performance in ENADE by type of higher education institution (2014)
Pedagogy Math Portuguese Other* Total
Face-to-
face Distance
Face-to-
face Distance
Face-to-
face Distance
Face-to-
face Distance
Face-to-
face Distance
Private 2.42 2.00 1.96 2.07 2.20 1.90 2.29 1.88 2.30 1.94
Profit 2.29 1.77 1.70 NA 1.92 1.77 2.09 1.68 2.13 1.75
Nonprofit 2.53 NA 2.11 NA 2.36 NA 2.36 1.97 2.41 2.11
Federal 3.02 NA 2.58 2.36 2.91 NA 2.72 2.25 2.76 2.39
State 2.59 NA 1.97 NA 2.08 NA 2.24 NA 2.23 1.92
Total 2.50 2.48 2.20 2.17 2.32 1.79 2.44 1.96 2.41 2.08
* Licenciaturas in physics, chemistry, biology, history and geography. NA: Not available (less than five observations). Note. Performance in ENADE: The indicator is a result of the weighted average of the standardized scores of the graduates in the General Training test (common for all areas evaluated, weighing 25% of the grade) and in the Specific Knowledge test (75% of the grade). Source. ENADE/IDD microdata, INEP/MEC.
Table 5 – Value-added by type of higher education institution (2014)
Pedagogy Math Portuguese Other* Total
Face-to-
face Distance
Face-to-
face Distance
Face-to-
face Distance
Face-to-
face Distance
Face-to-
face Distance
Private 2.53 2.35 2.18 2.24 2.68 2.38 2.55 2.37 2.53 2.36
Profit 2.50 2.23 1.94 NA 2.61 2.08 2.53 2.49 2.48 2.21
Nonprofit 2.55 NA 2.32 NA 2.72 NA 2.55 2.32 2.56 2.48
Federal 2.34 NA 2.58 2.40 2.59 NA 2.46 2.27 2.49 2.35
State 2.30 NA 2.27 NA 2.52 NA 2.44 NA 2.41 2.28
Total 2.47 2.36 2.36 2.31 2.62 2.39 2.49 2.34 2.50 2.35
* Licenciaturas in physics, chemistry, biology, history and geography. NA: Not available (less than five observations). Note. Value Added: Difference Between Observed and Expected Performances Indicator (Indicador da Diferença entre os Desempenhos Observado e Esperado [IDD]). Source. ENADE/IDD microdata, INEP/MEC.
In aggregate, private institutions tend to add as much value as federal institutions, and non-for-
profit institutions are more capable of adding more value in either training modalities. This advantage is
even higher for face-to-face licenciatura programs in pedagogy and Portuguese. On the other hand, public
institutions perform better in math programs, but nonprofit private institutions add more value that state
institutions. Finally, distance learning tends to add more value only for licenciatura in math for private
institutions. Clearly, higher average scores in ENADE achieved by federal institutions programs are
partly due to the better learning background of their incoming students. Therefore, the higher value-added
8 The National Student Performance Test (ENADE) evaluates the skills and competences acquired by the graduates of all the
undergraduate courses in Brazil. The first application of ENADE occurred in 2004 and each area of knowledge is evaluated triennially. The most recent edition that evaluated the licenciatura programs occurred in 2014. 9 Indicator of Difference Between Observed and Expected Performances (IDD), a value-added indicator calculated by
INEP/MEC used to control the performance in the ENADE by pre-university learning level of the incoming students shows the. Details on the calculation formula are available in INEP technical note Nº 33/2017/CGCQES/DAES.

7
of private programs may be due to decreasing returns to the educational production function, whereby it
would be easier to obtain return from individuals with poor average educational background.
The above findings allow us to point out a set of factors that may explain why the raise in teacher
tertiary education does not seem to have affect students learning in the last decade. Beyond the low
educational background of incoming students and the raise in distance learning modality, the present
analysis raises other key aspects. First, the preponderance of teachers with licenciatura and the sharp fall
in bachelor degree in specific areas of knowledge may not have been benefic to teachers quality. It is well
documented that the majority of licenciatura programs assigns little importance in developing core
teaching competencies, like teaching techniques and planning and organizing classroom activities (Bruns
et al, 2011). But it is also possible that they fail in providing the necessary knowledge on the specific
subjects taught too. Second, lack of effects may lie in the mismatch between the specific subject training
of the teacher and the discipline he teachers (e.g.: math teachers that have not a licenciatura or bachelor
degree in math). The data presently available allow us to test this mismatch hypothesis, as described later.
Finally, the leading role of private institutions and of distance learning modality in the provision
of pedagogy courses, while not directly affecting the quality of teaching in secondary education, can have
effects on the quality of elementary and early childhood schools and, therefore, compromise the learning
ability of students entering high school. This hypothesis will be addressed in an upcoming study.
3. Empirical literature on teacher training and student learning
The quality of teachers and your effect on students' learning is a central theme of educational
policy. The international literature indicates that a student with a low quality teacher ends the school year
dominating at most half of the curriculum planned for this year, while students with an excellent teacher
advance 50 percent more than expected (Farr, 2010; Hanushek and Rivkin, 2010). Thus, exposure to low-
quality teachers for years running can lead to insurmountable deficits of students' learning.
Despite the recent evidences confirming the central role of teacher quality on students learning,
there's still no consensus on how much schooling and teacher training contribute to a greater and lesser
degree, to raise the quality of education. The first works on the productivity of teachers were developed
based on the educational production function estimates from cross-sectional data, and regression analysis
of aggregated levels of student performance in teacher training measures and several other controls.
In studies conducted until mid 1990s for the public schools of the United States, Hanushek (2003)
identifies 170 estimates of the effect of teacher training measures on the performance of students in
United States, of which only 14% reported statistically significant results, 9% of which showing positive
effects. This percentage drops to zero when limited the analysis to only the studies considered by the
author as high quality (with estimates based on the "value added" by a student of the same State). The
author suggests that the difficulty in capturing the effect of teacher education may be in part due to low
variability of the indicator between American schools. Another compilation, spanning 63 studies applied
to developing countries, Hanushek (2003) reports that 56% of estimates of the effect of teacher's
education school performance were positive and significant.
Wayne and Youngs (2003) conducted an extensive review of the existing empirical literature until
the early 2000s, when most of the evaluation studies of the effects of the education of teacher passes
using student-level longitudinal data and involve broader sets of variables. Most of the work considered
indicates that secondary school students learn more math when their teachers have higher training in
mathematics, and no effect in relation to the lower grades and to other areas of knowledge. Moreover, the
survey indicated that the quality of teacher education (measured by the raking of the institution) has
positive relationship on the performance of the students.
Based in a review of a wide range of empirical studies, Rice (2003) reports positive effects on
high school mathematics and science achievement of students whose teachers have obtained advanced
degrees in these subjects, and reports mixed evidence regarding the impact of advanced degrees at the
elementary level. Also, there is a positive effect on high school mathematics achievement from certified
teachers only when the certification is in mathematics. Finally, reports that the training institution
attended by teacher positive effect on student achievement, particularly at the secondary level, but points
out that this can be a reflection of the cognitive ability of the teacher.
8
Harris and Sass (2011) carry out a survey of the researches developed up to 2010, highlighting the
fragility of previous work to control the heterogeneity among students only by their characteristics
observed (covariates of students). The authors cite evidence that students who present greater learning
capacity and fewer disciplinary problems tend to be allocated in classes with more experienced and
qualified teachers, so that the lack of appropriate controls for the unobservable characteristics tends to
generate biased estimates of the effects associated with the training of teachers.
Regarding the studies that have addressed the problem of selection bias, Harris and Sass (2011)
points out eight studies that used fixed effects at the student level to control for the heterogeneity not
observed, and five that explored random assignment experiments between students and teachers or that
use natural experiments. None of the studies finds positive and statistically significant effect of the nature
of higher education on the future teacher performance and the majority finds no relationship between the
selectivity of higher education institution and teacher performance. Finally, with the exception of two
studies that have identified significant and positive effects of master degree education of teachers on
students math scores, all other studies either indicate absence of statistically significant effect or even
negative effect of holding a postgrad degree on math and language students’ performance.
Since unobservable characteristics of teachers (like their IQ) can influence your pre-service
training and also affect your future performance in the classroom, Harris and Sass (2011) incorporate in
their study the teachers grade in the college admission exam as a way of controlling the effect of higher
education for the pre-college skills, thus avoiding a major source of bias.10
The authors found no robust
evidence that pre-service teachers training affect the productivity of the future teacher.
For Brazil, Louzano (2010) did not find a significant correlation between pre-service training of
teachers and the performance of students. Menezes Filho (2007), on the other hand, reported significant
impact of teacher's education only on third grade secondary education students, and for teachers with a
degree in mathematics. The author also reports that teachers with 50 years or more of age positively affect
students' learning. Such studies, however, do not use methods capable of dealing with various issues, in
particular with the existing selection bias in the allocation between students, teachers and schools.
4. Data and Descriptive Analysis
In this study we use data from the National Examination of Secondary School (ENEM) and from
the School Census for the years 2009 and 2015, which covers proficiency indicators and a broad set of
covariates at student and school levels, for potentially all Brazilian schools.11
In total, there were 20,979
public secondary schools in ENEM microdata, of which 17,214 appeared in the year 2009, 19,847
appeared in the year 2015, and 16,082 occurred in both years. Following the MEC criteria for
disseminating the ENEM results, schools with less than 10 students from the 3rd grade participating in
the exam were excluded, which resulted in 11,506 schools remaining in the sample. Of these, 151 schools
with a participation rate above 100% were also excluded, leaving 11,355 schools at the base in both years.
Based on the School Census data, two school level variables were constructed to characterize
teachers’ education for each field or discipline (math and Portuguese): (i) Percentage of classes taught by
teacher with higher education, and (ii) Percentage of classes taught by teacher with higher education in
the field. The calculation was restricted to the schools with at least three upper secondary school classes
for each discipline, so that the indicators reflect at least one class for each series of this teaching stage.12
Table 6 shows statistics for outcomes and teachers education variables, and relevant available
covariates in this sample. The average math score dropped from 475.6 to 450.8 points in this period, a
reduction of 0.31 standard deviation from the average obtained in 2009. This decrease came together with
the increase of the dispersion of results among students, captured by the rise in the standard deviation. 10
Harris and Sass (2011) investigate the effects of the specific areas of higher education of teachers (Education Major, Math Education Major, English Education Major, Math Major e English Major) so as to take advantage of the greater variability of these variables to try to capture some effect statistically significant on student performance. 11
ENEM incorporate the Item Response Theory for scores calculation in 2009, when a proficiency scale with an average of 500 points and standard deviation of 100 points was defined, which allowed comparing results of different editions of the exam. Moreover, since this year students’ performance in ENEM has become the main access route to public university, which has significantly enlarged the number participants. The year of 2015 was the last year in which microdata are available. 12
Resulted in 11,336 and 10,857 schools with, respectively, at least three high school math and Portuguese classes in 2009, and in 11,317 and 11,323 schools with, respectively, at least three high school math and Portuguese classes in 2015.

9
Portuguese average score, on the other hand, rose from 477.1 to 490.2 points, an increase of 0.15 standard
deviation from the average obtained in 2009, and there was a reduction in the dispersion of scores.
Table 6 – Summary Statistics for Student and School Variables, by year, 2009 and 2011.
2009 2015
Covariate obs. mean sd. min. max. obs. mean sd. min. max.
Student level variables
Math score 523,043 475.6 79.6 345.2 939.5 793,728 450.8 85.8 285.4 999.5
Portuguese score 523,043 477.1 90.0 224.3 835.6 793,728 490.2 66.4 303.3 795.4
Female 523,043 62.5% 48.4% 0% 100% 793,728 59.3% 49.1% 0% 100%
Black 466,681 11.2% 31.5% 0% 100% 784,540 12.5% 33.1% 0% 100%
Mother secondary 456,105 38.2% 48.6% 0% 100% 755,439 46.2% 49.9% 0% 100%
Car 463,789 44.7% 49.7% 0% 100% 793,621 42.0% 49.4% 0% 100%
Computer & Internet 463,685 41.7% 49.3% 0% 100% 793,614 56.3% 49.6% 0% 100%
Work 446,886 47.3% 49.9% 0% 100% 793,614 34.7% 47.6% 0% 100%
Private primary 466,374 14.0% 34.7% 0% 100% 793,614 15.5% 36.2% 0% 100%
Evening classes 459,708 40.2% 49.0% 0% 100% 793,613 25.6% 43.7% 0% 100%
School level variables
Infra PNE 11,355 0.193 0.395 0.000 1.000 11,355 0.305 0.460 0.000 1.000
Class hours 11,355 4.4 0.5 3.0 8.0 11,355 4.8 1.1 2.7 12.9
Class size 11,355 34 6 11 214 11,355 31 6 7 222
Participation ENEM 11,355 35.9% 17.4% 1.3% 100% 11,355 54.5% 19.4% 3.8% 100%
Math classes higher* 11,336 93.0% 18.9% 0% 100% 11,317 95.1% 13.7% 0% 100%
Math classes higher field**
11,336 71.8% 32.7% 0% 100% 11,317 76.4% 27.9% 0% 100%
Portuguese classes higher* 10,857 94.9% 15.5% 0% 100% 11,323 96.9% 10.3% 0% 100%
Portuguese classes higher field**
10,857 84.3% 26.1% 0% 100% 11,323 82.1% 25.4% 0% 100%
Note. Students in the 3rd year of public regular secondary school that participate in ENEM. Infra PNE: Indicator for school infrastructure from Observatory of theNational Education Plan (Observatório PNE). *% classes taught by teacher with higher education. **% classes taught by teacher with higher education in the field. Source. ENEM,and School Census microdata.
In the same period, the percentage of classes taught by teachers with higher education increased
by about 2 percentage points for both math and Portuguese. This result was accompanied by the increase
of 4.6 percentage points in the percentage of math classes taught by teacher with higher education in this
field, and the decline of almost 2.2 percentage points in the indicator for Portuguese classes. That is, the
growth of teacher-specific training for the discipline, from an aggregate point of view, does not seem to
have had a positive relationship with student performance.
Some important changes occurred in the period that may be correlated with students’ results.
Regarding the educational offer conditions, the percentage of students attending evening classes
decreased from 40.2% to 25.6%, the average duration of classes increased from 4.4 to 4.8 hours, the
average number of students per class decrease from 34 to 31, and schools infrastructure indicator
increased from 0.193 to 0.305. In relation to students’ profile, the percentage of students who have
already worked decreased from 47.3% to 34.7%, the percentage of students with mothers with complete
secondary education rose from 38.2% to 46.2%, and the percentage of students with computer and
Internet access at home increased from 41.7% to 56.3%. The other covariates showed minor variation.
Table 7 presents the percentiles of the percentage of classes taught by teachers with higher
education and with higher education in the field in years 2009 and 2015. While more than 80% of the
schools already had all math and Portuguese classes taught by higher-educated teachers in 2009, big
changes occurred in the lowest percentiles. For example, 95% of the schools had more than half of its
math classes taught by teachers with higher education in 2009 and six year later the same proportion of
schools had more of 66.7% of its math classes taught by teachers with that degree. For higher education
in the field indicator, more than half of schools already had all Portuguese classes with teachers trained in
this discipline but the proportion of math classes with teachers trained in math is much far from being
complete. In general, while the changes in the percentage of classes taught by teachers with higher
education were concentrated to the very lower percentiles of the distribution, for higher education in the
field indicator the changes spread also to higher order percentiles. So schools seem to be converging to
universalization of teachers training at tertiary level, excepting for field training of Portuguese teachers.

10
Table 7 – Percentage of Classes Taught by Teachers with Higher Education
Percentile
p5 p10 p15 p20 p30 p40 p50 p60 p70 p80 p90
Math classes higher
2009 50.0% 73.3% 87.5% 100% 100% 100% 100% 100% 100% 100% 100%
2015 66.7% 81.0% 90.9% 100% 100% 100% 100% 100% 100% 100% 100%
Portuguese classes higher
2009 63.6% 82.4% 94.0% 100% 100% 100% 100% 100% 100% 100% 100%
2015 76.9% 90.3% 100% 100% 100% 100% 100% 100% 100% 100% 100%
Math classes higher in the field
2009 0.0% 16.0% 31.3% 41.7% 60.0% 72.7% 83.3% 95.3% 100% 100% 100%
2015 14.3% 33.3% 45.7% 55.0% 66.7% 76.9% 85.7% 95.2% 100% 100% 100%
Portuguese classes higher in the field
2009 20.0% 42.9% 59.4% 69.2% 83.3% 94.4% 100% 100% 100% 100% 100%
2015 25.0% 44.4% 56.3% 64.3% 76.9% 86.7% 95.7% 100% 100% 100% 100%
More interesting would be to see how many schools increased the indicator and to what degree
this happened. Tables 8 and 9 show the transition of the schools between percentile strata showed in
Table 7, based on 2009’s percentile intervals. The blue cells show how many schools managed to raise
the indicators in the period and the red cells show how many schools faced a decrease in indicators.
Table 8 – Number of schools by Percentage of Classes Taught by Teachers with Higher Education – Transition between percentile strata, 2009 and 2015.
Math classes 2015
(87.5%, 100%] (73.3%, 87.5%] (50.0%, 73.3%] (0%, 50.0%] Total
2009
(87.5%, 100%] 8,545 508 370 162 9,585
(73.3%, 87.5%] 454 65 36 27 582
(50.0%, 73.3%] 414 55 45 24 538
[0%, 50.0%] 386 62 72 75 595
Total 9,799 690 523 288 11,300
Portuguese classes 2015
(94.0%, 100%] (82.4%, 94.0%] (63.6%, 82.4%] (0%, 63.6%] Total
2009
(94.0%, 100%] 8,265 400 350 185 9,200
(82.4%, 94.0%] 441 55 28 17 541
(63.6%, 82.4%] 424 48 41 22 535
[0%, 63.6%] 397 55 58 41 551
Total 9,527 558 477 265 10,827
Note. Strata were constructed based on 5th, 10th, and 15th percentiles. Blue (red) color indicates schools that moved the indicator to a superior (inferior) stratus between years 2009 and 2015.
Table 9 – Number of schools by Percentage of Classes Taught by Teachers with Higher Education in
the Field – Transition between percentile strata, 2009 and 2015.
Math classes 2015
(72.7%, 100%] (60.0%, 72.7%] (41.7%, 60.0%] (16.0%, 41.7%] (0%, 16.0%] Total
2009
(72.7%, 100%] 4,986 674 576 322 179 6,737
(60.0%, 72.7%] 630 163 155 82 40 1,070
(41.7%, 60.0%] 684 185 209 105 53 1,236
(16.0%, 41.7%] 519 144 196 179 95 1,133
[0%, 16.0%] 445 106 171 173 229 1,124
Total 7,264 1,272 1,307 861 596 11,300
Portuguese classes 2015
(94.4%,100%] (83.3%, 94.4%] (69.2%, 83.3%] (42.9%, 69.2%] (0%, 42.9%] Total
2009
(94.4%,100%] 3,812 743 790 702 444 6,491
(83.3%, 94.4%] 474 168 185 149 78 1,054
(69.2%, 83.3%] 477 148 197 179 114 1,115
(42.9%, 69.2%] 374 136 174 228 169 1,081
[0%, 42.9%] 304 97 154 251 280 1,086
Total 5,441 1,292 1,500 1,509 1,085 10,827
Note. Strata were constructed based on 10th, 20th, 30th, and 40th percentiles. Blue (red) color indicates schools that moved the indicator to a superior (inferior) stratus between years 2009 and 2015.

11
In Table 8, for example, note that some schools that had high percentage of classes taught by
teachers with higher education in 2015 (above 87.5% for math classes and above 94% for Portuguese
classes) was in lower strata of the distribution in 2009 (below 87.5% for math classes and below 94% for
Portuguese classes): 1,254 of 9,799 schools and 1,262 of 9,527 schools, respectively, considering the
indicator for math and Portuguese classes. On the other hand, other schools that had a high percentage of
classes taught by teachers with higher education in 2009 passed to lower levels of distribution in 2015:
1,040 from 9,585 schools and 935 from 9,200 schools, respectively for math and Portuguese classes.
These transitions from lower strata to the highest stratum of the distribution can be used to
characterize school treatment condition in the following sense: schools that went from a lower strata to
the greater stratum of the distribution are considered to have being treated, since they showed
improvement in the indicator in the period; and schools that went from the highest stratum to a lower
strata of the distribution are considered to have undergone a negative treatment. Due to its large number,
schools that remained in the highest stratum of the distribution are considered as control group.
Based on the above strategy we constructed a set of variables that characterize different degrees of
exposure to treatment, here understood as the increase (or decrease, for negative treatment) in the
percentage of classes taught by teachers with higher education and by teachers with higher education in
the field. We subdivide the exposition to treatment into three degrees (and four degrees, for the higher
education in the field indicator) according to the stratum in which the school was in year 2009: treatment
group 1 (Treated 1) is composed of schools whose indicator was in the stratum immediately below the
highest, treatment group 2 (Treated 2) is composed of schools whose indicator was in the next stratum,
and so on; so that the greater the order of treatment, the greater its intensity is. Similarly, the degree of
negative treatment can also be characterized in degrees, according to the stratum of the school in 2015.
We see in Table 10 that for both years and disciplines the average scores are higher among
students from untreated schools, and are smaller for more intensively treated schools. This is consistent
with the hypothesis of positive correlated between teachers’ education and students learning. It would be
also expected a higher increase in outcome among treated schools, especially among the most intensively
treated ones. Data on Portuguese scores corroborate with this hypothesis, but not for math, as students
from treated and untreated schools perceived similar reduction in the average scores.
Table 10 – Mean score on ENEM by condition of exposure to treatment
Math Portuguese
2009 2015
∆ Mean 2009 2015
∆ Mean Treatment Mean SD Mean SD Mean SD Mean SD
Teachers with higher education
Control 479.1 (81.0) 454.4 (87.0) -24.7 480.7 (90.2) 493.3 (66.2) 12.6
Treated 1 463.5 (72.2) 439.0 (77.5) -24.5 463.7 (87.5) 478.6 (65.8) 14.9
Treated 2 461.1 (72.2) 437.2 (80.1) -23.9 460.8 (88.6) 477.5 (66.8) 16.7
Treated 3 455.6 (69.9) 431.1 (74.2) -24.5 448.5 (85.0) 469.7 (64.6) 21.2
Treated 1,2,3 461.0 (71.8) 436.7 (77.8) -24.3 459.4 (87.5) 476.3 (66.0) 16.9
Treated 2,3 458.9 (71.4) 434.9 (78.0) -24.0 456.0 (87.4) 474.6 (66.1) 18.6
Teachers with higher education in the field
Control 481.8 (82.6) 457.5 (89.0) -24.3 487.1 (90.6) 498.4 (65.8) 11.3
Treated 1 472.2 (76.8) 446.8 (83.2) -25.4 477.8 (90.4) 491.4 (67.6) 13.6
Treated 2 470.4 (76.1) 444.6 (81.4) -25.8 472.1 (90.2) 486.4 (67.1) 14.3
Treated 3 466.5 (73.4) 441.9 (80.0) -24.6 465.4 (88.3) 481.2 (66.0) 15.8
Treated 4 460.8 (72.7) 437.2 (78.5) -23.6 448.1 (85.9) 469.5 (65.9) 21.4
Treated 1,2,3,4 468.7 (75.3) 443.6 (81.3) -25.1 469.5 (89.8) 484.5 (67.3) 15.0
Treated 2,3,4 467.0 (74.5) 442.0 (80.4) -25.0 464.7 (89.2) 480.8 (66.8) 16.1
Note. Students in the 3rd year of public regular secondary school that participate in ENEM in the years 2009 or 2015. Source. ENEM, 2009 and 2015, microdata.
From the perspective of the negative treatment, it would be expected that the mean increase
(decrease) in the outcome indicator would be smaller (greater) among treated schools, the most
intensively treated schools performing relatively worse. However, with the exception of the exposition of
the students of math classes to higher educated teachers, there is no clear pattern indicating adherence to

12
the hypothesis (Table 11). Average scores in math decreased most for treated students, as expected. Also,
average scores in Portuguese increased least for treated students, excepting for the most intensively
treated school (Treated 3), which showed similar advance in scores. Similar results are found when
analyzing the treatment in terms of percentage of classes taught by teacher with higher education in
Portuguese (Treated 3 and 4), which may reflect schools strategy of exchanging higher educated but
lower performance teachers by newer teachers, who perform better despite the lower schooling.
Table 11 – Mean score on ENEM by condition of exposure to negative treatment
Math Portuguese
2009 2015
∆ Mean 2009 2015
∆ Mean Treatment Mean SD Mean SD Mean SD Mean SD
Teachers with higher education
Control 479.0 (81.0) 454.4 (87.0) -24.7 480.7 (90.2) 493.3 (66.2) 12.6
Treated 1 474.6 (78.1) 448.3 (85.1) -26.3 477.8 (88.5) 488.2 (65.1) 10.4
Treated 2 472.9 (75.0) 445.0 (81.6) -27.9 475.8 (91.4) 486.5 (67.7) 10.7
Treated 3 466.5 (74.4) 440.1 (78.3) -26.4 468.7 (87.3) 481.1 (64.4) 12.4
Treated 1,2,3 473.1 (76.7) 446.3 (83.2) -26.8 475.8 (89.4) 486.6 (66.0) 10.8
Treated 2,3 471.4 (74.9) 443.9 (80.8) -27.5 473.8 (90.4) 485.1 (66.9) 11.3
Teachers with higher education in the field
Control 481.8 (82.6) 457.5 (89.0) -24.3 487.1 (90.6) 498.4 (65.8) 11.3
Treated 1 479.4 (80.3) 454.9 (87.4) -24.5 487.4 (89.3) 496.6 (65.2) 9.2
Treated 2 478.1 (79.3) 452.6 (84.8) -25.4 486.2 (91.1) 496.6 (65.7) 10.4
Treated 3 471.1 (75.6) 446.7 (81.3) -24.4 480.8 (89.0) 492.4 (65.7) 11.6
Treated 4 475.9 (86.8) 446.6 (81.1) -29.3 467.5 (87.1) 487.5 (64.6) 19.9
Treated 1,2,3,4 477.4 (79.7) 452.4 (85.3) -25.0 482.8 (89.7) 494.5 (65.5) 11.7
Treated 2,3,4 475.7 (79.2) 450.3 (83.5) -25.4 480.5 (89.9) 493.5 (65.6) 13.0
Note. Students in the 3rd year of public regular secondary school that participate in ENEM in the years 2009 or 2015. Source. ENEM, 2009 and 2015, microdata.
5. Causal inference strategy
What effect did the growth in higher education schooling of upper secondary school teachers have
on students learning? One way to answer this question would be to compare the performance of the
students in schools with high percentage of teachers with a degree (treated group) with the performance in
schools that did not raise this percentage (comparison group). The main challenge we confront by doing
this, however, is to address the problem of selection bias that may affect the estimation of this effect. This
bias occurs when schools with certain characteristics, like the presence of more motivated and intelligent
students, which have higher chances to achieve higher performance, are the most attractive ones for
teacher with higher education. This entails in an overestimation of the treatment effects due to reverse
causality.13
Be enrolled in treated schools implies better students performance? Or characteristics related
to the performance of students imply more treatment schools?
In this sense, it is necessary to compare the performance of treated schools with a group of schools
that have similar chances to be treated, even if they were not. We do this by applying difference-in-
difference estimation on matched samples obtained by propensity score matching, which allows us to
control for several observed and unobserved school characteristics that may contribute to selection bias.
Adapted from Cameron and Trivedi (2005), in a model of differences-in-differences, considering a school
panel of two periods, the ATT can be obtained from the parameter in equation (1):
(1)
where: Yist is the achievement of the student i who attended school s in period t, with t = 0 for the pre-
treatment period and t = 1 for the post-treatment period; Ds indicates treatment condition of the school s,
13
It is expected that better schools attract or select higher performance teachers. As an example, Hanushek et al (2004) find that teachers in Texas tend to move to schools with more proficient students, especially the more experienced ones, who often have the option of going through districts and choose the school within the district in which they teach. Thus, it is necessary to isolate the characteristics of students and schools in order to guarantee that the odds of attracting/retaining teachers with higher education are similar for both treatment and control schools. In this sense, the treatment status between schools with same characteristics would be random (conditional independence assumption).

13
with Ds = 1 if the school has been treated and Ds = 0 otherwise; Xit and Wst are vectors of covariates
(students and schools observable characteristics); 0, 1, , and are parameters and and λ are vectors
of parameters to be estimated; and ɛist = cs + uist where cs denotes the error component related to the
unobservable characteristics that are constant in time of school s; and uist is an error term.
Note that is basically the dif-in-dif estimator computed in a regression of stacked students for
schools and years, which implicitly assumes constant treatment effect for schools. In order to eliminate
the error in the estimation of ATT from specific characteristics of schools that are constant in the time, the
parameters of the equation (1) are measured by fixed effects estimators with clustered standard errors.
Besides, as almost all the high public schools in the state are managed by the state government, it is added
to the linear trend model dummy variables for each state to control for changes in the state education
policies. Considering these policies vary widely among States, the omission of these trends could result in
a substantial bias in estimating the impact of characteristics of teachers and other school variables.14
Dif-in-dif assumes that in the absence of treatment the original difference between treated units
and comparison schools in the outcome remain constant over time. That is, consider the potential outcome
of a school s in time t like and
, where the subscript 1 indicates the result under the treatment and
the subscript 0 indicates the result in absence of treatment. Thus, this assumption implies that:
.
Therefore, under the condition that the treatment effect could be estimated as the
difference of the difference in outcome in time of treated and non-treated schools, that is:
.
The model of equation 1 controls for several characteristics of schools and students and for non-
observed differences between schools by assuming that they are fixed in time. However, as we have only
one year of pre-treatment data, it is not possible to verify if the difference in outcome between treated and
comparison schools followed a constant trend over pre-treatment time. Thus, given the substantial pre-
existent differences between treated and non-treated schools characteristics that may affect the outcomes,
instead of relying solely on this model, we used a matching strategy to non-parametrically control any
remaining differences between the two groups in the pre-treatment period (see Heckman et al. 1997,
1998). Specifically, we use propensity score matching methods to attribute weights to non-treated schools
in a way that they mimic the counterfactual of the treated schools.15
To define a subsample not treated sufficiently similar to the sample treated in terms of covariates
normally the following protocol applies (Becker and Ichino, 2002). First, get the propensity scores of
treatment of treated and untreated units, from estimating of by a logit or probit model and
select observations in common support. Then determine weight for each control unit in common support
based on its proximity to a treated unit, which can be done by alternative methods.16
Then test whether
the null hypothesis that the means of control and treatment groups covariates are equal (balancing
property). If null hypothesis is not rejected, use the weighted sub-sample in common support to estimate
the ATT. In the end, it is expected that the estimated propensity scores densities are overlapping, what
indicates the two groups of schools in the common support present similar pre-treatment characteristics. 14
Another assumption required by dif-in-dif is that the group composition does not change after the intervention, which is a minor concern once we restricted the sample of schools only to those present in both “pre” and “post” treatment years.). 15
Rosenbaum and Rubin (1983) demonstrate that the validity of the above strategy depends on two assumptions. The first, selection on observables assumption, states that the potential outcomes are independent of exposure to treatment when conditioning by a set of observable features, that is,
, where is a vector of variables capable of explaining
the exposure to treatment. The second, common support assumption, states that there are no observations where the researcher knows for sure if the unit has been treated or not by observing only the covariates, that is, . 16
Nearest-neighbor method can imply that for a treated unit the propensity scores reported by its controls is too far apart, which affect the quality of the matching. Radius method circumvents this problem by imposing a condition of maximum distance between the scores of treated and control units, but if the distance chosen is too small, it is possible that some units not find control units. In Kernel method, the closer the score of the control unit is from a treated one, the larger weight is given to it. The choice of the matching method implies a trade-off between size and quality of the matching sample, so the joint application of the methods is recommended in order to assess the robustness of ATT estimates.
14
In summary, to measure the effects of teacher education on the performance of schools, we first
match the schools based on propensity scores, obtained by estimating a logit model of ex ante probability
to be treated. Then, we apply, as a benchmark, the method of Radius matching, with maximum distance
(radius) of 0.01. Then, the parameters of the equation (1) are measured by fixed effects estimators on
school level. To evaluate the sensitivity of the results to the matching method, the ATT is also estimated
on the matched sample by Kernel method (bandwidth calculated by Silverman rule). The procedures
discussed here will apply to public upper secondary schools, observed at years 2009 and 2015.
The implementation of this strategy requires that exposure to treatment be characterized by binary
variables. We have already defined them as the three (or four) dummy variables constructed from the
percentiles of the teachers’ education indicators in the previous section. Such characterization allows the
estimation of effects for different degrees of exposure to the treatment, with a sufficiently large number of
schools in each of the n treated groups and a higher number of schools in the control group.
6. Results
In order to provide a basis of comparison for the causal inference strategy, Table A1 in the
Appendix shows the results of the fixed effects regressions of the students scores on the percentage of
classes taught by teachers with higher education and by teachers with higher education in the field,
controlling by a set of students and schools characteristics. The coefficients related to these two
explanatory variables were statistically significant only for Students Portuguese scores.
Although statistically significant, the magnitude of the coefficients our two explanatory variables
imply in very low effects, when compared to the magnitude of other variables that may affect Students
scores. For example, if the schools in 5th percentile (as presented in Table 8 of the Descriptive Analysis
section) increased the Percentages of Classes Taught by Teachers with Higher Education and by Teachers
with Higher Education in Portuguese to 100% we would expect an increase of only 1.5 and 2.4 points in
Portuguese scores, respectively, less than 0.03 standard deviations from the year 2009’s mean.
The estimated coefficients suggest strong positive effects on students’ scores from the following
attributes: mother’s education, presence of computer and Internet access at home, and having attended
private primary education. Having a car at home (proxy for income) is positively correlated to math
scores but negatively correlated to Portuguese scores. Having worked or being working is negatively
correlated and having attended evening classes during secondary school is highly negatively correlated to
students’ math and Portuguese scores. Students’ access to the Internet at home is positively correlated
with performance in the exam. Also, a higher proportion of female students in school positively affects
Portuguese scores and negatively affects math scores, the duration of classes is positively correlated with
students’ math scores and the class size is negatively correlated with Portuguese scores, and the school
infrastructure indicator did not capture any effect. Finally, the addition the participation rate in ENEM
and the number of secondary school classes does not affect the results for the explanatory variables. In
fact, the participation rate in the ENEM is negatively correlated to the Portuguese scores, which may
indicate the presence of self-selection in the exam, as explained below.
The use of ENEM scores as output indicator may present a selection bias problem, since student
enrollment is voluntary and the worst students have less incentive to participate in the exam. Thus, worst
schools are expected to have lower participation rates in the exam. On the other hand, a low participation
rate may result from a deliberate action by the school administration to encourage only best students (or
discourage worst) from attending the exam, which may artificially raise the school's average grade. To
verify the sensitivity of the results in relation to this potential selection bias problem, we re-estimate the
fixed effects regressions for a restricted sample, which excludes schools whose participation rates in 2009
were below the median of the distribution.17
After carrying out the estimation, the coefficients for our two
explanatory variables related to teachers education become statistically non-significant also for
Portuguese scores, and do not change significantly the estimated coefficients of the other covariates.18
17
MEC established a minimum participation rate in ENEM of 50% of the students for a school to have its results reported. As this filter would restrict the sample size to only 1,907 schools, we chose to restrict the sample of schools based on the median of the 2009’s participation rate distribution, which was 33.3%, which resulted in 5,349 schools remained in the base. 18
Output for restricted sample estimation provided upon request.

15
As we have seen in last section the validity of such estimates can be compromised by the presence
of teachers selection bias, since chances to be employed in better schools are higher for those teachers
with higher education. To deal with this problem, following the strategy of propensity score matching, we
first estimate logit models of probability of treatment on a set of pre-treatment schools characteristics for
each of the binary treatment variables defined in Section 4. The set of covariates used in this model and
the criteria for their inclusion can be seen in Table 13.
Table 13 – Covariates of the logit model of ex ante probability to be treated
Variable Description Justification
Metropolitan Area
Dummy for school located in metropolitan area
Controls for the effects of
the attractiveness of the
municipality.
Population
Natural logarithm of the population of schools municipality.
Per capita income
Per capita income of schools municipality population.
University campus
Dummy for university campus in the municipality.
Controls for the effects of
the offer of higher education
in municipality.
University centre campus
Dummy for university centre campus in the municipality.
College campus
Dummy for college campus in the municipality.
Federal School
Dummy for Federal Secondary School.
Control for schools
infrastructure that may
affect the admission of
teachers with better
education.
Public water network
Dummy for school connected to public water network.
Public sewerage system
Dummy for school connected to public sewerage system.
Science lab
Dummy for school that has science lab.
Computer lab
Dummy for school that has computer lab.
Library
Dummy for school that has library.
Internet connection
Dummy for school that has internet connection.
Sports court
Dummy for school that has sports court.
High School students
Natural logarithm of the number of students in high school.
High School classes
Number of high school classes.
Age-grade distortion
Age-grade distortion of 1st grade high schools students.
Control for the influence of
the teaching effort on the
school's chances of
attracting teachers.
Class size
Average number of students per class.
Class hours
Average number of hours of tuition.
Evening classes
% of students studying at evening classes .
Female
% female students.
Control for students and
families socioeconomic
status, which may influence
teachers’ decisions.
Black
% black students.
Mother low schooling
% students whose mother schooling is bellow the elementary.
Car
% students whose family own a car (proxy for family income).
We then apply the Radius matching method to generate weights for the schools, in order to
guarantee that an appropriate (that attend to both selection on observables and common support
assumptions) matching between treated and control schools. Once paired the samples for all treatment
conditions, differences in means between control and treatment groups of all covariates become
statistically non significant, which support the validity of selection on observables assumption. Also, for
all paired samples the estimated propensity scores densities are overlapping, which indicates that the
schools in the common support present similar pre-treatment characteristics (balancing property).19
Table 14 presents a summary of the Treatment Effect on Treated Schools, estimated from
Equation (1) controlling by the same set of student and school characteristics considered in previous
regressions, for both no-matched and matched samples.20
The coefficients for the no-matched sample
[column (1)] are positive and statistically significant only for the schools that experienced the greatest
increase in percentage of Portuguese classes taught by teachers with higher education (Treated 3) and
with Higher Education in Portuguese (Treated 4). However, for matched samples [Columns (2) and (3)],
the first coefficient becomes statistically non-significant and the coefficient of Treated 3 related to Higher
Education in Portuguese becomes statistically significant at 10% of significance.
Thus, the initial results indicate that the only change in teachers’ education indicators capable of
affecting students’ scores was that related to the increase in Percentage of Portuguese Classes Taught by
Teachers with Higher Education in Portuguese, especially among the schools that had the highest
increases (Treaded 4). For these schools, whose indicator was below 43% [or 20.1%, on average] in the
19
Full logit regressions outputs, tables containing mean comparisons between groups for all covariates, and graphics of the densities are provided upon request. 20
Full regression outputs provided upon request.

16
year 2009 and has risen above 94% [or 99.9%, on average] in the year 2015, the estimated ATT is
between 6.9 and 7.5 points in Portuguese exam, what implies in an mean increase between 0.086 and
0.094 points for every 1 percentage point increase in teachers education indicator. This estimated effect is
about 3 times the one previously estimated in the regressions without characterizing the treatment from
binary variables, which considers all schools [see Table 13, Columns (10) to (12)].
Table 14 – Estimates of Treatment Effects on Mathematics and Portuguese Scores
Teachers education
Treatment group
All schools Participation restriction on schools No
matching Radius
matching Kernel
matching No
matching Radius
matching Kernel
matching (1) (2) (3) (4) (5) (6)
Math scores
Higher education
Treated1 1.496 2.386 2.454 -1.082 -0.568 -0.620
Treated 2 1.116 1.684 1.672 1.215 0.057 0.684
Treated 3 0.731 0.838 1.692 3.716 4.148 5.185*
Treated 2,3 0.368 1.146 1.395 3.653* 4.533** 4.191*
Treated 1,2,3 0.602 0.970 1.141 1.780 2.371 2.336
Higher education in
Math
Treated 1 0.033 -0.442 -0.349 -0.352 -0.217 -0.251
Treated 2 -0.048 0.289 0.390 -0.283 0.101 0.236
Treated 3 0.277 -0.177 -0.106 -2.688 -1.682 -1.285
Treated 4 -0.302 1.398 1.375 2.065 2.658 3.088
Treated 2,3,4 -0.471 0.710 0.640 0.0639 0.426 0.146
Treated 1,2,3,4 0.0670 0.628 0.614 0.648 0.886 0.793
Portuguese scores
Higher education
Treated 1 0.808 -0.403 -0.385 1.358 1.005 0.932
Treated 2 1.633 0.359 0.385 1.725 1.652 1.666
Treated 3 5.017** 2.066 2.114 4.365 4.044 4.185
Treated 2,3 2.533 0.707 0.672 1.391 1.099 0.967
Treated 1,2,3 1.831 0.307 0.545 2.321 1.324 1.212
Higher education in Portuguese
Treated 1 2.909 2.972 2.357 1.917 1.651 1.745
Treated 2 -1.189 -0.882 -1.433 0.211 -0.601 -0.836
Treated 3 3.544 4.543* 4.367* 2.483 2.335 1.805
Treated 4 7.598*** 7.529*** 6.908** 7.221** 3.980 4.275
Treated 2,3,4 1.778 2.643 2.595 2.302 1.189 1.442
Treated 1,2,3,4 1.724 2.736* 2.506 2.583 1.947 2.047
Note. School level Fixed Effects Model with linear trends by UF (omitted). Covariates were omitted. Cluster-robust standard errors in parentheses. *Statistically significant at 10% significance level. **Statistically significant at 5% significance level. ***Statistically significant at 1% significance level.
Again, in order to verify the robustness of the results in relation to the presence in the sample of
schools with low student participation rates in ENEM, we re-estimate the model for the restricted sample,
which excludes schools whose participation rate in 2009 was below the median of the distribution. As we
can see, the estimated coefficients for non-matched sample are all statistically non-significant, with the
exception of the coefficients for Treated 2,3 related to the effect of the increase in the Teachers Higher
Education on math scores and for Treated 4 related to the effect of the increase in the Teachers Higher
Education in Portuguese on Portuguese scores.
In regressions on paired samples [Columns (5) and (6)], however, the only coefficients that
remains statistically significant are those for Treated 2,3 related to the effect of the increase in the
Teachers Higher Education on math scores, and the coefficient of Treated 3 related to the effect of the
increase in the Teacher Higher Education on math scores becomes statistically significant at 10%
significance for the sample matched by the Kernel method. In special, the coefficients related to Higher
Education in Portuguese on Portuguese scores become all statistically non-significant.
In summary, the results indicate that the increase in Teacher Higher Education in Portuguese that
occurred in Treated 3 and Treated 4 schools (most intensively treated schools) may have positively
affected students’ Portuguese scores, but that this result is not robust to schools participation restriction
on ENEM. Also, the increase in Teacher Higher Education seems to have positively affected students’
math scores of Treated 2,3 schools (those whose indicator was below 73.3% in 2009 and raised above

17
87.5% in 2015). For these schools, whose indicator was below 73.3% [or 45.8%, on average] in the year
2009 and has risen above 87.5% [or 99.2%, on average] in the year 2015, the estimated ATT is between
4.2 and 4.5 points in math exam, what implies in an mean increase between 0.079 and 0.084 points for
every 1 percentage point in Percentage of Math Classes Taught by Teachers with Higher Education.
Table 15 presents a summary of the so called negative Treatment Effect, also estimated from
Equation (1) controlling by the same set of characteristic for both whole sample and matched samples.
Again, the estimated results on the paired samples are statistically non-significant, except for the effect on
Portuguese scores of school in Treatment group 2 in relation to the Percentage of Portuguese Classes
Taught by Teachers with Higher Education in Portuguese, whose coefficient is positive and significant at
10% significance only when considering the sample matched by Radius method.
Table 15 – Estimates of Negative Treatment Effects on Mathematics and Portuguese Scores
Teachers education
Treatment group
All schools Participation restriction on schools No
matching Radius
matching Kernel
matching No
matching Radius
matching Kernel
matching (1) (2) (3) (4) (5) (6)
Math scores
Higher education
Treated 1 -2.025 -1.400 -1.427 1.740 1.719 1.943
Treated 2 -1.078 -0.539 -0.713 -0.625 -0.436 -0.397
Treated 3 2.305 2.539 2.211 3.053 4.491 4.342
Treated 2,3 0.770 0.566 0.609 1.026 0.634 0.660
Treated 1,2,3 -0.835 -0.163 -0.102 0.492 1.026 0.891
Higher education in
Math
Treated 1 -1.135 -1.635 -1.557 0.495 0.213 0.219
Treated 2 -0.732 -0.439 -0.508 0.371 0.628 0.663
Treated 3 0.594 1.891 1.786 0.465 1.798 1.899
Treated 4 -2.893 -2.424 -2.254 1.251 1.074 0.690
Treated 2,3,4 0.121 0.786 0.791 1.276 1.760 1.712
Treated 1,2,3,4 -0.483 -0.487 -0.533 1.211 1.148 1.225
Portuguese scores
Higher education
Treated 1 -0.0589 0.295 0.0774 0.894 1.324 1.181
Treated 2 1.019 0.129 -0.0246 2.362 2.961 2.773
Treated 3 0.732 0.166 0.563 3.774 1.229 1.254
Treated 2,3 0.128 -1.100 -1.049 4.026 2.037 2.016
Treated 1,2,3 0.378 -0.650 -0.605 4.244** 3.630* 3.523*
Higher education in Portuguese
Treated 1 -2.463* -1.198 -1.251 -2.070 -2.225 -1.714
Treated 2 1.661 2.398* 2.079 0.359 0.686 0.763
Treated 3 0.0466 -0.303 -0.387 1.544 1.498 1.840
Treated 4 4.105** 1.246 2.310 3.090 2.542 2.011
Treated 2,3,4 1.008 0.292 0.274 0.233 -0.227 -0.375
Treated 1,2,3,4 -0.136 -0.0840 -0.355 -0.123 -0.595 -0.537
Note. School level Fixed Effects Model with linear trends by UF (omitted). Covariates were omitted. Cluster-robust standard errors in parentheses. *Statistically significant at 10% significance level. **Statistically significant at 5% significance level. ***Statistically significant at 1% significance level.
After restricting the sample by participation in ENEM exam, the only statistically significant
coefficients are those related to the effect of the decrease in Teacher Higher Education on Treated 1,2,3
schools scores in Portuguese (schools whose indicator was above 72.7% in 2009 and dropped to below
72.7% in 2015). These schools seem to have benefited from the reduction in the percentage of higher
educated teachers in the period, which may reflect a strategy of exchanging higher educated but lower
performance teachers by newer teachers, who perform better despite the lower schooling.
The results do not allow us to reject the null hypothesis of no effect on Portuguese scores, and
despite the statistically significant positive effects on math scores from the increase in percentage of math
classes taught by teachers with higher education, we find no statistically significant effect from teachers
with higher education in math. The lack of effect on Portuguese scores is consistent with the several
studies that find no correlation between teachers education and student learning (Hanushek and Rivkin
(2006), Harris and Sass (2011)), and the positive effect on math scores partly contradicts the findings of

18
Wayne and Youngs (2003), that reports that upper secondary school students learn more math only when
their teachers have higher training in mathematics, and no effect in relation to other areas of knowledge.
7. Conclusions
There are only few rigorous studies that relates teachers educational background and training to
the students' performance. Given the total amount of public and private investments to provide higher
education training and the central role of teachers in student learning, understanding the relations between
pre-service training and teachers’ quality is essential to shed light on the changes capable of reversing the
learning crisis in Brazil. The present study aimed at contributing to fill this gap in applied research.
We estimated the ATT effect of the change in the percentage of secondary school classes taught
by teachers with higher education and with higher education degree in the field on the achievement in
math and Portuguese of 12 graders students of public schools at ENEM, through a combination of
differences-in-differences and propensity score matching methodologies. In summary, we find no
evidence of positive effects on Portuguese scores, and despite the statistically significant positive effect of
the rise in teachers with higher education on math scores, we find no effect from specific math training.
The incapacity of teacher education to influence students learning can have diverse origins. First,
the quality of the teacher may be mostly determined by characteristics other than pre-service training,
such as school performance records and innate skills. In this sense, the admission of weak educational
background individuals in pre-service training could explain the absence of impact on the quality of the
teaching. This seems consistent with the fact that tertiary teacher training courses are among the easiest
ones to access in Brazil. Low competition to enroll in these courses reflects the low attractiveness to
higher performance graduates of basic education.
A second explanation is based on the idea that lack of effect may be due to the inadequacy and/or
poor quality of teacher training programs themselves, assuming that teacher quality is a function of pre-
service training.21
In this regard, Wayne and Youngs (2003) and Rice (2003) find positive effects of the
quality of teachers’ pre-service education on students learning. Section 2 shed some light on the issue for
Brazilian case, where there was a significant change in the profile of teacher training courses, with the
rapid expansion of distance learning and other recent changes in the higher education provision structure.
Our results point to a fragility in the training of teachers in the field of both math and Portuguese.
It is likely that licenciatura courses are failing to compensate for the learning deficits accumulated by
their graduates during basic education. It is also possible that the incorporation of bachelor degree holders
with stronger knowledge in these fields may contribute to raise the quality of upper secondary education.
In this regard, the pedagogical supplementation certification may contribute to raise quality of teaching.
However, the percentage of these certified teachers from 11.4% to 3.3% between 2011 and 2015 and only
1.2% of math classes and 0.6% of Portuguese classes in public upper secondary education were taught by
those teachers in 2015. This low share may be due to a lack of supply in pedagogical supplementation
certification courses, the excessive increase of required duration for certification, selection barriers in the
official exams, or simply the absence of interest of bachelor degree holders in joining teaching career.
The convergence of teacher wages of public upper secondary school towards the average wages
received by other professionals with higher education degree and the reform of the national basic
education core curriculum may influence professionals with non-education degree to join teaching career
and the universities to change their pre-service curriculums. Incentives could be created to promote both
changes through: (i) a reduction of the duration of pedagogical supplementation for a specialization of
360h to allow join the public system top performance professionals with higher education (it requires a
change in the resolution of the CNE); (ii) promoting colleges or universities to restructure their
curriculum of licenciatura degrees in accordance with the new national core curriculum through
requirements in students loans in private institutions and scholarship programs in public universities.
It is still necessary, however, to deepen the analysis in search of understanding the reasons of low
effectiveness of training teachers in leveraging learning of students from public schools.
21
An extensive analysis on the key issues involving Teachers quality in Latin American and Caribbean countries can be seen in Bruns and Luque (2015).

19
References
Becker, S. O., & Ichino, A. (2002). Estimation of average treatment effects based on propensity scores.
The stata journal, 2(4), 358-377.
Bruns, B.; Evans, D.; Luque, J. (2011). Achieving world-class education in Brazil. World Bank
Publications.
Bruns, B.; Luque, J. (2015). Great teachers: How to raise student learning in Latin America and the
Caribbean. World Bank Publications.
Cameron, A. C.; Trivedi, P. K. (2005). Microeconometrics: methods and applications. Cambridge
university press.
Carnoy, M., Gove, A. K., & Marshall, J. H. (2007). Cuba's academic advantage: Why students in Cuba do
better in school. Stanford University Press.
Farr, S. (2010). Teaching as Leadership: The Highly Effective Teacher’s Guide to Closing the
Achievement Gap. Hoboken, NJ: John Wiley and Sons
Feng, L. (2009). Opportunity wages, classroom characteristics, and teacher mobility. Southern Economic
Journal, 1165-1190.
Goldhaber, D. D., & Brewer, D. J. (2000). Does teacher certification matter? Secondary school teacher
certification status and student achievement. Educational evaluation and policy analysis, 22(2).
Hanushek, E.A. (2003). The failure of input-based schooling policies. Economic Journal 113 (485), F64–
F98.
Hanushek, E. A.; Rivkin, S. G. (2004). How to Improve the Supply of High Quality Teachers.
(Brookings Papers on Education Policy, 2004). Washington, DC: Brookings Institution.
Hanushek, E. A.; Rivkin, S. G. (2006). Teacher Quality, In Handbook of the Economics of Education,
Volume 2 Edited by Eric A. Hanushek and Finis Welch, 2006, Elsevier B.V.
Hanushek, E. A.; Rivkin, S. G. (2010). Generalizations About Using Value Added Measures of Teacher
Quality. American Economic Review100(2): 267–71.
Harris D., Sass T. (2011). Teacher training, teacher quality and student achievement. Journal of Public
Economics, 95(7), 798–812.
Heckman, J. J.; Ichimura, H.; Todd, P. (1998). Matching as an econometric evaluation estimator. The
Review of Economic Studies, 65(2): 261–294.
Hill, H. C.; Rowan, B.; Ball, D. L. (2005). Effects of teachers’ mathematical knowledge for teaching on
student achievement. American educational research journal, v. 42, n. 2, p. 371-406.
Khandker, S. R.; Koolwal, G. B.; Samad, H. A. (2010). Handbook on impact evaluation: quantitative
methods and practices. World Bank Publications.
Loeb, S.; Page, M. (2000). Examining the link between teacher wages and student outcomes: The
importance of alternative labor market opportunities and non-pecuniary variation. Review of
Economics and Statistics, 82(3), 393-408.
Louzano, P.; Rocha, V.; Moriconi, G. M.; Portela, R.. Quem quer ser professor? Atratividade, seleção e
formação docente no Brasil. Estudos em Avaliação Educacional (Impresso), v. 21, p. 543-568, 2010.
Menezes Filho, N. (2007), Os Determinantes do Desempenho Escolar no Brasil, Instituto Futuro
Brasil/IBMEC, São Paulo.
Rice, J. K. (2003). Teacher quality: Understanding the effectiveness of teacher attributes. Economic
Policy Institute, 1660 L Street, NW, Suite 1200, Washington, DC 20035.
Rosenbaum, Paul R.; Rubin, Donald B. (1983). The central role of the propensity score in observational
studies for causal effects. Biometrika, 70(1):41–55.
Wayne, A. J.; Youngs, P. (2003). Teacher Characteristics and Student Achievement Gains: A Review.
Review of Educational Research, Spring 2003, Vol. 73, No. 1, pp. 89–122.
World Bank (2001). Brazil - Teachers development and incentives - a strategic framework (English).
Washington, DC: World Bank.
World Bank (2005). Incentives to improve teaching: lessons from Latin America / Emiliana Vegas,
editor.
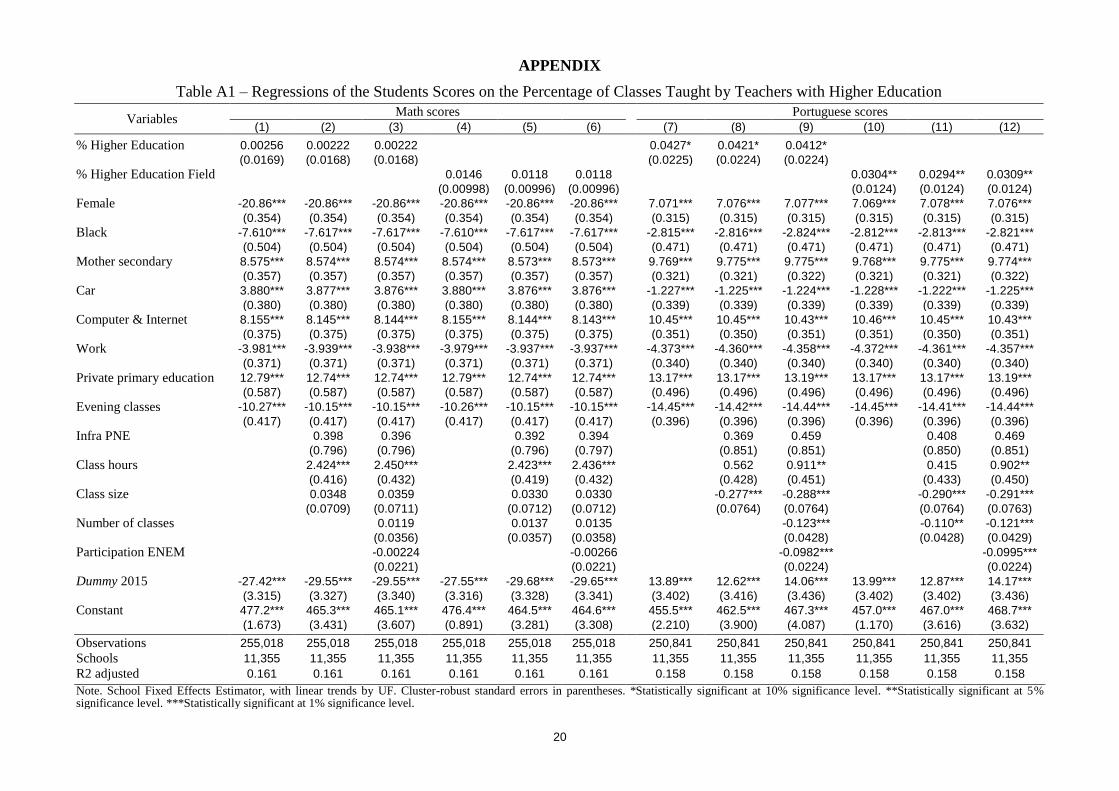
20
APPENDIX
Table A1 – Regressions of the Students Scores on the Percentage of Classes Taught by Teachers with Higher Education
Variables Math scores Portuguese scores
(1) (2) (3) (4) (5) (6)
(7) (8) (9) (10) (11) (12)
% Higher Education 0.00256 0.00222 0.00222 0.0427* 0.0421* 0.0412*
(0.0169) (0.0168) (0.0168) (0.0225) (0.0224) (0.0224)
% Higher Education Field
0.0146 0.0118 0.0118
0.0304** 0.0294** 0.0309**
(0.00998) (0.00996) (0.00996)
(0.0124) (0.0124) (0.0124)
Female -20.86*** -20.86*** -20.86*** -20.86*** -20.86*** -20.86*** 7.071*** 7.076*** 7.077*** 7.069*** 7.078*** 7.076***
(0.354) (0.354) (0.354) (0.354) (0.354) (0.354) (0.315) (0.315) (0.315) (0.315) (0.315) (0.315)
Black -7.610*** -7.617*** -7.617*** -7.610*** -7.617*** -7.617*** -2.815*** -2.816*** -2.824*** -2.812*** -2.813*** -2.821***
(0.504) (0.504) (0.504) (0.504) (0.504) (0.504) (0.471) (0.471) (0.471) (0.471) (0.471) (0.471)
Mother secondary 8.575*** 8.574*** 8.574*** 8.574*** 8.573*** 8.573*** 9.769*** 9.775*** 9.775*** 9.768*** 9.775*** 9.774***
(0.357) (0.357) (0.357) (0.357) (0.357) (0.357) (0.321) (0.321) (0.322) (0.321) (0.321) (0.322)
Car 3.880*** 3.877*** 3.876*** 3.880*** 3.876*** 3.876*** -1.227*** -1.225*** -1.224*** -1.228*** -1.222*** -1.225***
(0.380) (0.380) (0.380) (0.380) (0.380) (0.380) (0.339) (0.339) (0.339) (0.339) (0.339) (0.339)
Computer & Internet 8.155*** 8.145*** 8.144*** 8.155*** 8.144*** 8.143*** 10.45*** 10.45*** 10.43*** 10.46*** 10.45*** 10.43***
(0.375) (0.375) (0.375) (0.375) (0.375) (0.375) (0.351) (0.350) (0.351) (0.351) (0.350) (0.351)
Work -3.981*** -3.939*** -3.938*** -3.979*** -3.937*** -3.937*** -4.373*** -4.360*** -4.358*** -4.372*** -4.361*** -4.357***
(0.371) (0.371) (0.371) (0.371) (0.371) (0.371) (0.340) (0.340) (0.340) (0.340) (0.340) (0.340)
Private primary education 12.79*** 12.74*** 12.74*** 12.79*** 12.74*** 12.74*** 13.17*** 13.17*** 13.19*** 13.17*** 13.17*** 13.19***
(0.587) (0.587) (0.587) (0.587) (0.587) (0.587) (0.496) (0.496) (0.496) (0.496) (0.496) (0.496)
Evening classes -10.27*** -10.15*** -10.15*** -10.26*** -10.15*** -10.15*** -14.45*** -14.42*** -14.44*** -14.45*** -14.41*** -14.44***
(0.417) (0.417) (0.417) (0.417) (0.417) (0.417) (0.396) (0.396) (0.396) (0.396) (0.396) (0.396)
Infra PNE
0.398 0.396 0.392 0.394
0.369 0.459 0.408 0.469
(0.796) (0.796) (0.796) (0.797)
(0.851) (0.851) (0.850) (0.851)
Class hours
2.424*** 2.450*** 2.423*** 2.436***
0.562 0.911** 0.415 0.902**
(0.416) (0.432) (0.419) (0.432)
(0.428) (0.451) (0.433) (0.450)
Class size
0.0348 0.0359 0.0330 0.0330
-0.277*** -0.288*** -0.290*** -0.291***
(0.0709) (0.0711) (0.0712) (0.0712)
(0.0764) (0.0764) (0.0764) (0.0763)
Number of classes
0.0119 0.0137 0.0135
-0.123*** -0.110** -0.121***
(0.0356) (0.0357) (0.0358)
(0.0428) (0.0428) (0.0429)
Participation ENEM
-0.00224 -0.00266
-0.0982*** -0.0995***
(0.0221) (0.0221)
(0.0224) (0.0224)
Dummy 2015 -27.42*** -29.55*** -29.55*** -27.55*** -29.68*** -29.65*** 13.89*** 12.62*** 14.06*** 13.99*** 12.87*** 14.17***
(3.315) (3.327) (3.340) (3.316) (3.328) (3.341) (3.402) (3.416) (3.436) (3.402) (3.402) (3.436)
Constant 477.2*** 465.3*** 465.1*** 476.4*** 464.5*** 464.6*** 455.5*** 462.5*** 467.3*** 457.0*** 467.0*** 468.7***
(1.673) (3.431) (3.607) (0.891) (3.281) (3.308) (2.210) (3.900) (4.087) (1.170) (3.616) (3.632)
Observations 255,018 255,018 255,018 255,018 255,018 255,018 250,841 250,841 250,841 250,841 250,841 250,841
Schools 11,355 11,355 11,355 11,355 11,355 11,355 11,355 11,355 11,355 11,355 11,355 11,355
R2 adjusted 0.161 0.161 0.161 0.161 0.161 0.161 0.158 0.158 0.158 0.158 0.158 0.158
Note. School Fixed Effects Estimator, with linear trends by UF. Cluster-robust standard errors in parentheses. *Statistically significant at 10% significance level. **Statistically significant at 5% significance level. ***Statistically significant at 1% significance level.