res paper nc'254 productivity - northern research station
TRANSCRIPT

Agri©tiltureU:i::dmSt:nt_):f Fe//er/ unchers.
,_i_e in PlantationNorth Central
stF°atrestExperiment Thinnings:ResearchPaper NC'254
_- 1__ actors Affecti ngProductivity
, Sharon A. Winsauer, James A. Mattson, and Michael A. Thompson

North Central Forest Experiment StationForest Service--U.S. Department of Agriculture
1992 Folwell AvenueSt. Paul, Minnesota 55108
Manuscript approved for publication May 9, 1984December 1984

CONTENTS
PageStand Characteristics ............................................. 1Operational Factors ............................................... 4Machine Characteristics .......................................... 11Conclusions ...................................................... 14Literature Cited ................................................. 15

FELLER/BUNCHERS IN PLANTATION THINNINGS:FACTORS AFFECTING PRODUCTIVITY
Sharon A. Wltmzuet, Mathematician,
Jame$ A. Matt_n, Pn'_ Mechanical Engineer,
and Michael _ ThomlN_n , Associate Engineer,
Houghton, MicN'gan
Closely spaced plantations must be thinned early These variables were used as input to the simula-for optimal tree growth, but removing small trees is tion. For each variable we chose a range of valuesco'stly.Harvest costs can be lowered by using highly representative of existing equipment and stands.•productivemachines,suchasfeller/bunchers.Toiden- Withinthis range, we chosea typical valueto be used
. tify possibleareasfor improving designand operation as a standard. Comparison of the model outputof feller/bunchers, we used computer simulation to values--productivity,elemental time, travel distance,study the sensitivity of harvesting productivity to andbunch size--formed the basis of the analysis.
•machineandstandcharacteristics.
Twobasic feller/buncher designs were studied:the STAND CHARACI'lf, RISTICSchassis-mountedand boom-mountedshear types. Afeller/buneher with a chassis-mounted shear must We limited our investigation to small-diameter
' drive to each tree and accurately positionthe shear plantationsof equally spaced softwoods(table 1).Wehead. In c0ntrast, a feller/buncher with a boom- decided not to emphasize a particularspecies but to
considera generalized"softwood."Height anddensitymounted shear can reach several trees from onelocation,thus reducing machine travel in the stand, values were fixed at representative values, and theBecause of these operational differences, we usedseparate simulation models for each machine type Table 1.--Init/a/stand clmr_tics
-(Winsauer 1980, Winsauer and Bradley 1982). Themodels were written in the simulation languageGPSS, GeneralPurpose SimulationSystem. Thecorn- Auumptionsputer runs were made on the UNIVAC 1100/80 Species Softwood(generalized)liousedat MichiganTechnologicalUniversity,Hough- Stand structure Plantation--squarespacingstonlMichigan. Terrain Flat
• . Striplength 100mThevariables we consideredin this investigation Treevolume(m3) 0.021.0.00048 x d.b.h.2(cm)
were: (ft 3) 0.73 +0.109x d.b.h.2(in.)1. Standcharacteristics: Treeheight (m) 10
Tree spacing (ft) 33Averagetree diameter at breast height (d.b.h.) Wooddensity (kg/m3) 600Basalarea (BA) (greenbasis)(Ib/fP) 37 Base
2. Operationalfactors: Variables Range valueThinningpattern Treediameterat (cm) 6.0to 16.0 10.0Thinning intensity (percenttree removal) breast height(d.b.h.)(in.) 2.4 to 6.3 4.0
3, Machinecharacteristics: Treespacing (m) 1.0to 2.5 1.5Accumulating capacityof shear (ft) 3.3 to 8.2 5.0Average travel speed Associatedparameters RangeAveragesheartime Standdensity(trees/ha) 1,600to 10,000Average droptime (trees/acre) 648to 4,050Boomtravel speed Basal area (m2/ha) 15to 50Maximumand minimum boomreach (ft2/acre) 65to 217•

volume equations were developed from combined Therefore, we assumed that plantations would not bedata of several softwood species (Winsauer and Stein- allowed to exceed a basal area (BA) greater than 50hilb 1980). m2/ha (217 ft2/acre). We also assumed that stands
with a basal area less than 20 m2/ha (87 ft2/acre)We addressed the effects on productivity by varying would not require thinning. Only those spacing/
two major stand characteristics--tree spacing and diameter combinations falling between these basaldiameter. An average initial stand diameter was
•selected for each computer run. To allow for variabil- area limits were considered in this analysis.ity in the number of trees the accumulator could hold,the diameter of each tree was randomly assigned F ffect$ of Tree Spacing and Standduring simulation. We used the following distribution Diameter on Harvesting Effidencyto keep the diameters within a range that would beexpected in an even-aged plantation: Computer runs were made to "harvest" stands at
25 percent--Average diameter minus 2 era, each of four tree spacings (fig. 2). Basal area was held50 percent--Average diameter, and constant at 35 m2/ha (150 ft2/acre) for these runs by25 percent--Average diameter plus 2 cm. increasing the average diameter as the trees/hectare
decreased. We made runs for both machine types withTo study the effect of stand density on harvesting the other input variables set at base values. As tree
efficiency, we chose a range of initial tree spacings spacing increased the number of trees harvested per(from I to 2.5 m) that correspond to actual plantations, hour decreased, regardless of the feller/buncher used.Basal area, stand density, and diameter are inter- Trees per bunch were primarily affected by treerelated--thus silvicultural considerations determine diameter because the accumulator could not collect asthe actual density-d.b.h, combination that would exist many large trees; however some distance effect also(fig. 1). Tree growth is minimal in very dense stands, was found because at wider spacings it became too far
7_i -
G[IEXCEEDSRCCEPTRBLEI}Et4SITY
rr" EEl ......................3::: I.ig H FI¢ING
I..W8/ TAKIE_/HR / /rM
>- HEI / v._ a / sra<:v_s
- _: / / _.e R/Spncvws
IT.
rt- 2_ ------m
DnEs NI]T NEED THINNINg
IEI -_ ! ' I , I , I i I , 1L E; B IIZI 12 ILl 16
TREE DIFIHETER (CM.
. Figure 1.--Basal area for a generalized plantation as a function of diameterand spacings.
2

2HH "°
IBE - SHERR TYPE
"1- _ - CHRS515 IqI:IUNTED
|I:;B " _ X BI3DIq141:IUNTED
U'IWW IqB -
•. []_
p..>-. 12BI---.m
IBB>
I--
V 12-
o InI
EL % BU'l
. L.q I.dZ Z G,_" Z
I-- QLI'I w" 't
W
[EI
I 3n -vZ
2a
U'l IH _""_'__I.,JL,J[]_ _l , ! , I , I , ' • 'I-- I .El I .5 2.H 2.5 5PRClNE(H_
• 5.'7 IIl,lg 13.3 IE,7 DIRHE:TER({HI
" BRSRLRRER (35H2 /HR)
Figure 2.--Effects of diameter and spacing on harvesting productivity.
to travel or reach back to increase bunch size. But machine. This was caused by the combination of strip• only thinning and the equal tree spacing in the
larger tree volumes more than compensated for the plantation. In the 1.5- and 2.5-m plantations thedecrease in trees/hour and resulted in greater net previous bunch often fell just out of reach of the 10-mproductivity (tonnes/hour) and bunch sizes (tonnes/ boom under consideration so that a new bunch had tobunch), be started. This resulted in smaller bunches dropped
We found that the boom-mounted shear was more closer to the machine, decreasing boom swing timeefficient at some spacings than the fixed shear. The and increasing productivity. Although it would not beproductivity of the two machines was almost identical as distinct in a real harvest, a similar boom reach-at the 1.0-and 2.0-m spacings, but when tree spacings spacing effect would be seen that would increasewere 1.5 and 2.5m the boom-mounted shear was 10 to feller productivity at the expense of smaller bunch20 percent more productive than the fixed-shear size and lower skidder production.

the stand/machine interactions (table 2). They cannot Chassis-mountedshear:be as neatly quantified as the stand and machine Fellermustmoveto eachtreeto fell it.characteristics. Toreach a tree outside the strip, it must back up an
Fer most efficient skidding, trees should be col- equaldistancefor maneuvering.lected into bunchesof optimal size for the specific All felledtreeswill belaid inthestrip. Thefellerwill
• backup, dropthe trees, anddriveoverthem.skidder (Bradley 1984). Small, low horsepower Maximum distance the feller will back up to add to amachines would be used in these stands, so the opti-mal Skid load was set at 200 cm total diameter--that bunch is 20 m (65 feet).
" Boom-mounted shear"would be 33 _cm diameter trees or from 12 to 13
Feller will not backup.16-cm diameter trees or equivalent, approximately 1
Feller swings trees and drops them behind machinemetric tonne, in strip.
However, it may not be feasible for the feller/ Machinedoesnot leavestrip.bunchers to assemblethe optimal skid load. It is Desiredbunchsizefor economicalskiddingimpractical for the chassis-mountedshear type to (sumof tree diameters) (cm) 200back up more than two tree lengths (20 m) just to (in.) 80increase the skid bunch, and the machine with a Variables Rangeboom-mounted shear will not back up. It will add to Thinning pattern Strips-only or strips withthe bunch only if it is within reach from its current diagonal or herringbonelocation, thinning betweenstrips
Thinning pattern was the major operational factor Thinning intensityconsidered in this analysis. Removing strips of trees is (percenttrees removed) 25to 50probably the most economical treatment but leaves Machine length(m) 2 to 5
(ft) 6.5to 16uneven stand density with both silvicultural and Machine width (m) 1.25 to 2.5aesthetic problems. At the other end of the scale, aselection thinning may be the most desirable but the (ft) 4 to 8least practical. In dense stands, machine maneuver- this study were chosen to cover the range of theability is limited, resulting in low production and high smaller fellers currently available.
cost. Strip thinning with some thinning of the area Thinning between strips leaves an even more uni-between strips is an intermediate option with several form tree distribution. We restricted the thinningpossible variations. We confined our investigation to patterns between the strips to a herringbone or astrip-only thinning and to strips with a herringbone diagonal pattern but still many options are possibleor diagonal thinning pattern between strips. (fig. 4). The machine must be small enough to fit
The proportion of trees removed in a thinning between the "leave" trees, and the length and turningdepends upon initial stand density/spacing. For the ratio of the feller/buncher must allow the necessarystands with basal area of 35 m2/ha (150 ft2/acre) or maneuvering to thin the area between strips.
greater, it may be desirable to remove up to one-half The thinning pattern must be chosen carefully inthe trees to achieve maximum growth and extend the the densest stands, where removing double rows istime until another thinning is necessary. Stands with necessary to allow the machine to work withouta basal area of 20 m2/ha (85 ft2/acre) are on the lower damaging residual trees. Some patterns will allow toolimit of needing thinning; removing one-fourth of the much clumping, large empty areas, and too many
trees will give them sufficient room to grow. edge trees, resulting in undesirable branching andThinning intensities of 25, 33, and 50 percent can be uneven stand growth (fig. 5). It is necessary to make
achieved by cutting a strip of a single row and leaving the thinned area between strips as wide as possible tothree, two, or one uncut rows between or by cutting improve stand distribution over the double-row strip-double rows and leaving six, four, or two, respectively, only pattern.
Removing single rows will result in more even tree SJL1agle-Versus Double-row Strip-onlydistribution than removing double rows. However, inthe stands with 1.5 meter spacing or less, removing • Thinningdouble rows would be necessary for maneuveringeven small machines (fig. 3). Machine sizes used in For representative stands of each spacing category,
thinnings of both single- and double-row strips were
4I

_.5 X 2.5 H SPRCINE 1.5 X 1.5 H. 5PFICINE I.B X I.B H. SPRCINE
X X X X X X
X X X X X X X X XX X X X
rm r=!
. x x x x x x x x x x x
• 5:XS:.H _' _ I_
I X X X X X >C Ximl imw
X X X X X X X X X X X X X
J
_c X X X X XX X X X."
5 INI3LE V5 DDUI3LE RDN _TRIP-DNLY
• I X I M. SPRC INGS
. DI3UBLE: RI:]H 51NELE RI:IH
x x,x x x x x x x x x x x x x x x x
x_x x x x x x x x
X X X X X X X X X X X X X X X X X X
X X X X X X X X X X X X X X X X X X
,_ r='m _
.X X X X X X X X X _ X X X X X X X X
•" X X X X X X X X X
X 'X X X X X X X X X X X X X X X X X
X X X X X X X X X X X X X X X X X X
Figure 3..Limits on machine size due to tree spacing.
simulated with all machine variables set at their base skidder was almost twice as large for the double-rowvalues. Both-the chassis-mounted and boom-mounted strip thinning. Because skidding or forwarding alsoshear machine types behaved similarly, and produc- affects total system cost, the larger bunch size fromtion rates differed little (less than 10 percent) for the double-row strip would more than offset the slightdouble-r0w versus single-row strips (fig. 6). However, advantage of feller/buncher productivity of thethe. number of trees collected per bunch for the single-row.

" X.'X I X X X X X XX X X X X X X X X X X XXX XX XX XX XX XX XXX XXX XXXX X XX XX XX XX XX XXX XXX XXXxX iX XX XX XX X XX XXXX XX XX XX XX X X X X X XX X X X X X X.X X X X X X X X X X X
•.X X X X X X X X X X X X X X X X X X X X XXX XX XX XX XX XX XXX XXX XXXX X XX XX XX XX XX XXX XXX XXXX.X I X X X X X X X X X X X X X X X X X XXX XX I[X XX XX XX XXX XXX XXXXX XX XX XX XX XX XXX IXX XXX.XX IX XX IX XX X XX XXXX iX XX XX XX X X X X X XX I" I I I I I X I X: I X: X I I I X I
51NGI..Egflll 5T'l:_IP-DilLY DI l:lGflllRkT'HINNIN6 fit THREE_fllI5BEI'NEEII-SrRIPS
, , _ ,, , ,,= _ - _ .. ,,
. x xxx xxx xxx xx x XXXlX/X XX
x xxx xxx xxx xx xx XXl xx/ x
xx xxx xx x x xx x x xxxxI/XX
x xxx ,,x ,,x [xx xxx x xx xx [ xxlxx/ [x xxx xxx xxx x x xx x r,xxx X
X XX XXX X XX X X XXX ' XXXX
• DIRGI:IHRLTHIHNIN_HF"EIGHTgflH5 HERglHEBflHETHINNINGDF FIVE gflg5' BETHEEH-51"HIP5 BETHiEEH,,,5£RIP5
Figure 4.--Some possible thinning patterns to achieve a 33 percent tree removal.
I-Ie__one and Diagonal _g holding basal area constant at 35 m_/ha (150 fff/acre).We picked an intermediate between-strip
Between Strips width of five rows to be thinned in diagonal andherringbone patterns. More trees are available from
Removing trees from the area between strips is any location with thinning between the rows, so bunchmore desirable silviculturally than strip-only thin- sizes resemble those of the double-row strip-only.ning. To explore some facets of this type of thinning,we chose a thinning intensity of 33 percent because it For both machines, productivity was reduced whenoffered a wide range of patterns. We simulated thin- the areas between strips were thinned (table 3). Thenings using both machines for each tree spacing, chassis-mounted shear showed the greater decrease

XX" XX XX XX X XX X XX XXX XX XX XX XX XXX X XX- X X X X X X X X X X XXX XX XX XX XX XXXX XXXX-XX X X X X X X X X X X X X X XXX XX XX XX XX XX XXX X XX XX XX XX XXX XXXXX XX XX XX XX XXXX XXXXXX XX IX XX X XX X XX XX X X-X X X X X X X X XXX XX XX XX X XXX XXX-XX XX XX XX ZX XXXX XXXXX X . X X X X X X X X X X X X X XX,X XX XX XX XX XX XXX X XX X X X X X X X X X X X X
L ,, |i - i i , , ....................
5flUBL[ Rflil 5rRIP.5.-.DXLY I)DUBLE:ItflH HERRItlEBflil[ 1"HINX1116q RDII5B[_ E&-.51"I_IPS
_ _ ,J , , . L,, ,
XX XX XX XX X XXX XXXXX X XXX X XX XX
X X-" XXXX X X X X X XX XXXX XX XX XX XX
XXXX XXX XX XXX XXXX XXX X XXX XX XXXX XXXX
XX XX XX XX XX XXXX XXXXXX X XXX X XX XXXX XXXXXX XXXX X X XXX XXXX XXXX XX XX XX
XXXX XXX X X X X XX XXX X XXX XX XX XX
,.
' XX X X XX XX XX XXX XXXX X X XXX X XX XXXX XXXX• .
X.X X X X X X X X X X X X X X X X. ., , , . _
•. DDflBLEI_DIIDIREDXI:LTHINXIN6 DOUBLEltOII IbI RE[IXRI..11tlklXIME'G RflX5BETI,IEEH.-51"RIP5 H 1tfll15BErxEEIF._I'RIP5
Figure 5.--Thinning patterns in closely spaced stands requiring removal of double rows 50 percent tree removal.
{approximately 18 percent) due to the additional except for the 2.5-m-spaced trees. For that Stand,travel needed for each tree. The decrease in produc- thinning with a diagonal pattern was almost as ef-tivity from the strip-only is less consistent for the ficient as strip thinning only. The tree diameter/boom-mountedshear--it ranged from 5 to 23 percent, accumulator size combination was such that the fellerThis is largely due to the higher production found in always had a full accumulator when it reached thethe 1.5-and 2.5-m spacings because of the particular end of the diagonal. For the 2-m-spaced plantation,boomreach chosen for the study, however, almost 50 percent of the time the feller did
For the feller/buncher with the chassis-mounted not have a full accumulator load when it reached theshear, it made no difference which pattern was chosen end of the diagonal.
7

300 - 300 -
I:E r'F::3-I150 - _ 1150-
--Im
I:::] / 7 I::3 /::I:130- : ::t::130 - --\ ./ / \ / _- -i.U'l BO / / / _ / i:, /_/ /
. u.I _" / / / Ld BlZl " / i/w • / _ / / uJ / I ,/I::Z:HO -, / / / It: Hill - / / /I-- I-- . _
o / ./, / r ' a- " /' I 'i.m ,.s z.n z.s ,.m v.s z.u z.s _,cv,d_n'_a .m ,, tG a =m ,. =_ ovn.¢_'_
- /30 / 30 " /i
3: / ::E ' ,/ i_ i)O_L£ROtlk/l15 VII5 - I(..IZ / I, Z , / r=-i
" _ / 1_, m / I._1sWm.EmU- t_ 13 : -/ [/ u3 13 - / 7
\ / \ ;m a / m a ;- // // //w w _
•_. / _. I /_ 0 / _ .... ,l'- il ....... / / _ I
1.0 1.5: Z.O Z.5 1.0 1.5 2.0 1.5 5PRCI Nf(H')B 10 IH 115 B 10 IH 115 DIR. LCHI
5TRNDCONDITION5Figure 6.--Effects on productivity--single row versus doublerow strips only.
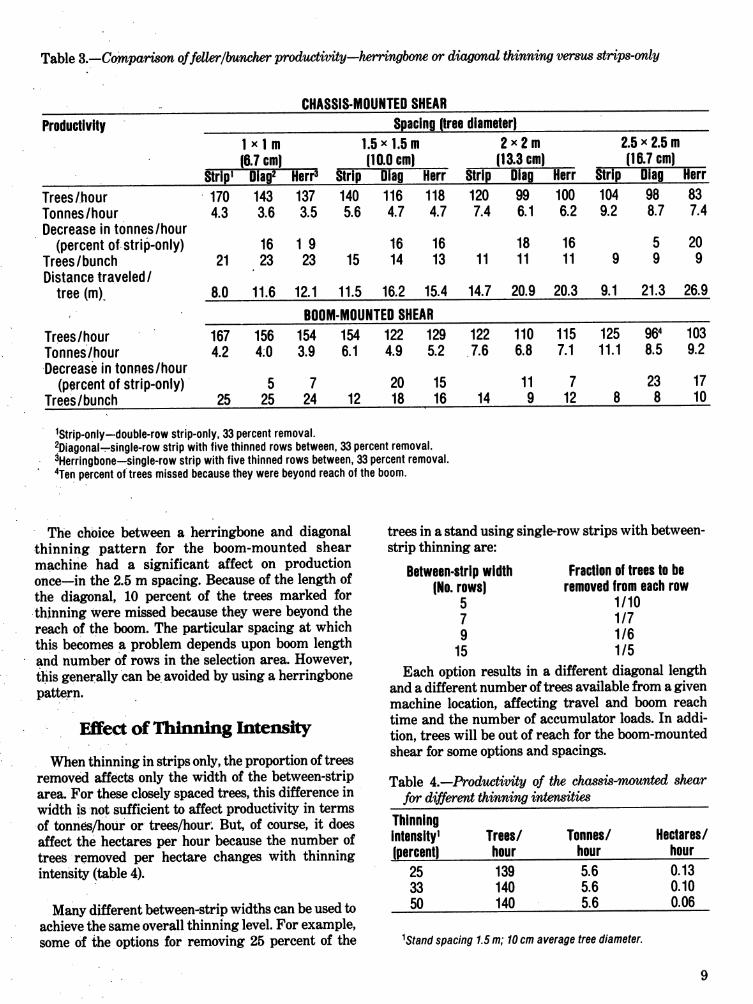
Table 3.--camparison of feller/buncher productivity--herringbone or diagonal thinning versus strips-only.
° .
CHASSIS-MOUNTEDSHEAR
Productivity Spacingpreediameter)1 x I m 1.5x 1.5m 2x2m 2.5x 2.5m16.7cm) [10.0cm) [13.3cm) (16.7cm)
Strip_ Diag2 Herr3 Strip Diag Herr Strip Diag Herr Strip Diag HerrTrees/.hour 170 143 137 140 116 118 120 99 100 104 98 83Tonnes/hour 4.3 3.6 3.5 5.6 4.7 4.7 7.4 6.1 6.2 9.2 8.7 7.4Decreasein tonnes/hour
(percentof strip-only) 16 1 9 16 16 18 16 5 20Trees/bunch :}1 23 23 15 14 13 11 11 11 9 9 9Distancetraveled/
tree(m). 8.0 11.6 12.1 11.5 16.2 15.4 14.7 20.9 20.3 9.1 21.3 26.9
, BOOM-MOUNTEDSHEAR
Trees/hour 167 156 154 154 122 129 122 110 115 125 964 103Tonnes/hour 4.2 4:0 3.9 6.1 4.9 5.2 7.6 6.8 7.1 11.1 8.5 9.2Decreaseintonnes/hour
(percentof strip-only)_ 5 7 20 15 11 7 23 17Trees/bunch 25 25 24 12 18 16 14 9 12 8 8 10
1Strip-only--double-rowstrip-only,33percentremoval.2Diagonal.--single-rowstripwithfivethinnedrowsbetween,33percentremoval.3Herringbone--single-rowstripwithfivethinnedrowsbetween,33percentremoval.
' 4Tenpercentoftreesmissedbecausetheywerebeyondreachoftheboom.
The choice between a herringbone and diagonal trees in a stand using single-row strips with between-thinning pattern for the boom-mounted shear strip thinningare:machine, had a significant affect on productiononce--in the 2.5 m spacing. Because of the length of Between-stripwidth Fractionof treesto bethe diagonal, 10 percent of the trees marked for (No.rows) removedfromeachrow5 1/10•thinning were missed because they were beyond the 7 1/7reach of the boom. The particular spacing at which 9 1/6this becomes a problem depends upon boom length
• and number of rows in the selection area. However, 15 1/51;hisgenerally can be avoided by using a herringbone Each option results in a different diagonal lengthpattern, and a different number of trees available from a given
' machine location, affecting travel and boom reach
Effect of Thinning Intensity time and the number of accumulator loads. In addi-• tion, trees will be out of reach for the boom-mountedshear for some options and spacings.
i When thinning in strips only, the proportion of trees
i removed affects only the width of the between-strip Table 4.--Productivity of the chassis-maunted sheararea. For these closely spaced trees, this difference in for different thinning intensitieswidth is not sufficient to affect productivity in termsof tonnes/h0Ur or trees/hour. But, of course, it does Thinningaffect the hectares per hour because the number of Intensity_ Trees/ Tonnes/ Hectares/trees removed per hectare changes with thinning [percent) hour hour hourintensity (table 4). 25 139 5.6 0.13
33 140 5.6 0.10
Many different between-strip widths can be used to 50 140 5.6 0.06achieve the same overall thinning level. For example,someOf the options for removing 25 percent of the 1Standspacing1.5m;lOcmaveragetreediameter.

M
The difference in productivity caused by the choice caused by percent tree removal or the choice of theofbetween-strip width is greater than the differences herringboneor diagonal pattern(fig. 7). The optimal
CHFi5515HOUNTED5HEBR BOOMMOUNTED5HEBRB - B -
II . I_
oS QE
\ - k i __ ,:, -r , _-i - _-_ _- - .,,, / / /m H- / / / wl-- ,w= u'14- i i i• mm W '_J" / / / i _m 'Z ' m Z I I Iz_ - i I I =,- z2- I I Io i i i .m- m- Q . /l I I
i-- II .' / i / i a._, I.-- /! / / ,_5 II 33 E[EI Itl 15 25 33 5B IE:NDVFIL( 1)
" 7 5 7 _ 7 5 7 5 RI]Wg-BE:TWIN5TRIP gDTH
IG_I - IGg -
I_ " -- [Z: ' i-- -- --13e- --i 7 _[ze - _- i -I
:I:° . i i i m , i i ,i. .. _. ,i I I\-BB - / / I \ B_I -m I I I m i I Iw • .i i / w . I i IwHli- '. I I / wqe- I i IIm • I i / v-m . i i /
I i / , . I i ,El '_E 2_ 33 511 25 ;2_ 33 E[ll RE:tlDVRL( I;)
7 _ 7 5 7 5 7 5 RDWS-BE:TWI N_ 5TRI P WI)TH
i6 - 16 - i 7 ", 1111NHI HI• :I: _ :z: . i i.- ' V -__t - V -
zi3 - I _ i Z13 - -I - i DIilIISIINFIL• i 7 i _ . I I i
m i i i m I i i [_m:nnI,_-\ B- i i i \ B- i i i .awe• Lllm i i i . i i iI,l.,I' b.Iw'-I- ii / w '4- i i I_. ii I m . I I i
/ I I , v.. i i;i , ,1-- 111 _ t5; '25 33 51tl El 25 125 33 5il I[HDVRL( t l
7 5 7 5 7 5 "7 5 RDWS-B[TWINSTRI P HDTH
i TRET5DUTDr RERCH
Figure 7.--Effects on productivity--percent tree removal, betweenstrip width, and thinning pattern.
10

between-strip width for a given pattern and tree Table 6.--FeUer/buncher machine characteristicsremoval rate will depend on tree spacing, treediameter, accumulator head capacity, and boom reach Base(for the boom-mounted shear). This interaction of Variable Range valuefactors makes it difficult to determine the optimum Shearaccumulatorwidth, and it deserves a separate analysis. Capacity--totaldiameter(cm) 0to 55 30
Herringbone and Diagonal Averagetravel speeds (in.) 0 to 22 12Thinninl_ in 1-by 1-m Spadngs Chassis-mountedshear (k/hr) 2 to 8 4
(mph) 1.2to 4.8 2.4To permit machine maneuverability and to avoid Boom-mountedshear _k/hr) 1to 4 2
tree damage in dense stands--i.e., 1- by 1-m spac- imph) .6 to 2.4 1.2ings--it may be necessary to remove a double row of Averageshear time (min/stem) .1 to .4 .2trees When thinning the between-strip area. To deter- Averagedroptime(min/load) .1 to .4 .2mine what effect this would have on productivity, we Boom reach speed--boom-mounted onlysimulated a 50-percent removal rate with a diagonal Unloaded (m/sec) .5 to 2 1pattern of both single and double rows (table 5). (ft/sec) 1.7 to 6.7 3.3
t Productivity increased while bunch size remained Loaded--10percentlongerforsimilar in contrast to the strip-only thinning where each tree in accumulator headproductivity was similar, but the bunch size doubled Boomreachwhen double rows were cut. Overall efficiency im- Minimum (m) 2 to 3 2
proved because of the greater number of trees avail- (ft) 6.5 to 10able for e_.ch pass the machine or boom had to make Maximum (m) 5 to 15 10into the between-strip area. (ft) 15 to 50
..
MACHINE CHARACTERISTIC_ Travel speeds in the woods have been shown to beAn understanding of how productivity is affected normally distributed, with a standard deviation from
by each of the machine characteristics could lead to 25 to 30 percent of the average value (Blinn 1983). Thedevelopment of the most efficient machine for these simulation model samples a normal distribution tothinnings (table 6). obtain each travel speed. The average travel speeds
were chosen to cover the range of values observed inAn accumulator head to collect multiple stems the field. In general, machines carrying a boom are
increases productivity. The number of stems the slower than those with a fixed shear, so we chose aaccumulator can hold depends on the size of the greater base speed for the fixed shear.individual trees. To specify the size of the accumu-
lator, we used a total sum of tree diameters. We Neither shear times nor drop times are normallystudied a range of machines from these with no distributed. Approximately 3,500 field observations
• accumulating ability to machines with an accumu- were used to develop distributions for shear and drop' lating capacity of 55 cm--that is, nine 6-cm trees or times (fig. 8). These distributions were then nor-four 16-cm trees. This would be an accumulating realized to the mean so they could be used with thehead approximately 40 cm (16 in.) in diameter different mean values and still maintain their proper-capable of handling 250 Kg or 500 to 600 lbs. We felt ties. The base values were taken as being equal to thethat a larger accumulator would not be mechanically field observation means, while the "fast" and "slow"feasible on these small machines, times were one-half and twice the base values, respec-
tively. The simulation program sampled these dis-Table 5.--Effect of removing double rows in the be- tributions for each shear and drop time.
tween-strip areaOne meter per second was determined to be a
reasonable boom travel speed. Again, one-half andChassis-mounted Boom-mounted twice that rate were used for the "slow" and "fast"
limits to determine effect of boom speed on produc-Single Double Single Double tion. Boom travel time was increased 10 percent forrow row row row each tree in the accumulator head to compensate for
Trees/hour 141 148 151 176 maneuvering and the additional weight. Boom reachTonnes/hour. 3.6 3:8 3.8 4.5 was limited to the range of values for currentlyTrees/bunch 22 28 27 24 available machines.
11

• L_Z K_I -£:3
t-- Hm ....
> 3_ - 1[2:t_J
1:3i_ .L_.
I I , ,i:::3 El B IB 2B 3El HB SB BB DESERVED¢¢ B.H B.B I.;2 I.B ;_.B ;_.H NDRHRLIZED TD
• THE HERNSHERR TIHE CCENTI-HINLITES)
mZ K2] -[=3
p-. H_] -12=>" 31;9 - iQ:::
Ln _B] -• 1::i:3 I
=3i::1 IN [_'• _ i . I
IZl ' _ I i i iEl I El ;_B 3B HB ECB BB EIBSERVED¢_" B.H B.B I._ I.B _.B _.H NEIRHRLIZED TI:I
THE HERNDRI3P TIME (CENTI-MINUTEE;)
DRTR TFIKENFRDNFIPPi_DXlMRTELT]gig DBSERVRTIDN5Mlll)£DURINE F IELi) STUDI[5 RT THE FDREST[NE INEERING LRBDRFITEIRI'U. S. D.R. NDRTHCENTRI:II.F'DREST£NPEI]IRENT 5TRTI DN
Figure 8.--Distributions of shear and drop times used in simulation model.
Sen$itivltv., of ]Productivity to _e for the boom-mounted machine. Because machineVariables travel is replaced with boom motion for that machine,
the boom reach speed becomes the significant factor.
To determine sensitivity of production to each of the The most important machine characteristic is themachine variables, runs were made for both machine existence of an accumulating head. We assumed antypes changing one variable at a time. Each variable accumulator for the base value. Increasing the size ofwas tested at a "slow" and "fast" rate, and the results the accumulator; i.e., the "high" value, increaseswere compared to the standard runs; i.e., all values set production by 15 to 30 percent. However, if no ac-to base. values (table 7). Runs were also made with all cumulator is used, production drops 50 percent! Themachine variables set "slow" and then all set "fast" to number of trees the accumulator head can hold de-obtain lower and upper bounds on production rates, pends upon tree size; the small head can hold four orThese runs were all made at the 1.5-m spacing and an five small trees but only one or two large ones.average tree diameter of i0 cm giving a basal area of Additional runs for various tree spacings and average35 m2/ha (150 ft2/acre). Shear rate greatly affected tree diameters were made to further investigate theproductivity for both machine types. Productivity effect of the use and size of an accumulating head.increased at least 30 percent when average shear time Trees per hour and tonnes per hour increase dra-is reduced from 0.2 to 0.1 minute per tree. Travel matically with the use of an accumulator (fig. 9). Forspeed also significantly affected productivity for the small trees, the production rate with a large accumu-
• fixed-head shear; however, it made little difference lating head is three times that of no acculmulator.
12

Table Z--Sensitivity offeUer/buncherproductivity (tonnes/hour)to changesin machine variables.
Production Fixed-headshear Boom-mountedshearMinimum--all machinevaluesset low 1.34tonnes/hr 1.67tonnes/hr
(-77%) (-73%)Average--allmachinevaluessetbase 5.59tonnes/hr 6.12tonnes/hrMaximum--allmachinevariablessethigh 14.97tonnes/hr 15.55tonneslhr
.. (+168°/o) (+154°/o)
Fixed-head Boom.mountedshear shear
ChangeInproductionVariable (percent)
Low HighMachine rate rate Low High Low HighTravelspeed
Fixed-head 2 k/hr 8 k/hr -31 29Boom-mounted 1k/hr 4 k/hr -5 5
Shearrate 0.4min/tree 0.1min/tree -30 31 -32 34Droprate 0.4min/tree 0.1min/tree -12 9 -14 11Accumulatorhead Noaccumulator 55cm -50 29 -43 16
capacity (large)(totaldiameter).
Boomreachspeed 0.5m/sec 2 m/sec -33 23
zm % F,CCU.UL.TF,.cm'.C_TV For large trees, the production rate is twice that of no
zn _ . ,, ,,ccu,uL,T._ accumulator. Also when using an accumulator head- SHRLL
•Ira _ x ,..=r skid bunch size increases which is an additional_ advantagewhen consideringthe entire system.
12:
z IB _ _ Additional thinnings were tested with a herring-_ i_ _ bone pattern between strips for machines with
variousaccumulating capacities.The percentchange_. x._ in production due to eliminating the accumulatororv • In increasing its capacity is identicalto thoseoutlined in• :3
'_' the preceding paragraph... r-1 R
.." _= = " = = ° - _um and Minimum Boom'" ExtensionZ
_ iz. To determine the effect of the boom reach limits,m • runs were made foreach spacing at a basal area of 35hJ " Ig> ' m2/ha. In these dense stands, the shorter the boom
_ e reach, the higher the productivity (fig. 10). We feelm this is due to the close spacings and the nature of thehi, 6"z strip thinnings. Although a machine with a shorterz
_ boomreach spends more time traveling, theextensiont-
z time for the boom is shorterand overall productivityis greater. This effect was less pronounced as the
, _= , I - ' , I , I - '
e, s e ,e ,z ,, ,s boomtravel speed increased. Productionincreasewasat the expense of leaving smaller bunches for the
TREE DIRHETER (EH) skidder or forwarder; those from a machine with a, Figure 9.--Effects of accumulator head on 5-m boomwere one-halfthe size of those madewith a
productivity" 10-or 15-mboom.
13

ZBB -£XTENSIEIN (H
HI N HRXIBB X z s
12: - Z IB-1-\ IEB 1_ 3 ImU'l + 3 IKww IqB
I-->- Izni-ra> IBa
I-..-V IZ-
C:l IZ IB -:z: .
n \ 19Lrl.I_.q WZ Z 5
• --" Z
I-- 1::9U'l1-" HW
. _>Z
-r"
:z: ]ll-vz=:! Zltl1¢1
LI1 IIIWW ,,12: RI , l . , ! , I • ' • 'I-,, i .B I .5 Z.B 2.S 5PR{'IHS(H'_
' ,, 5.7 IB.B 13.3 15.'7 DIRHETER(CH')
'" GRSRLRRER (35M2 /HR)Figure l O.--Effects of boom extension on harvesting productivity.
..
Changingthe minimumboom reach;i.e.,how close CONCLUSIONStheshear couldbe to the machine,producedless well-defined results. Bunch sizes for the 3-m minimum The purposeof this analysis was to determine thereach decreasedslightly, but the productivity was effect of variousfactors on the performanceof feller/affec_d more by the boom/spacinginteraction than bunchers in thinning plantations.The validity of thethe minimum distance. Boom rech is a more critical results derived from this analysis is subject to thefactorwhen the thinning pattern involvesmore than assumptions made in developing and implementingjust removingstrips. It is necessaryforthe boomto be the simulation models. Our approach addressedtheableto reach all the trees tobe removedin the thinned sensitivity of productionto each variable independ-areas,particularly in the diagonal pattern, ently. It was impossible to consider all the possible
14

characteristics and their interactions, yet the values Bradley, Dennis P. Using computer simulation toconsidered for each variable were within the range of evaluate mechanized harvest systems. Tech. Bull.current Conditions and technology. Therefore, the 1687. Washington, DC: U.S. Department of Agri-results of this study should be useful in determining culture, Forest Service, Canada/United Statesthe elements of machine design and operation that Spruce Budworms Program; 1984.warrant the most attention. In particular, the use of Winsauer, Sharon A. A program and documentationan accumulator head and/or an increase in cutting for simulation of a tracked feller/buncher. Res.speed can significantly improve productivity. This Pap. NC-192. St. Paul, MN: U.S. Department ofindicates that new concepts providing for simul- Agriculture, Forest Service, North Central Foresttaneous cutting and/or collecting of multiple stems Experiment Station; 1980. 26 p.could greatly enhance the mechanized harvesting of Winsauer, Sharon A.; Bradley, Dennis P. A programthese plantations, and documentation for simulation of a rubber-tired
feller/buncher. Res. Pap. NC-212. St. Paul, MN:]LI'I'_TUR]E CITI_D U.S. Department of Agriculture, Forest Service,
North Central Forest Experiment Station; 1982. 34p.
Blinn, Charles. The economics of integrating the Winsauer, Sharon A.; Steinhilb, Helmuth M. Sum-harvesting and marketing of eastern hardwood mary of green weights and volumes for five treetimber to achieve increased profitability. Blacks- species in Michigan. Res. Pap. NC-191. St. Paul,burg, VA: Virginia Polytechnic Institute and State MN: U.S. Department of Agriculture, ForestUniversity, School - of Forestry; 1983. Ph.D. Service, North Central Forest Experiment Station;dissertation. 1980. 22 p.
U.$. GOVERNMENT PRINTING OFFICE: 1984-- 767.146110062
15

Winsauer, Sharon A.; Mattson, James A.; Thompson, Michael A.• Feller/bunchers in plantation thinnings: factors affecting productivity.
• Res. Pap. NC-254. St. Paul, MN: U.S. Department of Agriculture,Forest Service, North Central Forest Experiment Station; 1984. 15 p.
Computer simulation was used to identify possible areas for im-proving the design and operation of feller/bunchers for thinningclosely spaced plantations. Some of the variables considered wereaverage stand diameter, tree spacing, thinning pattern, operationalmachine speeds, and shear head accumulating capacity.
KEY WORDS: Simulation, machine characteristics, stand char-acteristics, computer, felling.