research article a simulation model for machine efficiency
TRANSCRIPT

Research ArticleA Simulation Model for Machine EfficiencyImprovement Using Reliability Centered Maintenance:Case Study of Semiconductor Factory
Srisawat Supsomboon and Kanthapong Hongthanapach
Mechanical and Process EngineeringDepartment,The Sirindhorn InternationalThai-GermanGraduate School of Engineering (TGGS),King Mongkut’s University of Technology North Bangkok (KMUTNB), Bangkok 10800, Thailand
Correspondence should be addressed to Srisawat Supsomboon; [email protected]
Received 3 August 2014; Accepted 6 November 2014; Published 30 November 2014
Academic Editor: Farouk Yalaoui
Copyright © 2014 S. Supsomboon and K. Hongthanapach. This is an open access article distributed under the Creative CommonsAttribution License, which permits unrestricted use, distribution, and reproduction in any medium, provided the original work isproperly cited.
The purpose of this study was to increase the quality of product by focusing on the machine efficiency improvement. The principleof the reliability centeredmaintenance (RCM)was applied to increase themachine reliability.The objective was to create preventivemaintenance plan under reliability centeredmaintenancemethod and to reduce defects.The study target was set to reduce the LeadPPM for a test machine by simulating the proposed preventive maintenance plan. The simulation optimization approach based onevolutionary algorithms was employed for the preventive maintenance technique selection process to select the PM interval thatgave the best total cost and Lead PPM values. The research methodology includes procedures such as following the priority ofcritical components in test machine, analyzing the damage and risk level by using Failure Mode and Effects Analysis (FMEA),calculating the suitable replacement period through reliability estimation, and optimizing the preventive maintenance plan. Fromthe result of the study it is shown that the Lead PPM of test machine can be reduced. The cost of preventive maintenance, cost ofgood product, and cost of lost product were decreased.
1. Introduction
Due to the higher competition of businesses and industries,the battle for survival of business has become stronger. Manybusinesses and industries have to improve their performancein order to retain their businesses in the competitive world.The semiconductor factory is one of the industries thatrequire effective production planning in order to improveproduction process for higher competence. Reliability andmaintainability play a crucial role in ensuring the success ofoperation in production processes because they could be usedto determine production availability and to increase quality.In addition, maintenance policy also plays an important rolein increasing operation effectiveness with minimum cost[1]. The reliability centered maintenance (RCM) is a widelyacceptedmethodology that has been available in the industryfor over 30 years and has been proved to offer an effi-cient strategy for preventive maintenance optimization [2].
Designing a preventive maintenance schedule for a produc-tion line is not always easy. Predicting the outcome of thescheduling without reliable reason or evidence could createa certain level of uncertainty for the design engineers. Newtechnological developments have enabled the advantage ofsimulationmodels to test the performance of themanufactur-ing process lines even before they exist and to define as well asto implement the scheduling plan [3]. Concept of simulationtechnique is to imitate the real system and after that usemodel to simulate different conditions and then study theeffects to evaluate possible strategies in order to improve thecurrent system. Simulated model could present results andeffects of various conditions according to the assumptions intesting stage of simulation model. The results assist analyzerto understand the transient stage of the system and predictthe effects that occur when changing condition(s) of thesystem [4].
Hindawi Publishing CorporationModelling and Simulation in EngineeringVolume 2014, Article ID 956182, 9 pageshttp://dx.doi.org/10.1155/2014/956182
2 Modelling and Simulation in Engineering
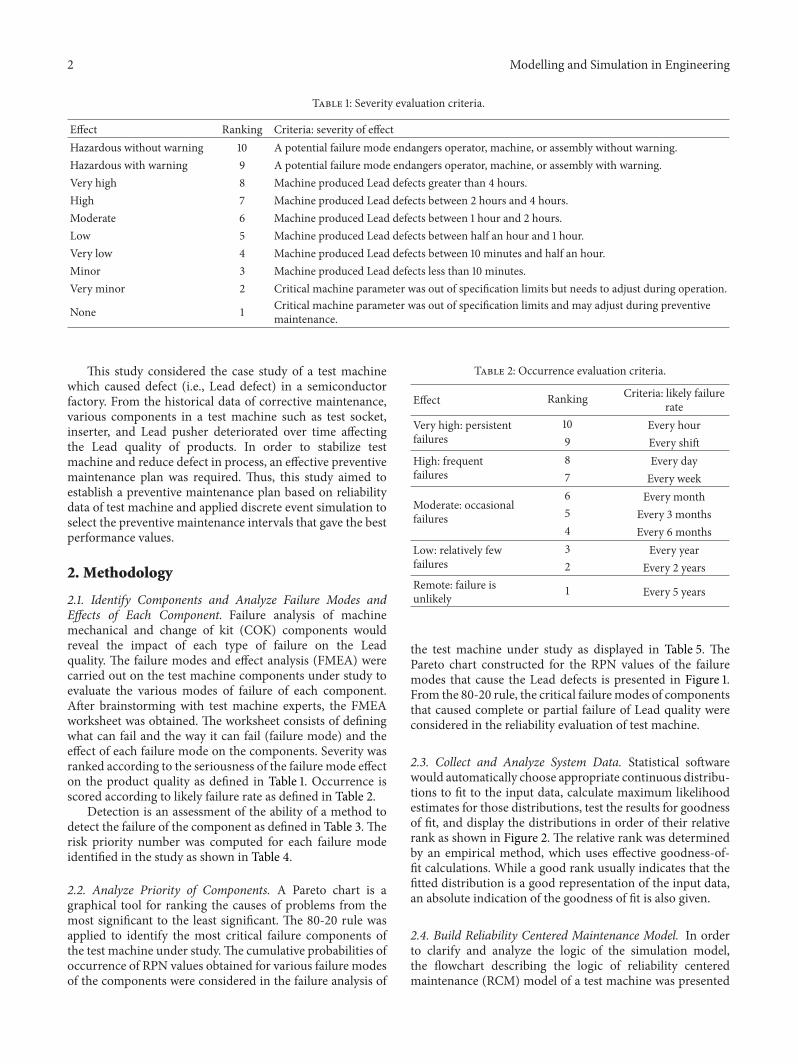
Table 1: Severity evaluation criteria.
Effect Ranking Criteria: severity of effectHazardous without warning 10 A potential failure mode endangers operator, machine, or assembly without warning.Hazardous with warning 9 A potential failure mode endangers operator, machine, or assembly with warning.Very high 8 Machine produced Lead defects greater than 4 hours.High 7 Machine produced Lead defects between 2 hours and 4 hours.Moderate 6 Machine produced Lead defects between 1 hour and 2 hours.Low 5 Machine produced Lead defects between half an hour and 1 hour.Very low 4 Machine produced Lead defects between 10 minutes and half an hour.Minor 3 Machine produced Lead defects less than 10 minutes.Very minor 2 Critical machine parameter was out of specification limits but needs to adjust during operation.
None 1 Critical machine parameter was out of specification limits and may adjust during preventivemaintenance.
This study considered the case study of a test machinewhich caused defect (i.e., Lead defect) in a semiconductorfactory. From the historical data of corrective maintenance,various components in a test machine such as test socket,inserter, and Lead pusher deteriorated over time affectingthe Lead quality of products. In order to stabilize testmachine and reduce defect in process, an effective preventivemaintenance plan was required. Thus, this study aimed toestablish a preventive maintenance plan based on reliabilitydata of test machine and applied discrete event simulation toselect the preventive maintenance intervals that gave the bestperformance values.
2. Methodology
2.1. Identify Components and Analyze Failure Modes andEffects of Each Component. Failure analysis of machinemechanical and change of kit (COK) components wouldreveal the impact of each type of failure on the Leadquality. The failure modes and effect analysis (FMEA) werecarried out on the test machine components under study toevaluate the various modes of failure of each component.After brainstorming with test machine experts, the FMEAworksheet was obtained. The worksheet consists of definingwhat can fail and the way it can fail (failure mode) and theeffect of each failure mode on the components. Severity wasranked according to the seriousness of the failure mode effecton the product quality as defined in Table 1. Occurrence isscored according to likely failure rate as defined in Table 2.
Detection is an assessment of the ability of a method todetect the failure of the component as defined in Table 3. Therisk priority number was computed for each failure modeidentified in the study as shown in Table 4.
2.2. Analyze Priority of Components. A Pareto chart is agraphical tool for ranking the causes of problems from themost significant to the least significant. The 80-20 rule wasapplied to identify the most critical failure components ofthe test machine under study.The cumulative probabilities ofoccurrence of RPN values obtained for various failure modesof the components were considered in the failure analysis of
Table 2: Occurrence evaluation criteria.
Effect Ranking Criteria: likely failurerate
Very high: persistentfailures
10 Every hour9 Every shift
High: frequentfailures
8 Every day7 Every week
Moderate: occasionalfailures
6 Every month5 Every 3 months4 Every 6 months
Low: relatively fewfailures
3 Every year2 Every 2 years
Remote: failure isunlikely 1 Every 5 years
the test machine under study as displayed in Table 5. ThePareto chart constructed for the RPN values of the failuremodes that cause the Lead defects is presented in Figure 1.From the 80-20 rule, the critical failuremodes of componentsthat caused complete or partial failure of Lead quality wereconsidered in the reliability evaluation of test machine.
2.3. Collect and Analyze System Data. Statistical softwarewould automatically choose appropriate continuous distribu-tions to fit to the input data, calculate maximum likelihoodestimates for those distributions, test the results for goodnessof fit, and display the distributions in order of their relativerank as shown in Figure 2. The relative rank was determinedby an empirical method, which uses effective goodness-of-fit calculations. While a good rank usually indicates that thefitted distribution is a good representation of the input data,an absolute indication of the goodness of fit is also given.
2.4. Build Reliability Centered Maintenance Model. In orderto clarify and analyze the logic of the simulation model,the flowchart describing the logic of reliability centeredmaintenance (RCM) model of a test machine was presented

Modelling and Simulation in Engineering 3
Table 3: Detection evaluation criteria.
Detection Ranking Range of detection methodsAlmost impossible 10 Cannot detect or is not checked.Very remote 9 Control is achieved with indirect or random checks only.Remote 8 Control is achieved with visual inspection only.Very low 7 Control is achieved with double visual inspection only.Low 6 Control is achieved with charting methods, such as SPC (statistical process control).
Moderate 5 Control is based on variable gauging after parts have left the station, or go/no gogauging performed on 100% of the parts after parts have left the station.
Moderately high 4 Error detection in subsequent operations, or gauging performed on setup andfirst-piece check (for set-up causes only).
High 3 Error detection in station, or error detection in subsequent operations by multiplelayers of acceptance: supply, select, install, verify, cannot accept discrepant part.
Very high 2 Error detection in station (automatic gauging with automatic stop feature). Cannotpass discrepant part.
Very high 1 Discrepant parts cannot be made because item has been error-proofed byprocess/product design.
Source: [5].
Table 4: FMEA worksheet for test machine components.
Mechanical part list (impact Lead defect) Potential of failure mode Effect Severity Occurrence Detection RPN1 Vacuum pad Wear Dropped unit 8 4 9 2882 Ejector filter Blocking Dropped unit 8 4 8 2563 Picker cylinder Erosion Unit misplacement 8 4 9 2884 Solenoid valve Valve does not open/close Dropped unit 6 4 8 1925 Pitch ring Wear Unit misplacement 5 3 8 1206 Pitch bearing Wear Unit misplacement 5 2 4 407 Timing belt Damage Unit misplacement 7 3 9 1898 Test tray Damage Unit misplacement 6 1 4 249 Air tubing Leakage Unit misplacement 3 1 4 1210 Motor shaft Crack/fracture Dropped unit 6 3 2 3611 Motor stator Open/short circuit Dropped unit 5 2 2 2012 Inserter Breakage Overpress on Lead 8 4 9 28813 Lead pusher Breakage Overpress on Lead 8 4 9 28814 Test socket Pogo pin stuck Overpress on Lead 8 5 8 32015 Loader buffer Wear Unit misplacement 3 1 8 2416 Loader preciser Misalignment Unit misplacement 6 1 8 4817 Unloader preciser Misalignment Unit misplacement 7 3 8 16818 Unloader sortable Wear Unit misplacement 4 1 8 3219 Linear guide Wear Unit misplacement 8 4 9 28820 Ball screw Crack/fracture Dropped unit 3 1 2 6
in Figure 3. The overall scenarios of RCM model were con-cluded in Table 6 before simulation model had been created.
Once a unit arrives to test machine, the simulationmodelwould check whether the machine component reached thepreventive maintenance (PM) plan. If so, the unit would beblocked to wait until PM completed. In case the machinecomponent did not reach PM plan, the component wouldbe checked by the second condition to determine whether itstill had the less cycle counts than the time-to-failure (TTF).If so, the tested unit would become the good unit. Oth-erwise, the tested unit would become the lost unit. The third
condition would check whether the test machine continu-ously produced 13 lost units. If so, it would be stopped forcorrective maintenance (CM).
The following assumptions were made in the simulationmodel of RCMmodel.
(1) Since reliability centered maintenance model woulddetermine preventive maintenance schedules de-pending on a reliability of component, the simulationmodel would assume that the component carried100% reliability when the simulation started anddecreased over cycles of processing.

4 Modelling and Simulation in Engineering
Table 5: Cumulative percentage of occurrence of RPN values.
ID Component RPN Probability of occurrence of RPN value Cumulative % of occurrence of RPN value14 Test socket 287.51 0.1036 10.36%13 Lead pusher 272.00 0.0980 20.16%3 Picker cylinder 268.33 0.0967 29.83%1 Vacuum pad 268.22 0.0967 39.50%12 Inserter 260.56 0.0939 48.89%19 Linear guide 253.00 0.0912 58.01%2 Ejector filter 235.06 0.0847 66.48%4 Solenoid valve 179.75 0.0648 72.96%7 Timing belt 176.00 0.0634 79.30%17 Unloader preciser 150.62 0.0543 84.73%5 Pitch ring 117.33 0.0423 88.96%16 Loader preciser 62.91 0.0227 91.22%6 Pitch bearing 50.81 0.0183 93.06%18 Unloader sortable 43.85 0.0158 94.64%15 Loader buffer 31.51 0.0114 95.77%8 Test tray 31.41 0.0113 96.90%10 Motor shaft 30.67 0.0111 98.01%11 Motor stator 29.63 0.0107 99.08%9 Air tubing 18.96 0.0068 99.76%20 Ball screw 6.67 0.0024 100%
Table 6: Overall scenarios of RCMmodel.
Scenarios Time to failure PM schedule Machine status Entity processed1 Reached (component failed) Reached Stop for PM Blocked before test2 Not reached Reached Stop for PM Blocked before test3 Reached (component failed) Not reached Worn-out Lost unit4 Not reached Not reached Normal Good unit
Critical components
3000
2500
2000
1500
1000
500
0
RPN
val
ues
100
80
60
40
20
0
Component IDRPN values
(%)Cumulative percentage
14 13 1 3 12 19 2 4 7 17 5 16 6 18 15 8 10 11 9 202881010 20 30 39 49 58 66 73 79 85 89 91 93 95 96 97 98 99 100 100
10 10 10 9 9 8 6 6 5 4 2 2 2 1 1 1 1 1 0272 268 268 260 253 235 180 176 151 117 63 51 44 32 31 31 30 19 7
Cum
ulat
ive p
erce
ntag
e
Figure 1: Potential failure modes Pareto chart.

Modelling and Simulation in Engineering 5
Figure 2: Various distributions fitted to the input data.
Unit arrival
Testing
Lost unit
PM or CM on test
machine?
Good unit
CM for test machine
Cycle counterfor PM < TTF?
13 lost unitscontinuously?
Testing
Yes
Yes
Yes
No
No
No
Figure 3: Flowchart of RCMmodel of the test machine.
(2) One repair technician is continuously available.(3) Once a repair action begins on a component, it is fully
completed without exemption.(4) Once the repair is completed, the component will
resume operation with 100% reliability.(5) Once failed component occurred, test machine can
still run. But the output will be produced as beingdefective.
(6) Arrival time is constant feeding to tester withoutidling.
The simulation model would be run for 1 year (365 days).Once the simulation run was completed and the resultswere obtained, the report provided the user to see howthe machine utilization, the reliability of component, and
Figure 4: Complete simulationmodel for PM scheduling optimiza-tion.
cost had changed. The complete simulation model for PMscheduling optimization is shown in Figure 4.
2.5. Verify andValidate SystemModel. During the implemen-tation of the simulation model, it was verified using test runmethods to ensure that themodel has been implementedwithcorrect algorithms and used certain data in certain momentof time. Moreover, debugger tool was used to point outprogramming errors when they appeared. Counters were alsoinserted throughout the model for local result measurement.By this way, some mistakes could be found and corrected.
Before experiments, executionsmodel set with all param-eters was configured. It had been validated using the hypoth-esis methods. In this study, the simulation model would notproduce statistically different values for 2 selected perfor-mance measures—throughput and Lead ppm.The results areshown in Table 7. To determine statistical significance, 𝛼 =0.05was set and the following hypothesis test was performed:
𝐻0: 𝜇𝑟− 𝜇𝑠= 0,
𝐻1: 𝜇𝑟− 𝜇𝑠= 0.
(1)
The subscripts 𝑟 and 𝑠 denote the real system data andsimulation results. The confidence interval was computed forcomparing two systems. Additionally, this approach does notrequire that the two populations have equal variances. With95% confidence, the conclusion is that there is no significantdifference between the throughput and Lead ppm of thetwo systems (real system and simulation model) given thatthe confidence interval includes zero. While the throughputand Lead ppm are two prominent performance measuresfor analyzing manufacturing systems, other performancemeasures can also be tested in a similar manner.
2.6. Analyze Output of System. To analyze the output fromsimulation model, simulation results would be examinedin terms of total cost and Lead ppm that will be usedto determine the most appropriate preventive maintenancescheduling scheme.The cost structure and Lead ppm formu-lation are shown in Tables 8 and 9. The cost rates were inputinto the computational simulation model. The real data werecoded for the sake of industrial confidentiality.
2.7. Optimize Preventive Maintenance Interval. After theverification and validation process, the simulation model

6 Modelling and Simulation in Engineering
Table 7: Comparison of real system data and simulation results.
ReplicationPerformance measures
Throughput Lead PPMReal system Simulation model Real system Simulation model
1 239 237 1,041 9602 238 238 989 1,0293 240 241 1,087 9754 235 237 825 1,0585 240 236 1,063 1,2816 237 237 936 1,1837 235 237 838 1,0188 242 243 1,216 1,2519 238 242 983 90510 239 239 1,037 1,213Sample mean (𝑋) 238.3 238.7 1,001.5 1,087.3Sample standard deviation (𝑠) 2.213 2.452 116.7 133.595% confidence interval −1.796 ≤ 𝜇
𝑟− 𝜇𝑠≤ 2.596 −203.759 ≤ 𝜇
𝑟− 𝜇𝑠≤ 32.159
Table 8: Cost structure for performance measures.
Cost structureTotal cost (TC) TC = CGP − CLD − CPMCost of preventive maintenance (CPM) CPM = (CC) + (TeC)Component cost (CC) CC = (Total Component Replaced) ∗ (Cost/Component Unit)Technician cost (TeC) TeC = (Total Time Repaired) ∗ (Cost/Hour)Cost of good product (CGP) CGP = (Total Good Units) ∗ (Cost/Good Unit)Cost of lost product (CLD) CLD = (Total Lost Units) ∗ (Cost/Lost Unit)
Table 9: Lead ppm for performance measures.
Formulation
Lead PPM Lead PPM = (Total Lost Units/Total Units Produced)× 106
could be executed considering total cost of system and Leadppm. For this case study, the objective of optimization wasto find out the optimal preventive maintenance intervalthat maximized the total cost, minimized Lead ppm, andmaximized the number of preventive maintenance intervals.To do this, simulation model will seek optimal values fordecision variables (i.e., preventive maintenance interval foreach component). The solutions were generated by varyingthe values of decision variables according to their data type,lower bounds, and upper bounds.
3. Finding of the Study
3.1. The Optimal Preventive Maintenance Interval. In orderto solve optimization problem, optimization software willgenerate solutions by varying the values of decision variablesaccording to their data type, lower bounds, and upperbounds. After selecting the decision variables, an objectivefunction was defined to measure the utility of the solutionstested by optimization software.
Table 10: Upper bound setting for each component.
Component Current PM interval Upper boundMonths Converted to cycles Cycles
(1) Test socket 6 43,200 43,200(2) Inserter 6 43,200 43,200(3) Lead pusher 6 43,200 43,200(4) Linear guide 12 86,400 86,400(5) Vacuum pad 3 21,600 21,600(6) Picker cylinder 12 86,400 86,400(7) Ejector filter 6 43,200 43,200(8) Solenoid valve 12 86,400 86,400(9) Timing belt 12 86,400 61,821
PM intervals were defined as the decision variables. Theupper bound was obtained from the current PM intervalof each component as shown in Table 10. For example, testsocket had the current PM interval as equal to 6 monthsor 43,200 cycles. The upper bound of test socket in thesimulation model was set to 43,200 cycles for optimizingpreventive maintenance interval.
In contrast, the minimum time-to-failure value of eachcomponent would be set as the lower bound of each compo-nent as shown in Table 11. For example, the minimum time-to-failure value of test socketwas 3.59months or 25,871 cycles.

Modelling and Simulation in Engineering 7
Table 11: Lower bound setting for each component.
Component Current PM interval Lower boundMinimum time-to-failure value Converted to cycles Months Cycles
(1) Test socket 25,871 3.59 3 21,600(2) Inserter 25,612 3.55 3 21,600(3) Lead pusher 30,612 4.25 4 28,800(4) Linear guide 45,871 6.37 6 43,200(5) Vacuum pad 18,251 2.53 2 14,400(6) Picker cylinder 45,783 6.35 6 43,200(7) Ejector filter 27,781 3.85 3 21,600(8) Solenoid valve 55,432 7.69 7 50,400(9) Timing belt 54,582 7.58 7 50,400
The lower bound of test socket in the simulation model wasset to 3 months or 21,600 cycles for optimizing preventivemaintenance interval.
In this study, there were five optimization strategiesproposed in order to define test machine components andmultiterm objective function. The reasons for those opti-mization strategies were to optimize all scenarios that couldimpact the total cost, Lead PPM, and PM interval of eachcomponent. The details of each strategy were provided inTable 12.
Table 13 and Figure 5 show the current and proposedPM interval for each critical component. The proposed PMinterval resulted in a lower number of cycles than the currentPM interval.
3.2. Comparison of Simulation Results. After running thesimulation with 10 replications (i.e., 10 years) using theproposed PM interval, the results of comparing the testmachine performance of current and proposed model bysimulation are as follows. Lead ppm was decreased from1087 ppm to 15 ppm or decreased by 98.6%. In contrast, totalcost of system was increased to 59,299 Baht. Furthermore,cost of preventivemaintenance was decreased to 49,059 Baht,cost of good product was increased to 4,827 Baht, and cost oflost product was decreased to 5,343 Baht. The total cost ofeach strategy compared with the current system is presentedin Table 14. Figure 6 illustrates the results comparison.
4. Conclusions
The objective of the study was to create preventive mainte-nance plan under reliability centered maintenance methodand to reduce the defects of TS056 package occurring duringTMP process. The critical components of test machine wereexamined as the case study, where the machine behaviorand outcomes were obtained by using a ProModel-basedsimulation model. The simulation optimization approachbased on evolutionary algorithms was employed for thepreventive maintenance technique selection process to selectthe PM interval that gave the best total cost and Lead PPMvalues. Five distinct optimization strategies were identified.The effects on the performance measures were described.
Table 12: Overall scenarios of RCMmodel.
Strategies Test machinecomponents Multiterm objective function
1 Separated (1) Maximize total cost(2) Minimize Lead PPM
2 Separated
(1) Maximize total cost(2) Minimize Lead PPM(3) Maximize PM plan of theseparated component
3 Combined (1) Maximize total cost(2) Minimize Lead PPM
4 Combined
(1) Maximize total cost(2) Minimize Lead PPM(3) Maximize PM plan of testsocket(4) Maximize PM plan of inserter(5) Maximize PM plan of Leadpusher(6) Maximize PM plan of linearguide(7) Maximize PM plan ofvacuum pad(8) Maximize PM plan of pickercylinder(9) Maximize PM plan of ejectorfilter(10) Maximize PM plan ofsolenoid valve(11) Maximize PM plan oftiming belt
5 Combined (1) Maximize total cost
According to the results of the study, optimization strat-egy 1 provided the highest total cost and the lowest Lead PPMfor the case study. The total cost increased from 2,493,604Baht to 2,552,833 Baht (increased 59,299 Baht). Lead PPMcould be reduced from 1,087 ppm to 15 ppm or decreased 98.6percent. Furthermore, cost of preventive maintenance wasdecreased from 117,095 Baht to 68,036 Baht or decreased 42percent, cost of good product was increased from 2,616,120Baht to 2,620,947 Baht or increased 0.2 percent, and cost oflost product was decreased from 5,421 Baht to 78 Baht ordecreased 98.6 percent.

8 Modelling and Simulation in Engineering
Table 13: Current and proposed PM interval for each component.
ComponentReplacement
Current PM interval Proposed PM interval
Months Converted tocycles
Strategy 1(cycles)
Strategy 2(cycles)
Strategy 3(cycles)
Strategy 4(cycles)
Strategy 5(cycles)
(1) Test socket 6 43,200 22,737 23,604 22,913 23,413 22,900(2) Inserter 6 43,200 21,600 21,600 21,611 29,901 21,600(3) Lead pusher 6 43,200 29,811 31,982 29,285 32,180 29,880(4) Linear guide 12 86,400 46,351 49,146 45,162 49,146 46,196(5) Vacuum pad 3 21,600 15,040 18,747 15,025 18,747 18,747(6) Pickercylinder 12 86,400 46,210 46,867 46,158 46,866 46,574
(7) Ejector filter 6 43,200 29,709 32,096 22,836 32,112 28,413(8) Solenoidvalve 12 86,400 50,417 50,417 50,419 52,436 49,844
(9) Timing belt 12 86,400 52,430 61,821 52,391 61,821 53,737
Table 14: Total cost of current system and five strategies.
Replications (years)Total cost (Baht)
Simulation model(current system)
Simulation model(strategy 1)
Simulation model(strategy 2)
Simulation model(strategy 3)
Simulation model(strategy 4)
Simulation model(strategy 5)
1 2,493,423 2,553,189 2,556,298 2,548,063 2,545,634 2,555,5322 2,494,546 2,551,956 2,546,587 2,546,222 2,547,786 2,549,3813 2,490,534 2,555,128 2,530,285 2,544,308 2,537,424 2,539,0524 2,496,408 2,554,692 2,545,462 2,542,428 2,552,088 2,553,5545 2,494,686 2,556,834 2,538,891 2,546,425 2,555,929 2,556,7096 2,491,592 2,552,715 2,549,388 2,546,062 2,553,378 2,552,0317 2,495,246 2,552,704 2,552,858 2,544,660 2,553,380 2,552,4978 2,490,343 2,547,561 2,527,375 2,547,253 2,555,101 2,556,7109 2,494,612 2,549,115 2,541,323 2,546,311 2,529,781 2,547,83610 2,494,644 2,554,440 2,546,053 2,537,502 2,548,538 2,556,709Average 2,493,604 2,552,833 2,543,452 2,544,923 2,547,904 2,552,001
010,00020,00030,00040,00050,00060,00070,00080,00090,000
100,000
1 2 3 4 5 6 7 8 9
Cycle
s
Critical components
Current systemStrategy 1Strategy 2
Strategy 3Strategy 4Strategy 5
Figure 5: Current and proposed PM interval for each critical com-ponent.
2,49
3,60
4
2,55
2,83
3
2,54
3,45
2
2,54
4,92
3
2,54
7,90
4
2,55
2,00
1
2,460,0002,470,0002,480,0002,490,0002,500,0002,510,0002,520,0002,530,0002,540,0002,550,0002,560,000
Tota
l cos
t (Ba
ht)
Current systemStrategy 1Strategy 2
Strategy 3Strategy 4Strategy 5
Figure 6: Comparison of total cost of current system and five strat-egies.

Modelling and Simulation in Engineering 9
Some important conclusions from the study are as fol-lows.
(1) To improve equipment reliability, the critical compo-nents required immediate attention to quantitativelyevaluate reliability centered maintenance based onessential historical data. The study showed that sim-ulation technique could be used as a computer-aidedsolving tool in reliability engineering area. It assistsin decision making regarding maintenance and Leaddefect reduction.
(2) The critical components were selected based on riskpriority number (RPN) from failure mode and effectanalysis (FMEA). Time-to-failure (TTF) and time-to- repair (TTR) of each critical component werecollected from themaintenance reports, failure obser-vations, and daily reports prior to creating simulationmodel.
(3) Simulation model was used for the entire processto define characteristics of components and to imi-tate the machine behavior under different preventivemaintenance intervals and different reliability con-straints. Total cost and Lead ppm were evaluatedto obtain the most suitable preventive maintenanceschedule for the case study.
Conflict of Interests
The authors declare that there is no conflict of interestsregarding the publication of this paper.
References
[1] R. Ruiz, J. Carlos Garcıa-Dıaz, and C. Maroto, “Consider-ing scheduling and preventive maintenance in the flowshopsequencing problem,” Computers and Operations Research, vol.34, no. 11, pp. 3314–3330, 2007.
[2] V. S. Desphande and J. P. Modak, “Application of RCM to amedium scale industry,” Reliability Engineering & System Safety,vol. 77, no. 1, pp. 31–43, 2002.
[3] G. Altuger and C. Chassapis, “Multi criteria preventive mainte-nance scheduling through arena based simulationmodeling,” inProceedings of the Winter Simulation Conference, pp. 2123–2134,December 2009.
[4] P. Tearwattanarattikal, S. Namphacharoen, and C. Chamras-porn, “Using ProModel as a simulation tools to assist plant lay-out design and planning: case study plastic packaging factory,”Songklanakarin Journal of Science and Technology, vol. 30, no. 1,pp. 117–123, 2008.
[5] Chrysler Corporation, Ford Motor Company, and GeneralMotors Corporation,Potential FailureMode and Effects Analysis(FMEA): Reference Manual, Daimler Chrysler Corporation,Ford Motor Company and General Motors Corporation, 1995.

International Journal of
AerospaceEngineeringHindawi Publishing Corporationhttp://www.hindawi.com Volume 2014
RoboticsJournal of
Hindawi Publishing Corporationhttp://www.hindawi.com Volume 2014
Hindawi Publishing Corporationhttp://www.hindawi.com Volume 2014
Active and Passive Electronic Components
Control Scienceand Engineering
Journal of
Hindawi Publishing Corporationhttp://www.hindawi.com Volume 2014
International Journal of
RotatingMachinery
Hindawi Publishing Corporationhttp://www.hindawi.com Volume 2014
Hindawi Publishing Corporation http://www.hindawi.com
Journal ofEngineeringVolume 2014
Submit your manuscripts athttp://www.hindawi.com
VLSI Design
Hindawi Publishing Corporationhttp://www.hindawi.com Volume 2014
Hindawi Publishing Corporationhttp://www.hindawi.com Volume 2014
Shock and Vibration
Hindawi Publishing Corporationhttp://www.hindawi.com Volume 2014
Civil EngineeringAdvances in
Acoustics and VibrationAdvances in
Hindawi Publishing Corporationhttp://www.hindawi.com Volume 2014
Hindawi Publishing Corporationhttp://www.hindawi.com Volume 2014
Electrical and Computer Engineering
Journal of
Advances inOptoElectronics
Hindawi Publishing Corporation http://www.hindawi.com
Volume 2014
The Scientific World JournalHindawi Publishing Corporation http://www.hindawi.com Volume 2014
SensorsJournal of
Hindawi Publishing Corporationhttp://www.hindawi.com Volume 2014
Modelling & Simulation in EngineeringHindawi Publishing Corporation http://www.hindawi.com Volume 2014
Hindawi Publishing Corporationhttp://www.hindawi.com Volume 2014
Chemical EngineeringInternational Journal of Antennas and
Propagation
International Journal of
Hindawi Publishing Corporationhttp://www.hindawi.com Volume 2014
Hindawi Publishing Corporationhttp://www.hindawi.com Volume 2014
Navigation and Observation
International Journal of
Hindawi Publishing Corporationhttp://www.hindawi.com Volume 2014
DistributedSensor Networks
International Journal of