research article cancer incidence in egypt: results of the...
TRANSCRIPT

Research ArticleCancer Incidence in Egypt: Results of the NationalPopulation-Based Cancer Registry Program
Amal S. Ibrahim,1 Hussein M. Khaled,2 Nabiel NH Mikhail,3
Hoda Baraka,4 and Hossam Kamel2
1 Department of Biostatistics and Cancer Epidemiology, National Cancer Institute, Cairo University, Cairo, Egypt2 Department of Medical Oncology, National Cancer Institute, Cairo University, Cairo, Egypt3 Department of Biostatistics and Cancer Epidemiology, South Egypt Cancer Institute, Assiut University, Assiut, Egypt4Department of Computer Engineering, Faculty of Engineering, Cairo University, Giza, Egypt
Correspondence should be addressed to Amal S. Ibrahim; [email protected]
Received 7 June 2014; Revised 1 September 2014; Accepted 7 September 2014; Published 21 September 2014
Academic Editor: Lance A. Liotta
Copyright © 2014 Amal S. Ibrahim et al. This is an open access article distributed under the Creative Commons AttributionLicense, which permits unrestricted use, distribution, and reproduction in any medium, provided the original work is properlycited.
Background. This paper aims to present cancer incidence rates at national and regional level of Egypt, based upon results ofNational Cancer Registry Program (NCRP).Methods. NCRP stratified Egypt into 3 geographical strata: lower, middle, and upper.One governorate represented each region. Abstractors collected data from medical records of cancer centers, national tertiarycare institutions, Health Insurance Organization, Government-Subsidized Treatment Program, and death records. Data entry wasonline. Incidence rates were calculated at a regional and a national level. Future projection up to 2050 was also calculated. Results.Age-standardized incidence rates per 100,000 were 166.6 (both sexes), 175.9 (males), and 157.0 (females). Commonest sites wereliver (23.8%), breast (15.4%), and bladder (6.9%) (both sexes): liver (33.6%) and bladder (10.7%) among men, and breast (32.0%)and liver (13.5%) among women. By 2050, a 3-fold increase in incident cancer relative to 2013 was estimated.Conclusion.These dataare the only available cancer rates at national and regional levels of Egypt. The pattern of cancer indicated the increased burdenof liver cancer. Breast cancer occupied the second rank. Study of rates of individual sites of cancer might help in giving clues forpreventive programs.
1. Introduction
Egypt was completely lacking incidence rates at national leveluntil the results given in the current report were obtained.Available statistics were proportions derived from singleor multicenter hospital registries that could not be usedfor calculation of incidence rates [1–7]. The only publishedincidence rates are those from a cancer registry in onedistrict inNile delta (Gharbiah governorate).The last internalreports of this registry are for 2002 [8, 9]. Incidence ratesup to 2007 were published in Volumes IX and X of CancerIncidence in Five Continents [10, 11], date of end of registryactivities due to failure of sustainability. The published crudeand age-standardized incidence rates from that registry are96.5 and 132.6/100,000 males and 97.3 and 122.1/100,000
females. The commonest sites of cancer in males are liver(18.7%), bladder (12.7%), non-Hodgkin’s lymphoma (11.0%)and trachea, bronchus, and lung (8.2%). The 4 sites represent50.6% of all cancer in males. The commonest sites in femalesare breast (38.8%), non-Hodgkin’s lymphoma (8.5%), liver(4.6%), and ovary (4.5%); all together represent 56.4% ofcancer in females. There is no mention of rates of both sexestogether. Studies are published using these Gharbiah data upto 2007 and are limited to specific sites of cancer mainlybreast [12–15], gastrointestinal [16–18], hematopoietic [19],bladder [20], and gynecological cancers [21]. None of thesegeographically-limited studies and published rates could beconsidered as representative of Egypt, being based on resultsof one registry in a single delta governorate and do not have
Hindawi Publishing CorporationJournal of Cancer EpidemiologyVolume 2014, Article ID 437971, 18 pageshttp://dx.doi.org/10.1155/2014/437971

2 Journal of Cancer Epidemiology
Behira
Gharbiah
Cairo
Assiut
Aswan
Damietta
Minya
Figure 1:Map of Egypt showing the location of the 5 peripheral reg-istries of the national network of population-based cancer registriesNational Cancer Institute, Cairo, and South Egypt Cancer Institute,Assiut.
an impact on understanding the current situation of cancerat the national level.
The National Cancer Registry Program (NCRP) wasestablished in 2008 and became the only source for cancerincidence in the country [22]. The main objective of thecurrent publication is to present the incidence rates of cancerin Egypt in 2008–2011 based upondata of theNational CancerRegistry Program of Egypt with estimated incidence of thedisease up to 2050.
2. Materials and Methods
For registration purposes, Egypt was stratified into 3 geo-graphical strata (regions), namely, Lower Egypt (north ofCairo), Middle Egypt (south of Cairo), and Upper Egypt(further south, reaching the southern frontier of the country).The current report covered three districts (governorate), eachrepresenting one of the 3 regions, namely, Damietta (Niledelta), Minya (Middle Egypt), and Aswan (Upper Egypt)(Figure 1). A population-based registry was established ineach of the 3 governorates, located in the Ministry of HealthCancer Center.
Trained medical doctors in the 3 registries abstractedrecords from their cancer centers and regularly visited estab-lishments that dealt with cancer within the governorate foractive data collection from medical records. Other sourcesof data were major tertiary centers on the national levelas the National Cancer Institute of Cairo University, Pedi-atric Oncology Hospital in Cairo, and South Egypt CancerInstitute of Assiut University. Data managers in these insti-tutions reported incident cancer cases among residents of
Client tier
Application tier
Database tier
User I User II
Firewall
Clustered
Database server I Database server II(active) (passive)
Storage area network
Internet
(heartbeat)
Application server
(SAN)
User N
Figure 2: The NCRPWeb Based System (3-Tier Architecture).
the 3 governorates that were diagnosed/treated in these insti-tutions.Health InsuranceOrganization and theGovernment-Subsidized Treatment Program periodically supplied theirdata. Death registers in local health directorates were regu-larly checked for cancer deaths from the 3 governorates.
A web-based software was developed for online dataentry, validity checks, and data analysis. The database wascentralized in the Ministry of Communication and Infor-mation Technology server (Figure 2) with backups in theMinistry of Health and the National Cancer Institute. Com-puter checks were achieved using DEPedits Conversionand Check Programs for Cancer Registries software [23].Duplicates were eliminated using the National IdentificationNumber and a clean database was achieved ready for analysis.Registration covered all invasive cancers (behavior code/3),in situ breast cancer (topography code C50. and behaviorcode/2), in situ urinary bladder cancer (topography codeC67. and behavior code/2), and borderline tumors of thebrain (topography code C71. and behavior code/1) [24].
For the current report, we used data from Aswan (2008),Minya (2009), and Damietta (2009–2011) to represent the 3geographical strata of Egypt (Table 1). Crude, age-specific,and world population age-standardized incidence rates were

Journal of Cancer Epidemiology 3
Table 1: Population parameters of the 3 regions of Egypt and corresponding registries used in the current report to calculate regional andnational incidence rates.
Region characteristics Upper Egypt Middle Egypt Lower EgyptRegional Registry Aswan Minia DamiettaRegistration period 2008 2009 2009–2011Registry Population 1,074,131 4,426,528 3,586,056∗∗
Region population∗ 4,645,449 16,161,200 30,342,291∗Based upon 2006 census.∗∗Person years during the registration period.
Table 2: Incidence rates of Cancer in Egypt (/100,000 populations) classified by region and sex for all cancer sites with and withoutnonmelanoma skin cancer (C44).
Males Females All Male : female ratioCrude rate ASR Crude rate ASR Crude rate ASR Crude rate ASR(95% CI) (95% CI) (95% CI) (95% CI) (95% CI) (95% CI)
All sites
(i) Upper Egypt 97.1 142.8 116.9 167.1 107.0 155.0 0.8 : 1 0.9 : 1(89.1–105.8) (133.1–153.2) (108.1–126.5) (156.5–178.4) (101.0–113.3) (147.7–162.6)
(ii) Middle Egypt 109.7 170.0 95.9 132.1 102.9 151.1 1.1 : 1 1.3 : 1(105.4–114.1) (164.7–175.5) (91.1–100.2) (127.4–137.0) (100.0–106.0) (147.5–154.8)
(iii) Lower Egypt 138.5 191.8 131.7 173.3 135.2 182.6 1.1 : 1 1.1 : 1(133.2–144.0) (185.6–198.2) (126.5–137.2) (167.3–179.6) (131.4–139.1) (178.2–187.1)
(iv) Calculated rates ofEgypt
117.3 178.5 111.7 159.1 114.5 169.0 1.1 : 1 1.1 : 1(116.0–118.6) (176.9–180.2) (110.4–113.0) (157.6–160.7) (113.6–115.5) (167.9–170.2)
All sites (excludingnonmelanoma skin cancerC44)
(i) Upper Egypt 96.0 141.0 115.1 163.9 105.5 152.5 0.8 : 1 0.9 : 1(88.1–1104.6) (131.4–151.4) (106.3–124.5) (153.4–175.1) (99.5–111.8) (145.5–160.1)
(ii) Middle Egypt 108.0 167.2 94.9 130.7 101.6 149.0 1.1 : 1 1.3 : 1(103.8–112.3) (162.0–172.6) (90.9–99.1) (126.0–135.6) 98.7–104.6) (145.5–152.6)
(iii) Lower Egypt 136.7 189.1 130.1 170.9 133.5 180.0 1.1 : 1 1.1 : 1(131.5–142.2) (182.9–195.5) (124.8–135.5) (164.9–177.1) (129.7–137.3) (175.7–184.4)
(iv) Calculated rates ofEgypt
115.7 175.9 110.3 157.0 113.1 166.6 1 : 1 1.1 : 1(114.4–117.0) (174.3–177.5) (109.0–111.6) (155.4–158.5) (112.2–114.0) (165.5–167.8)
calculated and expressed/100,000 population. Statistics werepublished at the level of the 3-character ICD-10 codes [10].The format of IARC publication: “Cancer Incidence in FiveContinents, Vol. X” [11], was used for grouping of ICD codes.Statistics for all sites of cancer were expressed twice, withand without nonmelanoma skin cancer (C44). Confidenceintervals were calculated following SEER methodology [25].
We developed a model to use incidence data of thepopulation-based registries of the 3 regions (Lower, Middle,and Upper Egypt) to get incidence rates for the entirecountry. The first step was to apply the age-specific incidencerates of each registry to the population of the stratum itrepresented to get the number per gender of incident casesin different age groups and for all ages together in this regionusing data of Egypt last census [26]. Then, we used thesestatistics to estimate the crude and age specific incidencerates (ASIR) of cancer in the 3 regions together, consideredto be representative of the entire country. These rates wereapplied to the total population of Egypt to get number of
incident cancers and crude rate and ASR (world) at national.This procedure was applied for each cancer site and forall sites together per gender. For projections up to 2050,the ASIRs were applied to the projected population of thecorresponding year to get the number of patients/age group.Crude and ASR (world) could then be obtained. Steps ofcalculations are detailed in the Appendix.
3. Results
3.1. National Incidence Rates and Proportions. The crudeincidence rates on the national level for all sites excludingnonmelanoma skin cancer (C44) were 113.1/100,000 (bothsexes), 115.7/100,000 (males), and 110.3/100,000 (females).The age-standardized rates (world) were 166.6/100,000 (bothsexes), 175.9/100,000 (males), and 157.0/100,000 (females)as shown in Table 2. Proportions, crude, age standardizedincidence rates and detailed age-specific rates of cancer sitesaccording to ICD-10 format are shown in Tables 3 and 4 for

4 Journal of Cancer EpidemiologyTa
ble3:Ca
lculated
age-specificincidence
rates,crud
erates,and
ASR
(World),males,E
gypt
2008–2011.
Site
0–4
5–9
10–14
15–19
20–24
25–29
30–34
35–39
40–4
445–4
950–54
55–59
60–6
465–6
970–74
75+
Crud
erate
ASR
%Lip
——
——
——
0.5
—0.3
—0.8
1.40.6
1.88.7
1.50.3
0.4
0.23%
Tong
ue—
——
——
——
—0.3
1.41.3
3.1
1.91.8
—2.2
0.3
0.5
0.27%
Mou
th—
——
0.1
——
0.2
0.5
0.8
1.52.5
4.6
0.6
2.6
1.4—
0.5
0.6
0.41%
Salivaryglands
——
0.1
—0.1
——
0.2
——
0.7
1.42.0
2.6
4.5
5.2
0.3
0.5
0.25%
Tonsil
——
——
——
——
0.3
——
——
——
——
—0.01%
Other
orop
harynx
——
——
0.1
——
——
—0.4
0.6
—0.8
2.8
—0.1
0.1
0.07%
Nasop
harynx
——
——
0.3
——
0.2
——
3.4
0.4
—3.6
—5.2
0.3
0.4
0.26%
Hypop
harynx
——
—0.1
——
——
0.3
—0.9
1.40.6
—1.4
1.50.2
0.2
0.13%
Pharyn
xun
spec.
——
——
——
0.2
——
1.0—
——
——
1.50.1
0.1
0.07%
Esop
hagus
——
——
0.3
0.2
0.3
—1.4
1.86.1
4.1
11.2
10.8
24.4
14.7
1.42.3
1.20%
Stom
ach
—0.1
0.1
—0.3
0.2
0.7
0.5
2.0
2.6
5.0
6.0
11.9
6.4
21.5
14.1
1.52.3
1.26%
Smallintestin
e0.1
——
——
—0.5
0.5
0.6
0.3
0.4
1.4—
0.8
—1.5
0.2
0.3
0.17%
Colon
——
—0.1
0.3
0.7
2.1
2.5
1.96.5
14.2
11.0
19.8
18.9
31.5
32.6
3.1
4.7
2.63%
Rectum
——
—0.1
0.7
1.20.7
1.22.2
2.0
3.4
4.1
3.4
2.6
8.7
1.51.0
1.30.84%
Anu
s—
——
—0.3
—0.5
0.5
0.6
0.6
—2.1
2.0
1.0—
—0.3
0.3
0.24%
Liver
0.3
0.4
0.4
0.2
0.3
1.31.4
6.1
21.2
76.3
174.2
258.7
323.1
313.8
327.1
363.5
39.5
61.8
33.63%
Gallbladd
erandso
forth
——
——
—0.4
—0.5
0.6
0.6
1.01.0
5.9
1.04.7
7.40.5
0.7
0.40
%Pancreas
——
——
——
1.30.2
2.5
7.79.0
14.9
25.3
26.4
12.7
19.3
2.7
4.2
2.31%
Nose,sin
uses
andso
forth
—0.1
——
——
—0.5
0.3
—1.2
——
—1.4
8.2
0.2
0.3
0.17%
Larynx
——
——
——
0.2
—2.1
2.6
6.6
6.8
18.2
11.0
23.2
32.5
1.93.1
1.58%
Trachea,Bron
chus,Lun
g0.1
—0.1
0.4
0.8
1.21.2
3.0
3.8
12.5
19.3
39.1
49.0
49.3
73.9
76.1
6.7
10.4
5.69%
Other
Thoracicorgans
0.3
——
0.1
0.2
0.2
——
0.6
1.22.8
3.5
3.2
7.19.8
8.9
0.8
1.20.65%
Bone
0.1
1.21.4
0.7
1.80.8
1.01.0
1.42.0
4.2
3.7
13.9
8.6
8.4
15.6
1.92.5
1.62%
Melanom
aofskin
——
——
0.1
0.2
——
0.6
——
0.4
—1.8
2.8
—0.1
0.2
0.11%
Other
skin
0.6
—0.1
—0.3
0.4
0.5
0.5
1.10.6
3.2
4.5
14.0
14.2
18.5
30.4
1.62.6
1.35%
Mesothelio
ma
——
——
——
——
—0.8
0.5
1.4—
0.8
——
0.1
0.2
0.10%
Kapo
sisarcom
a—
——
——
—0.2
——
—1.1
—1.3
0.8
1.4—
0.1
0.2
0.10%
Con
nective,Softtissue
0.3
0.1
0.1
0.6
1.12.0
1.31.3
3.1
3.5
3.6
8.3
4.6
6.1
18.8
2.2
1.72.2
1.47%
Breast
——
——
—0.4
—0.3
2.2
0.3
2.5
3.1
3.4
3.6
2.8
5.9
0.6
0.9
0.51%
Penis
——
——
——
——
——
——
——
——
——
0.00%
Prostate
——
——
—0.2
0.3
—0.3
1.34.1
11.2
24.6
47.5
90.3
216.5
5.0
9.34.27%
Testis
—0.1
——
1.11.2
0.7
1.50.6
0.6
0.4
0.4
0.6
—1.4
2.2
0.5
0.5
0.43%
Other
maleg
enita
l—
——
——
——
——
—0.4
——
0.8
1.4—
—0.1
0.04%
Kidn
ey1.2
0.1
——
—0.2
0.2
0.5
0.5
3.4
6.9
9.87.9
16.9
14.1
22.3
1.82.7
1.53%
Renalp
elvis
——
——
0.1
——
0.2
0.6
0.3
0.4
1.92.0
1.82.8
4.4
0.3
0.4
0.25%
Ureter
——
——
——
——
——
——
——
1.43.0
—0.1
0.04%
Bladder
0.1
0.1
—0.3
0.1
1.21.7
2.2
4.0
9.228.7
68.4
97.2
128.6
194.8
205.6
12.6
21.1
10.71%
Other
urinaryorgans
——
——
——
——
——
——
0.6
——
——
—0.01%
Eye
0.5
0.3
——
——
——
—0.4
0.4
1.80.6
——
—0.2
0.2
0.16%
Brain,
Nervous
tissue
2.9
3.0
1.81.7
1.53.3
4.2
6.8
7.37.3
15.5
14.5
27.2
30.4
46.7
91.4
6.4
9.05.48%
Thyroid
——
——
0.2
0.8
1.21.9
1.13.2
4.5
4.3
6.6
8.7
3.0
—1.1
1.50.95%
Adrenalgland
0.3
0.1
——
——
——
——
—0.6
—0.8
1.4—
0.1
0.1
0.08%
Other
endo
crine
0.5
—0.1
—0.3
——
0.5
0.3
1.00.4
1.30.6
—2.8
—0.3
0.4
0.25%

Journal of Cancer Epidemiology 5
Table3:Con
tinued.
Site
0–4
5–9
10–14
15–19
20–24
25–29
30–34
35–39
40–4
445–4
950–54
55–59
60–6
465–6
970–74
75+
Crud
erate
ASR
%Hod
gkin
disease
0.5
1.71.7
1.51.5
1.4—
0.2
1.72.5
2.0
1.45.3
6.1
2.8
1.51.5
1.71.2
9%Non
-Hod
gkin
lymph
oma
1.11.2
1.51.0
2.2
2.5
2.1
3.6
5.8
16.6
24.4
36.0
33.8
29.5
38.1
28.8
6.4
8.8
5.48%
Immun
oproliferatived
is.—
——
——
——
——
——
——
——
——
—0.00%
Multip
lemyeloma
——
——
——
0.5
0.5
1.10.4
3.1
3.9
8.0
0.8
2.8
2.9
0.6
0.9
0.53%
Lymph
oidleuk
emia
3.9
2.2
0.7
0.2
1.4—
0.7
1.51.1
1.81.5
5.0
6.0
8.9
5.6
—1.8
2.1
1.50%
Myeloid
Leuk
emia
0.8
0.4
0.3
0.8
1.00.4
1.10.7
1.41.8
4.2
3.3
3.4
2.6
4.5
1.51.1
1.30.96%
Leuk
emiaun
spec.
1.01.2
1.10.6
2.1
2.2
1.70.5
2.1
4.7
1.86.0
8.0
3.5
7.320.8
2.1
2.6
1.80%
Other
&un
specified
2.4
2.8
0.9
1.71.3
1.83.3
3.1
6.1
15.0
22.9
25.2
44.9
54.7
64.7
83.6
7.611.2
6.52%
Allsites
Total
17.1
15.4
10.5
10.5
20.1
23.9
30.6
42.8
83.8
195.4
389.6
582.4
793.5
840.2
1096.1
1335.6
117.3
178.5
100.00%
Allsites
butC
44#
16.6
15.4
10.4
10.5
19.8
23.5
30.0
42.4
82.7
194.9
386.4
577.9
779.5
826.0
1077.5
1305.3
115.7
175.9
98.65%
# Incidence
ratesd
ono
tinclude
nonm
elanom
askincancer.

6 Journal of Cancer EpidemiologyTa
ble4:Ca
lculated
age-specificincidence
rates,crud
erates,and
ASR
(World),females,E
gypt
2008–2011.
Site
0–4
5–9
10–14
15–19
20–24
25–29
30–34
35–39
40–4
445–4
950–54
55–59
60–6
465–6
970–74
75+
Crud
erate
ASR
%Lip
——
——
——
——
0.3
1.40.8
0.5
1.60.8
1.34.7
0.2
0.4
0.21%
Tong
ue—
——
——
0.5
——
—0.4
0.4
1.20.7
——
15.4
0.3
0.5
0.26%
Mou
th—
0.1
0.1
——
——
—0.3
1.00.8
0.5
1.42.9
6.1
2.7
0.3
0.5
0.28%
Salivaryglands
——
0.3
——
——
——
0.7
—2.9
0.7
2.9
——
0.2
0.3
0.18%
Tonsil
——
——
——
——
——
——
—2.2
—1.4
—0.1
0.04%
Other
orop
harynx
——
——
——
——
—0.3
—0.7
—0.8
——
—0.1
0.04%
Nasop
harynx
0.1
—0.1
——
——
——
——
—1.6
——
—0.1
0.1
0.06%
Hypop
harynx
——
——
—0.2
—0.4
0.3
1.00.9
0.5
—1.1
——
0.2
0.2
0.16%
Pharyn
xun
spec.
——
——
—0.2
——
——
——
——
——
——
0.01%
Esop
hagus
——
——
—0.2
——
2.0
1.30.8
3.7
11.1
10.6
9.25.4
0.9
1.50.79%
Stom
ach
—0.1
——
——
2.0
1.43.1
5.1
5.7
5.1
9.716.3
18.7
14.8
1.82.7
1.65%
Smallintestin
e—
——
——
——
0.4
—1.9
1.7—
1.45.2
4.8
—0.4
0.5
0.32%
Colon
——
——
0.5
0.5
1.02.4
2.9
7.99.4
7.910.4
25.2
16.2
29.4
2.5
3.8
2.28%
Rectum
——
——
0.1
1.11.2
0.7
1.91.7
1.92.9
3.0
3.9
4.4
5.4
0.8
1.10.72%
Anu
s—
——
——
0.2
——
0.3
—0.5
—1.6
—1.3
—0.1
0.1
0.09%
Liver
1.0—
0.5
——
0.9
2.0
3.3
12.5
25.2
43.2
89.3
129.3
143.9
167.9
150.4
15.1
24.4
13.54%
Gallbladd
erandso
forth
——
——
0.3
—0.5
0.5
0.3
1.32.5
3.3
2.2
3.7
6.9
6.0
0.6
0.9
0.55%
Pancreas
——
——
—0.4
—0.5
0.6
3.0
3.4
8.6
9.018.7
24.4
19.5
1.62.6
1.41%
Nose,sin
uses
andso
forth
0.1
——
——
——
—0.3
0.7
1.21.2
5.4
——
—0.3
0.4
0.23%
Larynx
——
——
——
——
0.3
1.02.0
—3.0
—3.0
2.1
0.3
0.4
0.23%
Trachea,Bron
chus,Lun
g0.7
—0.1
0.1
0.5
2.0
1.01.5
1.76.9
12.3
11.7
15.1
11.3
35.9
38.0
3.0
4.5
2.70%
Other
Thoracicorgans
——
——
——
——
0.8
1.71.6
2.6
1.63.0
1.310.7
0.5
0.7
0.42%
Bone
0.7
0.1
1.12.0
1.40.7
0.7
2.2
0.9
2.3
6.5
6.7
12.0
4.5
2.6
16.9
2.0
2.5
1.80%
Mela
nomao
fskin
——
——
——
——
0.6
——
——
2.2
4.4
—0.1
0.2
0.10%
Other
skin
0.3
——
0.2
—0.4
0.5
—2.0
2.7
1.28.6
10.4
14.0
14.9
11.8
1.42.2
1.24%
Mesothelio
ma
——
——
——
——
——
1.20.5
3.0
1.14.8
—0.2
0.3
0.17%
Kapo
sisarcom
a—
——
——
——
——
——
——
0.8
——
——
0.01%
Con
nective,Softtissue
1.20.3
0.7
0.4
1.52.1
1.71.2
2.0
2.0
2.9
2.4
6.2
3.9
3.1
13.4
1.61.9
1.42%
Breast
——
——
3.1
9.529.2
49.0
86.0
106.2
136.0
172.9
177.4
166.3
138.7
148.6
35.8
48.8
32.04%
Vulva
0.1
—0.1
——
——
——
0.3
—1.0
—0.8
—1.4
0.1
0.1
0.09%
Vagina
——
——
——
——
——
—1.0
3.0
3.3
—1.4
0.2
0.3
0.14%
CervixUteri
——
——
—0.2
0.2
—0.6
3.6
6.5
9.18.3
10.5
1—9.4
1.32.0
1.17%
Corpu
sUteri
——
——
——
0.5
0.2
0.6
1.30.7
8.1
4.3
3.0
3.0
12.1
0.7
1.10.62%
Uterusu
nspec.
——
—0.5
1.20.4
0.7
0.5
1.81.6
11.1
9.521.5
20.4
31.4
21.2
2.5
3.9
2.27%
Ovary
——
0.5
0.4
0.8
1.51.5
3.3
8.7
17.2
20.3
24.0
19.6
17.2
2—26.3
4.6
6.3
4.12%
Other
femaleg
enita
l—
——
——
——
0.3
——
——
——
1.32.1
0.1
0.1
0.05%
Placenta
——
——
—0.4
——
——
——
——
——
——
0.03%
Kidn
ey1.5
0.1
——
—0.5
0.8
0.5
0.6
2.9
2.3
1.010.4
10.7
1.37.3
1.11.6
0.97%
Renalp
elvis
—0.3
——
—0.6
—0.2
—0.7
0.4
0.5
1.60.8
——
0.2
0.3
0.19%
Ureter
——
——
——
——
——
——
——
——
——
0.00%
Bladder
0.1
——
0.2
—0.2
—0.7
0.8
5.3
8.2
18.6
20.2
37.8
43.6
53.9
3.3
5.5
2.96%
Other
urinaryorgans
——
——
——
——
——
——
—2.2
——
—0.1
0.03%
Eye
0.1
0.3
——
——
0.5
——
——
1.20.7
0.8
—1.4
0.2
0.2
0.14%
Brain,
Nervous
tissue
3.3
2.1
1.90.8
2.9
0.7
4.5
6.5
6.6
9.511.3
12.1
31.4
26.3
33.1
72.2
5.8
8.0
5.18%

Journal of Cancer Epidemiology 7
Table4:Con
tinued.
Site
0–4
5–9
10–14
15–19
20–24
25–29
30–34
35–39
40–4
445–4
950–54
55–59
60–6
465–6
970–74
75+
Crud
erate
ASR
%Th
yroid
——
——
2.7
2.8
10.2
7.26.4
9.710.2
11.0
9.02.6
10.4
14.2
3.7
4.3
3.28%
Adrenalgland
1.50.1
——
——
——
——
—1.2
——
—1.4
0.2
0.3
0.20%
Other
endo
crine
—0.1
—0.1
0.1
0.3
—0.5
0.3
0.3
0.4
1.00.7
0.8
——
0.2
0.2
0.19%
Hod
gkin
disease
—0.6
0.4
1.91.3
0.4
1.20.7
0.6
0.4
—1.2
3.8
——
—0.8
0.8
0.70%
Non
-Hod
gkin
lymph
oma
0.9
0.7
—1.1
0.8
1.21.7
3.3
3.8
8.6
16.0
23.4
24.1
16.8
31.3
36.7
4.2
6.1
3.80%
Immun
oproliferatived
is.—
——
——
——
——
——
——
——
——
—0.00%
Multip
lemyeloma
——
——
——
——
0.6
1.40.8
1.22.3
4.4
6.1
2.7
0.4
0.6
0.34%
Lymph
oidleuk
emia
2.0
0.7
0.9
0.4
0.5
—0.7
0.7
1.41.0
2.7
1.72.8
3.9
4.4
—1.0
1.20.93%
Myeloid
Leuk
emia
0.5
0.3
0.7
0.2
1.51.5
1.41.0
0.9
0.7
4.0
3.1
6.8
7.5—
4.9
1.31.6
1.14%
Leuk
emiaun
spec.
0.4
0.7
0.7
1.30.9
1.71.5
0.7
1.42.7
3.3
5.5
6.1
8.3
7.414.8
1.72.2
1.55%
Other
&un
specified
1.40.9
1.91.7
2.4
3.9
4.6
5.5
9.612.5
23.8
37.3
39.9
42.1
42.6
70.5
7.710.8
6.93%
Allsites
Total
16.1
7.810.1
11.4
22.4
34.9
69.7
95.2
163.7
255.3
359.1
506.5
633.7
665.8
715.9
850.5
111.7
159.1
100.00%
Allsites
butC
44#
15.8
7.810.1
11.2
22.4
34.6
69.3
95.2
161.6
252.5
357.9
497.8
623.3
651.8
701.0
838.7
110.3
157.0
98.76
%# Incidence
ratesd
ono
tinclude
nonm
elanom
askincancer.

8 Journal of Cancer Epidemiology
0
200
400
600
800
1000
1200
1400
Rate
per
100
,000
pop
ulat
ion
MaleFemale
MalesFemales 157.0/100,000
Crude ratesMalesFemales 110.3/100,000ASR (world)
115.7/100,000
175.9/100,000
75+
0–45
–910
–14
20
–24
25
–29
30
–34
35
–39
40
–44
45
–49
50
–54
55
–59
60
–64
65
–69
70
–74
15
–19
Number of incidence rates do not include nonmelanoma skin cancer
Figure 3: Calculated age specific incidence rates for Egypt 2008–2011.
050
100150200250300350400
Rate
per
100
,000
pop
ulat
ion
MaleFemale
MalesFemales 24.4/100,000
Crude ratesMalesFemales 15.1/100,000ASR (world)
39.5/100,000
61.8/100,000
75+
0–45
–910
–14
20
–24
25
–29
30
–34
35
–39
40
–44
45
–49
50
–54
55
–59
60
–64
65
–69
70
–74
15
–19
Figure 4: Calculated age specific incidence rates for liver cancer inEgypt 2008–2011.
individual sites of cancer and for all sites together by gender.The age-specific rates are represented graphically in Figure 3for all cancers and Figures 4, 5, and 6 for breast, liver, andbladder cancer as examples of some of the more frequentcancer sites.
Table 5 depicts the proportions and rates of the mostfrequent cancer sites by gender. There was predominance ofliver, breast, and bladder cancer that represented approxi-mately 46% of all cancers. Liver and bladder cancers rep-resented approximately 44% of cancer in males. In females,breast and liver cancer occupied the top ranks accounting foraround 45% of all cancers.
3.2. Frequencies and Incidence Rates/Geographical Strata. Thefrequencies of individual sites of cancer and their incidencerates by geographical stratum and sex are detailed in Tables 6and 7. Table 8 depicts the most common sites of cancer thataccounted for approximately 3/4 of cases. For the 2 sexestogether, the top 2 ranks in the 3 regions were liver and breastcancer.The proportions and ASR of liver cancer were highestin Lower Egypt (29.6% and 56.8/100,000), less inMiddle, andleast in Upper Egypt (8.2% and 13.1/100,000).
0
20
40
60
80
100
120
140
160
180
200
Rate
per
100
,000
pop
ulat
ion
MaleFemale
MalesFemales 48.8/100,000
Crude ratesMalesFemales 35.8/100,000
ASR (world)
0.6/100,000
0.9/100,000
75+
0–45
–910
–14
20
–24
25
–29
30
–34
35
–39
40
–44
45
–49
50
–54
55
–59
60
–64
65
–69
70
–74
15
–19
Figure 5: Calculated age specific incidence rates for breast cancer inEgypt 2008–2011.
0
50
100
150
200
250
Rate
per
100
,000
pop
ulat
ion
MalesFemales 5.5/100,000
Crude ratesMalesFemales 3.3/100,000
MaleFemale
ASR (world)
12.6/100,000
21.1/100,000
75+
0–45
–910
–14
20
–24
25
–29
30
–34
35
–39
40
–44
45
–49
50
–54
55
–59
60
–64
65
–69
70
–74
15
–19
Figure 6: Calculated age specific incidence rates for urinary bladdercancer in Egypt 2008–2011.
Among males in the 3 regions, liver and bladder canceroccupied the top 2 ranks. The proportion and ASR of livercancer were highest in Lower Egypt (41.7% and 81.0/100,000)and lowest in Upper Egypt (11.8% and 17.5/100,000). Cancerof the lung occupied the third or fourth ranks representing5–7% of cancers and Non-Hodgkin lymphoma was amongthe 5 most common cancers in Lower Egypt only having aproportion of 6.0% and ASR 10.3/100,000.
Among females, the pattern in the 3 regions was dom-inated by the high frequency of breast cancer and livercancer. Proportion of liver cancer was highest in Lower Egypt(16.4%), less in Middle Egypt, and lowest in Upper Egypt(8.9% and 5.1% resp.).
3.3. Estimated Number of Incident Cancer Cases 2013–2050. During the period 2013–2050, population of Egypt isexpected to increase to approximately 160% the 2013 popula-tion size. Applying the current age-specific incidence rates tosuccessive populations would lead to a progressive increasein number of incident cases from 114,985 in 2013 to 331,169in 2050, approximately 290% of 2013 incidence (Table 9 andFigure 7).This increase reflected both population growth anddemographic change mainly due to ageing of population.

Journal of Cancer Epidemiology 9
Table 5: The most frequent cancers in Egypt estimated using the results of the National Population-Based Registry Program of Egypt 2008–2011.
Site % Crude rate ASR
Males
Liver 33.63 39.5 61.8Bladder 10.71 12.6 21.1Lung# 5.69 6.7 10.4
Non-Hodgkin lymphoma 5.48 6.4 8.8Brain## 5.48 6.4 8.8Prostate 4.27 5.0 9.3
Females
Breast 32.04 35.8 48.8Liver 13.54 15.1 24.4Brain## 5.18 5.8 8.0Ovary 4.12 4.6 6.3
Non-Hodgkin lymphoma 3.80 4.2 6.1Thyroid 3.28 3.7 4.3
Both Sexes
Liver 23.81 27.5 43.6Breast 15.41 17.8 24.3Bladder 6.94 8.0 13.5Brain## 5.29 6.1 8.5
Non-Hodgkin lymphoma 4.64 5.4 7.5Lung# 4.22 4.9 7.5
#Includes trachea, bronchus, and lung tumors.##Includes brain and nervous system tumors.
020,00040,00060,00080,000
100,000120,000140,000160,000180,000
2013
2015
2017
2019
2021
2023
2025
2027
2029
2031
2033
2035
2037
2039
2041
Num
ber o
f cas
es
Year
2043
2045
2047
2049
MaleFemale
Figure 7: Estimated number of cases in Egypt (2013–2050).
Population growth alone would increase the number ofincident cases by 55.2% in 2015. This fraction progressivelydecreased to become 32.8% in 2050. The fraction due toageing gradually increased to reach 67.2% in 2050 (Figure 8).
4. Discussion
When the National Cancer Registry Program of Egypt wasdesigned, there had been a number of challenges that wereaddressed. One of the most important challenges was designof a sample that could be representative of such a big country.Other challenges included complete capture of incidentcancer cases among residents of selected governorates andbest guarantee of quality of data and sustainability of the
0
50,000
100,000
150,000
200,000
250,000
300,000
350,000
Year 2013 Year 2015 Year 2020 Year 2025 Year 2050Year
Increased cases due to change in population structureIncreased cases due to population growth
Num
ber o
f cas
es
Baseline cases (number of cases in 2013)
Figure 8: Estimated number of cases in Egypt (2013–2050) andcauses of the increase in cases.
program to avoid going through survey-like data collectionthat need to be repeated, a methodology that proved to beinappropriate [27].
Dealing with population-based registration, the wordnationalmight be confusing. Actually, andwith the exceptionof very few examples mainly old registries like that ofDenmark and registries in small countries like Singapore,complete national coverage is not accomplished [27, 28]. TheUS is an example of a huge country with 18 population-basedregistries spread over the states without a central national

10 Journal of Cancer Epidemiology
Table 6: Incidence rates/100,000 population of individual cancer sites in Lower, Middle, and Upper Egypt: males.
Primary siteLower Egypt Middle Egypt Upper Egypt2009–2011 2009 2008
Crude ASR % Crude ASR % Crude ASR %Lip 0.4 0.4 0.28% 0.3 0.5 0.24% 0.4 0.6 0.38%Tongue 0.3 0.3 0.20% 0.2 0.4 0.20% 1.1 1.5 1.15%Mouth 0.2 0.3 0.16% 0.8 1.1 0.73% 1.3 1.9 1.34%Salivary glands 0.3 0.4 0.20% 0.4 0.5 0.36% 0.6 0.9 0.57%Tonsil 0.0 0.0 0.00% 0.0 0.1 0.04% 0.0 0.0 0.00%Other oropharynx 0.0 0.0 0.00% 0.2 0.3 0.20% 0.2 0.3 0.19%Nasopharynx 0.5 0.5 0.35% 0.1 0.1 0.12% 0.6 1.0 0.57%Hypopharynx 0.0 0.0 0.00% 0.3 0.5 0.28% 0.6 0.9 0.57%Pharynx unspec. 0.1 0.1 0.04% 0.1 0.1 0.08% 0.2 0.3 0.19%Esophagus 1.0 1.3 0.71% 1.8 3.0 1.61% 3.9 5.5 4.01%Stomach 1.4 2.0 0.98% 1.7 2.5 1.53% 2.4 3.8 2.48%Small intestine 0.1 0.1 0.04% 0.5 0.6 0.44% 0.2 0.2 0.19%Colon 4.0 5.4 2.91% 2.3 3.7 2.10% 2.4 3.7 2.48%Rectum 0.9 1.1 0.67% 1.2 1.6 1.13% 0.7 1.1 0.76%Anus 0.4 0.4 0.28% 0.2 0.2 0.16% 0.4 0.5 0.38%Liver 57.8 81 41.71% 22.4 37.6 20.42% 11.5 17.5 11.83%Gallbladder and so forth 0.5 0.5 0.39% 0.4 0.7 0.32% 1.3 2.2 1.34%Pancreas 3.2 4.4 2.28% 2.1 3.5 1.94% 3.5 5.4 3.63%Nose, sinuses and so forth 0.1 0.1 0.04% 0.4 0.6 0.32% 0.6 0.9 0.57%Larynx 0.8 1.3 0.59% 3.3 5.7 3.03% 3.9 6.0 4.01%Trachea, Bronchus, Lung 7.6 10.1 5.47% 6.3 10.8 5.77% 7.4 11.5 7.63%Other Thoracic organs 1.0 1.3 0.71% 0.8 1.2 0.69% 0.6 0.8 0.57%Bone 1.9 2.4 1.34% 2.3 3.4 2.10% 1.5 1.9 1.53%Melanoma of skin 0.2 0.2 0.12% 0.1 0.1 0.12% 0.0 0.0 0.00%Other skin 1.8 2.7 1.30% 1.7 2.8 1.53% 1.1 1.8 1.15%Mesothelioma 0.0 0.0 0.00% 0.3 0.4 0.24% 0.4 0.6 0.38%Kaposi sarcoma 0.1 0.1 0.08% 0.2 0.3 0.16% 0.0 0.0 0.00%Connective, Soft tissue 2.5 2.6 1.77% 0.5 0.8 0.48% 3.0 3.8 3.05%Breast 0.7 0.8 0.47% 0.4 0.6 0.32% 1.1 1.8 1.15%Penis 0.0 0.0 0.00% 0.0 0.0 0.00% 0.0 0.0 0.00%Prostate 6.7 11.7 4.84% 2.9 5.2 2.66% 5.7 9.2 5.92%Testis 0.5 0.4 0.35% 0.5 0.7 0.48% 0.4 0.5 0.38%Other male genital 0.0 0.0 0.00% 0.1 0.2 0.12% 0.0 0.0 0.00%Kidney 2.2 3.2 1.61% 1.7 2.5 1.53% 0.9 1.3 0.95%Renal pelvis 0.2 0.3 0.12% 0.5 0.8 0.48% 0.4 0.5 0.38%Ureter 0.1 0.1 0.04% 0.0 0.1 0.04% 0.0 0.0 0.00%Bladder 12.2 19 8.82% 15.6 26.4 14.25% 12.2 19.3 12.60%Other urinary organs 0.0 0.0 0.00% 0.0 0.0 0.00% 0.2 0.3 0.19%Eye 0.1 0.2 0.08% 0.3 0.4 0.24% 0.7 0.6 0.76%Brain, Nervous tissue 6.2 8.1 4.49% 8.0 12.5 7.26% 5.2 6.7 5.34%Thyroid 1.3 1.5 0.91% 1.2 1.7 1.05% 0.7 1.1 0.76%Adrenal gland 0.0 0.0 0.00% 0.1 0.2 0.12% 0.6 0.8 0.57%Other endocrine 0.1 0.1 0.08% 0.6 0.8 0.56% 0.4 0.4 0.38%Hodgkin disease 1.6 1.8 1.18% 1.7 2.0 1.53% 1.5 1.5 1.53%Non-Hodgkin lymphoma 8.3 10.3 6.03% 5.2 7.6 4.76% 2.8 4.2 2.86%Immunoproliferative dis. 0.0 0.0 0.00% 0.0 0.0 0.00% 0.0 0.0 0.00%Multiple myeloma 0.7 0.9 0.51% 0.7 1.1 0.61% 0.2 0.3 0.19%Lymphoid leukemia 1.7 2.2 1.22% 1.8 2.3 1.61% 3.0 3.1 3.05%
Journal of Cancer Epidemiology 11
Table 6: Continued.
Primary siteLower Egypt Middle Egypt Upper Egypt2009–2011 2009 2008
Crude ASR % Crude ASR % Crude ASR %Myeloid Leukemia 0.9 1.0 0.63% 1.6 1.8 1.45% 1.9 2.5 1.91%Leukemia unspec. 2.4 3.1 1.73% 2.0 2.6 1.86% 1.1 1.1 1.15%Other & unspecified 5.9 8.3 4.25% 13.9 17.6 12.67% 8.7 13 8.97%All sites Total 138.5 191.8 100.00% 109.7 170 100.00% 97.1 142.8 100.00%All sites but C44# 136.7 189.1 98.70% 108 167.2 98.47% 96 141 98.85%#Incidence rates do not include nonmelanoma skin cancer.
registry [29]. Recently, national incidence rates of Turkeywere published based on results of 8 geographically spreadperipheral registries [30].
With this in mind, Egypt was geographically stratifiedfor registration purposes into 3 regions: Lower Egypt, tothe north of Cairo, and Middle, and Upper Egypt to thesouth. Three governorates were selected from the 3 regionsrepresenting 20.9% of the total population of Egypt. Thegreater Cairo, including the capital city, and Alexandria,the second capital (approximately 18 million population),were not included in the program due to difficulty in datacollection and coverage of a population that daily migratesin and out of these 2 regions. Other regions that were notcovered were frontier governorates; namely Matrooh, NewValley, Red Sea, and Sinai, together representing 3.3% of totalpopulation [26]. This exclusion was due to logistic reasonsbeing mainly inhabited by nomads or internal migrantsworking in the tourist industry.
To ensure complete coverage of incident cancer patientsin the selected governorates, data were actively collected frommedical records of oncology centers within the governoratesand from national referral centers like National Cancer Insti-tute in Cairo. Registration covered health-insured patientsand patients treated on government-subsidized treatmentprogram would minimize under registration considered apoint of strength of the registry. Also, regular check of deathregisters helped to decrease the possibility of under registra-tion. Death certificate only cases (DCO) accounted for almost8% of cases which could be considered an acceptable level fora newly established registry [28].
One of the elements that contributed to the NationalCancer Registry Program of Egypt was the use of a uniquenational identification number for duplicate eliminationto prevent over registration, which is a serious threat topopulation-based registries [7, 28]. A major concern duringthe development of a cancer registry especially population-based, is its sustainability. An alternative that was applied inEurope and the US was to conduct successive cancer surveysas with the US Health Interview and Examination surveys.Evaluation of these surveys was negative and this methodwas not recommended [28]. The main reason for lack ofsustainability is unavailability of needed funding and lackof collaboration of treating physicians [28]. From the verybeginning, the national cancer registry was planned to bea national program and not a project with start and enddates. During all stages of its development it was gradually
incorporatedwithin the infrastructure of the health system togradually become part of everyday routine work [31]. Qualityof data was assured through computer validation and regularmanual checks on the peripheral and central levels.
We also developed a mathematical model to apply theregional age-specific incidence rates to the correspondingpopulation structure to get national estimates of all cancersand for individual cancer sites for any specified year. Math-ematical modeling is a common practice used to estimatenational rates from statistics of regional registries. Recently,a model was developed for china to get national rates basedupon regional registries [32]. The advantage of our Egyptianmodel was use of Egyptian national population-based datawithout importing data of adjacent countries [33].
Nonetheless, the program has its points of weakness. Thedata should be carefully interpreted in view of the short initialphase of registration that would be of better accuracy onsuccessive years [28]. Furthermore, some private patients thatare not covered by the Government-Subsidized TreatmentProgram might escape registration. This would be assumedto be a small proportion. With the rising cost of cancertreatment, most patients would seek government financialsupport which is a constriction right.
The results given in the current report are the first everpublished incidence rates on a national and regional level forEgypt derived from a population-based cancer registry pro-gram. These incidence rates would replace the proportionsthat have always been derived from hospital-based results[1–5]. The results were those of Damietta (Lower Egypt),Minya (Middle Egypt), and Aswan (Upper Egypt). Damiettawas selected to represent the Nile delta instead of Gharbiahregistry that stopped its activities before establishment of theNCRP and needed some time to be restructured to join theprogram. Results of these governorates were used to computeregional rates that were used to get a national estimate basedupon age-specific incidence rates and population structure.
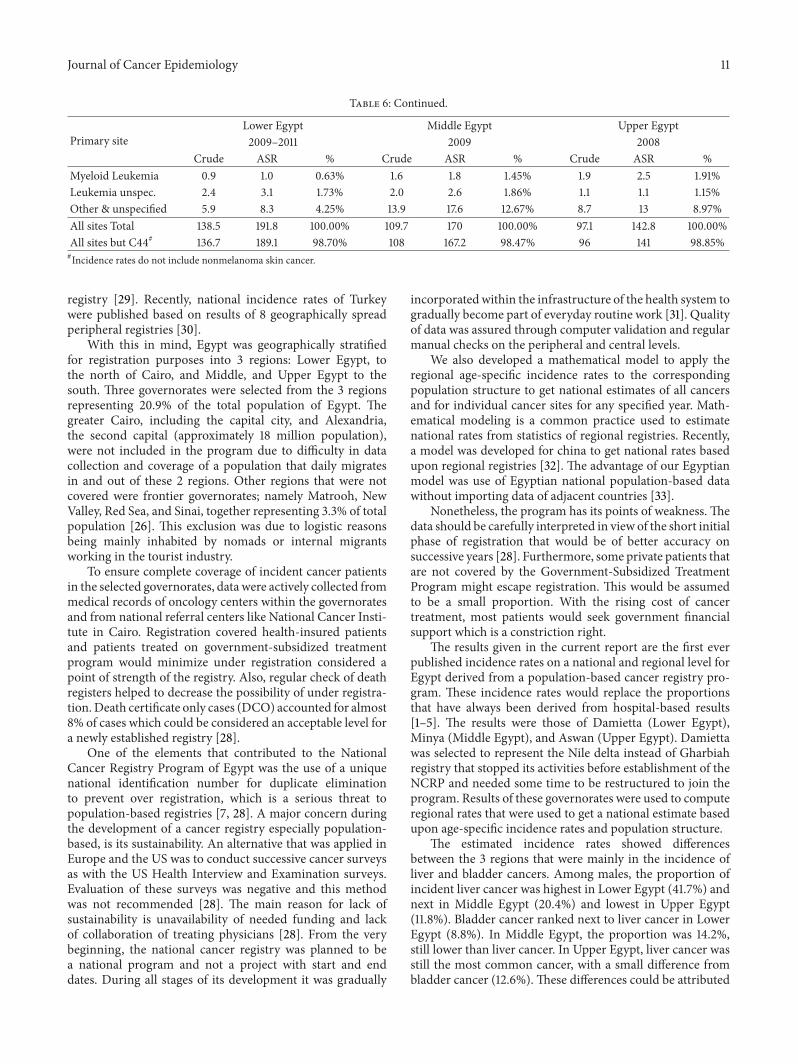
The estimated incidence rates showed differencesbetween the 3 regions that were mainly in the incidence ofliver and bladder cancers. Among males, the proportion ofincident liver cancer was highest in Lower Egypt (41.7%) andnext in Middle Egypt (20.4%) and lowest in Upper Egypt(11.8%). Bladder cancer ranked next to liver cancer in LowerEgypt (8.8%). In Middle Egypt, the proportion was 14.2%,still lower than liver cancer. In Upper Egypt, liver cancer wasstill the most common cancer, with a small difference frombladder cancer (12.6%). These differences could be attributed

12 Journal of Cancer Epidemiology
Table 7: Incidence rates/100,000 population of individual cancer sites in Lower, Middle, and Upper Egypt: females.
Primary siteLower Egypt Middle Egypt Upper Egypt2009–2011 2009 2008
Crude ASR % Crude ASR % Crude ASR %Lip 0.3 0.4 0.26% 0.2 0.4 0.24% 0.0 0.0 0.00%Tongue 0.3 0.5 0.26% 0.3 0.5 0.34% 0.2 0.2 0.16%Mouth 0.1 0.2 0.09% 0.5 0.8 0.53% 0.9 1.5 0.80%Salivary glands 0.2 0.2 0.13% 0.3 0.4 0.29% 0.2 0.4 0.16%Tonsil 0.1 0.1 0.04% 0.0 0.1 0.05% 0.0 0.0 0.00%Other oropharynx 0.0 0.0 0.00% 0.1 0.1 0.10% 0.2 0.3 0.16%Nasopharynx 0.1 0.1 0.04% 0.0 0 0.05% 0.2 0.2 0.16%Hypopharynx 0.0 0.0 0.00% 0.4 0.4 0.38% 0.6 0.9 0.48%Pharynx unspec. 0.0 0.0 0.00% 0.0 0.0 0.05% 0.0 0.0 0.00%Esophagus 0.9 1.2 0.65% 1.2 1.9 1.25% 1.1 1.6 0.96%Stomach 2.3 3.2 1.73% 1.2 1.8 1.25% 1.9 3.1 1.60%Small intestine 0.3 0.5 0.22% 0.4 0.6 0.43% 0.6 0.9 0.48%Colon 3.0 4.2 2.30% 2.2 3.2 2.31% 2.4 3.5 2.08%Rectum 0.9 1.0 0.65% 1.0 1.2 1.01% 0.7 1.3 0.64%Anus 0.1 0.1 0.04% 0.1 0.2 0.14% 0.2 0.3 0.16%Liver 21.6 32.6 16.37% 8.6 13.7 8.95% 6.0 8.7 5.12%Gallbladder and so forth 0.5 0.5 0.35% 0.6 0.9 0.58% 1.9 3.1 1.60%Pancreas 2.1 3.2 1.60% 0.9 1.4 0.91% 1.7 2.3 1.44%Nose, sinuses and so forth 0.3 0.5 0.26% 0.1 0.2 0.14% 0.2 0.2 0.16%Larynx 0.2 0.3 0.17% 0.3 0.4 0.29% 0.4 0.7 0.32%Trachea, Bronchus, Lung 3.7 5.3 2.82% 2.2 3.1 2.26% 2.4 3.8 2.08%Other Thoracic organs 0.6 0.8 0.43% 0.5 0.7 0.48% 0.0 0.0 0.00%Bone 2.0 2.3 1.52% 1.8 2.4 1.92% 3.4 4.4 2.88%Melanoma of skin 0.2 0.3 0.17% 0.0 0.1 0.05% 0.0 0.0 0.00%Other skin 1.7 2.4 1.26% 1.0 1.5 1.06% 1.9 3.1 1.60%Mesothelioma 0.3 0.3 0.22% 0.2 0.3 0.24% 0.4 0.7 0.32%Kaposi sarcoma 0.0 0.0 0.00% 0.0 0.1 0.05% 0.0 0.0 0.00%Connective, Soft tissue 2.3 2.6 1.78% 0.4 0.6 0.38% 1.9 2.2 1.60%Breast 43.8 53 33.22% 25.8 35.6 26.84% 45.3 64.5 38.72%Vulva 0.0 0.0 0.00% 0.3 0.4 0.34% 0.0 0.0 0.00%Vagina 0.1 0.2 0.09% 0.1 0.2 0.14% 0.6 1.0 0.48%Cervix Uteri 1.7 2.4 1.26% 1.0 1.5 1.06% 0.6 0.9 0.48%Corpus Uteri 0.6 0.9 0.43% 0.6 0.9 0.67% 1.7 2.9 1.44%Uterus unspec. 3.7 5.3 2.77% 1.0 1.3 1.06% 2.4 3.8 2.08%Ovary 5.1 6.4 3.90% 3.6 5.0 3.75% 7.1 10.2 6.08%Other female genital 0.0 0.0 0.00% 0.0 0.1 0.05% 0.4 0.6 0.32%Placenta 0.0 0.0 0.00% 0.0 0.0 0.05% 0.2 0.2 0.16%Kidney 1.1 1.6 0.87% 1.2 1.8 1.25% 0.7 1.1 0.64%Renal pelvis 0.2 0.3 0.17% 0.2 0.3 0.19% 0.2 0.2 0.16%Ureter 0.0 0.0 0.00% 0.0 0.0 0.00% 0.0 0.0 0.00%Bladder 3.7 5.9 2.77% 3.1 4.9 3.27% 3.6 5.7 3.04%Other urinary organs 0.1 0.1 0.04% 0.0 0.0 0.00% 0.0 0.0 0.00%Eye 0.1 0.1 0.04% 0.3 0.5 0.34% 0.2 0.2 0.16%Brain, Nervous tissue 5.8 7.4 4.42% 7.4 11.1 7.70% 2.4 2.9 2.08%Thyroid 5.1 5.4 3.90% 1.6 2.1 1.64% 3.6 4.2 3.04%Adrenal gland 0.2 0.3 0.17% 0.2 0.3 0.24% 0.2 0.2 0.16%Other endocrine 0.1 0.0 0.04% 0.5 0.7 0.53% 0.2 0.2 0.16%Hodgkin disease 1.0 0.7 0.74% 1.0 1.0 1.01% 0.9 0.9 0.80%

Journal of Cancer Epidemiology 13
Table 7: Continued.
Primary siteLower Egypt Middle Egypt Upper Egypt2009–2011 2009 2008
Crude ASR % Crude ASR % Crude ASR %Non-Hodgkin lymphoma 5.4 6.7 4.11% 4.2 5.8 4.43% 2.6 3.8 2.24%Immunoproliferative dis. 0.0 0.0 0.00% 0.0 0.0 0.00% 0.0 0.0 0.00%Multiple myeloma 0.7 0.9 0.52% 0.1 0.3 0.14% 0.2 0.0 0.16%Lymphoid leukemia 1.0 1.1 0.74% 1.2 1.6 1.25% 1.5 1.6 1.28%Myeloid Leukemia 0.9 1.1 0.65% 1.7 2.0 1.78% 2.2 3.3 1.92%Leukemia unspec. 1.8 2.4 1.34% 1.6 2.0 1.68% 1.9 2.3 1.60%Other & unspecified 5.9 8.2 4.46% 14.3 15.5 14.86% 9.2 12.9 7.84%All sites Total 131.7 173.3 100.00% 95.9 132.1 100.00% 116.9 167.1 100.00%All sites but C44# 130.1 170.9 98.74% 94.9 130.7 98.94% 115.1 163.9 98.40%#Incidence rates do not include nonmelanoma skin cancer.
Table 8: Proportions and incidence rates of the most frequently observed cancers in the 3 regions of Egypt.
Lower Egypt Middle Egypt Upper Egypt2009–2011 2009 2008
Site % Crude rate ASR Site % Crude rate ASR Site % Crude rate ASR
Males
Liver 41.7 57.8 81.0 Liver 20.4 22.4 37.6 Bladder 12.6 12.2 19.3Bladder 8.8 12.2 19.0 Bladder 14.2 15.6 26.4 Liver 11.8 11.5 17.5NHL 6.0 8.3 10.3 Brain# 7.3 8.0 12.5 Lung## 7.6 7.4 11.5Lung## 5.5 7.6 10.1 Lung## 5.8 6.3 10.8 Leukemia 6.1 6.0 6.7Prostate 4.8 6.7 11.7 Leukemia 4.9 5.4 6.7 Prostate 5.9 5.7 9.2
Females
Breast 33.2 43.8 53.0 Breast 26.8 25.8 35.6 Breast 38.7 45.3 64.5Liver 16.4 21.6 32.6 Liver 8.9 8.6 13.7 Ovary 6.1 7.1 10.2Brain# 4.4 5.8 7.4 Brain# 7.7 7.4 11.1 Liver 5.1 6.0 8.7NHL 4.1 5.4 6.7 Leukemia 4.7 4.5 5.6 Leukemia 4.8 5.6 7.2
Thyroid 3.9 5.1 5.4 NHL 4.4 4.2 5.8 Uterus 3.5 4.1 6.7
Both Sexes
Liver 29.6 40.1 56.8 Liver 15.2 15.6 25.7 Breast 21.6 23.1 33.2Breast 16.1 21.7 26.9 Breast 12.4 12.8 18.1 Liver 8.2 8.8 13.1Bladder 5.9 8.0 12.5 Bladder 9.2 9.5 15.7 Bladder 7.4 7.9 12.5NHL 5.1 6.9 8.5 Brain# 7.5 7.7 11.8 Leukemia 5.4 5.7 7.0Brain# 4.5 6.0 7.8 Leukemia 4.8 4.9 6.2 Lung## 4.6 4.9 7.7
#Includes brain and nervous system tumors.##Includes trachea, bronchus and lung tumors.
to the high prevalence of hepatitis C viral infection (HCV),which is one of the highest prevalence rates worldwide[34, 35]. The distribution of liver cancer in the 3 regionsfollowed the distribution of HCV, which is more frequentin Nile delta with decreasing prevalence going south [34].The main risk factor for bladder cancer in Egypt was urinarySchistosomiasis which was more frequent in Upper Egyptand its prevalence decreased when going north [34]. Despitecontrol of Schistosomiasis, its effect on bladder cancer needstime to disappear. Another difference between the 3 regionswas the proportion of non-Hodgkin lymphoma that wasdistributed in a pattern similar to that of liver cancer [36, 37].
Among females, the pattern in Lower, Middle, and UpperEgypt was dominated by the high frequency of breast cancer(33.8%, 26.8% and 38.7% resp.) and liver cancer (16.4%, 8.9%and 5.1% resp.).This pattern of liver cancer was similar to thatofmaleswith similar relation to the prevalence ofHCV.Other
differences in site distribution between the 3 regions will bedetailed in a separate publication [38].
The national age standardized incidence rates for allcancers in Egypt, excluding nonmelanoma skin cancer,were 175.9/100,000 for males, 157.0/100,000 for females, and166.6/100,000 for both sexes.The age-standardized rates wereintermediate between the rates of more and less developedcountries [33, 39, 40]. For both sexes, the rates for all cancersexcluding nonmelanoma skin cancer were 268.3/100,000for more developed countries and 147.7/100,000 for lessdeveloped countries compared to 166.6/100,000 in Egypt.For males, the age-standardized rates were 308.7/100,000 formore developed countries and 163.0/100,000 for less devel-oped countries compared to 175.9/100,000 in Egypt.The ratesof females were 240.6/100,000 in more developed countriesand 135.8/100,000 in less developed countries compared to157.0/100,000 for Egypt.

14 Journal of Cancer EpidemiologyTa
ble9:Estim
ated
numbero
fcancerc
ases,E
gypt
2013–2050.
2013
2015
2020
2025
2050
Males
Females
Total
Males
Females
Total
Males
Females
Total
Males
Females
Total
Males
Females
Total
Lip
135
126
262
146
135
281
178
164
342
206
202
408
438
427
866
Tong
ue155
175
330
164
185
349
186
231
417
219
296
515
417
763
1180
Mou
th228
163
391
243
178
420
275
216
491
314
261
575
544
528
1071
Salivaryglands
147
108
255
158
117275
189
130
319
222
153
375
495
265
760
Tonsil
631
376
3340
941
5011
5465
13129
142
Other
orop
harynx
4225
6745
2873
5430
8563
37100
132
65198
Nasop
harynx
145
32178
154
34188
171
40211
207
42249
428
68496
Hypop
harynx
7280
152
7685
161
8896
184
102
111
213
200
173
372
Pharyn
xun
spec.
357
4236
743
427
4855
762
948
102
Oesop
hagus
699
485
1184
746
525
1271
897
644
1542
1065
762
1827
2249
1504
3752
Stom
ach
726
969
1695
772
1045
1816
922
1249
2171
1080
1484
2565
2185
2877
5062
Smallintestin
e98
179
277
106
194
300
120
229
349
134
274
408
223
507
730
Colon
1522
1339
2862
1618
1437
3055
1893
1715
3608
2225
2063
4287
4465
4120
8585
Rectum
464
406
871
490
432
922
568
502
1070
645
584
1230
1097
1052
2149
Anu
s133
50183
142
53195
162
65227
178
71249
291
127
418
Liver
1964
68345
27991
20932
9043
29975
24420
10900
35320
28580
12933
41513
59047
26425
85471
Gallbladd
erandso
forth
235
324
559
248
350
598
297
413
710
348
488
835
715
967
1682
Pancreas
1350
876
2226
1440
957
2397
1676
1160
2836
1961
1405
3366
3912
2971
6883
Nose,sin
uses
andso
forth
98136
234
104
144
247
124
170
294
154
186
340
340
322
661
Larynx
933
134
1067
993
142
1136
1194
173
1367
1428
201
1629
3094
395
3489
Trachea,Bron
chus,Lun
g3304
1586
4890
3530
1703
5233
4168
2031
6198
4889
2404
7293
10176
4895
15071
Other
Thoracicorgans
368
260
628
393
277
670
464
335
798
551
415
966
1149
897
2046
Bone
889
957
1846
935
1011
1946
1068
1174
2242
1216
1330
2546
2212
2401
4613
Mela
nomao
fskin
6059
11966
66132
8284
166
95105
200
181
207
388
Other
skin
797
749
1547
853
813
1666
1018
973
1990
1205
1160
2365
2641
2306
4947
Mesothelio
ma
55106
161
58116
174
65143
207
76161
238
135
321
456
Kapo
sisarcom
a60
868
639
7272
1082
8113
95159
28187
Con
nective,Softtissue
801
751
1552
846
787
1633
981
901
1882
1113
1026
2139
1924
1796
3720
Breast
287
17905
18192
306
19105
19411
362
22320
22682
422
25793
26215
807
45243
46050
Vulva
052
520
5656
063
630
7676
0146
146
Vagina
095
950
103
103
0126
126
0147
147
0305
305
CervixUteri
0701
701
0752
752
0882
882
01039
1039
02039
2039
Corpu
sUteri
0392
392
0426
426
0502
502
060
060
00
1256
1256
Uterusu
nspec.
01353
1353
01456
1456
01758
1758
02055
2055
04143
4143
Ovary
02288
2288
02434
2434
02830
2830
03311
3311
05957
5957
Other
femaleg
enita
l0
3030
034
340
4444
055
550
134
134
Placenta
014
140
1414
014
140
1515
018
18Penis
00
00
00
00
00
00
00
0Prostate
2544
02544
2747
02747
3398
03398
4295
04295
10785
010785
Testis
229
0229
240
0240
266
0266
291
0291
425
0425
Other
maleg
enita
l21
021
220
2228
028
330
3373
073
Kidn
ey877
561
1438
934
594
1528
1080
693
1774
1274
801
2076
2628
1487
4115
Renalp
elvis
141
99240
152
103
255
183
115
297
214
126
341
446
196
642

Journal of Cancer Epidemiology 15
Table9:Con
tinued.
2013
2015
2020
2025
2050
Males
Females
Total
Males
Females
Total
Males
Females
Total
Males
Females
Total
Males
Females
Total
Ureter
220
2224
024
310
3141
041
111
0111
Bladder
6362
1872
8234
6852
2038
8891
8228
2481
10709
9746
3016
12762
21783
6554
28337
Other
urinaryorgans
821
298
2331
1027
3711
3546
2272
94Eye
8982
171
9287
180
9896
194
104
108
212
160
195
355
Brain,
Nervous
tissue
3072
2933
6004
3256
3133
6389
3779
3721
7500
4390
4351
8740
8439
8450
16888
Thyroid
547
1759
2306
582
1867
2448
661
2106
2767
748
2363
3111
1298
3814
5113
Adrenalgland
43105
149
46109
155
52113
166
57121
178
102
180
282
Other
endo
crine
129
95224
136
100
236
156
114269
174
125
300
273
188
462
Hod
gkin
disease
647
321
968
673
336
1008
751
371
1123
837
397
1234
1245
527
1772
Non
-Hod
gkin
lymph
oma
3053
2188
5241
3223
2345
5568
3689
2755
6444
4240
3202
7442
7749
6135
13884
Immun
oproliferatived
is.0
00
00
00
00
00
00
00
Multip
lemyeloma
316
200
516
334
218
552
386
264
650
432
321
753
819
644
1463
Lymph
oidleuk
aemia
801
471
1272
841
493
1335
926
551
1477
1000
603
1604
1535
896
2431
Myeloid
Leuk
aemia
511
614
1125
534
642
1176
595
727
1323
666
810
1476
1054
1358
2412
Leuk
emiaun
spec.
965
842
1807
1005
891
1896
1131
1027
2157
1295
1188
2483
2226
2169
4395
Other
&un
specified
3692
3965
7657
3921
4232
8153
4573
4971
9543
5358
5793
11151
10582
11026
21607
Allsites
Total
57558
57426
114985
61288
61495
122783
71759
72496
144255
84045
84679
168723
171494
159675
33116
9Allsites
butC
44#
56761
56677
113438
60435
60683
121117
70742
71523
142265
82840
83519
166358
168854
157369
326223
# Num
bersdo
notinclude
nonm
elanom
askincancer.

16 Journal of Cancer Epidemiology
Table 10: Estimated cancer incidence in the period 2013–2050 and causes of increase.
2013 2015 2020 2025 2050Estimated population 85294388 (100%) 88487396 (103.7%) 96260017 (112.9%) 103742157 (121.6%) 137872522 (161.6%)Number of cases#1 114985 122783 (106.8%) 144255 (125.5%) 168723 (146.7%) 331169 (288.0%)Increased cases from2013#2 7798 (6.8%) 29270 (25.5%) 53738 (46.7%) 216184 (188.0%)
Increased cases due topopulation growth#3 4303 14783 24869 70880
Increased cases due topopulation structurechange#4
3494 14487 28869 145304
% Increase due topopulation growth#5 55.20% 50.50% 46.28% 32.79%
N.B.#1Number of expected cases depending on 2013 rates of incidence.#2Number of increased cases from 2013 number of cases.#3Number of increased cases (from 2013) that is attributed to increase in population number (population growth).#4Number of increased cases (from 2013) that is attributed to change in population structure (aging of population) and not to population growth.#5Percent of increased number of cases (from 2013) that can be attributed to population growth only (not due to change in population structure).
The model used in our study revealed the seriousnessof the liver cancer that ranked first among cancers in males(33.6%) and next to breast cancer. Among females the pro-portion of breast cancer was 32.0% followed by liver cancer(13.5%). The high prevalence of HCV especially genotypeIV would explain this high incidence [34, 35]. The age-standardized rates for liver cancer for both genders were5.4/100,000 in more developed countries, 12.0/100,000 inless developed countries compared to 43.6/100,000 in Egypt.Among males the rates were 8.6/100,000 in more developedcountries, 17.8/100,000 in less developed countries comparedto 61.8/100,000 in Egypt. Among females, the rates were2.7/100,000 (more developed), 6.6/100,000 (less developed),and 24.4/100,000 (Egypt).
Incidence rate of bladder cancer that ranked next toliver cancer in males was also high. The age-standardizedrates are 16.9/100,000 (more developed) and 5.3/100,000(less developed) compared to 21.1/100,000 in Egypt. Breastcancer was the most frequent cancer among females. Theage-standardized rates are 74.1/100,000 (more developed),31.3/100,000 (less developed), and 48.8/100,000 (Egypt).Analysis of individual sites of cancers will be detailed in aseparate publication [38].
Applying the model over successive years for the pro-jected populations showed an increase in number of incidentcases from approximately 115,000 patients in 2013 to morethan 331,000 in 2050, almost 3-fold increase. The fraction ofincrease due to population growth gradually decreased overthe years with a corresponding increase in the fraction dueto demographic transition with ageing of the population.Thecancer problem in Egypt would thus be expected to continuesimply due to the inevitable ageing of the population withbetter standards of health care (Table 10).
Rates estimated by the model developed for the studywere based on certain assumptions that should be consideredin interpretation of results. These assumptions were: (a)constant age-specific rates during the study period; (b) popu-lations of Greater Cairo and Alexandria would be considered
a mosaic of the 3 registration regions and would affect thenumber of incident cases, and not rates; and (c) exclusion offrontier governorates (3.3% of total population of Egypt) thatneed special studies to get reliable cancer statistics.
5. Conclusion
These results are the first ever published incidence rates forEgypt on a national and regional level and clearly demon-strated the seriousness of the cancer problem of Egypt withage-adjusted incidence rates approaching those of the moredeveloped countries. Liver cancer is a serious if not the mostserious cancer problem in Egypt. Nonetheless, these ratesshould be carefully interpreted being based on a short initialphase of registration and a mathematical model that usedregional incidence rates.
Appendix
Statistical Formulas Used in the Analysis
Step 1 (calculation of regional and national incident cases forcensus year 2006/sex). (1) Number of incident cancer cases𝐶 in age group 𝑥/region 𝑖 where 𝑟 is incidence rate and 𝑤 ispopulation size:
𝐶𝑥𝑖= 𝑟𝑥𝑖𝑔∗ 𝑤𝑥𝑖𝑔. (A.1)
(2) Total incident cases in region 𝑖: 𝐶𝑖= ∑𝐶
𝑥𝑖.
(3) Total incident cases in the 3 regions 𝐺: 𝐶𝐺= ∑𝐶
𝑖
where 𝐼 = 1–3.(4) Incident cases in total Egypt𝑀:
𝐶𝑀= ∑𝐶
𝐺∗ (𝑊𝑀/𝑊𝐺) where 𝑊 is 2006 population.
(A.2)
(5) Calculation of national age specific incidence rates𝑟𝑥𝑀= ∑𝐶
𝑥𝑖/𝑊𝑥𝑖for the 3 regions.

Journal of Cancer Epidemiology 17
Step 2 (calculation of regional and national incident cases fora given year/sex). The same procedure was followed applying𝑟𝑥𝑀
calculated above to the population of the year understudy.
Step 3 (future projections). For estimation of incident cancerin a specific year till 2050, the national age specific incidencerates by sex were applied to the corresponding populationstructure [41]. This estimated number would be due topopulation growth and demographic change with aging ofthe population. The fraction due to population growth couldbe calculated using corresponding population sizes. Theremainder of increase in number would be due mainly todemographic change.
List of Abbreviations
ASIR: Age specific incidence rateASR: Age standardized rateDCO: Death certificate onlyHCV: Hepatitis C virusIARC: International Agency for Research on
CancerICD-10: International Statistical Classification of
Diseases and related health problems, 10threvision
NCRP: National Cancer Registry Program ofEgypt
NHL: Non-Hodgkin LymphomaSEER: Surveillance, Epidemiology, and End
Results Program.
Conflict of Interests
The authors declare that there is no conflict of interestsregarding the publication of this paper.
Acknowledgments
The authors acknowledge the important role played bystaff of the Ministry of Communication and Informationtechnology specially Dr. Hesham El Deeb engineers El-SayedAbdelwahid andMohamed Hamid who were actively behindsuccess of the registry. The dedication of data managers whosupervised peripheral registries’ activities during the initialphase of registration, namely, Drs. Amir Bishara (Aswan),HassanAfifi (Minya), TarekHeikal (Damietta), and ProfessorNelly Alieldin (National Cancer Institute, Cairo University)is also acknowledged. Furthermore, this work would havenot been accomplished without the remarkable effort ofabstractors, coders, and supporting staff in participatingregistries.
References
[1] R. Dolbey and A.W. Mooro, “The incidence of cancer in Egypt:an analysis of 671 cases,”The Lancet, vol. 203, no. 5247, pp. 587–590, 1924.
[2] R. Bedwani, F. El-Khwsky, E. Reganathan et al., “Epidemiologyof bladder cancers in Alexandria, Egypt: tobacco smoking,”International Journal of Cancer, vol. 73, pp. 64–67, 1997.
[3] W. Abou-Zeid, F. El-Khwsky, S. Mokhtar, M. Sherif, and N.Mahdy, “Descriptive epidemiology and multivariate survivalanalysis of oral and pharyngeal malignancies in Alexandria,”Journal of the Medical Research Institute, vol. 27, no. 4, pp. 262–270, 2006.
[4] I. El-Attar, Cancer statistics, NCI, 2004, Department of Biostat-ics and Epidemiology, NCI, Cairo, Egypt, 2005, http://www.nci.cu.edu.eg/lectures/NCI2004.ppt.
[5] M. Sherif andA. S. Ibrahim,TheProfile of Cancer in Egypt, CairoUniversity, The National Cancer Institute, The Cancer Registryfor the Metropolitan Cairo Area (CRMCA), 1987.
[6] J. L. Young, “The hospital-based cancer registry,” in CancerRegistration: Principles and Methods, O. M. Jensen, D. M.Parkin, R. MacLennan, C. S. Muir, and R. G. Skeet, Eds., IARCScientific Publications No. 05, 1991.
[7] I. Silava, “Cancer epidemiology: principles and methods,”in Chapter 17: The Role of Cancer Registries, pp. 385–403,International Agency for Research on Cancer, World HealthOrganization, Geneva, Switzerland, 1999.
[8] A. S. Ibrahim,H.Hussein, K. Ismail, A.Hablas, I. Abdel Bar, andM. Ramadan, Cancer Profile in Gharbiah—Egypt, Methodologyand Results, 1999, Gharbiah Population-Based Cancer Registry(GPCR), Cairo, Egypt, 2003.
[9] A. S. Ibrahim, I. A. Seif-Eldein, K. Ismail et al., “Cancer inEgypt, Gharbiah,” Triennial Report of 2000–2002, GharbiahPopulation-Based Cancer Registry, Middle East Cancer Con-sortium, Cairo, Egypt, 2007.
[10] M. P. Curado, B. Edwards, H. R. Shir et al., Eds., Cancer Inci-dence in Five Continents, vol. 9 of IARC Scientific Publication,no. 160, IARC, Lyon, France, 2007.
[11] M. P. Curado, B. Edwards, H. R. Shir et al., Eds., CancerIncidence in Five Continents, Vol. X, IARC Press, Lyon, France,2013, http://ci5.iarc.fr.
[12] K. A. Hirko, A. S. Soliman, A. Hablas et al., “Trends inbreast cancer incidence rates by age and stage at diagnosis ingharbiah, Egypt, over 10 years (1999–2008),” Journal of CancerEpidemiology, vol. 2013, Article ID 916394, 7 pages, 2013.
[13] A. A. Zeeneldin, M. Ramadan, A. A. Gaber, and F. M. Taha,“Clinico-pathological features of breast carcinoma in elderlyEgyptian patients: a comparison with the non-elderly usingpopulation-based data,” Journal of the Egyptian National CancerInstitute, vol. 25, no. 1, pp. 5–11, 2013.
[14] S. Dey, A. S. Soliman, A. Hablas et al., “Urban-rural differencesin breast cancer incidence in Egypt (1999–2006),” Breast, vol. 19,no. 5, pp. 417–423, 2010.
[15] A. S. Soliman, M. Banerjee, A.-C. Lo et al., “High proportionof inflammatory breast cancer in the population-based cancerregistry of gharbiah, Egypt,” Breast Journal, vol. 15, no. 4, pp.432–434, 2009.
[16] A. A. Zeeneldin, M. M. Saber, I. A. S. El-Din, and S. A. Frag,“Small intestinal cancers among adults in an Egyptian district:a clinicopathological study using a population-based cancerregistry,” Journal of the Egyptian National Cancer Institute, vol.25, no. 3, pp. 107–114, 2013.
[17] M. M. Saber, A. A. Zeeneldin, M. A. Samra, and S. A. Farag,“Primary gastrointestinal lymphoma in an Egyptian district: astudy using a population-based cancer registry,” The Journal ofthe Egyptian National Cancer Institute, vol. 25, no. 2, pp. 95–101,2013.

18 Journal of Cancer Epidemiology
[18] D. Veruttipong, A. S. Soliman, S. F. Gilbert et al., “Age distribu-tion, polyps and rectal cancer in the egyptian population-basedcancer registry,” World Journal of Gastroenterology, vol. 18, no.30, pp. 3997–4003, 2012.
[19] C. M. Herzog, S. Dey, A. Hablas et al., “Geographic distributionof hematopoietic cancers in the nile delta of Egypt,” Annals ofOncology, vol. 23, no. 10, pp. 2748–2755, 2012.
[20] S. A. Fedewa, A. S. Soliman, K. Ismail et al., “Incidence analysesof bladder cancer in the Nile delta region of Egypt,” CancerEpidemiology, vol. 33, no. 3-4, pp. 176–181, 2009.
[21] S. Dey, A. Hablas, I. A. Seifeldin et al., “Urban-rural differencesof gynaecological malignancies in Egypt (1999–2002),” BJOG,vol. 117, no. 3, pp. 348–355, 2010.
[22] National Cancer Registry Program of Egypt, http://www.cancerregistry.gov.eg/.
[23] DEPedits©, “Conversion and Check Programs for Cancer Reg-istries software,” http://www.encr.eu/index.php/downloads/depedits.
[24] A. Fritz, C. Percy, A. Jack et al., International Classification ofDiseases for Oncology, World Health Organization, 3rd edition,2000.
[25] “Standardized Incidence Ratio and Confidence Limits,” http://seer.cancer.gov/seerstat/WebHelp/Standardized IncidenceRatio and Confidence Limits.htm.
[26] Central Agency for Public Mobilization and Statistics (CAP-MAS), http://www.capmas.gov.eg/.
[27] SEER Program Self Instructional Manual for Cancer Registries,Book 1: Objectives and Functions of Cancer Registries, SEERProgram, 1999, edited by E. M. Shambaugh, M. A. Weiss , A.Fritz , M. Hurst, C. H. Johnson, M. A. Kruse, and J. Seiffert.
[28] IARC, Cancer Registration: Principles and Methods, vol. 95 ofIARC Scientific Publication, International Agency for Researchon Cancer, Lyon, France, 1991, O. M. Jensen , D. M. Parkin , R.MacLennan , C. S. Muir and R. Skeet, eds.
[29] List of SEER Registries, http://seer.cancer.gov/registries/terms.html.
[30] S. Eser, C. Yakut, R. Ozdemir et al., “Cancer incidence ratesin Turkey in 2006: a detailed registry based estimation,” AsianPacific Journal of Cancer Prevention, vol. 11, no. 6, pp. 1731–1739,2010.
[31] A. S. Ibrahim and N. N. H. Mikhail, Eds., Egypt NationalCancer Registry: Aswan Profile—2008, Publication NumberRR1, National Cancer Registry Program of Egypt, 2010.
[32] H. Zeng, R. Zheng, S. Zhang, X. Zou, and W. Chen, “Femalebreast cancer statistics of 2010 in China: estimates based ondata from 145 population-based cancer registries,” Journal ofThoracic Disease, vol. 6, no. 5, pp. 466–470, 2014.
[33] J. Ferlay, I. Soerjomataram, M. Ervik et al., Globocan 2012: Esti-mated Cancer Incidence, Mortality and PrevalenceWorldwide in2012, vol. 1.0 of IARC CancerBase no. 11, International Agencyfor Research onCancer, Lyon, France, 2010, http://globocan.iarc.fr/.
[34] S. Ezzat, M. Abdel-Hamid, S. Abdel-Latif Eissa et al., “Associ-ations of pesticides, HCV, HBV, and hepatocellular carcinomain Egypt,” International Journal of Hygiene and EnvironmentalHealth, vol. 208, no. 5, pp. 329–339, 2005.
[35] M. Abdel-Hamid, M. El-Daly, V. Molnegren et al., “Geneticdiversity in hepatitis C virus in Egypt and possible associationwith hepatocellular carcinoma,” Journal of General Virology, vol.88, no. 5, pp. 1526–1531, 2007.
[36] K. D. Cowgill, C. A. Loffredo, S. A.-L. Eissa et al., “Case-control study of non-Hodgkin’s lymphoma and hepatitis C virusinfection in Egypt,” International Journal of Epidemiology, vol.33, no. 5, pp. 1034–1039, 2004.
[37] H. Farawela, M. Khorshied, I. Shaheen et al., “The associationbetween hepatitis C virus infection, genetic polymorphisms ofoxidative stress genes and B-cell non-Hodgkin’s lymphoma riskin Egypt,” Infection, Genetics and Evolution, vol. 12, no. 6, pp.1189–1194, 2012.
[38] A. S. Ibrahim, N. N. H. Mikhail, H. Khaled et al., “Cancer inci-dence in Egypt: a closer look to registry results,” In press.
[39] P. Boyle and B. Levin, Eds., World Cancer Report 2008, IARC,Lyon, France, 2008.
[40] F. Bray, A. Znaor, P. Cueva et al., Planning and Developing Pop-ulation-based Cancer Registration in Low- and Middle-IncomeSettings, IARC, 2014.
[41] United States Census Bureau, International Data Base, http://www.census.gov/population/international/data/idb/informa-tionGateway.php.

Submit your manuscripts athttp://www.hindawi.com
Stem CellsInternational
Hindawi Publishing Corporationhttp://www.hindawi.com Volume 2014
Hindawi Publishing Corporationhttp://www.hindawi.com Volume 2014
MEDIATORSINFLAMMATION
of
Hindawi Publishing Corporationhttp://www.hindawi.com Volume 2014
Behavioural Neurology
EndocrinologyInternational Journal of
Hindawi Publishing Corporationhttp://www.hindawi.com Volume 2014
Hindawi Publishing Corporationhttp://www.hindawi.com Volume 2014
Disease Markers
Hindawi Publishing Corporationhttp://www.hindawi.com Volume 2014
BioMed Research International
OncologyJournal of
Hindawi Publishing Corporationhttp://www.hindawi.com Volume 2014
Hindawi Publishing Corporationhttp://www.hindawi.com Volume 2014
Oxidative Medicine and Cellular Longevity
Hindawi Publishing Corporationhttp://www.hindawi.com Volume 2014
PPAR Research
The Scientific World JournalHindawi Publishing Corporation http://www.hindawi.com Volume 2014
Immunology ResearchHindawi Publishing Corporationhttp://www.hindawi.com Volume 2014
Journal of
ObesityJournal of
Hindawi Publishing Corporationhttp://www.hindawi.com Volume 2014
Hindawi Publishing Corporationhttp://www.hindawi.com Volume 2014
Computational and Mathematical Methods in Medicine
OphthalmologyJournal of
Hindawi Publishing Corporationhttp://www.hindawi.com Volume 2014
Diabetes ResearchJournal of
Hindawi Publishing Corporationhttp://www.hindawi.com Volume 2014
Hindawi Publishing Corporationhttp://www.hindawi.com Volume 2014
Research and TreatmentAIDS
Hindawi Publishing Corporationhttp://www.hindawi.com Volume 2014
Gastroenterology Research and Practice
Hindawi Publishing Corporationhttp://www.hindawi.com Volume 2014
Parkinson’s Disease
Evidence-Based Complementary and Alternative Medicine
Volume 2014Hindawi Publishing Corporationhttp://www.hindawi.com