research article short-time fourier transform and decision
TRANSCRIPT

Research ArticleShort-Time Fourier Transform and Decision Tree-BasedPattern Recognition for Gas Identification Using TemperatureModulated Microhotplate Gas Sensors
Aixiang He,1,2 Jun Yu,1 Guangfen Wei,2 Yi Chen,1 Hao Wu,1 and Zhenan Tang1
1School of Electronic Science and Technology, Key Laboratory of Liaoning for Integrated Circuits Technology,Dalian University of Technology, Dalian 116024, China2School of Information and Electronics Engineering, Shandong Institute of Business and Technology, Yantai 264005, China
Correspondence should be addressed to Guangfen Wei; [email protected] and Zhenan Tang; [email protected]
Received 19 November 2015; Revised 6 January 2016; Accepted 8 February 2016
Academic Editor: Oleg Lupan
Copyright © 2016 Aixiang He et al. This is an open access article distributed under the Creative Commons Attribution License,which permits unrestricted use, distribution, and reproduction in any medium, provided the original work is properly cited.
Because the sensor response is dependent on its operating temperature, modulated temperature operation is usually applied ingas sensors for the identification of different gases. In this paper, the modulated operating temperature of microhotplate gassensors combined with a feature extraction method based on Short-Time Fourier Transform (STFT) is introduced. Because thegas concentration in the ambient air usually has high fluctuation, STFT is applied to extract transient features from time-frequencydomain, and the relationship between the STFT spectrum and sensor response is further explored. Because of the low thermal timeconstant, the sufficient discriminatory information of different gases is preserved in the envelope of the response curve. Featureinformation tends to be contained in the lower frequencies, but not at higher frequencies. Therefore, features are extracted fromthe STFT amplitude values at the frequencies ranging from 0Hz to the fundamental frequency to accomplish the identificationtask. These lower frequency features are extracted and further processed by decision tree-based pattern recognition. The proposedmethod shows high classification capability by the analysis of different concentration of carbon monoxide, methane, and ethanol.
1. Introduction
An electronic nose is an instrument that imitates the func-tionalities of biological olfactory, which typically consists ofan array of chemical sensors (usually gas sensors) and a pat-tern recognition system [1–3].The electronic noses have beenapplied in some fields where odors or odorless volatiles andgases are thought to play roles [4], such as disease diagnosis[5], food quality [6, 7], agricultural applications [8], environ-mental monitoring [9, 10], and automotive industry [11].
The selectivity and sensitivity of most gas sensors are dra-matically dependent on the operating temperature, since thereaction rate of different analytes and the stability of surface-adsorbed oxygen species are a function of temperature. Oper-ating temperature modes of sensors can be divided into twocategories: (i) the constant operating temperature (e.g., theheating voltage is set to 5V) and (ii) temperature modulation
(e.g., the sensors are driven by self-adapted or periodic heat-ing voltages) [12–15]. Temperaturemodulation alters reactionkinetics at the sensor surface [16].Measuring the conductivityof a metal-oxide chemical sensor at different temperaturescan provide a wealth of discriminatory information. Theprevious works have showed that temperature modulation ofsensors can improve selectivity [17–19], while more compli-cated algorithms are required [20]. In the last ten years, thefocus has been on analysis of dynamic sensor signals [21–24], and the Fast Fourier Transform (FFT) or the DiscreteWavelet Transform (DWT) [25, 26] for feature extraction hasbeen frequently used. Many scholars used the FFT transformto extract the harmonic components as the features (e.g.,Vergara and coworkers computed the absolute values of FFTand extracted the values of six harmonics corresponding tosix modulating frequencies) [27]. However, these harmoniccomponents are heavily dependent on the frequency of
Hindawi Publishing CorporationJournal of SensorsVolume 2016, Article ID 7603931, 12 pageshttp://dx.doi.org/10.1155/2016/7603931

2 Journal of Sensors
500𝜇m
(a) (b)
Figure 1: The photos of microhotplate gas sensor arrays. (a) SEM photo of a four-element gas sensor array. Each sensor element is a squarefreestanding membrane supported by four arms. A tungsten thin film resister is embedded in the membrane acting as both heater andthermometer. The SnO
2sensitive film is sputtered on the top of the microhotplate. (b) Microhotplate gas sensors packaged with DIP16 or
TO5.
the operating temperature [25]. Therefore, a more practicalmethod must be developed to overcome this problem.
In addition, gas molecules are carried by air flow anddistributed by turbulence [28]. Since the gas concentrationin the ambient air usually has high fluctuation over time, itis difficult to extract transient features in this situation. Thesensing in both time and frequency domain is necessarywhileit ismore complicated. Although there have beenmanyworksin a single domain, a limited number of works have beenaddressed to combine both domains.The Short-Time FourierTransform (STFT) is a way to extract the main featuresfrom the time-frequency domain. For example, Nimsuk andNakamoto used the STFT method to improve the capabilityof odor classification in dynamical change of concentrationusing a quartz crystalmicrobalance (QCM) sensor array [29].However, the applicability of STFT method for temperaturemodulated microhotplate gas sensors has not been reportedyet.
In this paper, the STFT is calculated over the responsesof SnO
2microhotplate gas sensors, and the relationship
between the STFT spectrum and sensor response is furtherexplored. The optimal features tend to be contained in thelower frequency responses of the sensor close to directcurrent (DC). Therefore, features are extracted from theSTFT amplitude values at the frequency ranging from 0Hzto the fundamental frequency to fulfill the identificationtask. The gas identification effect of the proposed method isdemonstrated by the analysis of carbon monoxide, methane,and ethanol with different concentrations. Various waveformtypes and periods of the heating voltage are studied, andresults show that it is possible to find the optimal features toobtain excellent identification of the gases studied regardlessof their concentrations. The structure of the paper is asfollows. Section 2 introduces the experimental setup and
the dataset acquiring procedure. Section 3.1 presents themethodology based on STFT to select the optimal features.The recognition results are shown in Section 3.2, and theconclusions of this work are outlined in Section 4.
2. Experimental
2.1. Microhotplate Gas Sensors. The four-element microhot-plate gas sensor arrays are fabricated using complementarymetal-oxide semiconductor (CMOS) and post-CMOS tech-nology [30]. Figure 1(a) shows the photo of a sensor microar-ray and Figure 1(b) shows the packaged gas sensors.
The main body of the sensor is a square freestandingmembrane supported by four bridge arms. In the centermembrane, a tungsten thin film resister that has the snakeshape is designed to monitor the temperature of the micro-hotplate as well as to heat up the membrane. The SnO
2sen-
sitive film is sputtered on the top of the microhotplate, and Ptcatalyst with a thickness of 1 nm is sputtered for improving itsselectivity.
The thermal efficiency of the microhotplate is subse-quently acquired by electrically heating with a digital sourcemeter (Keithley 2400) and measuring the resistance values.The measurement results show that the thermal impedanceof the microhotplate with electrodes and sensitive materialsis about 16∘C/mW.The thermal response of the coated mem-branes is near 8ms (10% to 90% rise time) when working at300∘C [30].
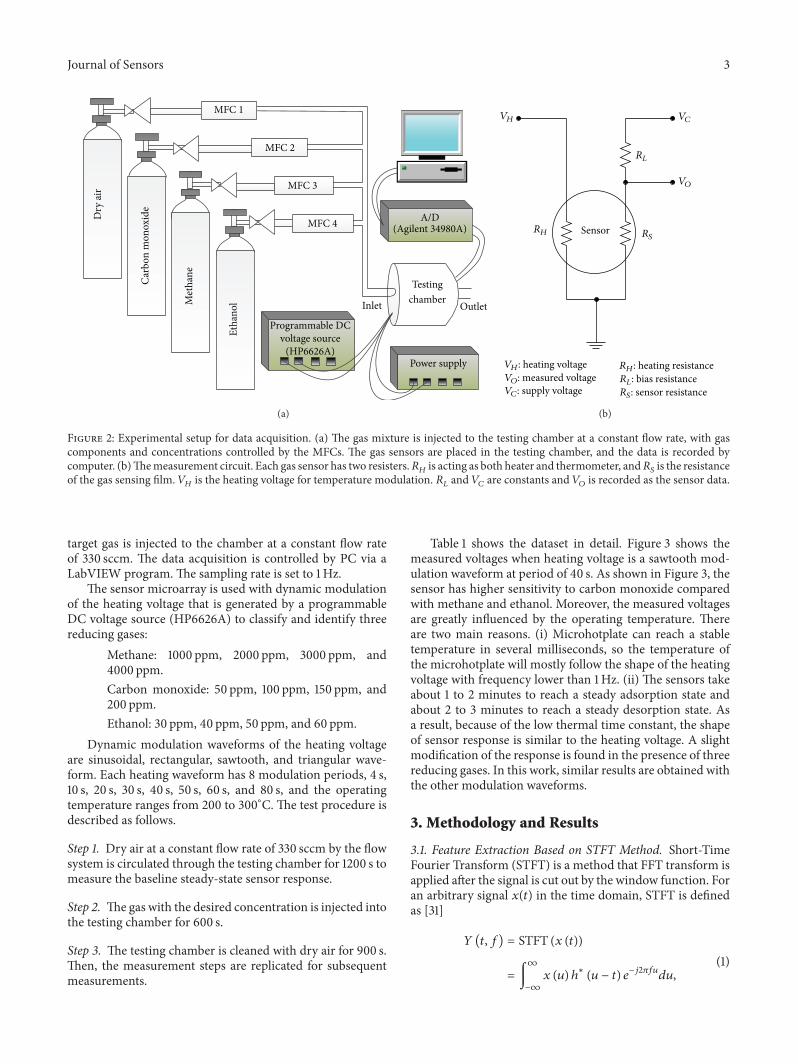
2.2. Experimental Setup and Data Collection. Experimentalsetup and the measurement circuit are showed in Figure 2.The testing chamber containing a microhotplate sensor arrayis connected to a gas mixer controlled by the mass flowcontrollers (MFCs). The chamber volume is 300mL. The
Journal of Sensors 3
Testingchamber Outlet
A/D(Agilent 34980A)
Inlet
Dry
air
Carb
on m
onox
ide
Met
hane
Etha
nol
Programmable DC
Power supply
voltage source(HP6626A)
MFC 1
MFC 2
MFC 3
MFC 4
(a)
Sensor
VH VC
VO
RH
RL
RS
RS: sensor resistanceRL: bias resistanceVO: measured voltage
VC: supply voltage
VH: heating voltage RH: heating resistance
(b)
Figure 2: Experimental setup for data acquisition. (a) The gas mixture is injected to the testing chamber at a constant flow rate, with gascomponents and concentrations controlled by the MFCs. The gas sensors are placed in the testing chamber, and the data is recorded bycomputer. (b)Themeasurement circuit. Each gas sensor has two resisters.𝑅
𝐻is acting as both heater and thermometer, and𝑅
𝑆is the resistance
of the gas sensing film. 𝑉𝐻is the heating voltage for temperature modulation. 𝑅
𝐿and 𝑉
𝐶are constants and 𝑉
𝑂is recorded as the sensor data.
target gas is injected to the chamber at a constant flow rateof 330 sccm. The data acquisition is controlled by PC via aLabVIEW program.The sampling rate is set to 1Hz.
The sensor microarray is used with dynamic modulationof the heating voltage that is generated by a programmableDC voltage source (HP6626A) to classify and identify threereducing gases:
Methane: 1000 ppm, 2000 ppm, 3000 ppm, and4000 ppm.Carbon monoxide: 50 ppm, 100 ppm, 150 ppm, and200 ppm.Ethanol: 30 ppm, 40 ppm, 50 ppm, and 60 ppm.
Dynamic modulation waveforms of the heating voltageare sinusoidal, rectangular, sawtooth, and triangular wave-form. Each heating waveform has 8 modulation periods, 4 s,10 s, 20 s, 30 s, 40 s, 50 s, 60 s, and 80 s, and the operatingtemperature ranges from 200 to 300∘C. The test procedure isdescribed as follows.
Step 1. Dry air at a constant flow rate of 330 sccm by the flowsystem is circulated through the testing chamber for 1200 s tomeasure the baseline steady-state sensor response.
Step 2. Thegas with the desired concentration is injected intothe testing chamber for 600 s.
Step 3. The testing chamber is cleaned with dry air for 900 s.Then, the measurement steps are replicated for subsequentmeasurements.
Table 1 shows the dataset in detail. Figure 3 shows themeasured voltages when heating voltage is a sawtooth mod-ulation waveform at period of 40 s. As shown in Figure 3, thesensor has higher sensitivity to carbon monoxide comparedwith methane and ethanol. Moreover, the measured voltagesare greatly influenced by the operating temperature. Thereare two main reasons. (i) Microhotplate can reach a stabletemperature in several milliseconds, so the temperature ofthe microhotplate will mostly follow the shape of the heatingvoltage with frequency lower than 1Hz. (ii) The sensors takeabout 1 to 2 minutes to reach a steady adsorption state andabout 2 to 3 minutes to reach a steady desorption state. Asa result, because of the low thermal time constant, the shapeof sensor response is similar to the heating voltage. A slightmodification of the response is found in the presence of threereducing gases. In this work, similar results are obtained withthe other modulation waveforms.
3. Methodology and Results
3.1. Feature Extraction Based on STFT Method. Short-TimeFourier Transform (STFT) is a method that FFT transform isapplied after the signal is cut out by the window function. Foran arbitrary signal 𝑥(𝑡) in the time domain, STFT is definedas [31]
𝑌 (𝑡, 𝑓) = STFT (𝑥 (𝑡))
= ∫
∞
−∞
𝑥 (𝑢) ℎ∗(𝑢 − 𝑡) 𝑒
−𝑗2𝜋𝑓𝑢𝑑𝑢,
(1)
4 Journal of Sensors
Table 1: The dataset in detail.
Heating waveform and period (s) Number of samplesMethane Carbon monoxide Ethanol Total
Sinusoid 128 128 128 3844, 10, 20, 30, 40, 50, 60, and 80Rectangle 128 128 128 3844, 10, 20, 30, 40, 50, 60, and 80Sawtooth 128 128 128 3844, 10, 20, 30, 40, 50, 60, and 80Triangle 128 128 128 3844, 10, 20, 30, 40, 50, 60, and 80
0 200 400 600 800 1000 1200 1400 16007
7.27.47.67.8
88.28.48.68.8
9
Time (s)
Out
put v
olta
ge (V
)
Carbon monoxideMethaneEthanol
(a)
0 500 1000 15006.2
6.4
6.6
6.8
7
7.2
7.4
7.6
7.8
Hea
ting
volta
ge (V
)
Time (s)
(b)
Figure 3:The typical output voltages and heating voltage. (a)The output voltages when the sensor is exposed in three analytes: 50 ppm carbonmonoxide, 2000 ppm methane, and 30 ppm ethanol, respectively. (b) The heating voltage is sawtooth modulation waveform at 40 s periods.
where𝑥(𝑡) is the original signal in time domain. ℎ(𝑡) is a STFTwindow function with 𝑡 = 0 as the center, and the length ofℎ(𝑡) is 𝐿, 0 < 𝐿 ≤ 1500. In this paper, 𝐿 is 1/4 of the totallength of 𝑥(𝑡). That is, 𝐿 = 375.
Then, 𝑌(𝑡, 𝑓) can be described by the following matrix:
𝑌 (𝑡, 𝑓) =
[[[[[[
[
𝑦1,1
𝑦1,2
⋅ ⋅ ⋅ 𝑦1,𝑛
𝑦2,1
𝑦2,2
⋅ ⋅ ⋅ 𝑦2,𝑛
.
.
....
.
.
.
𝑦𝑚,1
𝑦𝑚,2
⋅ ⋅ ⋅ 𝑦𝑚,𝑛
]]]]]]
]
, (2)
where 𝑦𝑖,𝑗is the STFT value. The frequency of 𝑖th row is 𝑓
𝑖=
𝑖/𝑁. In this paper, a 1024-point FFT transform is used. Thatis, 𝑁 = 1024, 𝑚 = 1024, 𝑛 = 1500.
In order to reduce the drift of the sensors and the back-ground noise, the sensor responses need to be preprocessedby 𝑥(𝑡) = (𝑉gas(𝑡) − 𝑉air)/𝑉air, where 𝑉gas(𝑡) and 𝑉air are themeasured voltages in gas and in air, respectively.
Figure 4 shows the STFT amplitude spectrum of thesensor response with rectangularmodulation waveform at 4 speriod.The STFT amplitude values vary with time at differentfrequencies. The 𝑥-coordinate of 600 s is the dividing line offeature vectors. The curve rises up fast on the left side anddescends down quickly on the right side. The essence of thisphenomenon is mainly related with the sensor resistance.The reducing gas is injected into the chamber in the first600 s, which leads to the decrease of the sensor resistance.Thedry air is injected into the chamber from the time of 600 sto 1500 s, and sensor resistance gradually increases. At thesame time, Figure 4 shows the distribution of frequency. It ismainly composed of a 0.25Hz fundamental wave frequencyand some lower frequency responses close to DC, and, withthe increasing of frequency, the amplitude spectrum rapidlydecreases to 0.
In order to extract the optimal features, the frequency dis-tribution of the sensor responses should be clearly analyzed.As seen from Figure 5, the frequency distribution obtainedby STFT shows that the DC component (𝑓 = 0Hz) is

Journal of Sensors 5
The S
TFT
ampl
itude
Frequency (Hz) Time (s)
2.5
2
1.5
1
0.5
2.5
2
1.5
1
0.5
0
0.5
0
−0.5 0
500
1000
1500
(a)
The S
TFT
ampl
itude
Frequency (Hz) Time (s)
2.5
2
1.5
1
0.5
2.5
2
1.5
1
0.5
0
0.5
0
−0.5 0
500
1000
1500
quency (s)0
500
1000
1
(b)
The S
TFT
ampl
itude
Frequency (Hz) Time (s)
2.5
2
1.5
1
0.5
2.5
2
1.5
1
0.5
0
0.5
0
−0.5 0
500
1000
1500equency (s)0
500
1000
15
(c)
Figure 4: The STFT amplitude spectrums of sensor responses to three analytes modulated with the rectangular modulation waveform at 4 speriod. Hann window is used as the window function.The length of the window function is 375. (a) 150 ppm carbonmonoxide; (b) 3000 ppmmethane; (c) 50 ppm ethanol.
0 0.1 0.2 0.3 0.4 0.50
0.05
0.1
0.15
0.2
0.25
0.3
0.35
Frequency (Hz)
Am
plitu
de
T = 4 sT = 10 sT = 40 s
Figure 5:The frequency distributions of sensor responses (150 ppmcarbonmonoxide) are mainly composed of a fundamental wave andsome harmonic waves.
heavily dependent on the steady-state response associatedwith the gas concentration. This coefficient is not used foridentification task among different gases, since the systemaims at identifying the gas regardless of its concentration.
Suppose 𝑓0is the fundamental frequency and 𝑇 is the
period of heating voltage, the fundamental frequency willbe 𝑓0
= 1/𝑇, and the harmonics have frequencies of 2𝑓0,
3𝑓0, 4𝑓0, . . ., and so forth. Harmonic frequencies are equally
spaced by the width of the fundamental frequency and canbe found by repeatedly adding that frequency. As shownin Figure 5, the harmonic frequency depends much on theperiod of the heating voltage. Therefore, when the period ofthe heating voltage changes dynamically, for example, self-adapted operating temperature, the harmonics are not usedfor the recognition task.
In fact, because of the low thermal time constant, thesufficient discriminatory information is preserved in theenvelope of the response curve, but not at higher frequencies.The optimal features tend to be contained in the lowerfrequency responses of the sensor close to DC. Therefore,

6 Journal of Sensors
Table 2: The recognition accuracy for the rectangle waveform (decision tree classifier and 12-fold cross-validation are applied to the iden-tification of gases) (%).
Frequency selected (mHz) Feature selected Window functionBoxcar Triangle Blackman Taylor Tukey Hann Hamming Gaussian
0.97 𝑉2
96.88 96.88 94.79 93.75 96.88 94.79 90.63 95.831.94 𝑉
397.92 93.75 95.83 96.88 97.92 92.71 95.83 96.88
2.91 𝑉4
97.92 95.83 95.83 97.92 97.92 94.79 97.92 94.793.88 𝑉
595.83 97.92 88.54 97.92 96.88 90.63 96.88 93.75
4.85 𝑉6
94.79 95.83 92.71 97.92 92.71 98.96 94.79 96.885.82 𝑉
793.75 95.83 98.96 100 95.83 97.92 100 96.88
6.79 𝑉8
92.71 94.79 97.92 92.71 91.67 96.88 90.63 96.887.76 𝑉
996.88 85.42 100 92.71 86.46 89.58 94.79 96.88
8.73 𝑉10
83.33 86.46 95.83 84.38 87.5 95.83 85.42 94.799.7 𝑉
1187.5 90.63 91.67 84.38 81.25 86.46 94.79 88.54
10.67 𝑉12
79.17 90.63 88.54 76.04 84.38 84.38 87.5 84.38
features are extracted from the STFT amplitude values at thefrequency ranging from 0Hz to the fundamental frequency𝑓0to finish the identification task.The 𝑥-coordinate of the fundamental frequency is 𝑙 =
𝑁/(𝑇 ⋅ 𝑓𝑠), where 𝑇 is the period of heating voltage and 𝑓
𝑠
is the sampling rate. In this work, 𝑓𝑠
= 1Hz, 𝑁 = 1024.Because themaximummodulation period is 80 s, the smallestfundamental frequency 𝑓
0is 12.5mHz, and the correspond-
ing 𝑥-coordinate value is 𝑙 = 12. As a result, 11 frequenciesthat range from 0.97 to 10.67mHz with 0.97mHz intervalcan be selected, and the corresponding feature vectors are𝑉𝑖= [|𝑦𝑖,1| |𝑦
𝑖,2| ⋅ ⋅ ⋅ |𝑦
𝑖,𝑛|], 2 ≤ 𝑖 ≤ 12. Figure 6 shows the
feature vectors of 11 frequencies for 3 analytes.
3.2. Decision Tree-Based Pattern Recognition. Decision tree isone of themost well-knownmethods used for extracting clas-sification rules from data [32]. As for classification problems,decision tree is a top-down process, finding classificationrules according to the nodal path to a leaf node. Firstly, getthe branches down from the node, and then get the labels ofthe samples at the leaf node by comparing the attributes of theinternal nodes. Each child node is divided again accordingto the comparison of attribute values. Repeat the above stepsuntil it reaches the classification criteria [33, 34].
There are many window functions with different shapes.Short-Time Fourier Transform is also defined as GaborTransform if Gaussian window function is selected. Windowfunction makes the STFT observe the features of the sensorresponses from time-frequency domain. Aimed at high timeresolution, a narrow window function should be selected.Aimed at high frequency resolution, a wide window functionshould be selected. Hence, it is very important to select theshape and length of the window function. In this work, 𝐿 is1/4 of the total length of the measured voltage (𝐿 = 375).
The effects of 8 window functions are tested.The windowfunctions are Boxcar window, Hamming window, Hann win-dow, Gaussian window, Taylor window, Blackman window,Tukey window, and Triangle window.
The specific process of the algorithm for each heatingwaveform is summarized as follows: (1) select a desired
window function (e.g., the hamming window function), andcalculate the optimal feature vectors 𝑉
𝑖, (2 ≤ 𝑖 ≤ 12) of all
samples by STFT method; (2) reduce the dimensions of thevector 𝑉
𝑖, (2 ≤ 𝑖 ≤ 12) by PCA, and only retain the first
10 principal components; (3) put each feature vector into thedecision tree classifier for pattern recognition, respectively;(4) the process described is replicated for the other windowfunctions.
Meanwhile, the classifier uses 12-fold cross-validationmethod to test the robustness of the algorithm. The originalsample is randomly partitioned into 12 equal sized sub-samples. Of the 12 subsamples, a single subsample is retainedas the validation data for testing themodel, and the remaining11 subsamples are used as training data. The cross-validationprocess is then repeated 12 times, with each of the 12 sub-samples used exactly once as the validation data. The 12results from the folds can then be averaged to produce a singleestimation.
Tables 2–5 show the recognition accuracy of the first 11feature vectors for 4 heating waveforms. For the rectangularwaveform, the best window function is Hamming or Taylorwindow function and the selected frequency is 5.82mHz. Forthe sawtooth waveform, the best choice is Taylor windowfunction and frequencies range from 3.88 to 7.76mHz. Forthe sinusoidal waveform, we can select Hann window andfrequencies range from 3.88 to 4.85mHz orGaussianwindowand frequencies range from 5.82 to 7.76mHz.
In order to analyze the effect of operating temperaturewaveform, the selected frequencies are extended to the first50 frequencies that are 𝑓
𝑖= 𝑖/1024, (0 ≤ 𝑖 ≤ 49). Their
corresponding feature vectors are 𝑉𝑖, (1 ≤ 𝑖 ≤ 50). Then, we,
respectively, put 𝑉𝑖into decision tree system to identify three
kinds of gases. In the end, the average accuracy rate of eachfrequency with 8 window functions is calculated in order toavoid the influence of the window function waveform. Theaverage accuracy rates of four modulated operating temper-ature waveforms are showed in Figure 7. If the selected fre-quency is lower than 2.91mHz, the accuracy of the rectanglewaveform is highest. If the selected frequency is higher than2.91mHz, the accuracy of the sawtooth waveform is highest.

Journal of Sensors 7
0 200 400 600 800 1000 1200 1400 16000
0.5
1
1.5
2
2.5
3
Time (s)
Am
plitu
de
Carbon monoxideMethaneEthanol
(a)
0 200 400 600 800 1000 1200 1400 16000
0.5
1
1.5
2
2.5
Time (s)
Am
plitu
de
Carbon monoxideMethaneEthanol
(b)
0 200 400 600 800 1000 1200 1400 16000
0.5
1
1.5
Time (s)
Am
plitu
de
Carbon monoxideMethaneEthanol
(c)
0 200 400 600 800 1000 1200 1400 1600Time (s)
Am
plitu
de
Carbon monoxideMethaneEthanol
0.8
0.7
0.6
0.5
0.4
0.3
0.2
0.1
0
(d)
0 200 400 600 800 1000 1200 1400 1600Time (s)
Am
plitu
de
Carbon monoxideMethaneEthanol
0
0.05
0.1
0.15
0.2
0.25
0.3
0.35
0.4
0.45
(e)
0 200 400 600 800 1000 1200 1400 1600Time (s)
Am
plitu
de
Carbon monoxideMethaneEthanol
0
0.05
0.1
0.15
0.2
0.25
(f)
Figure 6: Continued.

8 Journal of Sensors
0 200 400 600 800 1000 1200 1400 1600Time (s)
Am
plitu
de
Carbon monoxideMethaneEthanol
0
0.02
0.04
0.06
0.08
0.1
0.12
0.14
0.16
(g)
0 200 400 600 800 1000 1200 1400 1600Time (s)
Carbon monoxideMethaneEthanol
0
0.02
0.04
0.06
0.08
0.1
0.12
Am
plitu
de
(h)
0 200 400 600 800 1000 1200 1400 1600Time (s)
Carbon monoxideMethaneEthanol
0
0.02
0.04
0.06
0.08
0.1
0.12
Am
plitu
de
(i)
0 200 400 600 800 1000 1200 1400 1600Time (s)
Carbon monoxideMethaneEthanol
0
0.02
0.04
0.06
0.08
0.1
0.12
Am
plitu
de
(j)
0 200 400 600 800 1000 1200 1400 1600Time (s)
Carbon monoxideMethaneEthanol
Am
plitu
de
00.010.020.030.040.050.060.070.080.09
0.1
(k)
Figure 6: The feature vectors for three analytes (150 ppm carbon monoxide, 3000 ppm methane, and 50 ppm ethanol) with sawtoothmodulated operating temperature (𝑇 = 40 s) at the first 11 frequencies: (a) 𝑓
2= 0.97mHz; (b) 𝑓
3= 1.94mHz; (c) 𝑓
4= 2.91mHz; (d)
𝑓5
= 3.88mHz; (e) 𝑓6
= 4.85mHz; (f) 𝑓7
= 5.82mHz; (g) 𝑓8
= 6.79mHz; (h) 𝑓9
= 7.76mHz; (i) 𝑓10
= 8.73mHz; (j) 𝑓11
= 9.7mHz; (k)𝑓12
= 10.67mHz.

Journal of Sensors 9
Table 3: The recognition accuracy for the sawtooth waveform (decision tree classifier and 12-fold cross-validation are applied to the iden-tification of gases) (%).
Frequency selected (mHz) Feature selected Window functionBoxcar Triangle Blackman Taylor Tukey Hann Hamming Gaussian
0.97 𝑉2
93.75 96.88 93.75 94.79 94.79 94.79 94.79 96.881.94 𝑉
397.92 95.83 95.83 93.75 90.63 92.71 94.79 94.79
2.91 𝑉4
96.88 96.88 95.83 92.71 93.75 93.75 97.92 95.833.88 𝑉
594.79 96.88 90.63 100 97.92 93.75 94.79 94.79
4.85 𝑉6
97.92 98.96 92.71 100 97.92 94.79 96.88 95.835.82 𝑉
797.92 95.83 97.92 100 90.63 100 100 96.88
6.79 𝑉8
91.67 91.67 93.75 100 97.92 96.88 95.83 96.887.76 𝑉
998.96 93.75 96.88 100 98.96 97.92 97.92 100
8.73 𝑉10
96.88 91.67 97.92 96.88 91.67 97.92 94.79 1009.7 𝑉
1188.54 98.96 96.88 97.92 98.96 91.67 95.83 96.88
10.67 𝑉12
97.92 98.96 92.71 94.79 91.67 84.38 88.54 85.42
Table 4: The recognition accuracy for the sinusoidal waveform (decision tree classifier and 12-fold cross-validation are applied to the iden-tification of gases) (%).
Frequency selected (mHz) Feature selected Window functionBoxcar Triangle Blackman Taylor Tukey Hann Hamming Gaussian
0.97 𝑉2
89.58 89.58 89.58 90.63 87.5 89.58 92.71 93.751.94 𝑉
393.75 87.50 90.63 86.46 88.54 91.67 90.63 92.71
2.91 𝑉4
98.96 91.67 85.42 97.92 96.88 92.71 91.67 85.423.88 𝑉
594.79 93.75 92.71 97.92 100 100 96.88 96.88
4.85 𝑉6
86.46 95.83 94.79 98.96 91.67 100 97.92 92.715.82 𝑉
797.92 92.71 95.83 93.75 94.79 92.71 97.92 100
6.79 𝑉8
90.63 96.88 97.92 89.52 92.71 97.92 94.79 1007.76 𝑉
984.38 92.71 93.75 94.79 95.83 95.83 95.83 100
8.73 𝑉10
82.29 88.54 95.83 89.58 86.46 96.88 92.71 95.839.7 𝑉
1185.42 95.83 93.75 90.63 88.54 91.67 94.79 91.67
10.67 𝑉12
90.63 98.96 92.71 92.71 87.5 96.88 96.88 96.88
Table 5: The recognition accuracy for the triangular waveform (decision tree classifier and 12-fold cross-validation are applied to theidentification of gases) (%).
Frequency selected (mHz) Feature selected Window functionBoxcar Triangle Blackman Taylor Tukey Hann Hamming Gaussian
0.97 𝑉2
84.38 96.88 95.83 91.67 87.5 92.71 96.88 94.791.94 𝑉
387.50 89.58 96.88 92.71 91.67 96.88 94.79 96.88
2.91 𝑉4
95.83 88.54 90.63 82.29 90.63 91.67 93.75 91.673.88 𝑉
592.71 91.67 84.38 88.54 97.92 85.42 88.54 85.42
4.85 𝑉6
86.46 94.79 87.5 91.67 87.5 89.58 93.75 86.465.82 𝑉
789.58 97.92 89.58 92.71 88.54 87.50 95.83 93.75
6.79 𝑉8
93.75 91.67 85.42 89.58 93.75 90.63 82.29 86.467.76 𝑉
988.54 88.54 81.25 86.46 92.71 93.75 82.29 86.46
8.73 𝑉10
91.67 86.46 83.33 87.5 93.75 79.17 76.04 76.049.7 𝑉
1189.58 75 70.83 70.83 81.25 84.38 93.75 88.54
10.67 𝑉12
92.71 77.08 68.75 76.04 71.88 78.13 79.13 83.33
A feature combination that describes the original dataperfectly can make the classifier work more efficiently. In thiswork, the optimal combinations of 11 features are optimisedby Genetic Algorithm (GA). GA is adaptive heuristic searchalgorithm premised on the evolutionary ideas of natural
selection and genetics [35]. The basic concept of GA isdesigned to simulate processes in natural system necessaryfor evolution, specifically those that follow the principles firstlaid down by Charles Darwin of survival of the fittest. As suchthey represent intelligent exploitation of a random search

10 Journal of Sensors
0 10 20 30 40 5050556065707580859095
100
Frequency (mHz)
The a
ccur
acy
rate
(%)
RectangleSawtooth
SinusoidTriangle
Figure 7: The recognition accuracy rates of four modulationwaveforms. Decision tree classifier and 12-fold cross-validation areapplied for the pattern recognition system.
within a defined search space to solve a problem.The specificalgorithm is as follows.
Step 1. Randomly generate initial population 𝑀(0), and thesize of 𝑀(0) is set to 20.
Step 2. Compute and save the fitness 𝑢(𝑚) for each individual𝑚 in the current population 𝑀(𝑡):
𝑢 (𝑚) =1
sse (�� − 𝑇)
=1
∑𝑛
𝑖=1(𝑡𝑖− 𝑡𝑖)2, (3)
where �� = {𝑡1, ��2, . . . , ��
𝑛} is the prediction set and 𝑇 = {𝑡
1, 𝑡2,
. . . , 𝑡𝑛} is the testing set.
Step 3. Selection, crossover, and mutation are set to roulettewheel selection, single point crossover, and single pointmutation, respectively.
Step 4. Generate 𝑀(𝑡 + 1) by probabilistically selecting indi-viduals from𝑀(𝑡) to produce offspring via genetic operators.
Step 5. Repeat Step 2 until satisfying solution is obtained.
Tables 6–9 show the optimal feature combinationsselected by GA and their classification accuracies. The clas-sification accuracies of the optimal feature combinations are100% in all cases.
The recognition accuracy of the presented method iscompared against the standard Fast Fourier Transform(FFT) and the Discrete Wavelet Transform (DWT). For FFTmethod, a 1024-point FFT is computed and the absolutevalues of the eight harmonics corresponding to the modu-lating frequencies are extracted. Eight harmonic frequenciesare 250mHz, 100mHz, 50mHz, 33mHz, 25mHz, 20mHz,17mHz, and 12.5mHz. Put 8 features into the decision treeclassifier for pattern recognition. When analyzing Discrete
Table 6: The optimal feature combination selected by GA and therecognition accuracy for the rectangle waveform (%).
Window function Feature selected Accuracy (%)
Boxcar 𝑉3+ 𝑉4
100𝑉2+ 𝑉3+ 𝑉4
100
Triangle 𝑉6+ 𝑉7
100𝑉5+ 𝑉7
100
Hamming 𝑉6+ 𝑉7
100𝑉5+ 𝑉7
100Hann 𝑉
6+ 𝑉8
100
Blackman 𝑉7+ 𝑉8
100𝑉6+ 𝑉9
100Taylor 𝑉
4+ 𝑉5
100
Gaussian 𝑉6+ 𝑉10
100𝑉7+ 𝑉10
100
Tukey𝑉5+ 𝑉10
100𝑉6+ 𝑉10
100𝑉4+ 𝑉5
100
Table 7: The optimal feature combination selected by GA and therecognition accuracy for the sawtooth waveform (%).
Window function Feature selected Accuracy (%)Boxcar 𝑉
3+ 𝑉4
100
Triangle 𝑉4+ 𝑉6
100𝑉5+ 𝑉6
100
Hamming 𝑉4+ 𝑉9
100𝑉6+ 𝑉9
100Hann 𝑉
4+ 𝑉7
100
Blackman𝑉3+ 𝑉5+ 𝑉9
100𝑉3+ 𝑉9
100𝑉7+ 𝑉9
100
Taylor
𝑉4+ 𝑉5
100𝑉5+ 𝑉9
100𝑉6+ 𝑉8+ 𝑉9
100𝑉5+ 𝑉7
100
Gaussian
𝑉3+ 𝑉5+ 𝑉10
100𝑉3+ 𝑉4+ 𝑉10
100𝑉3+ 𝑉6+ 𝑉10
100𝑉4+ 𝑉10
100Tukey 𝑉
4+ 𝑉5
100
Wavelet Transform, 3-level decomposition and the fourth-order Daubechies (db4) are selected. The third-level decom-position coefficients are extracted as features. PCA is used toreduce the dimensionality of features and keep only the first10 principal components. Decision tree classifier and 12-foldcross-validation are applied for all of the pattern recognitionsystems. The recognition accuracy of three reducing gases isshowed in Table 10.
As seen from Table 10, three reducing gases could beidentified by FFT method with the highest accuracy rate of79.17%, which is significantly worse than the identificationrate reached when STFT method is used. DWT method

Journal of Sensors 11
Table 8: The optimal feature combination selected by GA and therecognition accuracy for the sinusoidal waveform (%).
Window function Feature selected Accuracy (%)Boxcar 𝑉
2+ 𝑉4+ 𝑉5
100
Triangle𝑉2+ 𝑉6+ 𝑉10
100𝑉5+ 𝑉6+ 𝑉10
100𝑉3+ 𝑉6+ 𝑉10
100
Hamming𝑉2+ 𝑉6+ 𝑉12
100𝑉3+ 𝑉6+ 𝑉12
100𝑉6+ 𝑉12
100
Hann 𝑉6+ 𝑉12
100𝑉4+ 𝑉6+ 𝑉12
100
Blackman 𝑉4+ 𝑉8+ 𝑉9
100𝑉2+ 𝑉6+ 𝑉12
100
Taylor 𝑉3+ 𝑉12
100𝑉2+ 𝑉5+ 𝑉12
100
Gaussian𝑉6+ 𝑉9+ 𝑉11
100𝑉2+ 𝑉6+ 𝑉10
100𝑉6+ 𝑉8+ 𝑉11
100
Tukey𝑉4+ 𝑉5+ 𝑉7
100𝑉4+ 𝑉5+ 𝑉6
100𝑉2+ 𝑉5+ 𝑉6
100
Table 9: The optimal feature combination selected by GA and therecognition accuracy for the triangular waveform (%).
Window function Feature selected Accuracy (%)Boxcar 𝑉
2+ 𝑉4
100
Triangle𝑉2+ 𝑉6+ 𝑉8
100𝑉2+ 𝑉5+ 𝑉6
100𝑉2+ 𝑉6
100
Hamming𝑉2+ 𝑉6+ 𝑉8
100𝑉2+ 𝑉5+ 𝑉6
100𝑉2+ 𝑉6
100
Hann 𝑉2+ 𝑉5+ 𝑉7+ 𝑉9
100𝑉2+ 𝑉7+ 𝑉9
100
Blackman 𝑉2+ 𝑉5+ 𝑉8
100𝑉2+ 𝑉8
100Taylor 𝑉
2+ 𝑉5+ 𝑉6
100
Gaussian𝑉2+ 𝑉8+ 𝑉9
100𝑉2+ 𝑉3+ 𝑉9+ 𝑉12
100𝑉2+ 𝑉7
100Tukey 𝑉
2+ 𝑉5
100
Table 10: The recognition accuracy when FFT and DWT ap-proaches are used (%).
Sawtooth Triangle Rectangle SinusoidFFT 77.5 52.08 79.17 58.33DWT 93.75 94.79 93.75 93.75
outperforms FFT but obtains worse gas identification perfor-mance than STFT method. Meanwhile, the STFT is not only
accurate, but also easy to understand compared with DWTmethod.
4. Conclusions
This paper introduces a novel method to extract optimalfeatures of microhotplate gas sensors that modulated withdifferent frequency operating temperature. The lower fre-quency amplitudes are extracted by STFT method, and theoptimal feature combinations are selected by GA, since gasinformation tends to be contained in the lower frequencies,but not at higher frequencies.
We then evaluate the performance of our method byusing the decision tree classifier and obtain high classificationcapability. Moreover, it is found that the proposed method isrobust against not only dynamical heating frequency changes,but also different concentration levels.Therefore, we concludethat the proposed method could improve the recognitionperformance of temperature modulated microhotplate gassensors.
Conflict of Interests
The authors declare that there is no conflict of interestsregarding the publication of this paper.
Acknowledgment
This work was financially supported by the Natural Sci-ence Foundation of China (Project nos. 61174007; 61274076;61131004; 61307041).
References
[1] S. Marco and A. Gutierrez-Galvez, “Signal and data processingfor machine olfaction and chemical sensing: a review,” IEEESensors Journal, vol. 12, no. 11, pp. 3189–3214, 2012.
[2] A. Perera, T. Sundic, A. Pardo, R. Gutierrez-Osuna, and S.Marco, “A portable electronic nose based on embedded PCtechnology and GNU/Linux: hardware, software and applica-tions,” IEEE Sensors Journal, vol. 2, no. 3, pp. 235–246, 2002.
[3] R. Gutierrez-Osuna, “Pattern analysis for machine olfaction: areview,” IEEE Sensors Journal, vol. 2, no. 3, pp. 189–202, 2002.
[4] F. Rock, N. Barsan, and U. Weimar, “Electronic nose: currentstatus and future trends,” Chemical Reviews, vol. 108, no. 2, pp.705–725, 2008.
[5] K. D. Benkstein, B. Raman, C. B. Montgomery, C. J. Martinez,and S. Semancik, “Microsensors in dynamic backgrounds:toward real-time breath monitoring,” IEEE Sensors Journal, vol.10, no. 1, pp. 137–144, 2010.
[6] A. Loutfi, S. Coradeschi, G. K. Mani, P. Shankar, and J. B. B.Rayappan, “Electronic noses for food quality: a review,” Journalof Food Engineering, vol. 144, pp. 103–111, 2015.
[7] E. Gobbi, M. Falasconi, G. Zambotti, V. Sberveglieri, A. Pul-virenti, and G. Sberveglieri, “Rapid diagnosis of Enterobacteri-aceae in vegetable soups by a metal oxide sensor based elec-tronic nose,” Sensors and Actuators, B: Chemical, vol. 207, pp.1104–1113, 2015.

12 Journal of Sensors
[8] X. Huang, J. Liu, D. Shao, Z. Pi, and Z. Yu, “Rectangularmode ofoperation for detecting pesticide residue by using a single SnO
2-
based gas sensor,” Sensors andActuators B: Chemical, vol. 96, no.3, pp. 630–635, 2003.
[9] F. Di Francesco, B. Lazzerini, F. Marcelloni, and G. Pioggia, “Anelectronic nose for odour annoyance assessment,” AtmosphericEnvironment, vol. 35, no. 7, pp. 1225–1234, 2001.
[10] C. Hou, J. Li, D. Huo et al., “A portable embedded toxic gasdetection device based on a cross-responsive sensor array,” Sen-sors andActuators, B: Chemical, vol. 161, no. 1, pp. 244–250, 2012.
[11] Y. S. Kim and Y. S. Yang, “Additional thermodynamic featureextraction from chemoresistive carbon black-polymer compos-ite sensors by temperature modulation,” Sensors and ActuatorsB: Chemical, vol. 121, no. 2, pp. 507–514, 2007.
[12] E. Martinelli, D. Polese, A. Catini, A. D’Amico, and C. DiNatale, “Self-adapted temperature modulation in metal-oxidesemiconductor gas sensors,” Sensors andActuators, B: Chemical,vol. 161, no. 1, pp. 534–541, 2012.
[13] F. Herrero-Carron, D. J. Yanez, F. D. B. Rodrıguez, and P.Varona, “An active, inverse temperaturemodulation strategy forsingle sensor odorant classification,” Sensors and Actuators, B:Chemical, vol. 206, pp. 555–563, 2015.
[14] J. Fonollosa, L. Fernandez, R. Huerta, A. Gutierrez-Galvez, andS. Marco, “Temperature optimization of metal oxide sensorarrays using Mutual Information,” Sensors and Actuators B:Chemical, vol. 187, pp. 331–339, 2013.
[15] A. Vergara, J. L. Ramırez, and E. Llobet, “Reducing powerconsumption via a discontinuous operation of temperature-modulated micro-hotplate gas sensors: application to the logis-tics chain of fruit,” Sensors and Actuators B: Chemical, vol. 129,no. 1, pp. 311–318, 2008.
[16] F. Seker, K. Meeker, T. F. Kuech, and A. B. Ellis, “Surfacechemistry of prototypical bulk II−VI and III−Vsemiconductorsand implications for chemical sensing,” Chemical Reviews, vol.100, no. 7, pp. 2505–2536, 2000.
[17] X. Huang, F. Meng, Z. Pi, W. Xu, and J. Liu, “Gas sensing behav-ior of a single tin dioxide sensor under dynamic temperaturemodulation,” Sensors and Actuators B: Chemical, vol. 99, no. 2-3, pp. 444–450, 2004.
[18] A. Vergara, E. Llobet, J. Brezmes et al., “Optimized temperaturemodulation of micro-hotplate gas sensors through pseudoran-dom binary sequences,” IEEE Sensors Journal, vol. 5, no. 6, pp.1369–1377, 2005.
[19] X. Huang, L. Wang, Y. Sun, F. Meng, and J. Liu, “Quantitativeanalysis of pesticide residue based on the dynamic response ofa single SnO
2gas sensor,” Sensors and Actuators B: Chemical,
vol. 99, no. 2-3, pp. 330–335, 2004.[20] R. Gosangi and R. Gutierrez-Osuna, “Active temperature pro-
gramming for metal-oxide chemoresistors,” IEEE Sensors Jour-nal, vol. 10, no. 6, pp. 1075–1082, 2010.
[21] A. Vergara, E. Martinelli, E. Llobet, F. Giannini, A. D’Amico,and C. Di Natale, “An alternative global feature extraction oftemperature modulated micro-hotplate gas sensors array usingan energy vector approach,” Sensors and Actuators B: Chemical,vol. 124, no. 2, pp. 352–359, 2007.
[22] A. Vergara, M. K. Muezzinoglu, N. Rulkov, and R. Huerta,“Information-theoretic optimization of chemical sensors,” Sen-sors andActuators B: Chemical, vol. 148, no. 1, pp. 298–306, 2010.
[23] F. Flitti, A. Far, B. Guo, and A. Bermak, “A robust and low-complexity gas recognition technique for on-chip tin-oxide gassensor array,” Journal of Sensors, vol. 2008, Article ID 465209, 6pages, 2008.
[24] Y. Chen, J. Yu, A. He, and Z. Tang, “A method for selectingoptimal number of sensors to improve the credibility,” Journalof Sensors, vol. 2016, Article ID 8914769, 9 pages, 2016.
[25] E. Llobet, J. Brezmes, R. Ionescu et al., “Wavelet transform andfuzzy ARTMAP-based pattern recognition for fast gas iden-tification using a micro-hotplate gas sensor,” Sensors and Actu-ators B: Chemical, vol. 83, no. 1–3, pp. 238–244, 2002.
[26] J. R. Huang, G. Y. Li, Z. Y. Huang, X. J. Huang, and J. H. Liu,“Temperature modulation and artificial neural network eval-uation for improving the CO selectivity of SnO
2gas sensor,”
Sensors and Actuators B: Chemical, vol. 114, no. 2, pp. 1059–1063,2006.
[27] A. Vergara, E. Llobet, J. Brezmes et al., “Quantitative gasmixture analysis using temperature-modulated micro-hotplategas sensors: selection and validation of the optimal modulatingfrequencies,” Sensors and Actuators B: Chemical, vol. 123, no. 2,pp. 1002–1016, 2007.
[28] T. Nakamoto and H. Ishida, “Chemical sensing in spatial/tem-poral domains,” Chemical Reviews, vol. 108, no. 2, pp. 680–704,2008.
[29] N. Nimsuk and T. Nakamoto, “Improvement of capability forclassifying odors in dynamically changing concentration usingQCM sensor array and short-time Fourier transform,” Sensorsand Actuators B: Chemical, vol. 127, no. 2, pp. 491–496, 2007.
[30] Y. Li, J. Yu, H. Wu, and Z. Tang, “Design and fabrication of aCMOS-compatible MHP gas sensor,” AIP Advances, vol. 4, no.3, Article ID 31339, 2014.
[31] H. H. Giv, “Directional short-time Fourier transform,” Journalof Mathematical Analysis and Applications, vol. 399, no. 1, pp.100–107, 2013.
[32] C. E. Priebe, D. J. Marchette, and D. M. Healy Jr., “Integratedsensing and processing decision trees,” IEEE Transactions onPatternAnalysis andMachine Intelligence, vol. 26, no. 6, pp. 699–708, 2004.
[33] S.Hussain, “Total path length and number of terminal nodes fordecision trees,” Procedia Computer Science, vol. 35, pp. 514–521,2014.
[34] J. R. Quinlan, “Induction of decision trees,” Machine Learning,vol. 1, no. 1, pp. 81–106, 1986.
[35] E. Zitzler, K. Deb, and L.Thiele, “Comparison of multiobjectiveevolutionary algorithms: empirical results,” Evolutionary Com-putation, vol. 8, no. 2, pp. 173–195, 2000.

International Journal of
AerospaceEngineeringHindawi Publishing Corporationhttp://www.hindawi.com Volume 2014
RoboticsJournal of
Hindawi Publishing Corporationhttp://www.hindawi.com Volume 2014
Hindawi Publishing Corporationhttp://www.hindawi.com Volume 2014
Active and Passive Electronic Components
Control Scienceand Engineering
Journal of
Hindawi Publishing Corporationhttp://www.hindawi.com Volume 2014
International Journal of
RotatingMachinery
Hindawi Publishing Corporationhttp://www.hindawi.com Volume 2014
Hindawi Publishing Corporation http://www.hindawi.com
Journal ofEngineeringVolume 2014
Submit your manuscripts athttp://www.hindawi.com
VLSI Design
Hindawi Publishing Corporationhttp://www.hindawi.com Volume 2014
Hindawi Publishing Corporationhttp://www.hindawi.com Volume 2014
Shock and Vibration
Hindawi Publishing Corporationhttp://www.hindawi.com Volume 2014
Civil EngineeringAdvances in
Acoustics and VibrationAdvances in
Hindawi Publishing Corporationhttp://www.hindawi.com Volume 2014
Hindawi Publishing Corporationhttp://www.hindawi.com Volume 2014
Electrical and Computer Engineering
Journal of
Advances inOptoElectronics
Hindawi Publishing Corporation http://www.hindawi.com
Volume 2014
The Scientific World JournalHindawi Publishing Corporation http://www.hindawi.com Volume 2014
SensorsJournal of
Hindawi Publishing Corporationhttp://www.hindawi.com Volume 2014
Modelling & Simulation in EngineeringHindawi Publishing Corporation http://www.hindawi.com Volume 2014
Hindawi Publishing Corporationhttp://www.hindawi.com Volume 2014
Chemical EngineeringInternational Journal of Antennas and
Propagation
International Journal of
Hindawi Publishing Corporationhttp://www.hindawi.com Volume 2014
Hindawi Publishing Corporationhttp://www.hindawi.com Volume 2014
Navigation and Observation
International Journal of
Hindawi Publishing Corporationhttp://www.hindawi.com Volume 2014
DistributedSensor Networks
International Journal of