research brief - nahicnahic.ucsf.edu/wp-content/uploads/2014/07/transitioning...youth must navigate...
TRANSCRIPT

Transitioning to Adulthood:
HOW DO YOUNG ADULTS FARE AND WHAT CHARACTERISTICS ARE ASSOCIATED WITH A LOWER-RISK TRANSITION?
Mary A. Terzian, Kristin A. Moore, and Nicole Constance
Child Trends7315 Wisconsin Avenue Suite 1200 WBethesda, MD 20814Phone 240-223-9200
childtrends.org
MAY 2014Publication #2014-18
OVERVIEW
Youth must navigate various developmental tasks as they transition to adulthood (Arnett, 2014). During this period of “emerging adulthood,” young people explore roles and relationships before committing to the ones they will fill as adults.
This brief seeks to identify patterns and transitions during emerging adulthood to obtain a better understanding of the likelihood that young adults will experience a lower-risk transition to adulthood. We analyzed panel data from the National Longitudinal Study of Adolescent Healthi (Add Health, N=12,166), using person-centered analyses, to examine the odds of youth engaging in lower-risk patterns/trajectories, specifically, minimal problems with heavy alcohol use, illicit drug use, criminal behavior, and financial hardship. Lower-risk transitions were defined as avoiding or overcoming problems by adulthood. We found considerable variation among young adults in reaching these milestones.
KEY FINDINGS
• Young adults who are doing well in their late teens/early twenties continue to avoid difficulties in their later twenties and early thirties.
• Young adults who report moderate or multiple problems (heavy alcohol use, illicit drug use, criminal behavior, and financial hardship) in early adulthood tend to report fewer problems with these issues as they transition to adulthood.
• Certain groups of young adults fare better during the period of emerging adulthood, while others fare worse. ii Female and foreign-born young adults are more likely to report minimal problems and less likely to report multiple problems than males and native-born young adults; whereas Caucasians are less likely to report minimal problems and more likely to report multiple problems.
i Harris K, Halpern C, Whitsel E, et al. The National Longitudinal Study of Adolescent Health: Research Design. 2009
ii Differences by age and family structure emerged. To obtain information about these findings, contact author Kristin Moore.
Research Brief
2
ResearchBrief
Transitioning to Adulthood:HOW DO YOUNG ADULTS FARE AND WHAT CHARACTERISTICS ARE ASSOCIATED WITH A LOWER-RISK TRANSITION?
Research Brief
BACKGROUND
Recent data suggest recent cohorts of young adults are more likely than previous cohorts to delay childbearing, marriage, and financial stability. Shanahan and his colleagues (2005, p. 225) note: “For many decades, scholars held that five transition markers delineated entry into adulthood: completing school, leaving home, beginning one’s career, marrying, and becoming a parent” (Shanahan, 2005).
Given these trends, a paradigm shift on the timing of adulthood and the set of developmental tasks we expect young adults in their twenties to achieve, social scientists are now characterizing the period from ages 18 to 29 as a period of “emerging adulthood.” (Cote, 2008)(Arnett, 2000). In an effort to identify developmental tasks for emerging adulthood, Roisman et al. (2004) found that social competence/friendship, academic achievement, and behavioral conduct (but not work or romantic relationships) at age 20 predicted success in all domains by age 30 (Roisman, et al., 2004). To expand this research, this brief examines the adolescent antecedents of success by age 30, defined as avoiding heavy alcohol use, illicit drug use, criminal behavior and financial hardship.
DATA AND METHODS (IN BRIEF)
This brief uses Add Health data from a cohort of adolescents who were in grades 7 to 12 at Wave I in 1994-1995.iii The sample used for these analyses was comprised of 12,166 emerging adults who had been aged 11 to 19 at Wave I (M = 15.6 years, SD = 1.7), completed Waves I, III, and IV of the survey,iv were not still attending high school at Wave III, and had no missing data on any of the demographic characteristics examined in analyses. v Appendix A provides an overview of the sample’s background characteristics.
Because prevalence rates of substance use, alcohol use, and criminal behavior vary significantly by gender, we elected to examine males and females separately using a multiple-group latent class analysis (LCA) methods with covariates, and using multiple-group latent transition analysis (LTA) methods (a longitudinal extension of LCA) with covariates. More information about data, methods, and measures is provided in the “Data and Methods” section on page eight.vi
HYPOTHESES
Based on previous research, we expected that the transition to adulthood would be relatively rocky for young adults who are male, native-born, and belong to a minority racial/ethnic group and less rocky for those who lived with both of their biological parents as adolescents.
FINDINGS
Three patterns of problems associated with a higher-risk transition to adulthood were identified, based on young adults’ reports of severe financial hardships, and engaging in marijuana use, other illicit drug use, heavy alcohol use, and/or criminal behavior – described as “groups” from here forward: (a) a minimal problems group; (b) a moderate problems group; and (c) a multiple problems group. Overall, gender differences in group membership and transition patterns were found. In addition, within each gender, socio-demographic differences between patterns of problems at each wave were found.
iii Harris K, Halpern C, Whitsel E, et al. The National Longitudinal Study of Adolescent Health: Research Design. 2009
iv Participants in 12th grade at Wave I were not interviewed at Wave II, but were re-interviewed at Wave III per the study design.
v Only 11 respondents were excluded because of missing data; five were missing race and six were missing on nativity. Gender, family structure, and age were not missing for any participants.
vi For information about model selection and fit statistics, contact author Kristin Moore.

3
ResearchBrief
Transitioning to Adulthood:HOW DO YOUNG ADULTS FARE AND WHAT CHARACTERISTICS ARE ASSOCIATED WITH A LOWER-RISK TRANSITION?
Research Brief
Group (Latent Class) Membership at Waves III and IV, by GenderWithin each gender, and over and above differences in social and demographic factors, the proportion of the sample belonging to the lower-risk (minimal problems) group increased from Wave III to Wave IV, while the opposite was true for the higher risk (moderate and multiple problems). As hypothesized, compared with males, females represented a greater proportion of the group with minimal problems. By Wave IV, at ages 24-32, almost three-quarters of females (72.4%) and half of males (47.3%) were members of the minimal problems group (see Figure 1).
Figure 1: Likelihood of Latent Class Membership by Gender and Wave (adjusted proportions)
Specifically, females were:
• More likely to be assigned to the minimal problems group than males (60% of females compared with 34% of males at Wave III; and 72% of females compared with 47% of males at Wave IV);
• Less likely than males to be assigned to the moderate problems group (31% of females compared with 46% of males at Wave III; and 23% of females compared with 42% of males at Wave IV); and
• Less likely than males to belong to a multiple problems group (9% of females compared with 21% of males at Wave III; and 4% of females compared with 11% of males at Wave IV).
Socio-demographic Differences Between Groups at Wave III, by GenderTo assess whether the likelihood of group membership is affected by socio-demographic factors, we tested between-group differences for the following socio-demographic characteristics: age, race/ethnicity, nativity status, family structure. In the Appendix, the proportion of youth in each subgroup assigned to each latent class (i.e., minimal problems, moderate problems, or multiple problems) is provided: Appendix B provides Wave III findings and Appendix C provides findings for Wave IV.
0
10
20
30
40
50
60
maleMaleFemaleMale
70
80
Wave III Wave IV
4.4%
23.2%
72.4%
10.9%
41.8%47.3%
9.2%
30.5%
60.3%
20.5%
45.9%
33.6%
Multiple problems
Moderate problems
Minimal Problemsp
Fe

4
ResearchBrief
Transitioning to Adulthood:HOW DO YOUNG ADULTS FARE AND WHAT CHARACTERISTICS ARE ASSOCIATED WITH A LOWER-RISK TRANSITION?
Research Brief
Below we discuss differences by race/ethnicity and differences by nativity status, as these differences were found to be significant (p<.05) and most noteworthy. Adjusted proportions for each group are presented separately by gender, because of the substantial gender differences in transitions and patterns found. Because similar between-gender patterns were found at Wave IV, only Wave III differences are discussed.
Differences by Race/EthnicityOverall, Caucasians were least likely to fall into the minimal problems group and most likely to be assigned to the multiple problems group, compared with other racial/ethnic groups. However, the likelihood of Caucasians belonging to the minimal problems group was substantially higher among females (58%) than among males (32%). These findings are shown in Figure 2.
Figure 2: Likelihood of WIII Group Membership (race/ethnicity by gender, adjusted proportions)
Males Females
32% 42
%26
% 38%
54%
8%
38% 45
%16
%
39% 48
%13
%
58%
29%
12%
68%
31%
2%
64%
29%
6%
64%
29%
7%White Black Latino Other White Black Latino Other
Among Males:
• Caucasians were least likely to be in the minimal problems group. • 32% of Caucasian males v. 38% of African American males, 38% of Latino males, and 39% of males identifying as another race/ethnicity.
• African American males were most likely to be in the moderate problems group. • 54% of African American males v. 42% of Caucasian males, 45% of Latino males, and 48% of males identifying as another race/ethnicity.
• Caucasian males were most likely to be in the multiple problems group. • 26% of Caucasian males v. 8% of African Americans, 16% of Latinos, and 13% of those identifying as another race/ethnicity.
Multiple problems
Moderate problems
Minimal Problemsp
5
ResearchBrief
Transitioning to Adulthood:HOW DO YOUNG ADULTS FARE AND WHAT CHARACTERISTICS ARE ASSOCIATED WITH A LOWER-RISK TRANSITION?
Research Brief
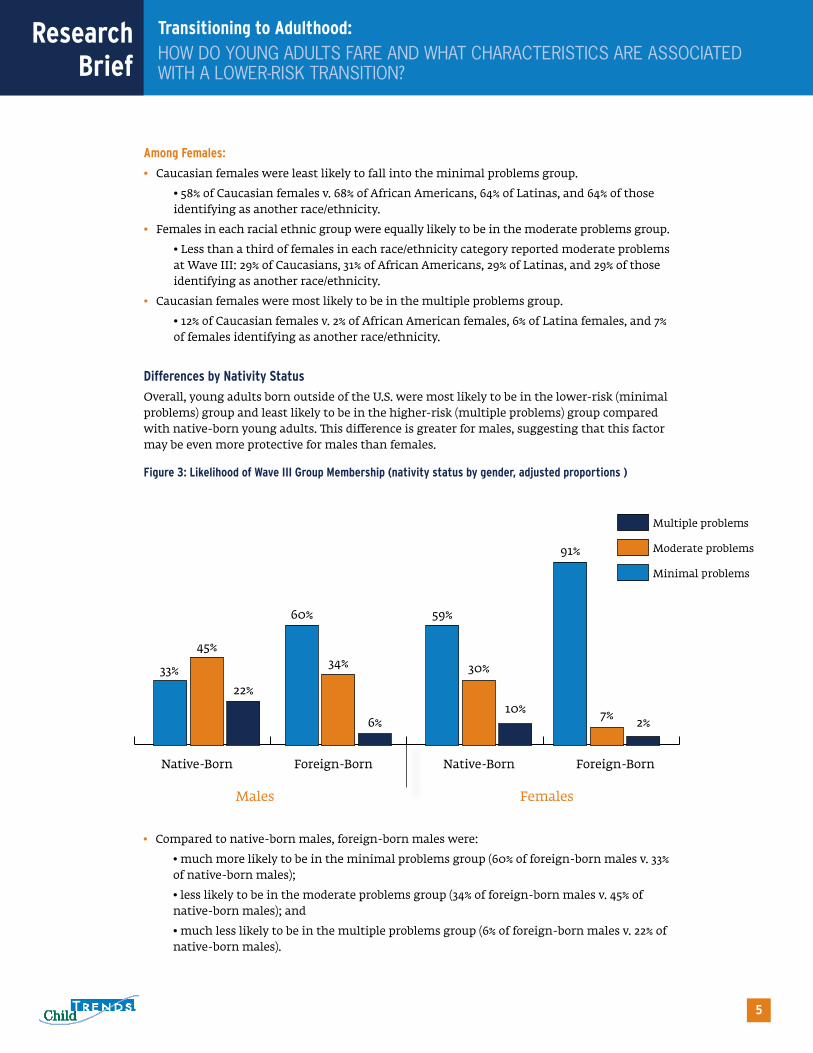
Among Females:
• Caucasian females were least likely to fall into the minimal problems group. • 58% of Caucasian females v. 68% of African Americans, 64% of Latinas, and 64% of those identifying as another race/ethnicity.
• Females in each racial ethnic group were equally likely to be in the moderate problems group. • Less than a third of females in each race/ethnicity category reported moderate problems at Wave III: 29% of Caucasians, 31% of African Americans, 29% of Latinas, and 29% of those identifying as another race/ethnicity.
• Caucasian females were most likely to be in the multiple problems group. • 12% of Caucasian females v. 2% of African American females, 6% of Latina females, and 7% of females identifying as another race/ethnicity.
Differences by Nativity Status
Overall, young adults born outside of the U.S. were most likely to be in the lower-risk (minimal problems) group and least likely to be in the higher-risk (multiple problems) group compared with native-born young adults. This difference is greater for males, suggesting that this factor may be even more protective for males than females.
Figure 3: Likelihood of Wave III Group Membership (nativity status by gender, adjusted proportions )
33%
Males Females
Native-Born Foreign-BornNative-Born Foreign-Born
45%
22%
60%
34%
6%
59%
30%
10%
91%
7% 2%
• Compared to native-born males, foreign-born males were:• much more likely to be in the minimal problems group (60% of foreign-born males v. 33% of native-born males);• less likely to be in the moderate problems group (34% of foreign-born males v. 45% of native-born males); and• much less likely to be in the multiple problems group (6% of foreign-born males v. 22% of native-born males).
Multiple problems
Moderate problems
Minimal Problemsp
6
ResearchBrief
Transitioning to Adulthood:HOW DO YOUNG ADULTS FARE AND WHAT CHARACTERISTICS ARE ASSOCIATED WITH A LOWER-RISK TRANSITION?
Research Brief
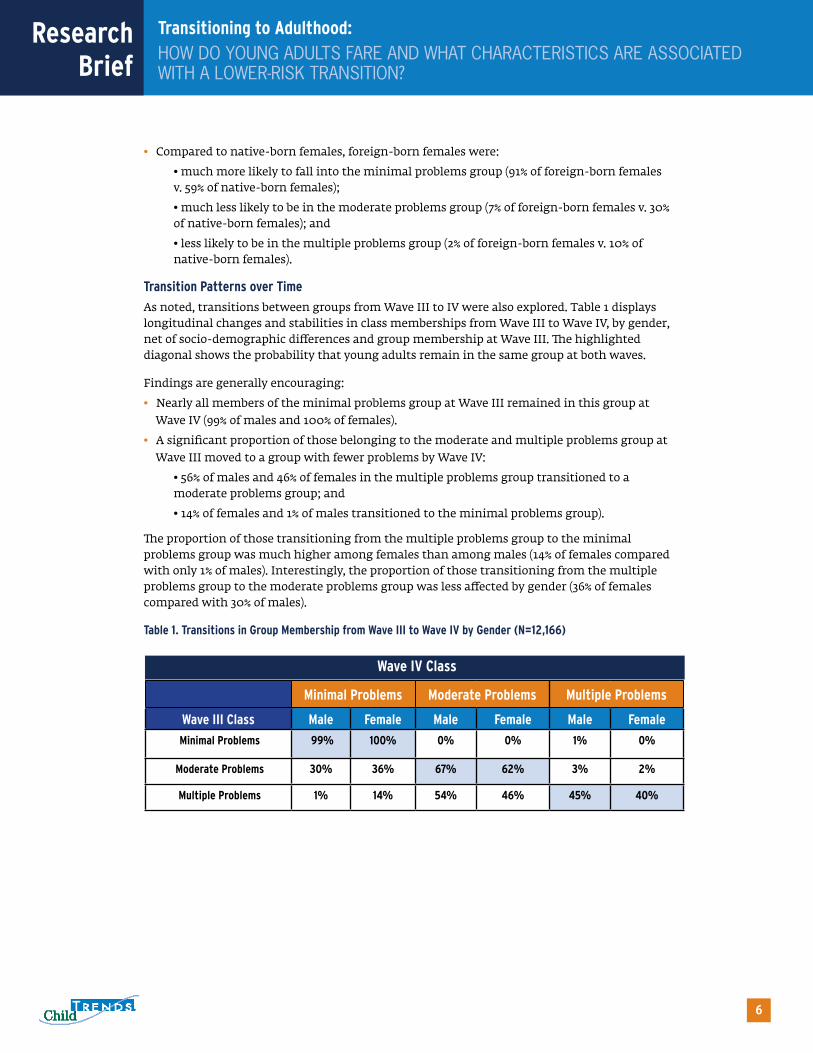
• Compared to native-born females, foreign-born females were:• much more likely to fall into the minimal problems group (91% of foreign-born females v. 59% of native-born females);• much less likely to be in the moderate problems group (7% of foreign-born females v. 30% of native-born females); and• less likely to be in the multiple problems group (2% of foreign-born females v. 10% of native-born females).
Transition Patterns over Time
As noted, transitions between groups from Wave III to IV were also explored. Table 1 displays longitudinal changes and stabilities in class memberships from Wave III to Wave IV, by gender, net of socio-demographic differences and group membership at Wave III. The highlighted diagonal shows the probability that young adults remain in the same group at both waves.
Findings are generally encouraging:• Nearly all members of the minimal problems group at Wave III remained in this group at
Wave IV (99% of males and 100% of females).• A significant proportion of those belonging to the moderate and multiple problems group at
Wave III moved to a group with fewer problems by Wave IV:• 56% of males and 46% of females in the multiple problems group transitioned to a moderate problems group; and• 14% of females and 1% of males transitioned to the minimal problems group).
The proportion of those transitioning from the multiple problems group to the minimal problems group was much higher among females than among males (14% of females compared with only 1% of males). Interestingly, the proportion of those transitioning from the multiple problems group to the moderate problems group was less affected by gender (36% of females compared with 30% of males).
Table 1. Transitions in Group Membership from Wave III to Wave IV by Gender (N=12,166)
Minimal Problems Moderate Problems Multiple Problems
Wave III Class Male Female Male Female Male Female
Minimal Problems 99% 100% 0% 0% 1% 0%
Moderate Problems 30% 36% 67% 62% 3% 2%
Multiple Problems 1% 14% 54% 46% 45% 40%
Wave IV Class

7
ResearchBrief
Transitioning to Adulthood:HOW DO YOUNG ADULTS FARE AND WHAT CHARACTERISTICS ARE ASSOCIATED WITH A LOWER-RISK TRANSITION?
Research Brief
DISCUSSION AND IMPLICATIONS
This study found, encouragingly, that youth who begin the early stages of emerging adulthood with minimal problems are not likely to later experience greater difficulty with regard to substance use, criminal behavior, and financial hardship in their later twenties and early thirties. In addition, this study found that a significant proportion of youth experiencing difficulties in their late teens and early twenties resolve these issues as they enter their thirties.
Findings suggest that preventing problem behaviors prior to the age of 18 may result in long-term dividends. In addition, findings related to subgroup differences suggest several implications for health promotion and risk reduction efforts across the country. Gender differences suggest that male-responsive interventions and interventions targeting males during adolescence and young adulthood are needed. Also, Caucasian young adults in their late teens and early twenties who are reporting criminal behavior, substance use, and/or financial hardship might be an important group to target.
Overall, study findings suggest that many young adults ages 18-24 are in a period of flux. We know from scientific research that young adult brains are still developing until around their mid-twenties (Giedd, 2004). And, we also know that young adults are the least likely, among all age groups, to have health insurance (Callahan, 2005) and access health care services (Yu, 2008). These coinciding facts suggest a strong need to strengthen and expand existing evidence-based interventions and develop innovative ways to reach this population.
AcknowledgmentsWe gratefully acknowledge funding for this research brief from the Maternal and Child Health Bureau at the Health Resources and Services Administration – HRSA (primary grant number: U45 MC00002), and for Child Trends, under subcontract to the University of California, San Francisco – UCSF (subcontract number: 5831sc). We also thank our colleague at UCSF, Jane Park, for reviewing this brief and offering us helpful guidance.
This research uses data from Add Health, a program project directed by Kathleen Mullan Harris and designed by J. Richard Udry, Peter S. Bearman, and Kathleen Mullan Harris at the University of North Carolina at Chapel Hill, and funded by grant P01-HD31921 from the Eunice Kennedy Shriver National Institute of Child Health and Human Development, with cooperative funding from 23 other federal agencies and foundations. Special acknowledgment is due Ronald R. Rindfuss and Barbara Entwisle for assistance in the original design. Information on how to obtain the Add Health data files is available on the Add Health website (http://www.cpc.unc.edu/addhealth). No direct support was received from grant P01-HD31921 for this analysis.
8
ResearchBrief
Transitioning to Adulthood:HOW DO YOUNG ADULTS FARE AND WHAT CHARACTERISTICS ARE ASSOCIATED WITH A LOWER-RISK TRANSITION?
Research Brief
Data and Methods
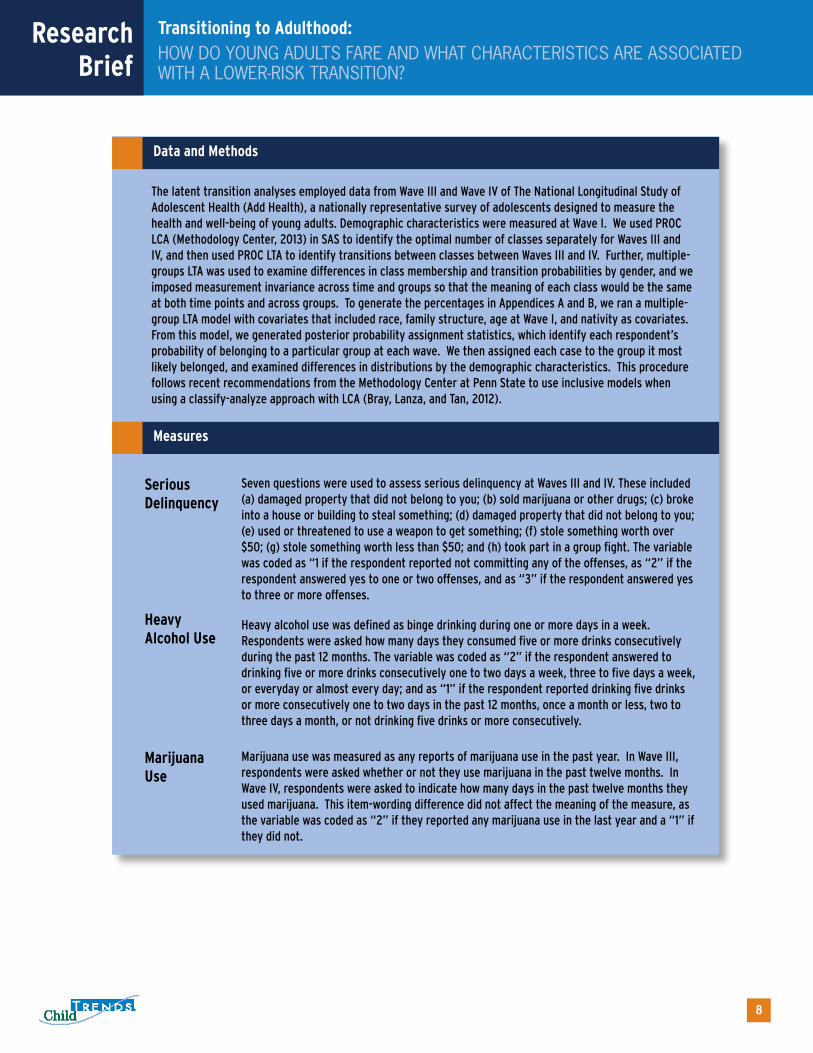
The latent transition analyses employed data from Wave III and Wave IV of The National Longitudinal Study of Adolescent Health (Add Health), a nationally representative survey of adolescents designed to measure the health and well-being of young adults. Demographic characteristics were measured at Wave I. We used PROC LCA (Methodology Center, 2013) in SAS to identify the optimal number of classes separately for Waves III and IV, and then used PROC LTA to identify transitions between classes between Waves III and IV. Further, multiple-groups LTA was used to examine differences in class membership and transition probabilities by gender, and we imposed measurement invariance across time and groups so that the meaning of each class would be the same at both time points and across groups. To generate the percentages in Appendices A and B, we ran a multiple-group LTA model with covariates that included race, family structure, age at Wave I, and nativity as covariates. From this model, we generated posterior probability assignment statistics, which identify each respondent’s probability of belonging to a particular group at each wave. We then assigned each case to the group it most likely belonged, and examined differences in distributions by the demographic characteristics. This procedure follows recent recommendations from the Methodology Center at Penn State to use inclusive models when using a classify-analyze approach with LCA (Bray, Lanza, and Tan, 2012).
Measures
Seven questions were used to assess serious delinquency at Waves III and IV. These included (a) damaged property that did not belong to you; (b) sold marijuana or other drugs; (c) broke into a house or building to steal something; (d) damaged property that did not belong to you; (e) used or threatened to use a weapon to get something; (f) stole something worth over $50; (g) stole something worth less than $50; and (h) took part in a group fight. The variable was coded as “1 if the respondent reported not committing any of the offenses, as “2” if the respondent answered yes to one or two offenses, and as “3” if the respondent answered yes to three or more offenses.
Serious Delinquency
Heavy Alcohol Use
Heavy alcohol use was defined as binge drinking during one or more days in a week. Respondents were asked how many days they consumed five or more drinks consecutively during the past 12 months. The variable was coded as “2” if the respondent answered to drinking five or more drinks consecutively one to two days a week, three to five days a week, or everyday or almost every day; and as “1” if the respondent reported drinking five drinks or more consecutively one to two days in the past 12 months, once a month or less, two to three days a month, or not drinking five drinks or more consecutively.
MarijuanaUse
Marijuana use was measured as any reports of marijuana use in the past year. In Wave III, respondents were asked whether or not they use marijuana in the past twelve months. In Wave IV, respondents were asked to indicate how many days in the past twelve months they used marijuana. This item-wording difference did not affect the meaning of the measure, as the variable was coded as “2” if they reported any marijuana use in the last year and a “1” if they did not.
9
ResearchBrief
Transitioning to Adulthood:HOW DO YOUNG ADULTS FARE AND WHAT CHARACTERISTICS ARE ASSOCIATED WITH A LOWER-RISK TRANSITION?
Research Brief
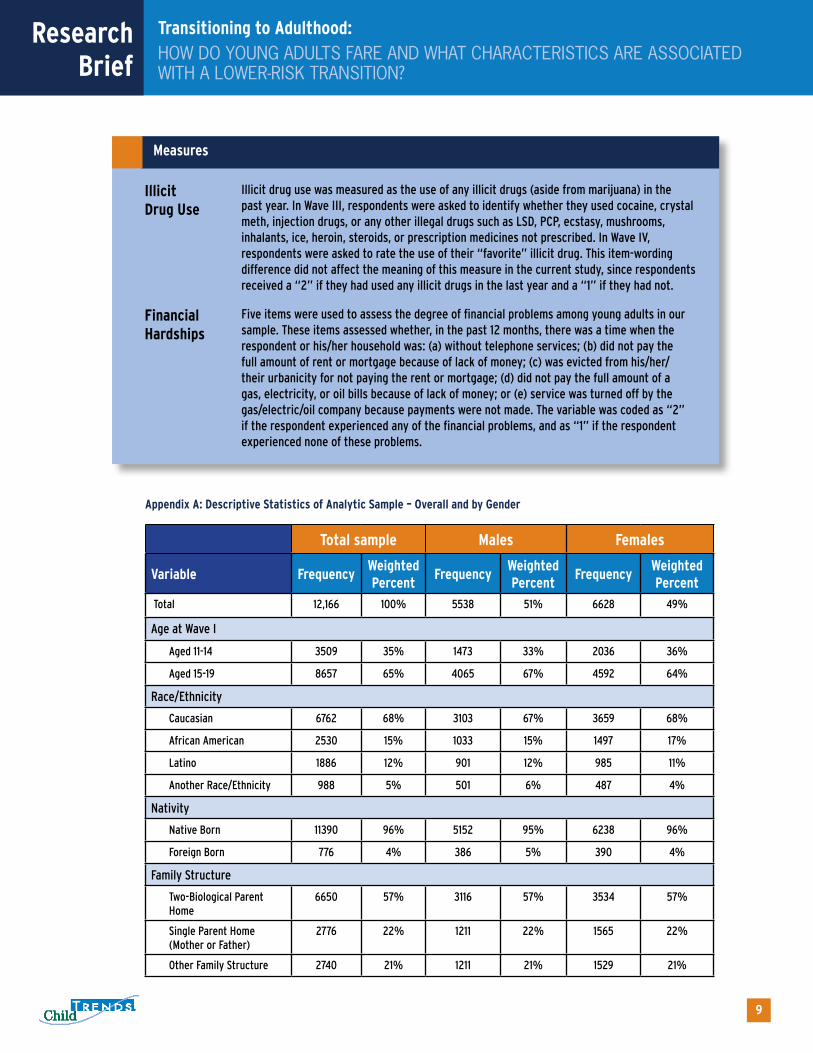
Measures
Illicit drug use was measured as the use of any illicit drugs (aside from marijuana) in the past year. In Wave III, respondents were asked to identify whether they used cocaine, crystal meth, injection drugs, or any other illegal drugs such as LSD, PCP, ecstasy, mushrooms, inhalants, ice, heroin, steroids, or prescription medicines not prescribed. In Wave IV, respondents were asked to rate the use of their “favorite” illicit drug. This item-wording difference did not affect the meaning of this measure in the current study, since respondents received a “2” if they had used any illicit drugs in the last year and a “1” if they had not.
Illicit Drug Use
Financial Hardships
Five items were used to assess the degree of financial problems among young adults in our sample. These items assessed whether, in the past 12 months, there was a time when the respondent or his/her household was: (a) without telephone services; (b) did not pay the full amount of rent or mortgage because of lack of money; (c) was evicted from his/her/their urbanicity for not paying the rent or mortgage; (d) did not pay the full amount of a gas, electricity, or oil bills because of lack of money; or (e) service was turned off by the gas/electric/oil company because payments were not made. The variable was coded as “2” if the respondent experienced any of the financial problems, and as “1” if the respondent experienced none of these problems.
Appendix A: Descriptive Statistics of Analytic Sample – Overall and by Gender
Total sample Males Females
Variable FrequencyWeightedPercent
FrequencyWeightedPercent
FrequencyWeightedPercent
Total 12,166 100% 5538 51% 6628 49%
Age at Wave I
Aged 11-14 3509 35% 1473 33% 2036 36%
Aged 15-19 8657 65% 4065 67% 4592 64%
Race/Ethnicity
Caucasian 6762 68% 3103 67% 3659 68%
African American 2530 15% 1033 15% 1497 17%
Latino 1886 12% 901 12% 985 11%
Another Race/Ethnicity 988 5% 501 6% 487 4%
Nativity
Native Born 11390 96% 5152 95% 6238 96%
Foreign Born 776 4% 386 5% 390 4%
Family Structure
Two-Biological Parent Home
6650 57% 3116 57% 3534 57%
Single Parent Home (Mother or Father)
2776 22% 1211 22% 1565 22%
Other Family Structure 2740 21% 1211 21% 1529 21%

10
ResearchBrief
Transitioning to Adulthood:HOW DO YOUNG ADULTS FARE AND WHAT CHARACTERISTICS ARE ASSOCIATED WITH A LOWER-RISK TRANSITION?
Research Brief
Appendix B. Group Differences in Latent Class Membership at Wave III by Gender*
Sample Size (N)= 12,166 Minimal Problems at Wave III
Moderate Problems at Wave III
Multiple Problems at Wave III
Males
Age at Wave I (X2 (2) = 76.3, p < .001)
Aged 11-14 26.8% 50.0% 23.3%
Aged 15-19 39.3% 43.1% 17.7%
Race/Ethnicity (X2 (6) = 202.5, p < .001)
Caucasian 32.7% 42.0% 25.3%
Black 38.9% 54.1% 7.0%
Latino 40.3% 44.4% 15.3%
Another Race/Ethnicity 42.1% 44.3% 13.6%
Nativity (X2 (2) = 134.4, p < .001)
Native Born 33.9% 46.0% 20.1%
Foreign Born 62.7% 30.3% 7.0%
Family Structure at Wave I (X2 (4) = 18.6, p < .001)
Two Biological Parents 38.2% 43.0% 18.7%
Single Parent Home 33.5% 47.9% 18.6%
Other Family Structure 32.4% 46.7% 20.9%
Females
Age at Wave I (X2 (2) = 162.8, p < .001)
Aged 11-14 52.4% 34.7% 13.0%
Aged 15-19 67.6% 26.0% 6.4%
Race/Ethnicity (X2 (6) = 184.7, p < .001)
Caucasian 58.7% 29.2% 12.0%
Black 68.1% 30.5% 1.3%
Latino 68.2% 25.8% 6.0%
Another Race/Ethnicity 68.0% 24.4% 7.6%
Nativity (X2 (2) = 130.2, p < .001)
Native Born 61.3% 30.0% 8.7%
Foreign Born 90.0% 7.2% 2.8%
Family Structure at Wave I (X2 (4) = 60.9, p < .001)
Two Biological Parents 66.3% 24.7% 8.9%
Single Parent Home 60.6% 32.1% 7.2%
Other Family Structure 57.5% 34.2% 8.3%
*Note: The sum of the percentages in each row add up to 100%.
11
ResearchBrief
Transitioning to Adulthood:HOW DO YOUNG ADULTS FARE AND WHAT CHARACTERISTICS ARE ASSOCIATED WITH A LOWER-RISK TRANSITION?
Research Brief
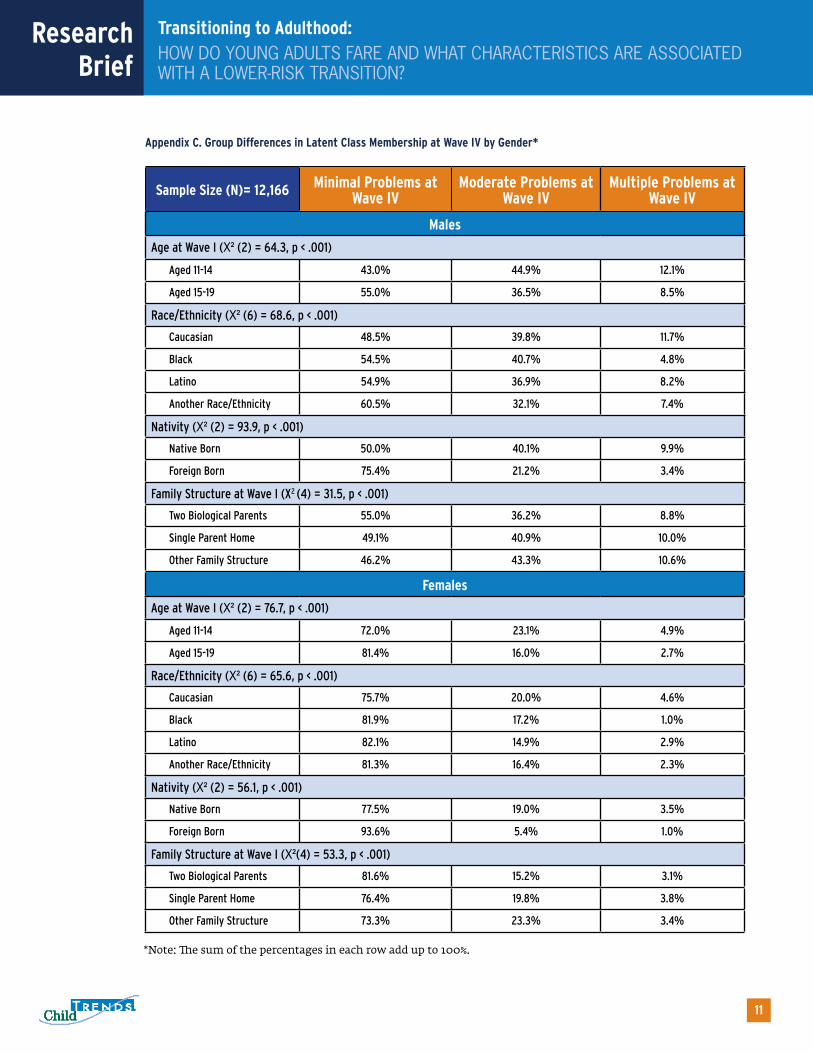
Appendix C. Group Differences in Latent Class Membership at Wave IV by Gender*
Sample Size (N)= 12,166 Minimal Problems at Wave IV
Moderate Problems at Wave IV
Multiple Problems at Wave IV
Males
Age at Wave I (X² (2) = 64.3, p < .001)
Aged 11-14 43.0% 44.9% 12.1%
Aged 15-19 55.0% 36.5% 8.5%
Race/Ethnicity (X² (6) = 68.6, p < .001)
Caucasian 48.5% 39.8% 11.7%
Black 54.5% 40.7% 4.8%
Latino 54.9% 36.9% 8.2%
Another Race/Ethnicity 60.5% 32.1% 7.4%
Nativity (X² (2) = 93.9, p < .001)
Native Born 50.0% 40.1% 9.9%
Foreign Born 75.4% 21.2% 3.4%
Family Structure at Wave I (X2 (4) = 31.5, p < .001)
Two Biological Parents 55.0% 36.2% 8.8%
Single Parent Home 49.1% 40.9% 10.0%
Other Family Structure 46.2% 43.3% 10.6%
*Note: The sum of the percentages in each row add up to 100%.
Females
Age at Wave I (X² (2) = 76.7, p < .001)
Aged 11-14 72.0% 23.1% 4.9%
Aged 15-19 81.4% 16.0% 2.7%
Race/Ethnicity (X² (6) = 65.6, p < .001)
Caucasian 75.7% 20.0% 4.6%
Black 81.9% 17.2% 1.0%
Latino 82.1% 14.9% 2.9%
Another Race/Ethnicity 81.3% 16.4% 2.3%
Nativity (X² (2) = 56.1, p < .001)
Native Born 77.5% 19.0% 3.5%
Foreign Born 93.6% 5.4% 1.0%
Family Structure at Wave I (X²(4) = 53.3, p < .001)
Two Biological Parents 81.6% 15.2% 3.1%
Single Parent Home 76.4% 19.8% 3.8%
Other Family Structure 73.3% 23.3% 3.4%
12
ResearchBrief
Transitioning to Adulthood:HOW DO YOUNG ADULTS FARE AND WHAT CHARACTERISTICS ARE ASSOCIATED WITH A LOWER-RISK TRANSITION?
Research Brief
© Child Trends 2014. May be reprinted with appropriate citation.
Child Trends is a nonprofit, nonpartisan research center that studies children at all stages of development. Our mission is to improve the lives and prospects of children and youth by conducting high-quality research and sharing the resulting knowledge with practitioners and policymakers. For additional information, including publications available to download, visit our website at childtrends.org.
REFERENCES
Arnett, J. J. (2004). Emerging adulthood: The winding road from late teens through the twenties. New York: Oxford University Press.
Arnett, J. J. (2000). Emerging adulthood: A theory of development from the late teens through the twenties. American Psychologist 55(5), 469-80.
Bray, B., Lanza, S. T., & Tan, X. (2012). An Introduction to Elminating Bias in Classify-Analyze Approaches for Latent Class Analysis. University Park, PA: The Methodology Center at Penn State.
Callahan, S. T. and W. O. Cooper (2005). "Uninsurance and health care access among young adults in the United States." Pediatrics, 116(1): 88-95.
Cote, J. & Bynner, J. M. (2008). Changes in the Transition to Adulthood in the UK and Canada: The Role of Structure and Agency in Emerging Adulthood. Journal of Youth Studies 11(3), 251-68.
Giedd, J. N. (2004). "Structural magnetic resonance imaging of the adolescent brain."Annals of the New York Academy of Sciences, 1021: 77-85.
Methodology Center (2013). PROC LCA & PROC LTA (Version 1.3.0) [Software]. University Park: The Pennsylvania State University. Retrieved from http://methodology.psu.edu; Lanza, S. T., Dziak, J. J., Huang, L., Wagner, A., & Collins, L. M. (2013). PROC LCA & PROC LTA users' guide (Version 1.3.0). University Park: The Methodology Center, Penn State. Retrieved from http://methodology.psu.edu
Roisman, G. I., Masten, A. S., Coatsworth, J. D. & Tellegen, A. (2004). Salient and emerging developmental tasks in the transition to adulthood. Child Dev. 75(1), 123-33.
Shanahan, M. J., Porfeli, E., Mortimer, J. T. & Erickson, L. D. (2005). Subjective age identity and the transition to adulthood: When do adolescents become adults? In Furstenberg, F.F., Rumbaut, R. & Settersten, R. (Eds.), On the Frontier of Adulthood: Theory, Research, and Public Policy. Chicago, IL: University of Chicago Press.
Yu, J. W., Adams, S. H., Burns, J., Brindis, C. D. & Irwin, C. E., Jr. (2008). Use of mental health counseling as adolescents become young adults. Journal of Adolescent Health 43(3), 268-76.