research in body/garment relationships · research in body/garment relationships ... in the left...
TRANSCRIPT

Research in Body/Garment Relationships
Susan P. ASHDOWN
a, Catherine DEVINE
a, Paul D. ERICKSON
b
aDepartment of Fiber Science & Apparel Design
bDepartment of Learning Strategies
Cornell University, Ithaca (NY) USA
Abstract
Apparel fit is a complex concept, involving cultural, individual and functional aspects of the relationship of clothing to the body. Variations in body sizes, shapes, proportions and postures coupled with style, function and material variations unite to complicate the process of measuring fit effectively. Methods of analyzing or quantifying fit generally involve subjective assessment, by the wearer or by an expert, in fit or wear tests. Few methods of objectively measuring clothing fit exist. In this paper we describe a method of quantifying the fit of clothing from 3D scans. We create 12 skirts made from a variety of materials in two different styles, fitted to a dress form. The dress form is scanned, and then each skirt is scanned on the dress form. Merging the scan of the dress form with each of the skirt scans provides 3D files from which the gap between the garments and the form can be quantified. Cross sections are taken from each set of merged scans at 10mm increments from waist to hem. Radial measures from the garment cross sections to the dress form cross section are used to analyze the differences in fit among the skirts. Results show that the measured differences in fit among the skirt models are consistent with the fabric and style properties, both in the distances of the garments from the body and in the variations in the configurations of fabric folds on the body. The stiffness of the fabric, weave variations, grainline, and the length variations of the styles affected the fit of the skirts. Keywords: Apparel fit, fabric drape, cross sections, radial measures
1. Introduction
Studies of apparel fit are critical for understanding the relationship of garments to bodies. Such studies can be used to improve sizing and fit of apparel in many different ways; the development of improved sizing systems for ready-to-wear
1, the creation and testing of systems for customization and mass
customization for better fitting clothing 2, and collection of data to improve the design and sizing
systems of functional or protective clothing 3, 4
. Improving the fit and function of protective clothing is a particularly critical activity, which can ultimately save lives and improve working conditions of those who serve in hazardous occupations.
In the past fit studies have often been difficult to conduct and can give inconclusive results 5. There is
much variation in body sizes, shapes, and postures in the population. This variation, in combination with issues of individual fit preference and the variety of clothing styles and functions that need to be addressed creates a situation which is further complicated by the vast range of materials with different properties used in making clothing. As a result clothing systems are extremely complex and contain an exponential number of variables. Understanding fit is a three dimensional problem that is further complicated by the fact that the body is obscured by the garment, so the interaction between body and garment can only be inferred by the form of the garment, generally quantified and judged by visually assessing a set of five variables; ease, grain, line, set, and balance
6.
Methods used in fit testing to date fall into three different broad categories, the assessment of fit by the user of the clothing, expert fit assessment, and objective measures of fit
7. Fit tests and wear tests are
International Conference on 3D Body Scanning Technologies, Lugano, Switzerland, 19-20 October 2010
96

conducted, both in the apparel industry and by apparel researchers to assess fit, relying on both expert and wearer responses for analysis
8, 9. However, subjective measures are not reliable, and expert and
wearer responses often conflict. Objective measurements that quantify the relationship between the body and garment are needed.
The traditional method of collecting objective body and garment measurements to provide data relating to fit is to collect measurements using a tailor’s tape measure. However, these measurements are unreliable and not well correlated between the body and the garment. Garments are typically measured flat on a table using landmarks on the garment that are only generally associated with the corresponding body measurements. It is only with the development of 3D body scan technology that reliable measurements can be made in such a way that true comparisons are possible between the body and the garment measurements, taken at the same location and in three dimensions, as the garment is worn
10.
Scanning technology at its simplest can be used to quickly and automatically generate body measurements from individuals, and many 3D body scan research projects conducted for apparel focus only on automated extraction of these linear body measurements. However, understanding the relationship between the body and clothing requires the development of different ways of using the 3D data generated from the scanner. As early as 1993 Kathleen Robinette proposed merging 3D scans of the unclothed and clothed body in order to investigate the space between them
11. This is the essence
of, and a measurable and objective expression of clothing fit. Ng proposed a set of different measures of the space between the clothing and the body, including linear, cross sectional, volume, and a ‘signature curve’ created by plotting cross sectional measures against the height of each cross section 12
. Other studies have made use of cross sectional data derived from 3D scans in various ways to quantify fit
1, 13-16. Na, in her study of the fit of cooling vests in active body positions, used a method of
measuring and comparing radial measures between the garment and the body using tools and processes similar to our study
17.
Many different methods for measuring clothing fit are possible and desirable using the 3D body scanner in order to build a database of information about the three primary areas of variation noted – body size, shape, and posture variation; clothing style and function variation; and material variation. In this study, we look at data comparing material variations and style variations and how they are expressed in the fit of the garment. Some comparisons are also made between the fit of garments cut along different grain lines of the fabric. Body shape and size are held constant for this study by using a standard dress form for the body shape. We investigate the fit of basic ready-to-wear skirt styles for women by merging a 3D scan of the dress form with a scans of the garments on the dress form, and then analyzing cross sections taken at 10mm intervals and at critical body points.
2. Methods
2.1 Creating skirt models
Garments for this study were created for a women’s size 6 Alvanon dress form, with body measurements 70cm at the waist, 95cm at the full hip, and 20.5cm from waist to hip. Patterns for the skirt styles were created using Optitex PDS patternmaking software. Using standard apparel patternmaking techniques we created patterns for two styles of skirts. The first style is a fitted skirt with four darts at the waist in the front and four darts in the back. This style was modified to create a second style using flat pattern methods by converting the darts to flair, and adding additional flairs evenly spaced around the body. Muslin prototypes were constructed from the patterns, tested on the dress form, and adjustments were made to the patterns. The patterns were then used to make identical skirts from five different fabrics (cotton, denim, worsted wool, wool, and polyester) in each of the two styles for a total of 10 skirts (see Tables 1 and 2). We also constructed two additional skirts from the plain weave cotton fabric for comparison of the effects of the fabric grain line on apparel fit; a longer version of the flared skirt, and second longer version cut on the bias. The skirts were constructed without zippers or waistbands; waist edges and a 6 or 7 inch opening (depending on the style) in the left side seam were overlocked and stay stitched. Hems were created by overlocking the raw edges, pressing the edge up 2.54cm, and stitching by hand with a cross stitch, for maximum flexibility.
International Conference on 3D Body Scanning Technologies, Lugano, Switzerland, 19-20 October 2010
97
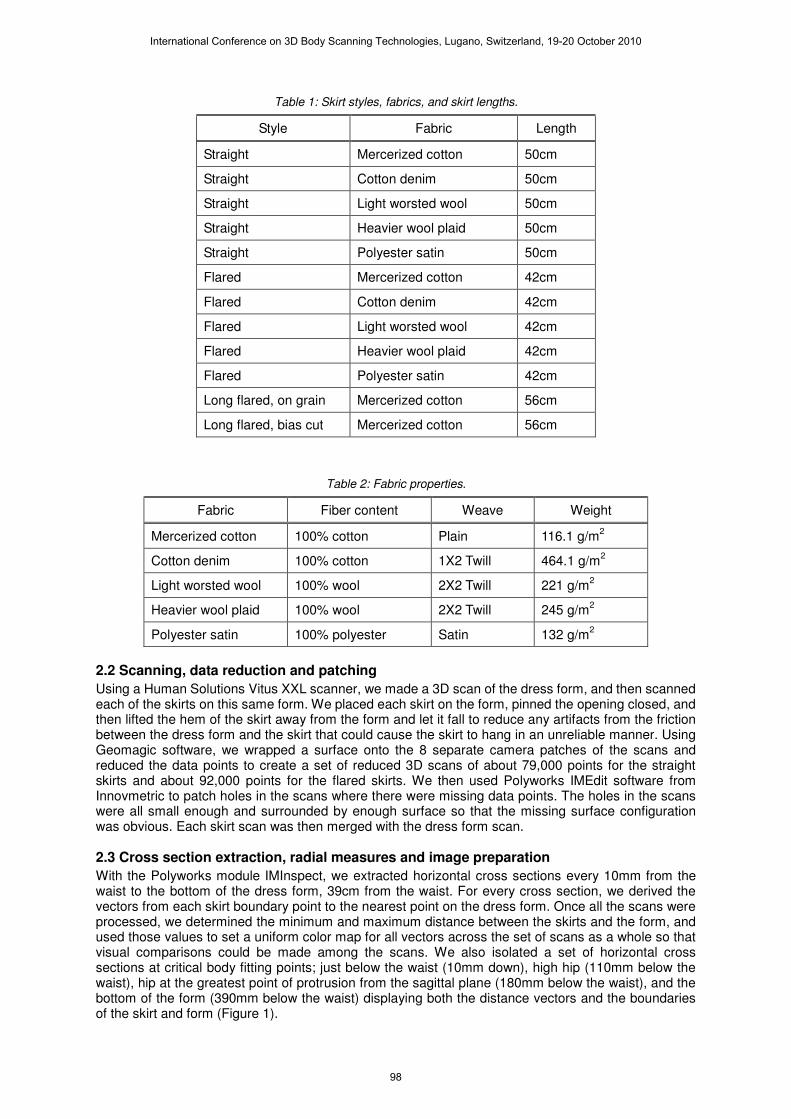
Table 1: Skirt styles, fabrics, and skirt lengths.
Style Fabric Length
Straight Mercerized cotton 50cm
Straight Cotton denim 50cm
Straight Light worsted wool 50cm
Straight Heavier wool plaid 50cm
Straight Polyester satin 50cm
Flared Mercerized cotton 42cm
Flared Cotton denim 42cm
Flared Light worsted wool 42cm
Flared Heavier wool plaid 42cm
Flared Polyester satin 42cm
Long flared, on grain Mercerized cotton 56cm
Long flared, bias cut Mercerized cotton 56cm
Table 2: Fabric properties.
Fabric Fiber content Weave Weight
Mercerized cotton 100% cotton Plain 116.1 g/m2
Cotton denim 100% cotton 1X2 Twill 464.1 g/m2
Light worsted wool 100% wool 2X2 Twill 221 g/m2
Heavier wool plaid 100% wool 2X2 Twill 245 g/m2
Polyester satin 100% polyester Satin 132 g/m2
2.2 Scanning, data reduction and patching
Using a Human Solutions Vitus XXL scanner, we made a 3D scan of the dress form, and then scanned each of the skirts on this same form. We placed each skirt on the form, pinned the opening closed, and then lifted the hem of the skirt away from the form and let it fall to reduce any artifacts from the friction between the dress form and the skirt that could cause the skirt to hang in an unreliable manner. Using Geomagic software, we wrapped a surface onto the 8 separate camera patches of the scans and reduced the data points to create a set of reduced 3D scans of about 79,000 points for the straight skirts and about 92,000 points for the flared skirts. We then used Polyworks IMEdit software from Innovmetric to patch holes in the scans where there were missing data points. The holes in the scans were all small enough and surrounded by enough surface so that the missing surface configuration was obvious. Each skirt scan was then merged with the dress form scan. 2.3 Cross section extraction, radial measures and image preparation
With the Polyworks module IMInspect, we extracted horizontal cross sections every 10mm from the waist to the bottom of the dress form, 39cm from the waist. For every cross section, we derived the vectors from each skirt boundary point to the nearest point on the dress form. Once all the scans were processed, we determined the minimum and maximum distance between the skirts and the form, and used those values to set a uniform color map for all vectors across the set of scans as a whole so that visual comparisons could be made among the scans. We also isolated a set of horizontal cross sections at critical body fitting points; just below the waist (10mm down), high hip (110mm below the waist), hip at the greatest point of protrusion from the sagittal plane (180mm below the waist), and the bottom of the form (390mm below the waist) displaying both the distance vectors and the boundaries of the skirt and form (Figure 1).
International Conference on 3D Body Scanning Technologies, Lugano, Switzerland, 19-20 October 2010
98
Skirt cross sections contained between 751 and 2353 points each, depending on the level of the cross section and the style of the skirt. The dress form cross sections contained the following: 1372 points at the cross section below the waist, 1465 points at the high hip, 1466 points at the hip, and 1107 points at the bottom of the form.
Fig. 1. a) Straight denim skirt in scanner; b) Flared skirt and dress form scans merged; c) Cross section of straight denim skirt at the form bottom; d) cross section of flared denim skirt at the form bottom (color-mapped vectors).
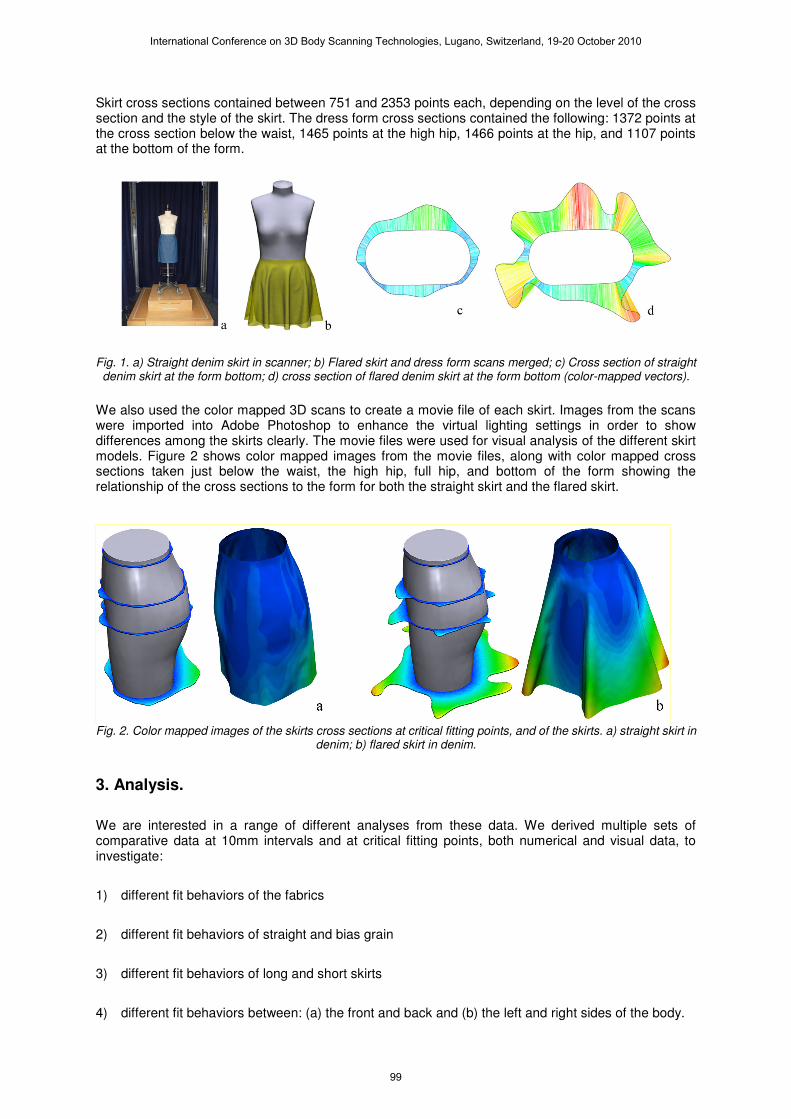
We also used the color mapped 3D scans to create a movie file of each skirt. Images from the scans were imported into Adobe Photoshop to enhance the virtual lighting settings in order to show differences among the skirts clearly. The movie files were used for visual analysis of the different skirt models. Figure 2 shows color mapped images from the movie files, along with color mapped cross sections taken just below the waist, the high hip, full hip, and bottom of the form showing the relationship of the cross sections to the form for both the straight skirt and the flared skirt.
Fig. 2. Color mapped images of the skirts cross sections at critical fitting points, and of the skirts. a) straight skirt in
denim; b) flared skirt in denim.
3. Analysis.
We are interested in a range of different analyses from these data. We derived multiple sets of comparative data at 10mm intervals and at critical fitting points, both numerical and visual data, to investigate:
1) different fit behaviors of the fabrics
2) different fit behaviors of straight and bias grain
3) different fit behaviors of long and short skirts
4) different fit behaviors between: (a) the front and back and (b) the left and right sides of the body.
International Conference on 3D Body Scanning Technologies, Lugano, Switzerland, 19-20 October 2010
99
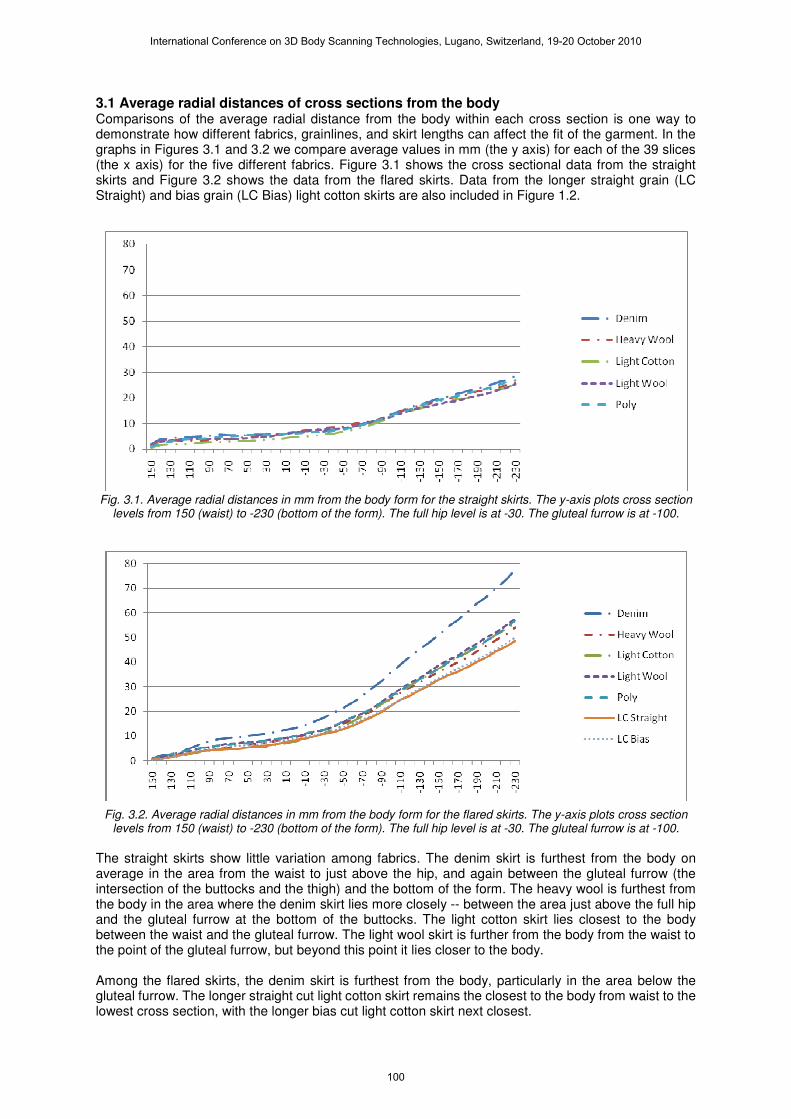
3.1 Average radial distances of cross sections from the body Comparisons of the average radial distance from the body within each cross section is one way to demonstrate how different fabrics, grainlines, and skirt lengths can affect the fit of the garment. In the graphs in Figures 3.1 and 3.2 we compare average values in mm (the y axis) for each of the 39 slices (the x axis) for the five different fabrics. Figure 3.1 shows the cross sectional data from the straight skirts and Figure 3.2 shows the data from the flared skirts. Data from the longer straight grain (LC Straight) and bias grain (LC Bias) light cotton skirts are also included in Figure 1.2.
Fig. 3.1. Average radial distances in mm from the body form for the straight skirts. The y-axis plots cross section
levels from 150 (waist) to -230 (bottom of the form). The full hip level is at -30. The gluteal furrow is at -100.
Fig. 3.2. Average radial distances in mm from the body form for the flared skirts. The y-axis plots cross section levels from 150 (waist) to -230 (bottom of the form). The full hip level is at -30. The gluteal furrow is at -100.
The straight skirts show little variation among fabrics. The denim skirt is furthest from the body on average in the area from the waist to just above the hip, and again between the gluteal furrow (the intersection of the buttocks and the thigh) and the bottom of the form. The heavy wool is furthest from the body in the area where the denim skirt lies more closely -- between the area just above the full hip and the gluteal furrow at the bottom of the buttocks. The light cotton skirt lies closest to the body between the waist and the gluteal furrow. The light wool skirt is further from the body from the waist to the point of the gluteal furrow, but beyond this point it lies closer to the body. Among the flared skirts, the denim skirt is furthest from the body, particularly in the area below the gluteal furrow. The longer straight cut light cotton skirt remains the closest to the body from waist to the lowest cross section, with the longer bias cut light cotton skirt next closest.
International Conference on 3D Body Scanning Technologies, Lugano, Switzerland, 19-20 October 2010
100
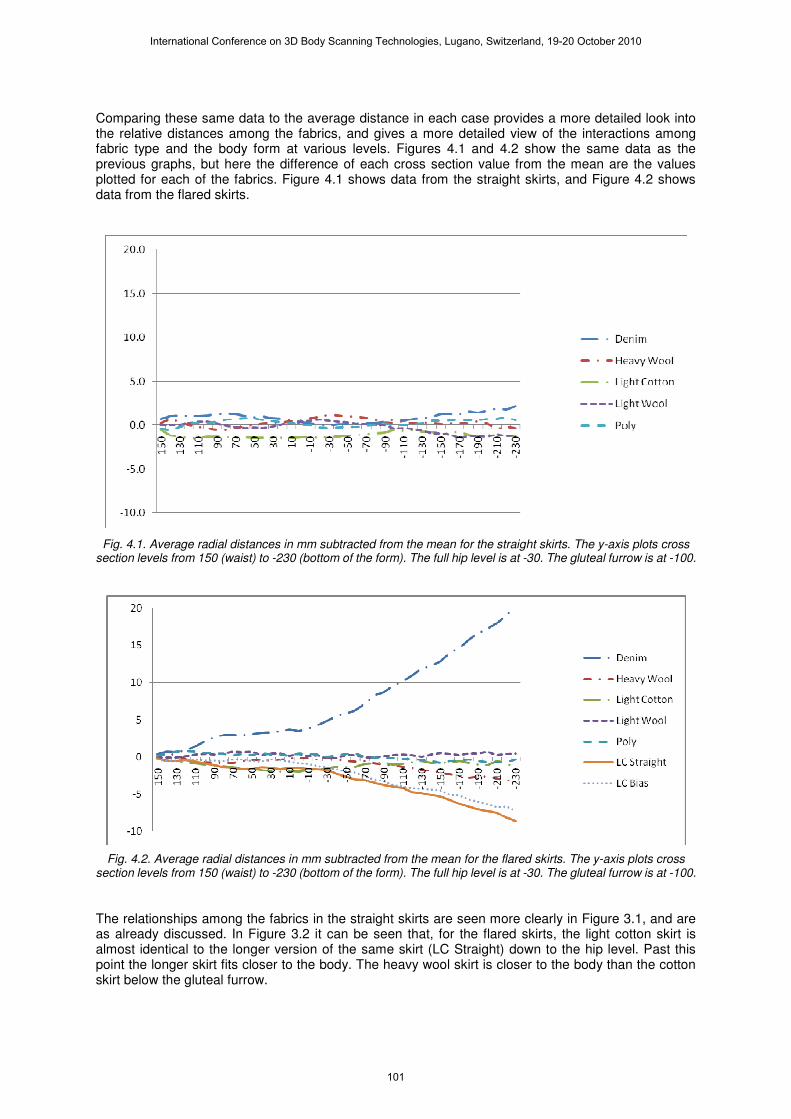
Comparing these same data to the average distance in each case provides a more detailed look into the relative distances among the fabrics, and gives a more detailed view of the interactions among fabric type and the body form at various levels. Figures 4.1 and 4.2 show the same data as the previous graphs, but here the difference of each cross section value from the mean are the values plotted for each of the fabrics. Figure 4.1 shows data from the straight skirts, and Figure 4.2 shows data from the flared skirts.
Fig. 4.1. Average radial distances in mm subtracted from the mean for the straight skirts. The y-axis plots cross section levels from 150 (waist) to -230 (bottom of the form). The full hip level is at -30. The gluteal furrow is at -100.
Fig. 4.2. Average radial distances in mm subtracted from the mean for the flared skirts. The y-axis plots cross section levels from 150 (waist) to -230 (bottom of the form). The full hip level is at -30. The gluteal furrow is at -100.
The relationships among the fabrics in the straight skirts are seen more clearly in Figure 3.1, and are as already discussed. In Figure 3.2 it can be seen that, for the flared skirts, the light cotton skirt is almost identical to the longer version of the same skirt (LC Straight) down to the hip level. Past this point the longer skirt fits closer to the body. The heavy wool skirt is closer to the body than the cotton skirt below the gluteal furrow.
International Conference on 3D Body Scanning Technologies, Lugano, Switzerland, 19-20 October 2010
101
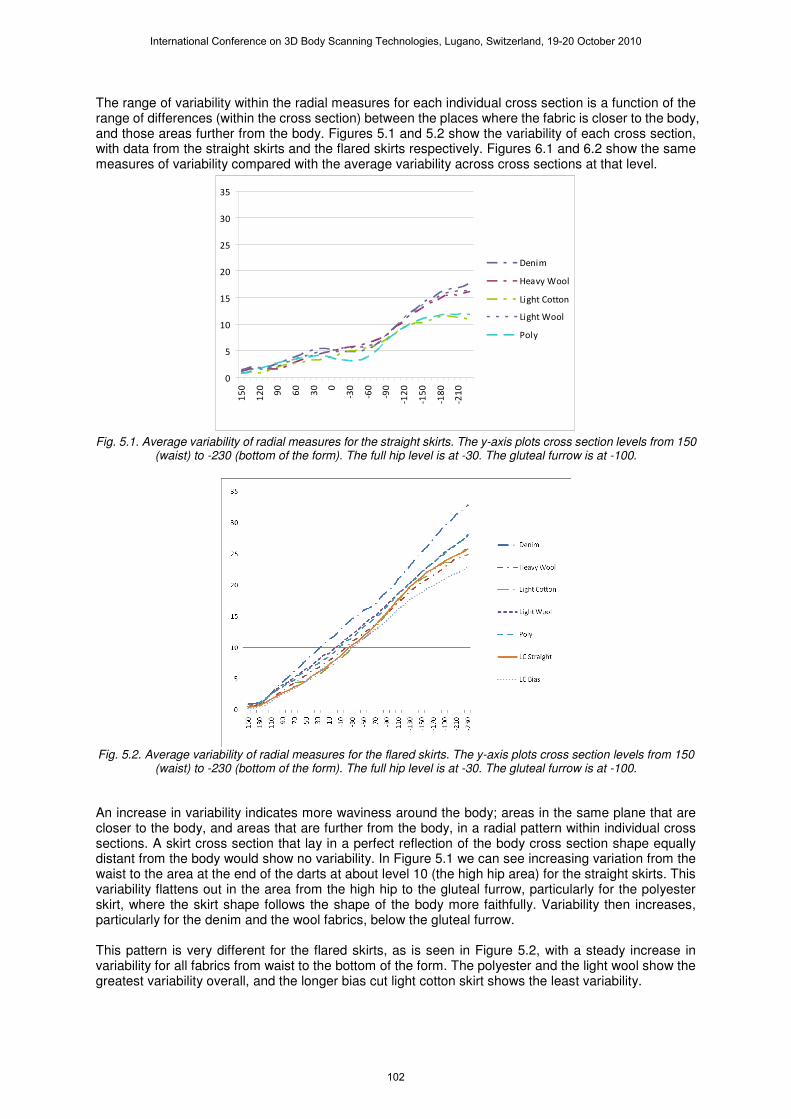
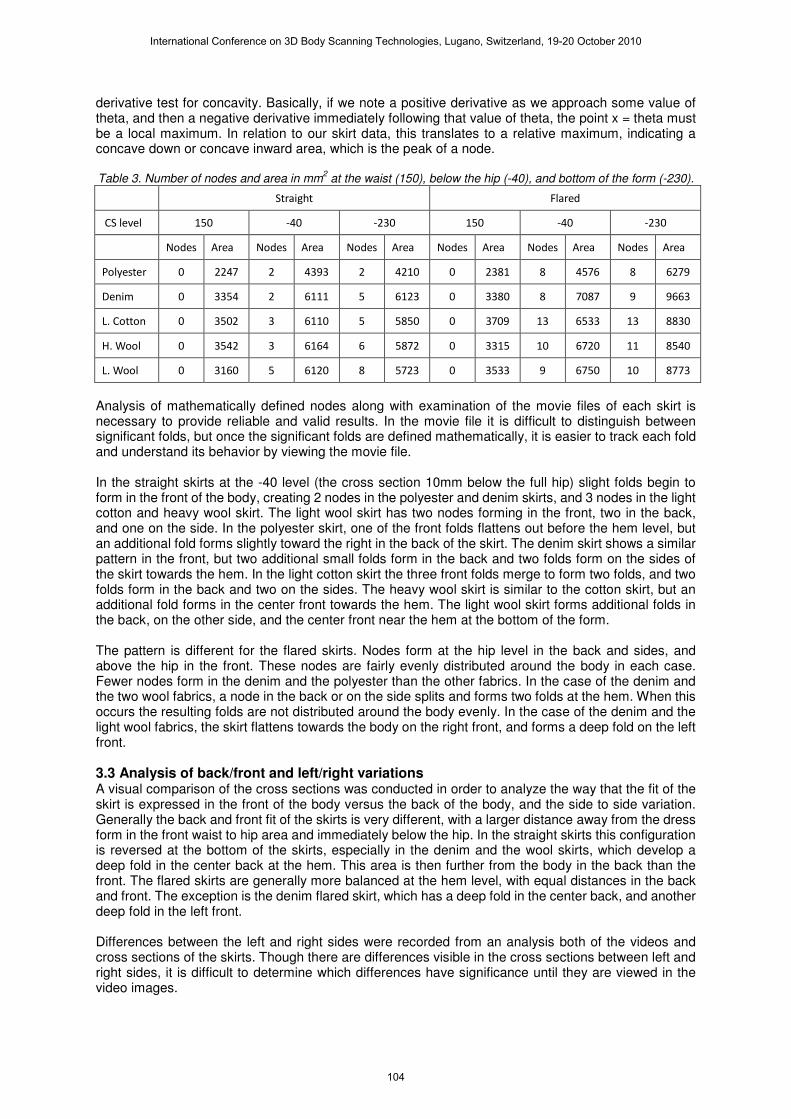
The range of variability within the radial measures for each individual cross section is a function of the range of differences (within the cross section) between the places where the fabric is closer to the body, and those areas further from the body. Figures 5.1 and 5.2 show the variability of each cross section, with data from the straight skirts and the flared skirts respectively. Figures 6.1 and 6.2 show the same measures of variability compared with the average variability across cross sections at that level.
0
5
10
15
20
25
30
35
15
0
12
0
90
60
30 0
-30
-60
-90
-12
0
-15
0
-18
0
-21
0
Denim
Heavy Wool
Light Cotton
Light Wool
Poly
Fig. 5.1. Average variability of radial measures for the straight skirts. The y-axis plots cross section levels from 150
(waist) to -230 (bottom of the form). The full hip level is at -30. The gluteal furrow is at -100.
Fig. 5.2. Average variability of radial measures for the flared skirts. The y-axis plots cross section levels from 150
(waist) to -230 (bottom of the form). The full hip level is at -30. The gluteal furrow is at -100.
An increase in variability indicates more waviness around the body; areas in the same plane that are closer to the body, and areas that are further from the body, in a radial pattern within individual cross sections. A skirt cross section that lay in a perfect reflection of the body cross section shape equally distant from the body would show no variability. In Figure 5.1 we can see increasing variation from the waist to the area at the end of the darts at about level 10 (the high hip area) for the straight skirts. This variability flattens out in the area from the high hip to the gluteal furrow, particularly for the polyester skirt, where the skirt shape follows the shape of the body more faithfully. Variability then increases, particularly for the denim and the wool fabrics, below the gluteal furrow. This pattern is very different for the flared skirts, as is seen in Figure 5.2, with a steady increase in variability for all fabrics from waist to the bottom of the form. The polyester and the light wool show the greatest variability overall, and the longer bias cut light cotton skirt shows the least variability.
International Conference on 3D Body Scanning Technologies, Lugano, Switzerland, 19-20 October 2010
102

Fig. 6.1. Variability of radial measures subtracted from the mean of variability for the straight skirts.The y-axis plots cross sections from 150 (waist) to -230 (bottom of form). The full hip level is at -30. The gluteal furrow is at -100.
Fig. 6.2. Variability of radial measures subtracted from the mean of variability for the flared skirts. The y-axis plots cross sections from 150 (waist) to -230 (bottom of form). The full hip level is at -30. The gluteal furrow is at -100.
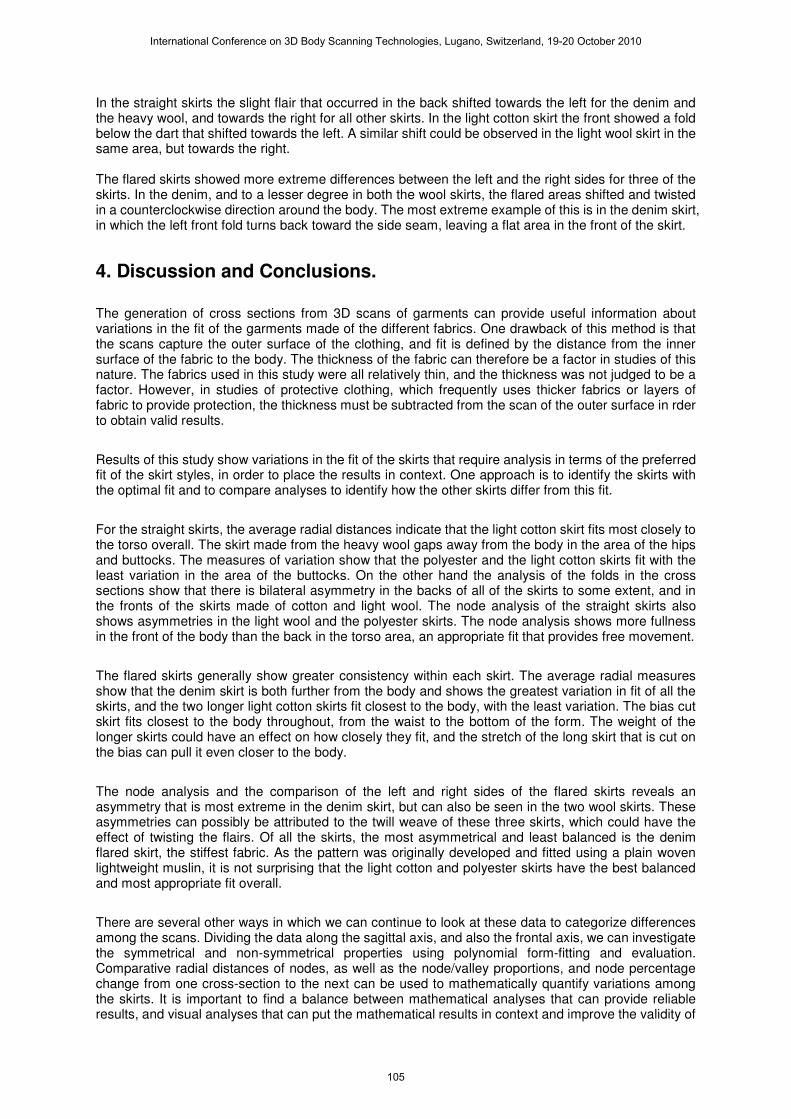
Figures 6.1 and 6.2 show the same patterns of variability as discussed, with a more detailed demonstration of the differences between the fabrics, and between the two longer light cotton skirts in the light cotton. The behavior of the longer skirt in the light cotton cut on the straight grain is notable, as it shows much more variation than the longer skirt cut on the bias. 3.2 Node patterns An exploration of node patterns, that is, the way that the skirts of different fabrics form folds, can be used to analyze the different fabric and style behaviors. Table 3 shows a comparison of the number of nodes formed at the waist, at an area just below the fullest part of the hip, and at the bottom of the form along with measures of the area enclosed by all the nodes at each level expressed in mm
2. The nodes
are identified by noting concavity. If we treat the distance as a function of the radial measure and fit a polynomial equation to the corresponding data point we can take the derivative and perform the first
International Conference on 3D Body Scanning Technologies, Lugano, Switzerland, 19-20 October 2010
103
derivative test for concavity. Basically, if we note a positive derivative as we approach some value of theta, and then a negative derivative immediately following that value of theta, the point x = theta must be a local maximum. In relation to our skirt data, this translates to a relative maximum, indicating a concave down or concave inward area, which is the peak of a node. Table 3. Number of nodes and area in mm
2 at the waist (150), below the hip (-40), and bottom of the form (-230).
Straight Flared
CS level 150 -40 -230 150 -40 -230
Nodes Area Nodes Area Nodes Area Nodes Area Nodes Area Nodes Area
Polyester 0 2247 2 4393 2 4210 0 2381 8 4576 8 6279
Denim 0 3354 2 6111 5 6123 0 3380 8 7087 9 9663
L. Cotton 0 3502 3 6110 5 5850 0 3709 13 6533 13 8830
H. Wool 0 3542 3 6164 6 5872 0 3315 10 6720 11 8540
L. Wool 0 3160 5 6120 8 5723 0 3533 9 6750 10 8773
Analysis of mathematically defined nodes along with examination of the movie files of each skirt is necessary to provide reliable and valid results. In the movie file it is difficult to distinguish between significant folds, but once the significant folds are defined mathematically, it is easier to track each fold and understand its behavior by viewing the movie file. In the straight skirts at the -40 level (the cross section 10mm below the full hip) slight folds begin to form in the front of the body, creating 2 nodes in the polyester and denim skirts, and 3 nodes in the light cotton and heavy wool skirt. The light wool skirt has two nodes forming in the front, two in the back, and one on the side. In the polyester skirt, one of the front folds flattens out before the hem level, but an additional fold forms slightly toward the right in the back of the skirt. The denim skirt shows a similar pattern in the front, but two additional small folds form in the back and two folds form on the sides of the skirt towards the hem. In the light cotton skirt the three front folds merge to form two folds, and two folds form in the back and two on the sides. The heavy wool skirt is similar to the cotton skirt, but an additional fold forms in the center front towards the hem. The light wool skirt forms additional folds in the back, on the other side, and the center front near the hem at the bottom of the form. The pattern is different for the flared skirts. Nodes form at the hip level in the back and sides, and above the hip in the front. These nodes are fairly evenly distributed around the body in each case. Fewer nodes form in the denim and the polyester than the other fabrics. In the case of the denim and the two wool fabrics, a node in the back or on the side splits and forms two folds at the hem. When this occurs the resulting folds are not distributed around the body evenly. In the case of the denim and the light wool fabrics, the skirt flattens towards the body on the right front, and forms a deep fold on the left front. 3.3 Analysis of back/front and left/right variations A visual comparison of the cross sections was conducted in order to analyze the way that the fit of the skirt is expressed in the front of the body versus the back of the body, and the side to side variation. Generally the back and front fit of the skirts is very different, with a larger distance away from the dress form in the front waist to hip area and immediately below the hip. In the straight skirts this configuration is reversed at the bottom of the skirts, especially in the denim and the wool skirts, which develop a deep fold in the center back at the hem. This area is then further from the body in the back than the front. The flared skirts are generally more balanced at the hem level, with equal distances in the back and front. The exception is the denim flared skirt, which has a deep fold in the center back, and another deep fold in the left front. Differences between the left and right sides were recorded from an analysis both of the videos and cross sections of the skirts. Though there are differences visible in the cross sections between left and right sides, it is difficult to determine which differences have significance until they are viewed in the video images.
International Conference on 3D Body Scanning Technologies, Lugano, Switzerland, 19-20 October 2010
104
In the straight skirts the slight flair that occurred in the back shifted towards the left for the denim and the heavy wool, and towards the right for all other skirts. In the light cotton skirt the front showed a fold below the dart that shifted towards the left. A similar shift could be observed in the light wool skirt in the same area, but towards the right. The flared skirts showed more extreme differences between the left and the right sides for three of the skirts. In the denim, and to a lesser degree in both the wool skirts, the flared areas shifted and twisted in a counterclockwise direction around the body. The most extreme example of this is in the denim skirt, in which the left front fold turns back toward the side seam, leaving a flat area in the front of the skirt.
4. Discussion and Conclusions.
The generation of cross sections from 3D scans of garments can provide useful information about variations in the fit of the garments made of the different fabrics. One drawback of this method is that the scans capture the outer surface of the clothing, and fit is defined by the distance from the inner surface of the fabric to the body. The thickness of the fabric can therefore be a factor in studies of this nature. The fabrics used in this study were all relatively thin, and the thickness was not judged to be a factor. However, in studies of protective clothing, which frequently uses thicker fabrics or layers of fabric to provide protection, the thickness must be subtracted from the scan of the outer surface in rder to obtain valid results.
Results of this study show variations in the fit of the skirts that require analysis in terms of the preferred fit of the skirt styles, in order to place the results in context. One approach is to identify the skirts with the optimal fit and to compare analyses to identify how the other skirts differ from this fit.
For the straight skirts, the average radial distances indicate that the light cotton skirt fits most closely to the torso overall. The skirt made from the heavy wool gaps away from the body in the area of the hips and buttocks. The measures of variation show that the polyester and the light cotton skirts fit with the least variation in the area of the buttocks. On the other hand the analysis of the folds in the cross sections show that there is bilateral asymmetry in the backs of all of the skirts to some extent, and in the fronts of the skirts made of cotton and light wool. The node analysis of the straight skirts also shows asymmetries in the light wool and the polyester skirts. The node analysis shows more fullness in the front of the body than the back in the torso area, an appropriate fit that provides free movement.
The flared skirts generally show greater consistency within each skirt. The average radial measures show that the denim skirt is both further from the body and shows the greatest variation in fit of all the skirts, and the two longer light cotton skirts fit closest to the body, with the least variation. The bias cut skirt fits closest to the body throughout, from the waist to the bottom of the form. The weight of the longer skirts could have an effect on how closely they fit, and the stretch of the long skirt that is cut on the bias can pull it even closer to the body.
The node analysis and the comparison of the left and right sides of the flared skirts reveals an asymmetry that is most extreme in the denim skirt, but can also be seen in the two wool skirts. These asymmetries can possibly be attributed to the twill weave of these three skirts, which could have the effect of twisting the flairs. Of all the skirts, the most asymmetrical and least balanced is the denim flared skirt, the stiffest fabric. As the pattern was originally developed and fitted using a plain woven lightweight muslin, it is not surprising that the light cotton and polyester skirts have the best balanced and most appropriate fit overall.
There are several other ways in which we can continue to look at these data to categorize differences among the scans. Dividing the data along the sagittal axis, and also the frontal axis, we can investigate the symmetrical and non-symmetrical properties using polynomial form-fitting and evaluation. Comparative radial distances of nodes, as well as the node/valley proportions, and node percentage change from one cross-section to the next can be used to mathematically quantify variations among the skirts. It is important to find a balance between mathematical analyses that can provide reliable results, and visual analyses that can put the mathematical results in context and improve the validity of
International Conference on 3D Body Scanning Technologies, Lugano, Switzerland, 19-20 October 2010
105
the results in studies of this nature. Creating visual models with embedded information for analysis, as we have done with the creation of the color mapped models, can contribute to our understanding of the complex issues related to fit of clothing.
Similar analyses of other garment shapes and materials can also be undertaken to add to our understanding of apparel fit. Ultimately it should be possible to model fit in sophisticated ways that take fabric properties into account if enough information is collected from studies of this nature. It is also necessary to introduce body variation as an additional variable in order to understand the complexities of fit. Studies similar to this are difficult when clothing is scanned on people instead of dress forms, due to the difficulty of repeating a posture precisely for the clothed and unclothed scans. Variations such as bilateral asymmetries that exist in all people also add to the difficulty of interpreting results of these studies. However, the data from such studies can provide the most valid measure of clothing fit. Studies need to be undertaken to develop methods to resolve these difficulties.
References.
[1] Loker, S., Ashdown, S. P., and Schoenfelder, K., “Size-specific analysis of body scan data to improve apparel fit,” Journal of Textile and Apparel, Technology and Management 4(3), (2005). http://www.tx.ncsu.edu/jtatm/volume4issue3/articles/Loker/Loker_full_136_05.pdf. [2] Ashdown, S. P. and Dunne, L. , "A study of automated custom fit: readiness of the technology for the apparel industry," Clothing and Textiles Research Journal 24(2), 121-136 (2006). [3] Nam, J. and Ashdown, S. P. , "Fit analysis of liquid cooled vest prototypes using 3D body scanning technology," Journal of Textile and Apparel, Technology and Management 4(3) (2005). [4] Zheng, R., Yu, W. and Fan, J. , "Development of a new Chinese bra sizing system based on breast anthropometric measurements," International Journal of Industrial Ergonomics 37(8), 697-705 (2007). [5] McConville, J. T. , "Anthropometric fit testing and evaluation," In R. L. Barker, & Coletta, G.C. (Ed.), Performance of Protective Clothing: ASTM STP 900. Philadelphia, PA: American Society for Testing and Materials, 556-568 (1986). [6] Erwin, M., Kinchen, L. and Peters, K., [Clothing for Moderns], Prentice Hall, Englewood Cliffs, NJ (1979). [7] Fan, J., Yu, W. and Hunter, L., "Subjective assessment of clothing fit,", In Clothing Appearance and Fit: Science and Technology, Fan, J., Yu, W., and Hunter, L., Eds, Woodhead Publishing, Ltd, Cambridge, England. 31-41 (2004). [8] Ashdown, S. P. and O'Connell, E. K., "Comparison of test protocols for judging the fit of mature women's apparel," Clothing and Textiles Research Journal 24(2), 137-148 (2006). [9] Ashdown, S. P. Ed., "Sizing in Clothing: Developing Effective Sizing Systems for Ready-To-Wear Clothing," Woodhead Publishing, Ltd, Cambridge, England (2007). [10] Petrova, A. and Ashdown. S.P., " Three-dimensional body scan data analysis: Body size and shape dependence of ease values for pants fit," Clothing and Textiles Research Journal 26(3), 227-252 (2008). [11] Robinette, K. M., "Fit testing as a helmet development tool," Proceedings of the 37th Annual Meeting of the Human Factors and Ergonomics Society,Vol. 1, pp. 69-73, The Human Factors and Ergonomics Society, Santa Monica CA. (1993). [12] Ng, R., Chan, C. K., Pong, T. Y. and Au, R., "Objective measurement of the 'fit' of an apparel," Proceedings of the 77th Textile Institute World Conference (1996). [13] Kim, H., Suh, C., Suk, E., Park, S. and Lim, J., "A study of the comparative evaluation of wearing fitness of women's ready-made jackets using 3D scanner," Journal of the Korean Society of Clothing and Textiles 25(10), 1707-1718 (2001). [14] Taya, Y., Shibuya, A. and Nakajima, T., "Evaluation method of clothing fitness with body, part 1: evaluation index of clothing fitness," Journal of the Textile Machinery Society of Japan 48(2), 48-59 (1995). [15] Li, P., Corner, B. D., Paquette, S., Lee, C. and Kim, I. Y., "Analysis of air gap size and distribution in single and multilayer clothing systems using 3-D whole body digitizing," XIVth Triennial Congress of the International Ergonomics Association and the 44th Annual Meeting of the Human Factors and Ergonomics Society, 758-761 (2000). [16] Song, G., "Clothing air gaps layers and thermal protective performance in single layer garment," Journal of Industrial Textiles 36(3), 193-205 (2007). [17] Nam, J. H., Branson, D. H., Ashdown, S. P., Cao, H. and Carnrite, E. , "Analysis of ease values and fit of liquid cooled vests from 3D body scan data taken in working positions," under review for the International Journal of Clothing Science and Technology.
International Conference on 3D Body Scanning Technologies, Lugano, Switzerland, 19-20 October 2010
106