research methodology -...
TRANSCRIPT

47
CHAPTER III
Research Methodology
In the present study, an attempt has been made to study the role of women in
agriculture sector of Punjab. This study was based on the primary data collected from
women of farm families of Punjab with the help of a well drafted, structured and pre-
tested questionnaire (Appendix-I).
Research Question
In order to develop sound theoretical framework for this research work, a
comprehensive review of literature was undertaken. The review of literature revealed that
much work was not done in this field. Punjab had witnessed a revolution in the field of
education of rural people, especially women, and significant changes had occurred in
employment of farm labour and participation of women in agriculture sector. There has
been an improvement in the literacy levels, communication, agricultural practices and
other infrastructural systems. The government has been giving due importance and
priority to rural development which acted as a fillip for national development. The basic
research question was: What is the extent of participation of women and their
effectiveness in agriculture sector? It was also decided to study the role of women in
decision making in agriculture sector and factors affecting the same.
Universe of Study
Punjab is the one of the smallest states of India representing 1.5 percent
geographical area and 2.5 percent population of the country. The latitudinal and
longitudinal extent of the state is from 29°33’N to 32°314’E to 76°55’E. It is almost
triangular in shape with tip pointing to the north. The geographical area of the state is
50376 Sq kilometres and its population lives in 12188 villages and 108 towns. For better
administration of the state, it has been divided into three divisions comprising 20
districts, 117 blocks and 71 tehsils.
The agricultural resource base of the Punjab varied widely from one corner to the
other. This was visible from great disparity in agricultural development and economic
growth of different parts of the state. In order to plan for the harmonious development, it

48
was essential to pinpoint the agricultural problems and potentials of the different areas.
This was possible when spatial variation in the resource bases in terms of climate,
physiography, soil type and underground water reservoir were thoroughly assessed.
Sampling Design
As the extent of participation of women and their effectiveness in agriculture
sector, role of women in decision making in agriculture sector and the factors responsible
for the same were to be accessed, we carried out all the investigations in an appropriate
area which represented the state of Punjab in a comprehensive manner and at the same
time was suitable for carrying out such a research. On the basis of variations in
physiography, under ground quality and quantity of water, amount of rainfall and
moisture index, the Punjab was divisible into six regions (Deptt. of Agricultural
Meteorology, PAU, Ludhiana) viz. Sub-Mountain Undulating Region, Undulating Plain
Region, Western Plain Region, Western Region, Flood Plain Region and Central Plain
Region (which has been taken purposively for the present study). Five of these regions
were further divisible on the basis of the variations in soil characteristic. The regions thus
delineated on the basis of these criteria were homogeneous spatial units in terms of
agricultural problems and potentials, hence provided a sound base in the planning for
agricultural development instead of the districts, the boundaries of which cut across the
various agro-climatic regions. The six Agro-Climatic Regions are discussed as below:
SUB-MOUNTAIN UNDULATING REGION
This region extends along the eastern borders of the state and is 10 to 20
kilometer in width except in Gurdaspur district where it is much wider. This region
covers nearly 4800 square kilometres, where it is about 9.5 percent of the total area of the
state.
Bamial, Narot Jaimal Singh, Pathankot and Dharklan blocks of Gurdaspur district,
eastern half of Mukerian, Talwara, eastern halves of Dasuya, Bhunga, Hoshiarpur I and
Hoshiarpur II, Mahilpur, Garhshankar and entire Balachaur and Saroya blocks of
Hoshiarpur district, Dera Bassi block of Patiala district and Nurpur Bedi, Anandpur
Sahib, Ropar, Sialba Majri and Kharar blocks of Ropar district fall in this region.

49
The western limits of the region coincide approximately with 300-metre contour.
The slope of the land surface is more than 15 meter per kilometer near the Shiwalik hills
and decreases to about 8 meter per kilometer towards its western limits. The distinctive
character of the terrain in this region is that it is badly dissected by innumerable seasonal
streams. Hundreds of streams which originated in the Shiwalik hills have produced a very
uneven topography. The upper courses of the seasonal streams are covered with small
pebbles and coarse sand, whereas a few kilometer away from the Shiwalik hills, the beds
are covered with pure sand. Steep gradient, bare-land surface and torrential and heavier
rains during the monsoons have created serious problems of soil erosion.
UNDULATING PLAIN REGION
This narrow and transitional region runs parallel to the sub-mountain undulating
region and is 15 to 30 kilometer in width. This region covers about 4600 sq. kilometres of
land which represent about 9 percent area of the Punjab. It includes Dinanagar,
Gurdaspur, Kalanaur, Dhariwal, Kahnuwan and eastern Hargobindpur blocks of
Gurdaspur district (excluding their flood plain areas); western parts of Mukerian and
Dasuya, whole of Tanda, western half of Bhunga, Hoshiarpur I, western parts of
Hoshiarpur II, western parts of Mahilpur and Garshankar blocks of Hoshiarpur district;
Chamkaur Sahib block of Ropar district; Machhiwara block of Ludhiana and Bassi
Pathana, Rajpura and Ghanaur blocks (except the flood plain of the Ghaggar river) of
Patiala district.
The height of this region varies between 260 and 300 meters above sea level. It
has all the topographical characteristics of the region due east but in a moderate form.
The number of streams is less numerous. The slope of the land is considerable but smaller
than the eastern region. Soil erosion did take place but is less severe as compared to the
first region.
WESTERN PLAIN REGION
This region lies between the central flat plain on the east and the plain with sand
dunes in the extreme west. It covers about 9500 sq. kilometer representing nearly 19
percent area of the state.

50
Patti, Bhikhiwind and Valtoha blocks of Amritsar district; Zira, Ferozepur and
Ghall Khurd blocks of Ferozepur district; Faridkot, Moga I, Moga II, Nihal Singhwala
and Bagha Purana blocks of Faridkot district; Rampura Phul, Mansa eastern part of
Talwandi Sabo and Budhlada blocks of Bathinda districts and most of Barnala (except its
eastern extension), western parts of Sangrur and Sunam blocks and entire Lehragaga
block of Sangrur district are covered in this region. Flood plain areas of Sutlej river
covering the adjoining parts of Patti Tehsil and Zira and Ferozepur blocks and a small
area occupied by Ghaggar flood plain in Lehragaga block of Sangrur district in the
extreme south are excluded from this region.
It is transitional region where the flat topography merges gradually into a sand
dune dotted land surface. The average height of the land varies between 200 and 250
meter above sea level. There is no stream or river worth mentioning which crosses
through this region. The northern half is free from any topographical feature whereas
towards the western margins in the southern half, sand dunes are quite frequent feature of
the landscape.
WESTERN REGION
This region lies in the extreme southwest covering nearly 10,000 sq. kilometres
representing nearly 19.5 percent area of the Punjab.
Guru Har Sahai, Jalalabad and Fazlika blocks except the flood plain of river
Sutlej, and Abohar and Khuyan Sarwar blocks of Ferozepur district; Muktsar, Kot Bhai,
Malaut, Lambi and Kotkapura blocks of Faridkot district and Nathana, Bathinda, Sangat,
most of Talwandi Sabo and Jhinir blocks of Bathinda district fall in this region.
This is a conspicuous region of Punjab because of its dry climate and uneven
topography. The major part of the region lies at a height of less than 200 meter above sea
level and the land slopes less than one half of a metre in a kilometre. The entire region is
dotted with sand dunes of varying dimensions. In general, the sand dunes are bigger in
size in the southwest as compared to northeast. Wind erosion is mainly responsible to
give this area its distinctive topography. Sand dunes are the result of strong and
desiccating southwesterly winds which transport the huge clouds of sand from south-
west. Many of the sand dunes have been levelled off with the intensification of

51
agriculture. Some of the sand dunes are, however, of shifting nature and remain bare of
any vegetation or crop.
FLOOD PLAIN REGION (Bet)
This region has four separate components- the Ghaggar, the Sutlej, the Beas and
the Ravi flood plains. The flood plains are locally known as the bet. Along the northern
borders of Gurdaspur and Amritsar districts lies the flood plain of the Ravi and along the
southern border of Patiala and Sangrur districts is the flood plain of the Ghaggar. The
flood plains of the Beas and the Sutlej combine at Harike and make a common flood
plain along the northern border of Ferozepur district. Area covered by the flood plains is
about 3500 square kilometers which is about 7 percent of the total area of the Punjab.
The width of the flood plains, on an average, is between 10 and 15 kilometers. It
is relatively less in the sub-mountainous areas and increases to the maximum in the
middle of the state. The boundaries of the flood plains are well defined by an abrupt
depression in the land surface. The important characteristic of the flood plains is their
almost flatness with nothing to break the monotony of longitudinal or the transverse
profile. The only feature is some obliterated traces of interlocking channels of streams.
During the heavy rains, flood plains are sometimes turned into virtual swamps.
CENTRAL PLAIN REGION
The central plain region was taken as the area for the present study as this region,
70 to 80 kilometres in width, cuts through the state from northwest to southeast. The
region covers 18000 sq kilometers which represents about 36 percent of the total area of
the Punjab.
Whole of Amritsar district except the Bhikhiwind, Patti and Valtoha blocks and
flood plains of river Ravi and Beas; Batala, Fatehgarh Churian, Dera Baba Nanak and
Western part of Hargobindpur block of Gurdaspur districts (except the food plain parts in
the block) entire district of Kapurthala (except the flood plain of Beas) Jullundur and
Ludhiana districts (except Nawanshahar, Eastern Banga Machiwara block and flood plain
areas of Sutlej river) Dharmkot block of Ferozepur district (expect flood plain area of
52
river Sutlej) Mahal Kalan, Malerkotla, Duri, Bhawanigarh, eastern parts of Barnala ,
Sangrur and Sunam blocks of Sangrur district and entire Sirhind, Nabha, Patiala,
Bhunerheri and Samana block of Patiala district (except the flood plain of river Ghaggar)
fall in this region.
The general character of the land is homogenous. The slope of the land is very
gentle. The region intercepted transversally by the flood plain of the Sutlej and Beas. The
northern and Southern limits are also marked by the flood plains of the Ravi and Ghaggar
respectively. The average height of this plain is 230 to 260 meter above sea level. The
slope of the land decreases gradually from northeast to southwest where it diminishes to
less than a meter per kilometer. The most important characteristic of the land surface lies
on in its featurelessness except for few small pockets of sand bars. One such pocket lies
in Dona area of Kapurthala and Nakodar, one stretching from Machhiwara to Khanna and
the third in deep south in between Patiala and Samana. There are no traces of wind or
water erosion.
Underground Water
The depth of water table varies from 2 to 20 meter below the ground surface. In
blocks of Amritsar district (except Rayya, Jandiala and Khadur Sahib) Dera Baba Nanak
and Batala of Gurdaspur district, the strata available from 50 metre to 65 metre depth
contains medium to fine sand. The tubewells of 15 litres/sec capacity can be installed
within the depth. In remaining blocks of Amritsar and Gurdaspur districts, whole of
Kapurthala, Jullundhur and Ludhiana districts, Sirhind and Nabha block of Patiala district
Ahmedgarh, Mlerkotla, Mehal Kalan, Dhuri blocks of Sangrur district, the tubewell
yielding upto 15 litres/sec can be installed within 50 meter depth. The deeper tubewells
with 30 litre/sec or more discharge can be installed successfully with 100 meter depth. In
the remaining blocks of Patiala and Sangrur districts, tubewells can be installed a little
deeper. The quality of water is good in this region, except in parts of Sangrur district and
some pockets of other districts where it is marginal to good. The main problem is that of
residual sodium carbonates.

53
Climate
The mean maximum temperature recorded during the first fortnight of June is
42°C in the southern half and 41°C in the northern half, whereas the mean minimum
temperature recorded during the month of January varies from 7°C in the southern parts
to 4°C in northern parts of the region. The mean annual rainfall varies from 800 mm in
the east to about 500 mm towards the western limits. In the southern half, 3 months of the
rainy season receive a rainfall between 200 to 300 mm and one month between 50 and
100 mm. In the northern half, 2 months receive a rainfall between 200 to 300 mm, in 1
month the rainfall is less than 50 mm. In the rainy season period, June to September in
the Southern-half, 12 weeks can be classified as humid to wet, 2 weeks intermediate dry
to intermediate humid whereas 3 weeks are arid to dry. In the northern side, 13 weeks of
the session are classified as humid to wet, 1 week inter humid and 3 weeks as arid to dry.
Soils
On the basis of the texture of the soil, this region is further sub-divided into two
sub-regions.
a) Central Plain Region-North: The sub region covers the Amritsar district
(Excluding Bhikhiwind, Patti, and Valtoha blocks) and Dera Baba Nanak,
Fathegarh churian, Batala and Western part of Hargobindpur block of Gurdaspur
district. The western half of Kapurthala district along the river Beas also falls in
this sub-region. The soils are medium to heavy in texture. Mild to serious alkali
problem exists in the entire areas of Kapurthala district which fall in this sub-
region. Alkali problem of the similar magnitude also exists in the northern and
western blocks of Amritsar district. Serve alkali problem exists in Dera Baba
Nanak and Fathegarh Churian blocks of Gurdaspur district.
b) Central Plain region-South: This sub-region extends from the eastern flood plain
of river Beas upto southern limits of Patiala district. The soils of this sub-region
are light to medium in texture. Mild to severe alkali problem exists in the area of
Kapurthala, Patiala and Sangrur districts. A small pocket consisting of Sirhind,
Rajpura, Ghanaur and Bhunerheri blocks has, however medium to heavy
textured soils and are very close to the Southern component of the undulating
54
plain region. The areas of Sirhind and Patiala blocks are affected by severe alkali
problem along with water logging.
Cropping Pattern
In kharif season, Paddy is the principal crop over a large part of the region. In
addition to this, maize, groundnut and cotton desi occupy sizeable areas in Ludhiana, and
Sangrur districts. Around Phagwara and Dhuri sugar factories, sugarcane crop occupies
sizeable area.
In rabi season, wheat is the dominant enterprise in the region. In addition, gram
and barely occupy an important place in the cropping pattern of Sangrur district.
Pear (Pathar Nakh) followed by guava are important fruit trees in some areas of
Amritsar district. Grapes are grown in some localities in all the districts.
Sample Size
A sample of 300 female respondents from farm families was collected on the
basis of multi-stage sampling. Three districts of Punjab – Amritsar, Jalandhar and
Ludhiana were selected for the study from the Central Plain Region of Punjab on the
basis of convenience sampling. Two blocks from each district viz. Majitha and Tarsikka
blocks from Amritsar district, Adampur and Bhogpur blocks from Jalandhar district and
Doraha & Jagraon blocks from Ludhiana district were selected for the study on the basis
of random sampling. Further, five villages from each block were selected using random
sampling technique. Ten respondents, i.e. married female members of farming families
with only one respondent per family, from each of the villages were selected using
convenience sampling for the purpose of the study. The study was exploratory in nature.
The break up of respondents, according to their age, education, occupation and
income was as given below:
Age wise distribution
The respondents were classified into four age groups, viz., up to 30 years, more
than 30 up to 40 years, more than 40 up to 50 years and above 50 years. Table 3.1
revealed the age wise distribution of the respondents. It revealed that 22.3% of the

55
respondents were up to the age of 30 years, 44.7% fell in the age group between 30–40
years while 21.0% of the respondents were in the age group of 40-50 years. Rest of the
12.0% of the respondents belonged to the age group of above 50 years.
Table 3.1
Age Wise Distribution of Respondents
Age (in years) Number of
Respondents
Percentage of
Respondents
Cumulative
Percentage
Up to 30 67 22.3 22.3
30-40 134 44.7 67.0
40-50 63 21.0 88.0
Above 50 36 12.0 100.0
Total 300 100.0
Education Wise Distribution
The respondents were also categorised on the basis of their educational
qualifications. The educational qualification of the respondents was categorised into four
categories, viz. up to matriculation, up to senior secondary, up to graduation and post
Table 3.2
Education Wise Distribution of Respondents
Education Level Number of
Respondents
Percentage of
Respondents
Cumulative
Percentage
Up to Matric 151 50.3 50.3
Up to Sr. Secondary 78 26.0 76.3
Up to Graduation 54 18.0 94.3
Post graduation or above 17 5.7 100.0
Total 300 100

56
graduation or above. Table 3.2 revealed that 50.3% of the respondents had an educational
qualification of up to matric level. They were followed by another 26.0% of those having
an educational qualification of up to senior secondary level. 18.0% of the total
respondents were graduates followed by the remaining 5.7%, who were postgraduates or
above. Thus, the majority of the respondents were found to be undergraduates.
Occupation Wise Distribution of Respondents
The occupational grouping was also done for the purpose of the study. The main
objective of this distribution was to know the percentage of respondents engaged in any
other occupation along with agriculture.
Table 3.3 revealed that 79.3% of the respondents were not having any other
occupation along with agriculture. Only 20.7% of the respondents were found to be
involved in some other occupation along with agriculture. It meant that majority of the
respondents were dependent on agriculture alone for their livelihood.
Table 3.3
Any other occupation along with agriculture
Response Number of
Respondents
Percentage of
Respondents
Cumulative
Percentage
Yes 62 20.7 20.7
No 238 79.3 100.0
Total 300 100.0
Income Wise Distribution
Apart from the above, the respondents were also classified on the basis of their
annual family income into the five following categories viz. up to Rs. 1 lac, Rs. 1-2 lacs,
Rs. 2-3 lacs, Rs. 3-5 lacs and more than Rs. 5 lacs. Table 3.4 revealed that 27.7% of the
respondents were having a family income of more than Rs. 1 lac but less than Rs. 2 lacs
per annum. They were followed by another 26.3% of those having their annual family
income of less than Rs. 1 lac. Another 21.3% and 18.7% of the respondents were having

57
their annual family income of Rs. 2-3 lacs and Rs. 3-5 lacs respectively. Merely 6.0% of
the respondents were having an annual family income of more than Rs. 5 lacs.
Table 3.4
Income Wise Distribution of Respondents
Annual Income (in
Rs)
Number of
Respondents
Percentage of
Respondents
Cumulative
Percentage
Upto 1 lac 79 26.3 26.3
1-2 lacs 83 27.7 54.0
2-3 lacs 64 21.3 75.3
3-5 lacs 56 18.7 94.0
More than 5 lacs 18 6.0 100.0
Total 300 100.0
Ownership of Agricultural Land
The following discussion gave the details regarding the total land possession, land
taken on lease, if any, total land under cultivation and number of crops cultivated per year
by the families of the women respondents. Table 3.5 revealed that out of the total of 300
respondents, a total of 84 respondents i.e. 28.00% of the total respondents had a land
holding of not more than 5 acres. This meant that a total of 28.00% of the total
respondent women belonged to marginal farming families. Further, 97 respondents, i.e.
32.33% of the total respondents had a land holding of more than 5 acres but not more
than 10 acres. This meant that 32.33% of the total respondent women belonged to small
farming families.
32.00% of the respondents, i.e. a total of 96 respondent women were found to be
belonging to families having a land holding of more than 10 acres but not more than 20
acres. This meant that 32.00% of the respondent women belonged to medium farming
families.

58
Table 3.5
Total Land Possession (in acres)
Land Possession Number of Respondents Percentage of
Respondents
Up to 5 84 28.00
5 – 10 97 32.33
10 – 20 96 32.00
More than 20 23 7.67
Total 300 100
Note: Figures in parentheses indicated percentages.
Only 23 respondents, i.e. only a total of 7.67% of the total 300 respondents were
from families having total land holding of more 20 acres. This meant that a total of only
7.67% of the total women respondents belonged to large farming families. Hence, most
of the respondents belonged to marginal or small farming families.
Type of Ownership of Agricultural Land
Table 3.6(a) revealed the type of ownership of agricultural land. A total of 198,
i.e. 66.0% of the total women respondents belonged to families that cultivated only their
own agricultural land while 34.0% of them, i.e. 102 of the total of 300 belonged to
families that, apart from their own land, cultivated agricultural land taken on lease also. It
revealed the fact that majority of the respondents belonged to families that cultivated
their own agricultural land only.
Table 3.6 (a)
Whether cultivating land taken on lease
Response Number of
Respondents
Percentage of
Respondents
Cumulative
Percentage
Yes 102 34.0 34.0
No 198 66.0 100.0
Total 300 100.0

59
Table 3.6(b) revealed that out of the total farming families of women respondents,
who owned agricultural land less than five acres, 59.5% of them were also cultivating
land taken on lease whereas the rest of the 40.5% of farming families of respondent
women had not taken any land on lease.
Further, out of the total farming families of women respondents having land
possession of 5 to 10 acres, only 34.0% of them had taken land on lease also whereas the
rest of the 66.0% of these farming families of women respondents were cultivating only
the land they possessed.
As far as the families of respondents having total land possession of 10 to 20
acres were concerned, only 27.1% of these farming families were cultivating land taken
on lease apart from their own land whereas the remaining 72.9% of them cultivated their
own land only.
Table 3.6 (b)
Whether cultivating land taken on lease
Land holding
(in acres)
Yes No Total
Less than 5 acres 34
(40.5)
50
(59.5)
84
(100.0)
5-10 acres 33
(34.0)
64
(66.0)
97
(100.0)
10-20 acres 26
(27.1)
70
(72.9)
96
(100.0)
More than 20 acres 9
(39.1)
14
(60.9)
23
(100.0)
Total 102
(34.0)
198
(66.0)
300
(100.0)
Note: Figures in parentheses indicated percentages.

60
In case of those farming families of the respondents, who had a land possession of
more than 20 acres, 39.1% of these had taken land on lease also whereas the rest of the
60.9% of these farming families of the respondents were cultivating their own land only.
Land Taken on Lease
The following discussion explained the amount of land taken on lease by the
farming families of the women respondents. Table 3.7(a) revealed that 34.3% of the
families of respondents had taken land between 10-20 acres on lease followed by 28.4%,
who had taken land on lease between 5-10 acres. 21.6% and 15.7% of the families of
respondents had agricultural land less than 5 acres and above 20 acres taken on lease
respectively.
Table 3.7(a)
Total land taken on Lease
Area of land Number of
Respondents
Percentage of
Respondents
Cumulative
Percentage
Less than 5 acres 22 21.6 21.6
5-10 acres 29 28.4 40.0
10-20 acres 35 34.3 84.3
More than 20 acres 16 15.7 100.0
Total 102 100.0
Table 3.7(b) gave the details of the distribution of amount of land taken on lease
by the families of respondents with respect to their own land holding.
The table revealed that out of total of 34 families of respondents who were 33.3%
of total and had a land holding of less than 5 acres, 18 of these, i.e. 17.7% the total had
taken a total of less than five acres of land on lease. Another 14, i.e. 13.7% families of
respondents had taken land between 5-10 acres on lease. Rest of the 2, i.e. 1.9% of the
total families of respondents had taken land between 10-20 acres on lease. No family of
any respondent had taken land above 20 acres on lease.

61
Table 3.7(b)
Distribution of Respondents Having Land on Lease
with respect to their Own Land Holding
Land on lease (in
acres)→
Less
than
5 acres
5-10
Acres
10-20
acres
More than
20
Acres
Total
Land Possession (in
acres)↓
Less than 5 acres 18
(17.7)
14
(13.7)
2
(1.9)
0
(0.0)
34
(33.3)
5-10 acres 4
(3.9)
11
(10.8)
13
(12.8)
5
(4.9)
33
(32.4)
10-20 acres 0
(0.0)
3
(2.9)
15
(14.7)
8
(7.9)
26
(25.5)
More than 20 acres 0
(0.0)
1
(1.0)
5
(4.9)
3
(2.9)
9
(8.8)
Total 22
(21.6)
29
(28.4)
35
(34.3)
16
(15.7)
102
(100.0)
Note: Figures in parentheses indicated percentages.
Out of the total of 33, i.e. 32.4% of the total families of respondents, who owned
land between 5-10 acres, 4, i.e. 3.9% had taken less than 5 acres on lease. Another 11, i.e.
10.8% of the total had taken 5-10 acres on lease. Another 13, i.e. 12.8% had taken 10-20
acres on lease. Rest of the 5 (4.9% of the total) had taken more than 20 acres of land on
lease.
Families of 26 respondents having land ownership of more than 10 acres but less
than 20 acres constituted 25.5% of the total. Out of these, 15, i.e. 14.7% had taken 10-20
acres of land on lease. Another 8, i.e. 7.9% of these had taken more than 20 acres on
lease. Rest of the three of these families of the respondents, forming 2.9% of the total had
taken 5-10 acres of land on lease. None of these families had taken less than 5 acres on
lease.

62
Rest of the 9 farming families of the respondents constituted 8.8% of the total of
those who had taken any land on lease. Out of these, 4.9%, numbering 5 had taken 10-20
acres on lease. These were followed by another 3, i.e. 2.9% of the total who had taken
more than 20 acres on lease. None of these farming families of respondents had taken less
than five acres of land on lease.
The overall analysis of the table 3.7(b) revealed that 34.3% of the families of
respondents had leased land between 10-20 acres followed by 28.4% of those who had
leased land between 5-10 acres. 21.6% and 15.7% had leased lands less than 5 acres and
more than 20 acres respectively.
The above analysis also reveals that most of the marginal farming families of
respondents having less than five acres of land possession had total land on lease not
more than ten acres, though with a few exceptions which may be because of some other
source of income like some other occupation of the spouses. Similarly, nearly 85% of the
total farming families of respondents, having not more than 10 acres of land ownership,
had taken on lease not more than 20 acres of land on lease. It is interesting to note that as
much as 68.75% of the total farming families, who had taken more than 20 acres of land
on lease, were those who had a land possession of more than at least 10 acres.
This showed that the amount of land taken on lease by the farming families was
directly proportional to their own land holdings as may be seen in the above table. This
meant that as the buying power of these families increased with their land holdings, the
amount of land taken by them on lease also increased.
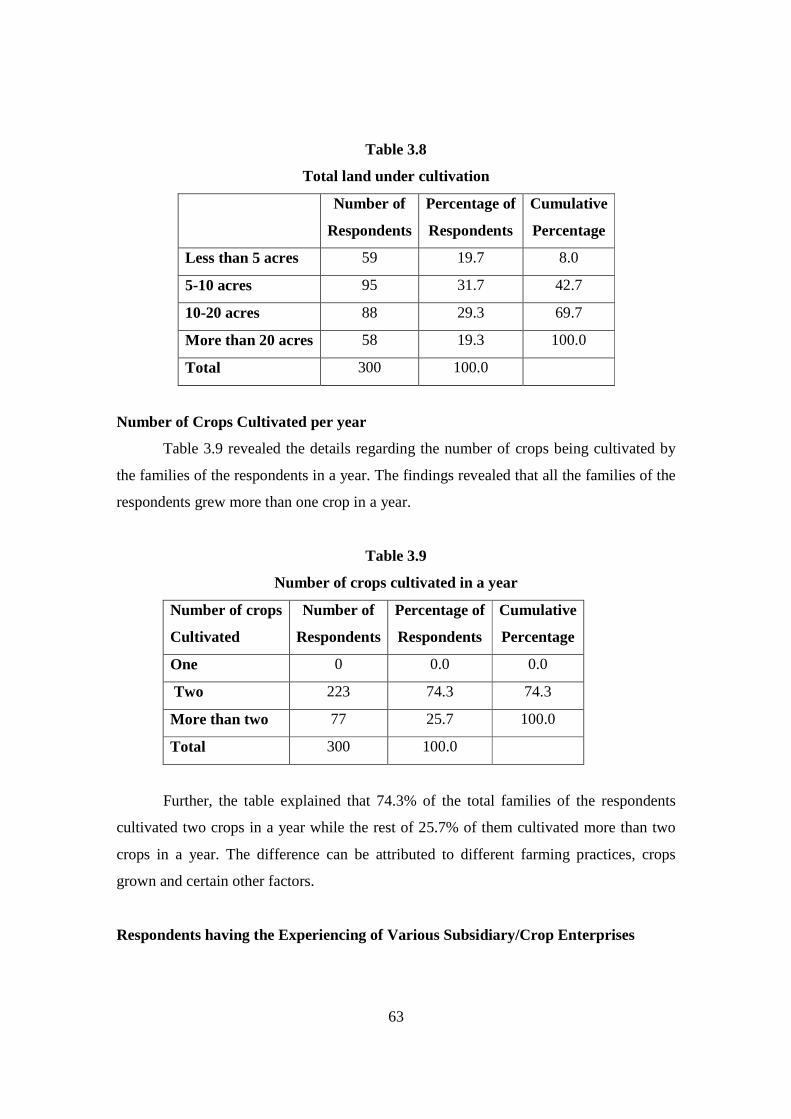
Total Land under Cultivation
Table 3.8 gave a detailed account of the total land under cultivation by the
farming families of the women respondents. 31.7% of the total of these had total
cultivated land between 5–10 acres followed by 29.3% of those who had cultivated land
of more than 10 acres but less than 20 acres. Another 19.7% had less than 5 acres of total
land under cultivation. Rest of the 19.3% had more than 20 acres of land under
cultivation. Thus majority, i.e. 61.0% of the farming families of the respondents had
cultivated agricultural land between 5-20 acres.
63
Table 3.8
Total land under cultivation
Number of
Respondents
Percentage of
Respondents
Cumulative
Percentage
Less than 5 acres 59 19.7 8.0
5-10 acres 95 31.7 42.7
10-20 acres 88 29.3 69.7
More than 20 acres 58 19.3 100.0
Total 300 100.0
Number of Crops Cultivated per year
Table 3.9 revealed the details regarding the number of crops being cultivated by
the families of the respondents in a year. The findings revealed that all the families of the
respondents grew more than one crop in a year.
Table 3.9
Number of crops cultivated in a year
Number of crops
Cultivated
Number of
Respondents
Percentage of
Respondents
Cumulative
Percentage
One 0 0.0 0.0
Two 223 74.3 74.3
More than two 77 25.7 100.0
Total 300 100.0
Further, the table explained that 74.3% of the total families of the respondents
cultivated two crops in a year while the rest of 25.7% of them cultivated more than two
crops in a year. The difference can be attributed to different farming practices, crops
grown and certain other factors.
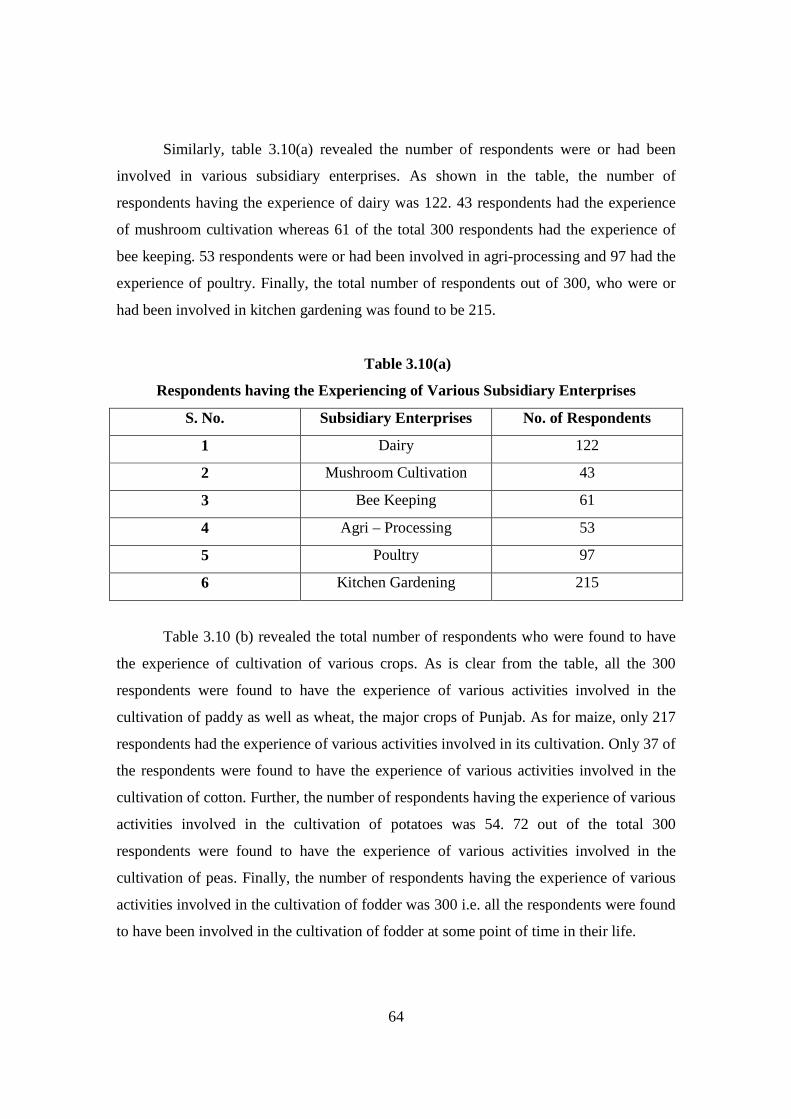
Respondents having the Experiencing of Various Subsidiary/Crop Enterprises
64
Similarly, table 3.10(a) revealed the number of respondents were or had been
involved in various subsidiary enterprises. As shown in the table, the number of
respondents having the experience of dairy was 122. 43 respondents had the experience
of mushroom cultivation whereas 61 of the total 300 respondents had the experience of
bee keeping. 53 respondents were or had been involved in agri-processing and 97 had the
experience of poultry. Finally, the total number of respondents out of 300, who were or
had been involved in kitchen gardening was found to be 215.
Table 3.10(a)
Respondents having the Experiencing of Various Subsidiary Enterprises
S. No. Subsidiary Enterprises No. of Respondents
1 Dairy 122
2 Mushroom Cultivation 43
3 Bee Keeping 61
4 Agri – Processing 53
5 Poultry 97
6 Kitchen Gardening 215
Table 3.10 (b) revealed the total number of respondents who were found to have
the experience of cultivation of various crops. As is clear from the table, all the 300
respondents were found to have the experience of various activities involved in the
cultivation of paddy as well as wheat, the major crops of Punjab. As for maize, only 217
respondents had the experience of various activities involved in its cultivation. Only 37 of
the respondents were found to have the experience of various activities involved in the
cultivation of cotton. Further, the number of respondents having the experience of various
activities involved in the cultivation of potatoes was 54. 72 out of the total 300
respondents were found to have the experience of various activities involved in the
cultivation of peas. Finally, the number of respondents having the experience of various
activities involved in the cultivation of fodder was 300 i.e. all the respondents were found
to have been involved in the cultivation of fodder at some point of time in their life.

65
Table 3.10(b)
Respondents having the Experiencing of Various Crop Enterprises
S. No. Crop Enterprises No. of Respondents
1 Paddy 300
2 Wheat 300
3 Maize 217
4 Cotton 37
5 Potato 54
6 Peas 72
7 Fodder 300
Data Collection
The required data were collected by interviewing the respondents personally with
the help of a pre-tested interview schedule. The preliminary draft was tested on thirty
respondents. After a few changes, the final questionnaire was developed which was used
for data collection.
As would be clear from the questionnaire, an attempt was made to collect as
detailed the data as possible from respondents surveyed to explain the various aspects of
the study. Also, the questionnaire was kept as simple as possible and translated into
Punjabi, so as to enable the respondents to understand it properly and respond to it as
correctly as possible, as most of the respondents were expected to be very less educated.
Analysis of Data
The tabulation of data was done to have a comprehensive picture of the analysis
commensurate with the different objectives of the study. Apart from percentage method,
the following tests have been applied for analysing the data.
Factor Analysis
The factor analysis is general and frequently used as an interdependence statistical
technique that has found increased use in marketing research (Luck, 1987, p.542).

66
The factor analysis is designated as the queen of analytical methods because of its
power and elegance (Dwivedi, 1997, p.199). It is a method of extracting common factor
variances from a set of measures. It minimises the multiplicity of measures to the utmost
simplicity. It indicates what measures go together and suggests unities the basic
characteristics underlying varied measures.
a) The correlation matrix is computed and examined to find out whether it
reveals enough correlations.
b) Anti-image correlation matrix shows the negative values of partial
correlations among variables. True factors exist if the partial correlations are
low among variables.
c) Kaiser-Meyer-Olkin Measure of Sampling Adequacy (MSA) is an index for
comparing the magnitudes of the partial correlation coefficients. The index
ranges from 0 to 1. KMO should be sufficiently high for individual variables
and also for overall MSA.
d) Bartlett’s Test of Sphericity indicates statistically significant number of
correlations among variables.
Principal Component Analysis was used to extract factors. The linear
combinations of variables were used to account for variation (spread of each dimension
in a multivariate space).
The variances of the factors are called Eigen value, characteristic root or latent
root. The most common approach for determining the number of factors to retain in the
analysis is to examine the Eigen value of the solution matrix. Although there are a
number of rules on what factors should be retained for analysis, the most commonly used
is the Eigen value greater than one. Communalities are the percentage of total variance
summarised by the common factors. The communalities can be found mathematically by
squaring the factor loadings of a variable across all factors and then summing these
figures. A low communality figure indicates that the variable is statistically independent
and cannot be combined with other variables. Factor loadings are the correlation between
the observed variables and the newly produced factors (Luck, 1987, p.546).
In addition to latent root criteria where we consider factors which have latent
roots greater than one, there are other methods like priori criteria where the researcher

67
already knows how many factors to extract and instructs the computer accordingly. The
other is percentage of variance. In social sciences, 60% of the total variance (or
sometimes less also) is considered satisfactory. Lastly, scree test takes at least one factor
more than the latent root criteria extracted.
In the present study, all the above methods were used for the analysis of data
except the priori method. The scree test was used taking latent root as the guideline. The
percent of total variance explained was taken into consideration.
Factor Rotation
Loadings are rotated to make them interpretable. Varimax rotation is the most
recognised popular orthogonal rotation procedure.
Orthogonal rotation with varimax is run. Orthogonal can be done with quartimax
also. Varimax criteria maximises the sum of the variances of the squared loadings within
each column of the loading matrix whereas quartimax simplified the rows. Variamx was
considered more relevant and tried because quartimax created a large general factor and
in oblique rotation the axis are rotated and th 90 degree angle is not maintained making it
more flexible. Oblique rotations are still controversial. Promax was also tried to find
some correlation between the factors. The final step is naming the factors and the
labelling is intuitively developed depending upon the creativity of the researcher taking
into consideration its appropriateness for representing the underlying dimensions of a
particular factor. The process of naming factors is not very scientific although some
guidelines have been recommended (Hair et al, 1995, p.388).
Software Package Used
SPSS 10.0 version was used for all statistical analysis of the study. The Microsoft
Excel was used to arrange the data and check the discrepancies or missing values.
Limitations of the Study
Though utmost care was taken to get accurate data and results yet the possibility
of some inaccuracy cannot be ruled out because of misinterpretation and
misunderstanding on the part of the respondents.

68
a) As the present study was confined to rural areas of three districts under study,
the findings may not be applicable to other parts of the country because of
economic, political, social and cultural differences resulting in variations in
attitude, perceptions and preferences.
b) As in all such studies, the results and findings of today’s research may become
less relevant tomorrow as the different factors affecting the role of women in
agriculture sector being dynamic in nature.
c) The findings of the study may vary in other agro-climatic regions due to
variations in crops being grown, socio-cultural differences, changes in
economic levels and educational standards, changed cropping patterns, and
climatic conditions.
d) Although every effort was made to get the accurate information from the
respondents, the possibility of a respondent giving biased information could
not be completely ruled out.