research on india_manufacturing and construction sector in india monthly update_july 2012
DESCRIPTION
ÂTRANSCRIPT
Manufacturing Sector in India Monthly Update
July 2012

Top Story
Karnataka to tap downscale ore Mining industry in Karnataka is focusing on the use of low grade iron ore owing to the possibility of depletion in high grade iron ore over the next 30 years. Leading companies such as JSW Steel and MSPL Ltd are conducting research on the utilization of BHQ (ore ontaining 35 ‐40% of Fe) ore for commercialization purposes. In Karnataka BHQ ore is cfound in Bellary, Chitradurga, Tumkur and Hassan regions. According to MSPL it would be profitable to beneficiate such low grade ore only when it can be exported. Silica can be separated and the BHQ ore can be beneficiated up to 63% f Fe grade. However beneficiation alone is not a viable process and a pellet plant is also orequired to make use of it. The life of mining industry in India can be extended up to 200 years once the process of extracting the metal is stabilized and its commercial use becomes viable. Though there is no official estimate available for the quantity of BHQ ore in Karnataka, expert’s state that billions of tonnes of very low grade coal can be found across the country which if correctly utilized can help in saving the high grade iron ore for the future generations. News Update
General India to undertake deep sea mining India has announced plans to establish a strategic presence in the area of deep sea mining to obtain rare earth and minerals that are required in high technology areas. China and USA are among the very few countries that have ventured into the area of deep sea ining. Elements such as Titanium and platinum that are found in the depths of the ocean m
can be utilized in ship building and space technology. Deep sea mining will be done at a depth of 6000 meters of the ocean bed in order to look for nodules of rare earth. The search for rare earth minerals will be conducted over an area of 2500 km of International waters that have been approved by the International Sea Bed Authority. Ministry of Earth Sciences has already deployed one vessel and will get one South Korean Vessel and an Indian ship for the mining purpose. State consortium to bid for Afghan mines NALCO, SAIL and Hindustan Copper have formed a consortium to bid for developing gold and copper deposits in Afghanistan. Around 25 companies from Australia, UK, Canada
Manufacturing – Monthly Update
and USA etc have been short listed to develop the gold and copper mines. Two private firms Jindal Steel & Power and Monnet Ispat & Energy were also short listed by the Afghan Government. They have been invited to join the consortium with a view to submit a single bid from India. The consortium has been examining the gold and copper deposits n Herat and Balkhab in Shaida districts of Afghanistan and at Zarkashan in Ghazn, at iBadakhshan. AFISCO, a consortium of private and public sector companies of the steel sector in India ad last year won a bid to develop the Hajigak mines in Afghanistan having 1.28 bn onnes of iron ore. ht Deepak fertilizers restrict the pace of progress in Australia Deepak Fertilizers has slowed the pace of progress in their Australia based ammonium nitrate manufacturing project. Company is also scouting for other sites in Australia in case the project witnesses further opposition. Around 19.02 bn was invested by the company in the technical ammonium nitrate (TAN) manufacturing project with a total capacity of 300,000 tonnes a year. The project encountered resistance owing to concerns ver the harmful impact on the cuttlefish population. Techno economical angles of oproduction are also being focused upon by the company. Company is one of the leading manufacturers of complex fertilizers and industrial chemicals. They have been exporting small quantity of TAN from its Indian unit to ustralia. However, high selling price of the product has appeared to be mandatory to upport the high cost of investment. As News Update
Expansion Plans JSW plans to acquire Australian coal mines Following a shortage in coal supply India based JSW Energy, a subsidiary of the JSW Group is planning to acquire coal mine assets in Australia, South Africa, Indonesia and Mozambique. Company has been exploring coal resources to ensure fuel security in order o meet their entire requirement. At present the company does not own any coal blocks in tIndia and has recently been given a share of the Utkal coal block in Odisha. A majority stake of 93.27 per cent in the South African Coal Mining Holding is owned by the company. Current generation capacity of the company is around 2,600 megawatts and another 540 megawatts is expected to be commissioned by December. New R&D facility opened by Nichrome India Ltd.
Manufacturing – Monthly Update
A new R&D facility has been set up by Pune based designer and packaging manufacturer Nichrome India Ltd. The new centre is equipped with complete engineering and design facility with hi‐tech 3D modeling software, parametric design and product data management facility. The centre includes a training centre for customer training programmes and also houses Pouch & Brand Gallery and a Product and Pouch Testing lab. The new R&D centre will be used to develop and set new standards for the Indian packaging industry. Universal Construction Machinery to open new stores Universal Construction Machinery and Equipment Ltd is expanding its retail outlets in Northern India. It has recently launched its eighth retail store in Rudrapur. A total of 35 stores will be launched by the company over the next two years across India. The new stores will be opened in the Metro cities as well as in tier‐2 and tier‐3 cities. Exclusive howrooms have already been opened by the company in Surat, Nagpur, Patna, sCoimbatore and Siligudy. Company will display concrete equipments and vertical material handling equipments in the new stores and will also provide after sales services. Newly launched stores will showcase the premium and high end equipments of the company such as batching plants nd reversible drum mixers. The “Universal Constore” outlets of the company will display roducts of all the leading brands in construction equipment apart from Universal. ap JCB opens new service dealership centre in Kanpur JCB India Ltd. has opened a new service dealership in Kanpur, Uttar Pradesh. Alliance Industrial Marketing, Kanpur has built the new dealership having a 3 bay state‐of‐the‐art facility which is fully equipped with international standard servicing infrastructure. It has 1 quick service bay integrated with all modern tools and tackles, with lathe shop and abrication facility. The new centre is spread across 7,500 sq. ft. with buildup area of f5000 sq ft. ompany is the market leader in the Backhoe Loader segment and is also trying to gain a reater share of the Tracked Excavator and the Wheeled Loading Shovel segment in India. Cg Kone Elevators to set up a new unit in India Kone Elevator India Pvt. Ltd has announced plans to set up a new production unit near Chennai. Company plans to consolidate its operations in the new facility by 2015. Around 18.5 acres of land has been acquired by the company near Sriperumbudur from SIPCOT for the new unit. The new unit will have twice the production capacity of the existing plant of the company in India. Kone Elevators is one of the leading players in the market with a more than 20% market share which translates to around 35,000‐40,000 units each year. Coal India plans to acquire explosives division of Indian Oil
Manufacturing – Monthly Update
Coal India has announced plans to acquire the explosives division of Indian Oil and expand its production capacity. Explosives constitute and essential input for the mining industry and IOC contributes 20‐25% of Coal India’s requirements. CIL spends around INR 15 bn for buying explosives and this acquisition is expected to result in considerable savings for the company. Explosives division of IOC acquired by the company also contains seven bulk plants and three satellite plants with a total capacity of 71,000 tonnes located at Singrauli, Dhanbad, Talcher, Rajmahal.. A strategic intake is also being onsidered by the company and a Memorandum of Understanding is expected to be csigned soon. Bulk explosives and Large Diameter explosives are the use two types of mining explosives used by CIL and its subsidiaries. Large Diameter explosives are ready made explosives hile bulk explosives require a detonator and its components are prepared just before he blast. wt New state of the art glass unit started in Nasik Hindusthan National Glass & Industries Limited has started the world’s largest container glass furnace at Nasik. The new container glass furnace has a capacity of 650 TPD. The new unit has been equipped with state‐of‐the‐art technology and a total of six production lines have been installed. Reputed suppliers of technology and machinery of the glass ndustry such as HORN Glass, SORG GmbH, Zippe, Emhart ,Mysac etc has been chosen to isupply machinery and technology for this furnace. Company has made substantial investments on management assets over the last two ears. The new glass furnace is set to produce products of international standards and hus expects to set a benchmark for the container glass manufacturers world wide. yt Industry Expert Speak Hindusthan National Glass starts glass unit at Nashik – Mukul Somany, Vice Chairman and Managing Director, Hindusthan National Glass and Industries Ltd “We are delighted to celebrate our success with you. Our zeal for the container glass industry is visible with the implementation of latest technological innovations in our production process at regular intervals. We are here to set the benchmark for the industry by supplying products of international standards.” Coal India plans to acquire explosives division of Indian Oil– S Narsing Rao, Chairman, CIL “The explosive division originally belonged to IBP. IBP was merged with IOC and its importance in the overall schemes of things diminished. However, explosives are an essential input for us and we intend to take over the company lock, stock and barrel,
Manufacturing – Monthly Update
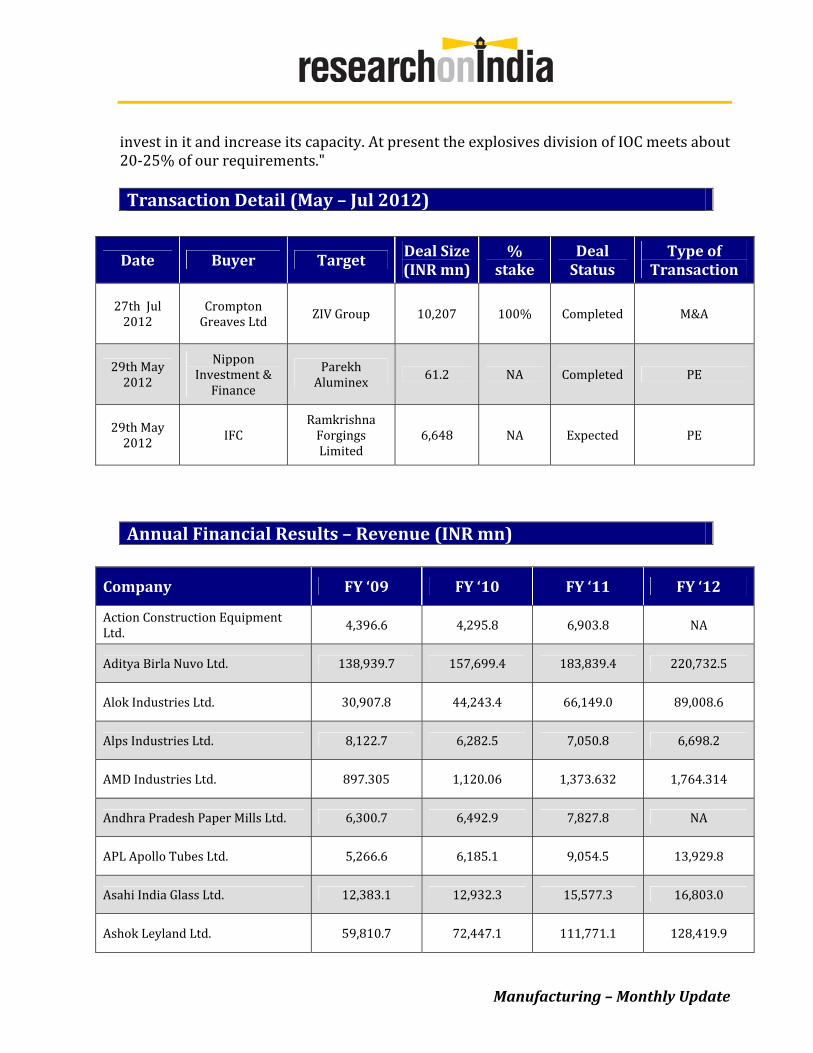
invest in it and increase its capacity. At present the explosives division of IOC meets about 20‐25% of our requirements." Transaction Detail (May – Jul 2012)
Date Buyer Target Deal Size (INR mn)
% stake
Deal Status
Type of Transaction
27th Jul 2012
Crompton Greaves Ltd ZIV Group 10,207 100% Completed M&A
29th May 2012
Nippon Investment & Finance
Parekh Aluminex 61.2 NA Completed PE
29th May 2012 IFC
Ramkrishna Forgings Limited
6,648 NA Expected PE
Annual Financial Results – Revenue (INR mn)
Company FY ‘09 FY ‘10 FY ‘11 FY ‘12
Action Construction Equipment Ltd. 4,396.6 4,295.8 6,903.8 NA
Aditya Birla Nuvo Ltd. 138,939.7 157,699.4 183,839.4 220,732.5
Alok Industries Ltd. 30,907.8 44,243.4 66,149.0 89,008.6
Alps Industries Ltd. 8,122.7 6,282.5 7,050.8 6,698.2
AMD Industries Ltd. 897.305 1,120.06 1,373.632 1,764.314
Andhra Pradesh Paper Mills Ltd. 6,300.7 6,492.9 7,827.8 NA
APL Apollo Tubes Ltd. 5,266.6 6,185.1 9,054.5 13,929.8
Asahi India Glass Ltd. 12,383.1 12,932.3 15,577.3 16,803.0
Ashok Leyland Ltd. 59,810.7 72,447.1 111,771.1 128,419.9
Manufacturing – Monthly Update
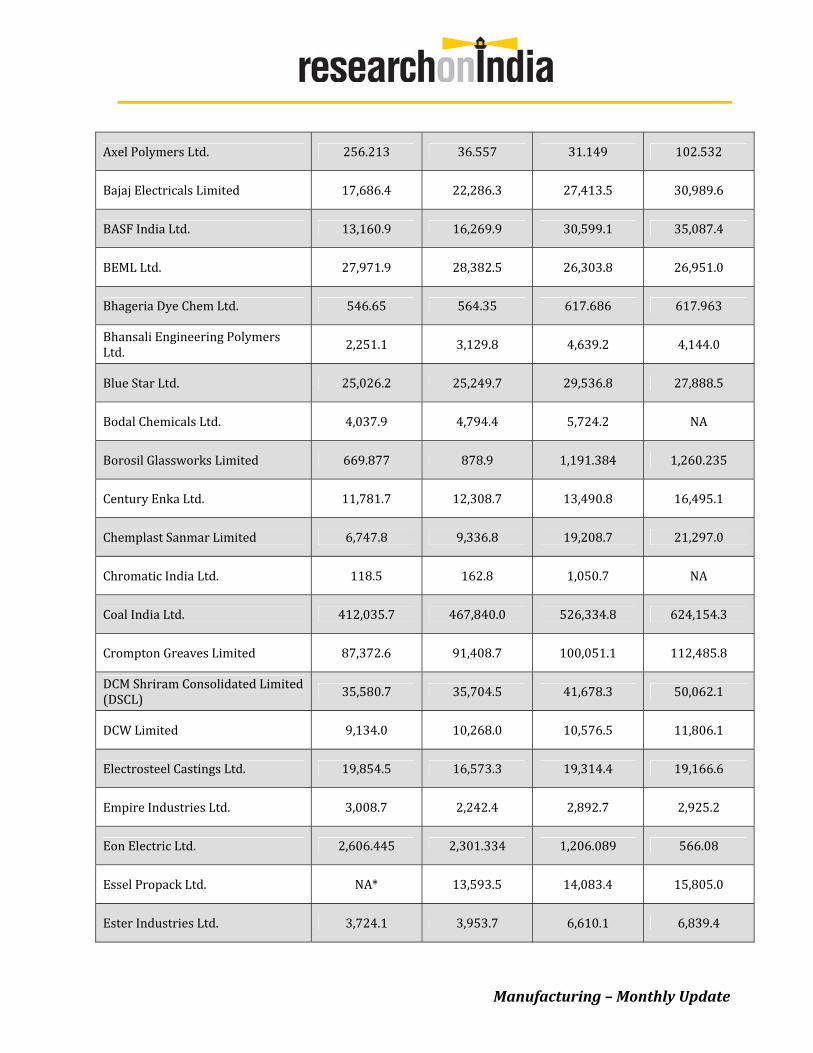
Axel Polymers Ltd. 256.213 36.557 31.149 102.532
Bajaj Electricals Limited 17,686.4 22,286.3 27,413.5 30,989.6
BASF India Ltd. 13,160.9 16,269.9 30,599.1 35,087.4
BEML Ltd. 27,971.9 28,382.5 26,303.8 26,951.0
Bhageria Dye Chem Ltd. 546.65 564.35 617.686 617.963
Bhansali Engineering Polymers Ltd. 2,251.1 3,129.8 4,639.2 4,144.0
Blue Star Ltd. 25,026.2 25,249.7 29,536.8 27,888.5
Bodal Chemicals Ltd. 4,037.9 4,794.4 5,724.2 NA
Borosil Glassworks Limited 669.877 878.9 1,191.384 1,260.235
Century Enka Ltd. 11,781.7 12,308.7 13,490.8 16,495.1
Chemplast Sanmar Limited 6,747.8 9,336.8 19,208.7 21,297.0
Chromatic India Ltd. 118.5 162.8 1,050.7 NA
Coal India Ltd. 412,035.7 467,840.0 526,334.8 624,154.3
Crompton Greaves Limited 87,372.6 91,408.7 100,051.1 112,485.8
DCM Shriram Consolidated Limited (DSCL) 35,580.7 35,704.5 41,678.3 50,062.1
DCW Limited 9,134.0 10,268.0 10,576.5 11,806.1
Electrosteel Castings Ltd. 19,854.5 16,573.3 19,314.4 19,166.6
Empire Industries Ltd. 3,008.7 2,242.4 2,892.7 2,925.2
Eon Electric Ltd. 2,606.445 2,301.334 1,206.089 566.08
Essel Propack Ltd. NA* 13,593.5 14,083.4 15,805.0
Ester Industries Ltd. 3,724.1 3,953.7 6,610.1 6,839.4
Manufacturing – Monthly Update

Fenoplast Limited 1,100.967 1,440.973 1,762.778 1,963.235
FIEM Industries Limited 2,198.9 2,965.3 4,276.0 NA
Filatex India Ltd. 3,590.7 3,997.6 4,864.2 4,725.0
Finolex Cables Limited (FCL) 13,415.1 16,187.2 20,357.5 20,384.7
Finolex Industries Limited 15,291.3 14,743.8 19,777.3 20,997.8
Gail India Ltd. 247,818.0 270,353.0 351,066.5 440,578.2
Garden Silks Mills Ltd. 17,795.3 25,187.0 34,049.3 35,082.0
Grasim Industries Ltd. 184,316.9 200,870.8 214,612.3 251,470.9
Gujarat Borosil Ltd. 931.672 827.64 926.646 790.95
Haldyn Glass Gujarat Ltd. 1,038.488 1,313.248 1,557.016 NA
Hanung Toys and Textiles Ltd. 6,520.6 8,519.3 11,390.6 NA
Havells India Ltd. 54,774.9 51,625.7 56,126.3 65,182.0
Hindalco Industries Ltd. 659,629.5 607,079.2 720,778.7 808,213.7
Hinduja Foundries Ltd. 3,631.3 3,928.6 5,526.6 7,397.8
Hindustan Adhesives Ltd. 487.409 528.095 629.819 668.9
Hindustan Copper Ltd. 11,960.7 13,210.7 11,848.7 14,842.9
Hindustan Tin Works Ltd. 2,478.2 2,881.5 2,966.2 2,466.5
Hindusthan National Glass & Industries Ltd.
13,305.6 13,962.3 15,625.2 20,263.2
HMT Limited 3,678.3 4,087.3 4,291.2 NA
HSIL Ltd. 6,167.6 8,083.1 10,820.8 14,455.7
IAG Company Ltd. 126.85 794.129 NA NA
Manufacturing – Monthly Update
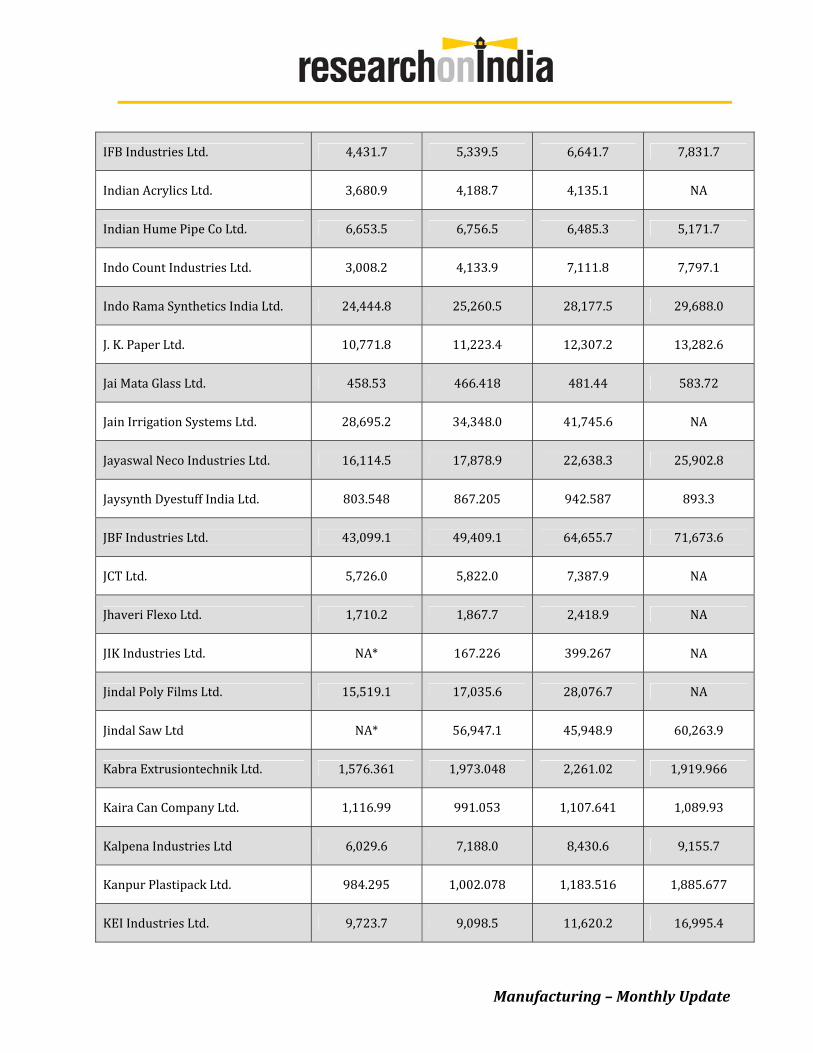
IFB Industries Ltd. 4,431.7 5,339.5 6,641.7 7,831.7
Indian Acrylics Ltd. 3,680.9 4,188.7 4,135.1 NA
Indian Hume Pipe Co Ltd. 6,653.5 6,756.5 6,485.3 5,171.7
Indo Count Industries Ltd. 3,008.2 4,133.9 7,111.8 7,797.1
Indo Rama Synthetics India Ltd. 24,444.8 25,260.5 28,177.5 29,688.0
J. K. Paper Ltd. 10,771.8 11,223.4 12,307.2 13,282.6
Jai Mata Glass Ltd. 458.53 466.418 481.44 583.72
Jain Irrigation Systems Ltd. 28,695.2 34,348.0 41,745.6 NA
Jayaswal Neco Industries Ltd. 16,114.5 17,878.9 22,638.3 25,902.8
Jaysynth Dyestuff India Ltd. 803.548 867.205 942.587 893.3
JBF Industries Ltd. 43,099.1 49,409.1 64,655.7 71,673.6
JCT Ltd. 5,726.0 5,822.0 7,387.9 NA
Jhaveri Flexo Ltd. 1,710.2 1,867.7 2,418.9 NA
JIK Industries Ltd. NA* 167.226 399.267 NA
Jindal Poly Films Ltd. 15,519.1 17,035.6 28,076.7 NA
Jindal Saw Ltd NA* 56,947.1 45,948.9 60,263.9
Kabra Extrusiontechnik Ltd. 1,576.361 1,973.048 2,261.02 1,919.966
Kaira Can Company Ltd. 1,116.99 991.053 1,107.641 1,089.93
Kalpena Industries Ltd 6,029.6 7,188.0 8,430.6 9,155.7
Kanpur Plastipack Ltd. 984.295 1,002.078 1,183.516 1,885.677
KEI Industries Ltd. 9,723.7 9,098.5 11,620.2 16,995.4
Manufacturing – Monthly Update
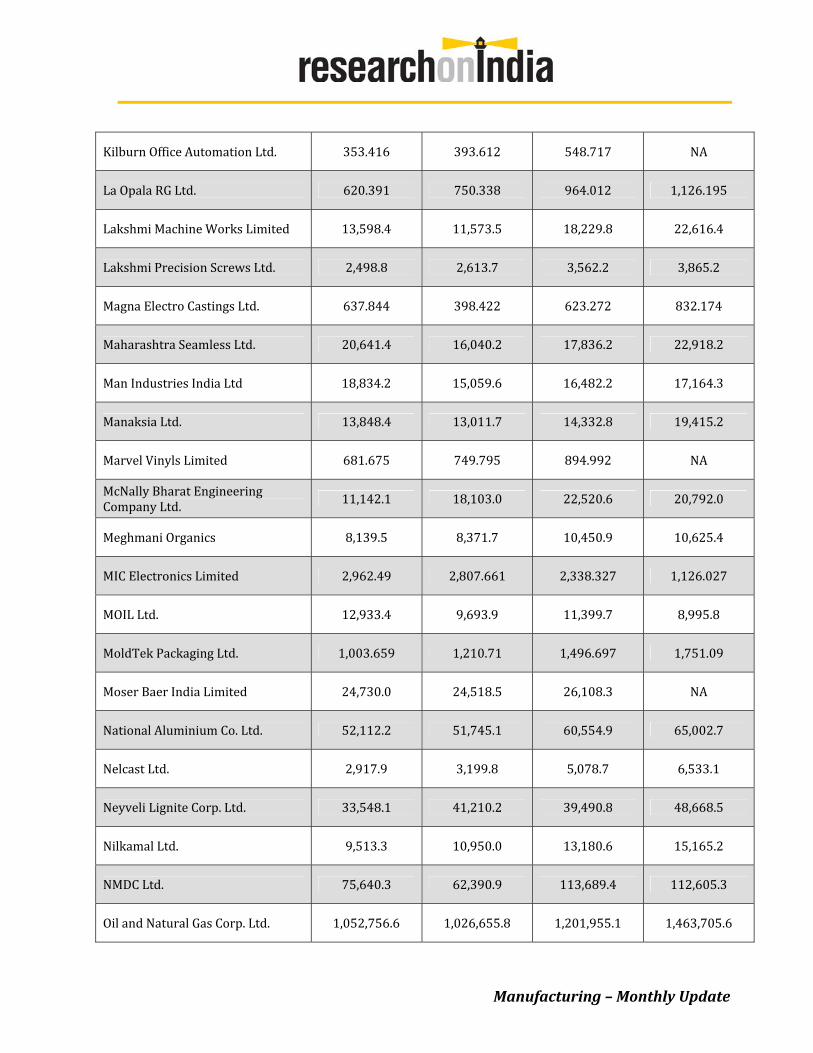
Kilburn Office Automation Ltd. 353.416 393.612 548.717 NA
La Opala RG Ltd. 620.391 750.338 964.012 1,126.195
Lakshmi Machine Works Limited 13,598.4 11,573.5 18,229.8 22,616.4
Lakshmi Precision Screws Ltd. 2,498.8 2,613.7 3,562.2 3,865.2
Magna Electro Castings Ltd. 637.844 398.422 623.272 832.174
Maharashtra Seamless Ltd. 20,641.4 16,040.2 17,836.2 22,918.2
Man Industries India Ltd 18,834.2 15,059.6 16,482.2 17,164.3
Manaksia Ltd. 13,848.4 13,011.7 14,332.8 19,415.2
Marvel Vinyls Limited 681.675 749.795 894.992 NA
McNally Bharat Engineering Company Ltd. 11,142.1 18,103.0 22,520.6 20,792.0
Meghmani Organics 8,139.5 8,371.7 10,450.9 10,625.4
MIC Electronics Limited 2,962.49 2,807.661 2,338.327 1,126.027
MOIL Ltd. 12,933.4 9,693.9 11,399.7 8,995.8
MoldTek Packaging Ltd. 1,003.659 1,210.71 1,496.697 1,751.09
Moser Baer India Limited 24,730.0 24,518.5 26,108.3 NA
National Aluminium Co. Ltd. 52,112.2 51,745.1 60,554.9 65,002.7
Nelcast Ltd. 2,917.9 3,199.8 5,078.7 6,533.1
Neyveli Lignite Corp. Ltd. 33,548.1 41,210.2 39,490.8 48,668.5
Nilkamal Ltd. 9,513.3 10,950.0 13,180.6 15,165.2
NMDC Ltd. 75,640.3 62,390.9 113,689.4 112,605.3
Oil and Natural Gas Corp. Ltd. 1,052,756.6 1,026,655.8 1,201,955.1 1,463,705.6
Manufacturing – Monthly Update
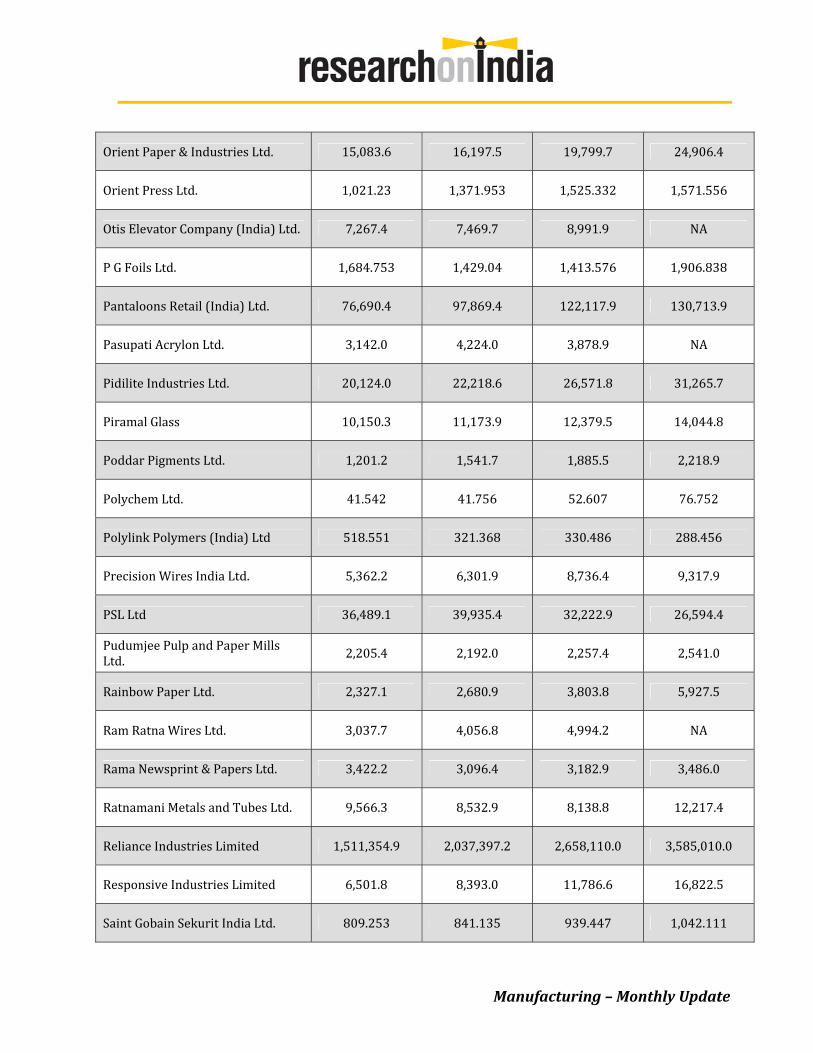
Orient Paper & Industries Ltd. 15,083.6 16,197.5 19,799.7 24,906.4
Orient Press Ltd. 1,021.23 1,371.953 1,525.332 1,571.556
Otis Elevator Company (India) Ltd. 7,267.4 7,469.7 8,991.9 NA
P G Foils Ltd. 1,684.753 1,429.04 1,413.576 1,906.838
Pantaloons Retail (India) Ltd. 76,690.4 97,869.4 122,117.9 130,713.9
Pasupati Acrylon Ltd. 3,142.0 4,224.0 3,878.9 NA
Pidilite Industries Ltd. 20,124.0 22,218.6 26,571.8 31,265.7
Piramal Glass 10,150.3 11,173.9 12,379.5 14,044.8
Poddar Pigments Ltd. 1,201.2 1,541.7 1,885.5 2,218.9
Polychem Ltd. 41.542 41.756 52.607 76.752
Polylink Polymers (India) Ltd 518.551 321.368 330.486 288.456
Precision Wires India Ltd. 5,362.2 6,301.9 8,736.4 9,317.9
PSL Ltd 36,489.1 39,935.4 32,222.9 26,594.4
Pudumjee Pulp and Paper Mills Ltd.
2,205.4 2,192.0 2,257.4 2,541.0
Rainbow Paper Ltd. 2,327.1 2,680.9 3,803.8 5,927.5
Ram Ratna Wires Ltd. 3,037.7 4,056.8 4,994.2 NA
Rama Newsprint & Papers Ltd. 3,422.2 3,096.4 3,182.9 3,486.0
Ratnamani Metals and Tubes Ltd. 9,566.3 8,532.9 8,138.8 12,217.4
Reliance Industries Limited 1,511,354.9 2,037,397.2 2,658,110.0 3,585,010.0
Responsive Industries Limited 6,501.8 8,393.0 11,786.6 16,822.5
Saint Gobain Sekurit India Ltd. 809.253 841.135 939.447 1,042.111
Manufacturing – Monthly Update

Sanco Industries Limited 398.95 362.989 368.059 NA
Seshasayee Paper and Boards Ltd. 5,291.1 5,092.6 5,734.8 6,114.2
Sezal Glass Ltd. 8.737 8.095 50.505 16.886
Shoppers Stop Ltd 13,737.8 15,169.1 21,757.3 27,876.9
Shri Lakshmi Cotsyn Ltd. 11,652.8 15,354.8 17,983.8 NA
Simplex Castings Ltd. 1,737.663 1,644.1 2,034.733 2,176.228
Sirpur Paper Mills Ltd. 3,462.1 3,391.5 3,670.8 3,892.8
Siyaram Silk Mills Ltd. 5,330.9 6,597.2 8,542.8 9,094.8
Star Paper Mills Ltd. 2,399.7 2,512.7 2,595.9 2,282.7
Sterling Tools Ltd. 1,511.4 1,797.6 2,481.3 2,924.6
Sterlite Industries (India) Ltd. 212,636.6 244,903.0 302,472.0 412,063.0
Sterlite Technologies 22,892.3 24,316.3 22,621.2 25,669.5
Sudarshan Chemicals 4,606.8 5,944.0 7,241.5 8,002.9
Sundaram Fasteners Ltd. 18,101.2 17,187.4 22,976.9 27,031.5
Supreme Industries Ltd 8,654.3 9,972.0 15,962.4 15,520.8
Surya Roshni Limited 14,890.8 17,954.9 23,105.4 30,257.2
Sutlej Textiles and Industries Ltd. 8,510.3 11,469.1 15,816.5 15,125.0
Swiss Glasscoats Equipment Limited
423.842 454.913 529.536 704.022
Tamil Nadu Newsprint and Papers Ltd. 10,737.2 10,517.8 12,067.2 14,866.0
Tata Metaliks Ltd. 10,015.5 10,481.7 13,187.3 11,950.6
Tayo Rolls Ltd. 1,681.886 1,321.808 1,334.123 1,396.232
Manufacturing – Monthly Update

Texmo Pipes and Products Limited 591.637 761.943 1,228.116 1,540.716
The Bombay Dyeing and turing Company Ltd. Manufac
13,172.8 16,427.8 18,592.4 22,308.1
TIL Ltd. 10,373.6 10,545.6 13,761.0 13,788.6
Torrent Cables Ltd. 1,776.9 1,707.7 2,511.4 3,202.8
Triveni Glass 350.202 330.359 362.444 462.6
Uflex Ltd. 20,959.1 23,624.5 35,123.1 44,112.7
Vardhman Acrylics Ltd. 2,405.7 2,704.8 3,988.0 3,901.4
Vipul Dyechem Ltd. 236.068 265.418 330.994 NA
Voltas Ltd. 43,259.0 47,574.7 51,913.8 51,857.4
Welspun Corp Ltd. 57,395.3 73,636.7 80,236.4 89,765.8
Wendt India Ltd 561.021 617.8 916.87 1,110.614
West Coat Paper Mills 6,235.7 6,288.6 10,709.2 13,051.8
Yash Papers Ltd. 840.486 817.702 1,010.217 1,054.276
Zenith Fibres Ltd. 352.248 339.754 393.789 504.282
Trident Limited 13,980.6 18,033.6 25,374.6 27,322.8
Annual Financial Results – Income (INR mn)
Company FY ‘09 FY ‘10 FY ‘11 FY ‘12
Action Construction Equipment Ltd. 198.9 235.6 411.3 NA
Aditya Birla Nuvo Ltd. (4,357.3) 1,545.6 8,221.0 8,901.3
Manufacturing – Monthly Update
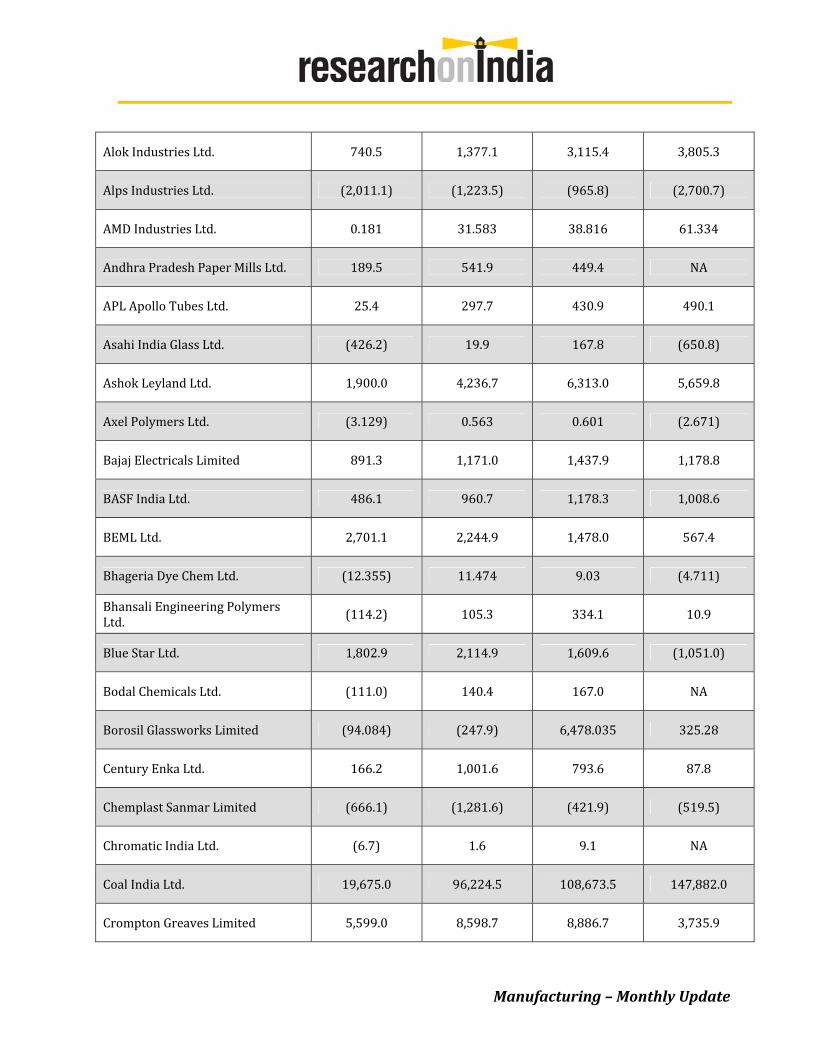
Alok Industries Ltd. 740.5 1,377.1 3,115.4 3,805.3
Alps Industries Ltd. (2,011.1) (1,223.5) (965.8) (2,700.7)
AMD Industries Ltd. 0.181 31.583 38.816 61.334
Andhra Pradesh Paper Mills Ltd. 189.5 541.9 449.4 NA
APL Apollo Tubes Ltd. 25.4 297.7 430.9 490.1
Asahi India Glass Ltd. (426.2) 19.9 167.8 (650.8)
Ashok Leyland Ltd. 1,900.0 4,236.7 6,313.0 5,659.8
Axel Polymers Ltd. (3.129) 0.563 0.601 (2.671)
Bajaj Electricals Limited 891.3 1,171.0 1,437.9 1,178.8
BASF India Ltd. 486.1 960.7 1,178.3 1,008.6
BEML Ltd. 2,701.1 2,244.9 1,478.0 567.4
Bhageria Dye Chem Ltd. (12.355) 11.474 9.03 (4.711)
Bhansali Engineering Polymers Ltd.
(114.2) 105.3 334.1 10.9
Blue Star Ltd. 1,802.9 2,114.9 1,609.6 (1,051.0)
Bodal Chemicals Ltd. (111.0) 140.4 167.0 NA
Borosil Glassworks Limited (94.084) (247.9) 6,478.035 325.28
Century Enka Ltd. 166.2 1,001.6 793.6 87.8
Chemplast Sanmar Limited (666.1) (1,281.6) (421.9) (519.5)
Chromatic India Ltd. (6.7) 1.6 9.1 NA
Coal India Ltd. 19,675.0 96,224.5 108,673.5 147,882.0
Crompton Greaves Limited 5,599.0 8,598.7 8,886.7 3,735.9
Manufacturing – Monthly Update
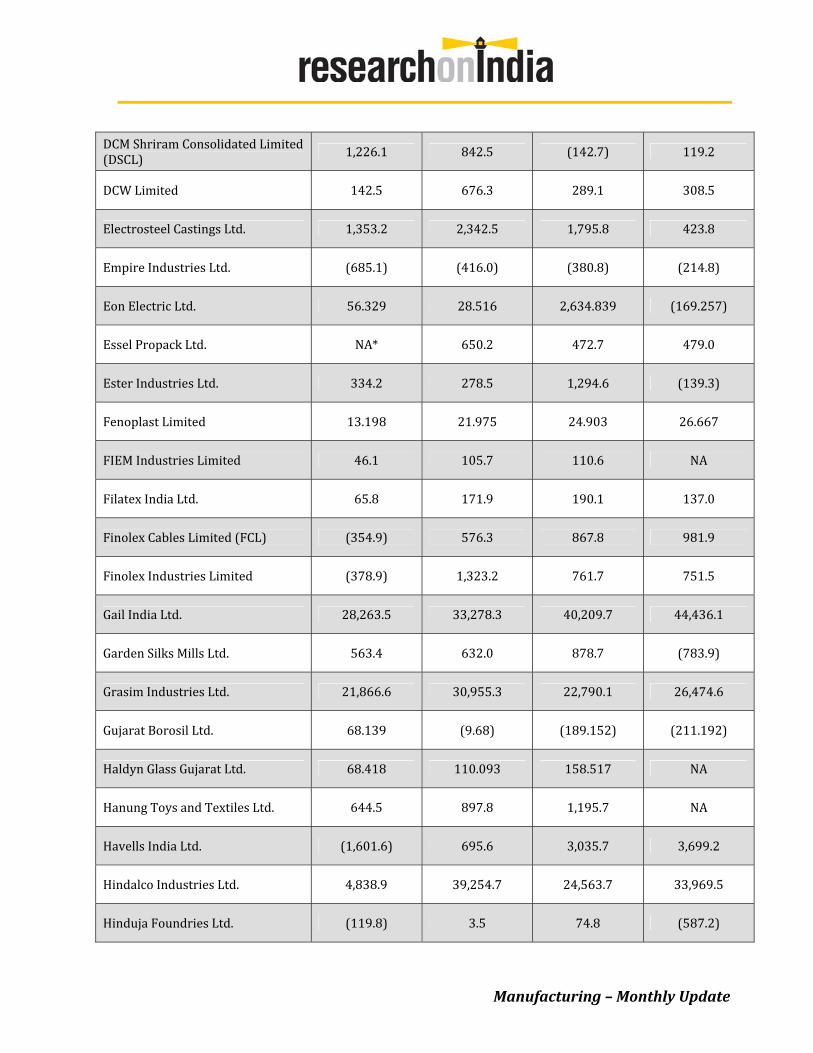
DCM Shriram Consolidated Limited (DSCL) 1,226.1 842.5 (142.7) 119.2
DCW Limited 142.5 676.3 289.1 308.5
Electrosteel Castings Ltd. 1,353.2 2,342.5 1,795.8 423.8
Empire Industries Ltd. (685.1) (416.0) (380.8) (214.8)
Eon Electric Ltd. 56.329 28.516 2,634.839 (169.257)
Essel Propack Ltd. NA* 650.2 472.7 479.0
Ester Industries Ltd. 334.2 278.5 1,294.6 (139.3)
Fenoplast Limited 13.198 21.975 24.903 26.667
FIEM Industries Limited 46.1 105.7 110.6 NA
Filatex India Ltd. 65.8 171.9 190.1 137.0
Finolex Cables Limited (FCL) (354.9) 576.3 867.8 981.9
Finolex Industries Limited (378.9) 1,323.2 761.7 751.5
Gail India Ltd. 28,263.5 33,278.3 40,209.7 44,436.1
Garden Silks Mills Ltd. 563.4 632.0 878.7 (783.9)
Grasim Industries Ltd. 21,866.6 30,955.3 22,790.1 26,474.6
Gujarat Borosil Ltd. 68.139 (9.68) (189.152) (211.192)
Haldyn Glass Gujarat Ltd. 68.418 110.093 158.517 NA
Hanung Toys and Textiles Ltd. 644.5 897.8 1,195.7 NA
Havells India Ltd. (1,601.6) 695.6 3,035.7 3,699.2
Hindalco Industries Ltd. 4,838.9 39,254.7 24,563.7 33,969.5
Hinduja Foundries Ltd. (119.8) 3.5 74.8 (587.2)
Manufacturing – Monthly Update
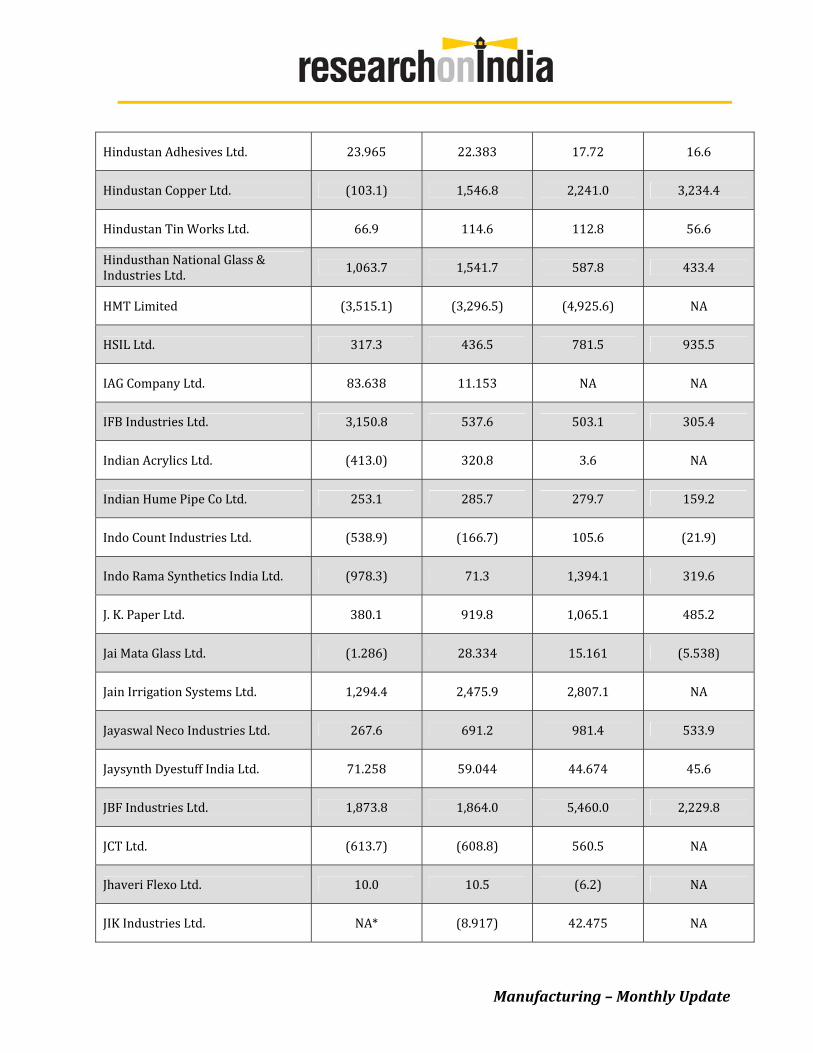
Hindustan Adhesives Ltd. 23.965 22.383 17.72 16.6
Hindustan Copper Ltd. (103.1) 1,546.8 2,241.0 3,234.4
Hindustan Tin Works Ltd. 66.9 114.6 112.8 56.6
Hindusthan National Glass & Industries Ltd. 1,063.7 1,541.7 587.8 433.4
HMT Limited (3,515.1) (3,296.5) (4,925.6) NA
HSIL Ltd. 317.3 436.5 781.5 935.5
IAG Company Ltd. 83.638 11.153 NA NA
IFB Industries Ltd. 3,150.8 537.6 503.1 305.4
Indian Acrylics Ltd. (413.0) 320.8 3.6 NA
Indian Hume Pipe Co Ltd. 253.1 285.7 279.7 159.2
Indo Count Industries Ltd. (538.9) (166.7) 105.6 (21.9)
Indo Rama Synthetics India Ltd. (978.3) 71.3 1,394.1 319.6
J. K. Paper Ltd. 380.1 919.8 1,065.1 485.2
Jai Mata Glass Ltd. (1.286) 28.334 15.161 (5.538)
Jain Irrigation Systems Ltd. 1,294.4 2,475.9 2,807.1 NA
Jayaswal Neco Industries Ltd. 267.6 691.2 981.4 533.9
Jaysynth Dyestuff India Ltd. 71.258 59.044 44.674 45.6
JBF Industries Ltd. 1,873.8 1,864.0 5,460.0 2,229.8
JCT Ltd. (613.7) (608.8) 560.5 NA
Jhaveri Flexo Ltd. 10.0 10.5 (6.2) NA
JIK Industries Ltd. NA* (8.917) 42.475 NA
Manufacturing – Monthly Update
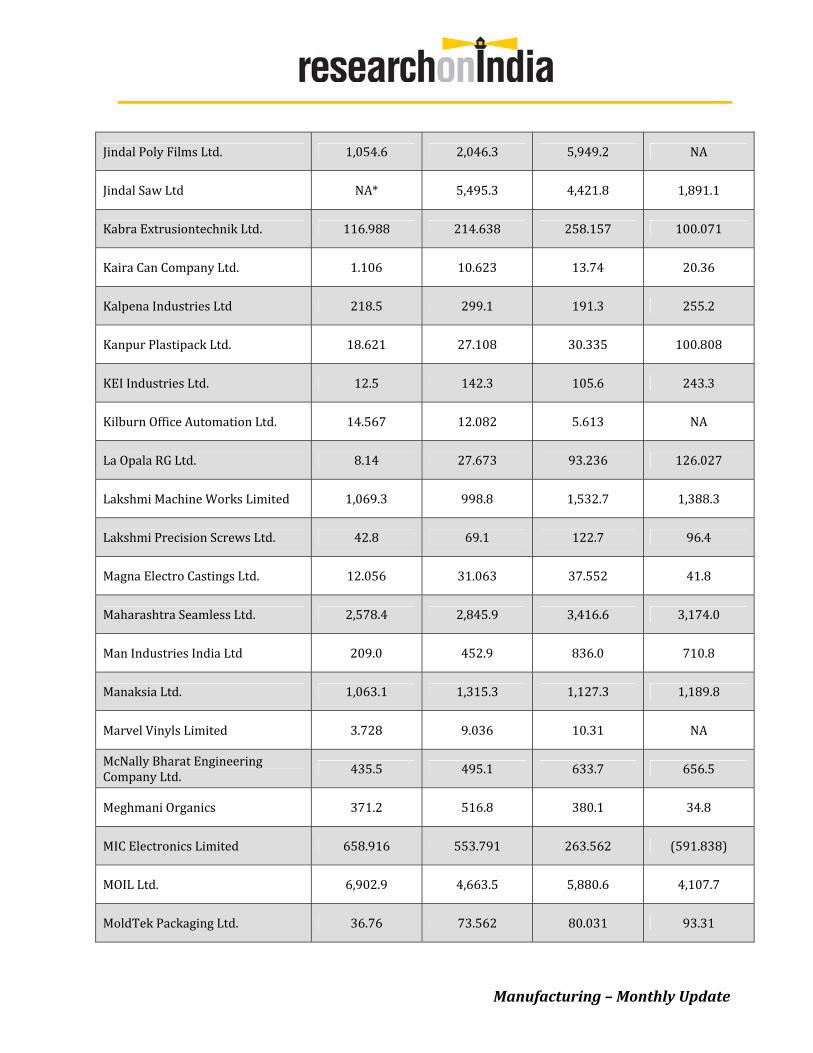
Jindal Poly Films Ltd. 1,054.6 2,046.3 5,949.2 NA
Jindal Saw Ltd NA* 5,495.3 4,421.8 1,891.1
Kabra Extrusiontechnik Ltd. 116.988 214.638 258.157 100.071
Kaira Can Company Ltd. 1.106 10.623 13.74 20.36
Kalpena Industries Ltd 218.5 299.1 191.3 255.2
Kanpur Plastipack Ltd. 18.621 27.108 30.335 100.808
KEI Industries Ltd. 12.5 142.3 105.6 243.3
Kilburn Office Automation Ltd. 14.567 12.082 5.613 NA
La Opala RG Ltd. 8.14 27.673 93.236 126.027
Lakshmi Machine Works Limited 1,069.3 998.8 1,532.7 1,388.3
Lakshmi Precision Screws Ltd. 42.8 69.1 122.7 96.4
Magna Electro Castings Ltd. 12.056 31.063 37.552 41.8
Maharashtra Seamless Ltd. 2,578.4 2,845.9 3,416.6 3,174.0
Man Industries India Ltd 209.0 452.9 836.0 710.8
Manaksia Ltd. 1,063.1 1,315.3 1,127.3 1,189.8
Marvel Vinyls Limited 3.728 9.036 10.31 NA
McNally Bharat Engineering Company Ltd.
435.5 495.1 633.7 656.5
Meghmani Organics 371.2 516.8 380.1 34.8
MIC Electronics Limited 658.916 553.791 263.562 (591.838)
MOIL Ltd. 6,902.9 4,663.5 5,880.6 4,107.7
MoldTek Packaging Ltd. 36.76 73.562 80.031 93.31
Manufacturing – Monthly Update
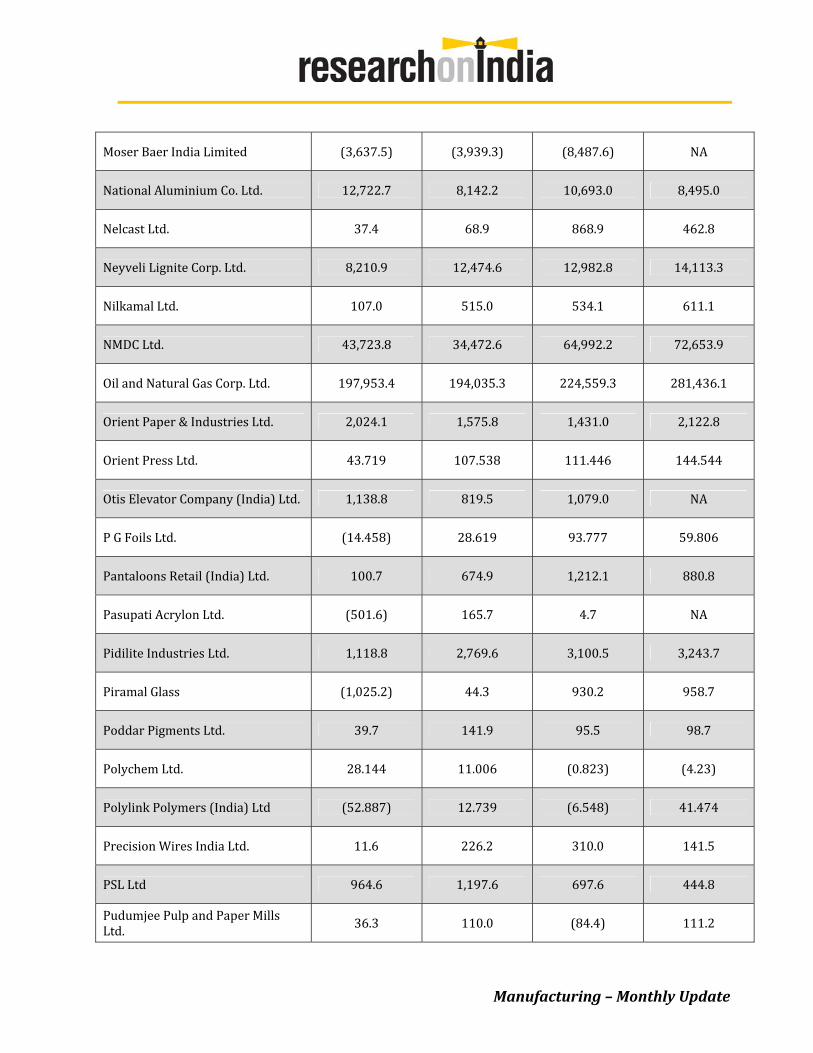
Moser Baer India Limited (3,637.5) (3,939.3) (8,487.6) NA
National Aluminium Co. Ltd. 12,722.7 8,142.2 10,693.0 8,495.0
Nelcast Ltd. 37.4 68.9 868.9 462.8
Neyveli Lignite Corp. Ltd. 8,210.9 12,474.6 12,982.8 14,113.3
Nilkamal Ltd. 107.0 515.0 534.1 611.1
NMDC Ltd. 43,723.8 34,472.6 64,992.2 72,653.9
Oil and Natural Gas Corp. Ltd. 197,953.4 194,035.3 224,559.3 281,436.1
Orient Paper & Industries Ltd. 2,024.1 1,575.8 1,431.0 2,122.8
Orient Press Ltd. 43.719 107.538 111.446 144.544
Otis Elevator Company (India) Ltd. 1,138.8 819.5 1,079.0 NA
P G Foils Ltd. (14.458) 28.619 93.777 59.806
Pantaloons Retail (India) Ltd. 100.7 674.9 1,212.1 880.8
Pasupati Acrylon Ltd. (501.6) 165.7 4.7 NA
Pidilite Industries Ltd. 1,118.8 2,769.6 3,100.5 3,243.7
Piramal Glass (1,025.2) 44.3 930.2 958.7
Poddar Pigments Ltd. 39.7 141.9 95.5 98.7
Polychem Ltd. 28.144 11.006 (0.823) (4.23)
Polylink Polymers (India) Ltd (52.887) 12.739 (6.548) 41.474
Precision Wires India Ltd. 11.6 226.2 310.0 141.5
PSL Ltd 964.6 1,197.6 697.6 444.8
Pudumjee Pulp and Paper Mills Ltd.
36.3 110.0 (84.4) 111.2
Manufacturing – Monthly Update
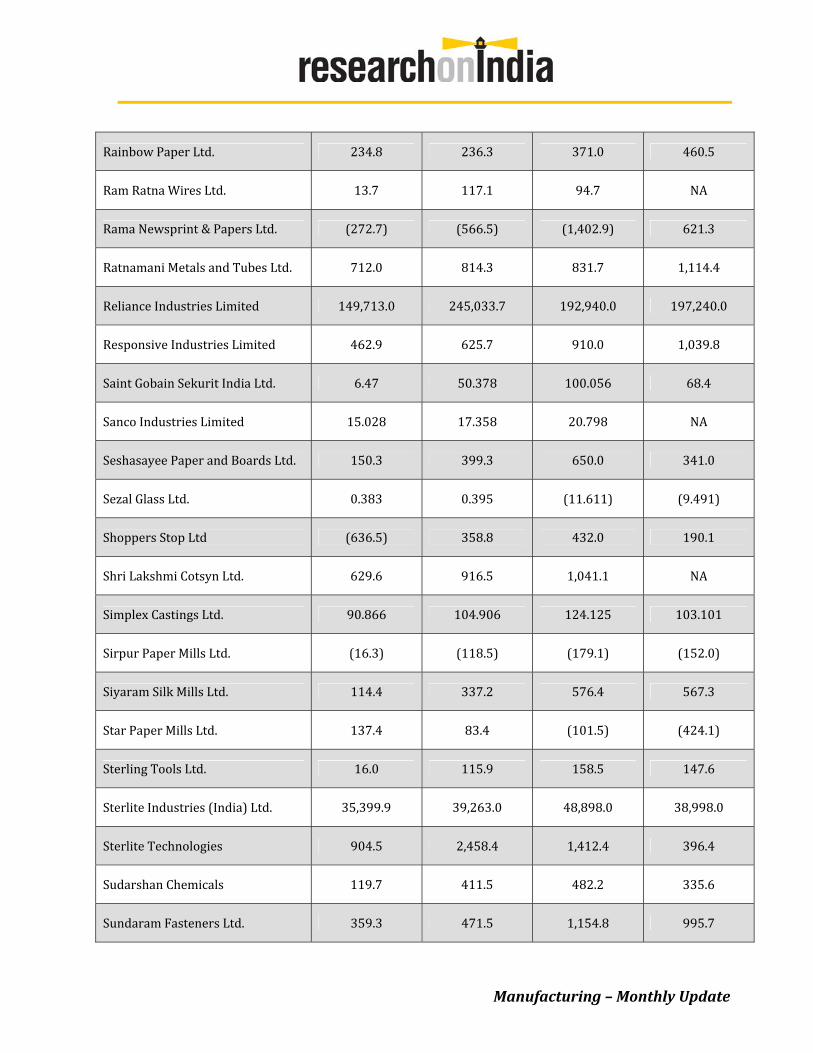
Rainbow Paper Ltd. 234.8 236.3 371.0 460.5
Ram Ratna Wires Ltd. 13.7 117.1 94.7 NA
Rama Newsprint & Papers Ltd. (272.7) (566.5) (1,402.9) 621.3
Ratnamani Metals and Tubes Ltd. 712.0 814.3 831.7 1,114.4
Reliance Industries Limited 149,713.0 245,033.7 192,940.0 197,240.0
Responsive Industries Limited 462.9 625.7 910.0 1,039.8
Saint Gobain Sekurit India Ltd. 6.47 50.378 100.056 68.4
Sanco Industries Limited 15.028 17.358 20.798 NA
Seshasayee Paper and Boards Ltd. 150.3 399.3 650.0 341.0
Sezal Glass Ltd. 0.383 0.395 (11.611) (9.491)
Shoppers Stop Ltd (636.5) 358.8 432.0 190.1
Shri Lakshmi Cotsyn Ltd. 629.6 916.5 1,041.1 NA
Simplex Castings Ltd. 90.866 104.906 124.125 103.101
Sirpur Paper Mills Ltd. (16.3) (118.5) (179.1) (152.0)
Siyaram Silk Mills Ltd. 114.4 337.2 576.4 567.3
Star Paper Mills Ltd. 137.4 83.4 (101.5) (424.1)
Sterling Tools Ltd. 16.0 115.9 158.5 147.6
Sterlite Industries (India) Ltd. 35,399.9 39,263.0 48,898.0 38,998.0
Sterlite Technologies 904.5 2,458.4 1,412.4 396.4
Sudarshan Chemicals 119.7 411.5 482.2 335.6
Sundaram Fasteners Ltd. 359.3 471.5 1,154.8 995.7
Manufacturing – Monthly Update

Supreme Industries Ltd (406.6) (520.5) 36.5 234.6
Surya Roshni Limited 215.4 451.7 674.7 523.1
Sutlej Textiles and Industries Ltd. (301.5) 263.1 1,143.4 317.3
Swiss Glasscoats Equipment Limited 17.594 24.013 27.07 31.259
Tamil Nadu Newsprint and Papers Ltd.
1,073.9 1,260.6 1,490.0 1,089.4
Tata Metaliks Ltd. (1,497.0) 285.7 5.7 (1,134.7)
Tayo Rolls Ltd. (167.362) (115.33) (304.431) (531.239)
Texmo Pipes and Products Limited 58.542 40.021 67.943 44.7
The Bombay Dyeing and turing Company Ltd. Manufac
(1,946.2) 184.2 213.9 593.5
TIL Ltd. 447.2 595.3 601.9 153.4
Torrent Cables Ltd. 134.3 105.0 68.7 192.9
Triveni Glass (209.808) 66.061 (165.096) 53.0
Uflex Ltd. 1,864.9 1,901.8 6,979.8 2,550.2
Vardhman Acrylics Ltd. 42.3 434.4 376.4 244.9
Vipul Dyechem Ltd. 5.251 5.601 9.637 NA
Voltas Ltd. 2,514.0 3,809.9 3,572.4 1,620.6
Welspun Corp Ltd. 2,135.1 6,104.0 6,330.3 2,385.4
Wendt India Ltd 93.089 99.811 168.355 194.581
West Coat Paper Mills 905.4 547.0 900.8 (335.6)
Yash Papers Ltd. (21.51) 0.794 30.51 (10.898)
Zenith Fibres Ltd. 26.975 28.637 24.781 35.412
Manufacturing – Monthly Update

Trident Limited (533.2) 564.6 670.8 (437.4)
*change in financial year Quarterly Financial Results – Revenue (INR mn)
Company AprJun 2011
JulSep 2011
OctDec 2011
Jan Mar 2012
Oil and Natural Gas Corp. Ltd. 340,246.2 NA 185,171.3 NA
Hindalco Industries Ltd. 59,790.3 NA 66,469.7 NA
Coal India Ltd. 144,990.8 131,480.8 153,492.8 194,189.9
Gail India Ltd. 88,673.8 NA 112,597.8 NA
Sterlite Industries (India) Ltd. 98,240.0 102,352.0 102,461.8 110,022.8
Grasim Industries Ltd. 58,721.0 56,491.9 62,600.7 73,668.4
Aditya Birla Nuvo Ltd. 47,099.9 52,859.0 56,530.6 64,242.9
Pantaloons Retail (India) Ltd. 33,770.7 31,802.6 31,748.0 32,772.8
NMDC Ltd. 27,826.1 30,623.2 28,219.5 25,936.5
Ashok Leyland Ltd. 24,955.1 30,945.7 28,798.0 43,721.2
Crompton Greaves Limited 24,377.4 27,055.3 30,279.5 30,773.6
Welspun Corp Ltd. 17,457.1 20,345.0 24,496.8 26,997.8
Alok Industries Ltd. 16,448.9 NA NA NA
JBF Industries Ltd. 15,905.7 18,520.2 18,040.1 19,207.6
National Aluminium Co. Ltd. 17,331.0 15,837.3 14,486.2 17,534.1
Havells India Ltd. 14,959.0 15,850.0 16,596.0 17,777.0
Manufacturing – Monthly Update

Voltas Ltd. 13,457.5 11,019.3 11,646.4 15,841.8
Jindal Saw Ltd 11,330.7 NA 10,967.1 NA
Jain Irrigation Systems Ltd. NA 7,711.1 NA NA
DCM Shriram Consolidated Limited (DSCL) 12,150.5 10,601.9 13,996.9 13,312.8
Neyveli Lignite Corp. Ltd. NA NA 10,459.9 NA
Uflex Ltd. 11,247.0 10,856.2 11,459.3 11,901.4
Garden Silks Mills Ltd. 7,771.2 10,725.0 7,553.0 9,032.8
PSL Ltd NA NA 5,206.6 NA
BASF India Ltd. 10,137.6 9,509.4 7,526.4 7,619.9
Blue Star Ltd. NA NA 5,896.9 NA
Indo Rama Synthetics India Ltd. 6,206.5 7,717.1 7,639.3 8,125.1
Jindal Poly Films Ltd. 6,227.6 NA 5,048.1 NA
Bajaj Electricals Limited 5,440.7 6,986.2 7,936.4 10,626.3
Pidilite Industries Ltd. 8,450.6 7,813.5 7,680.5 7,321.1
BEML Ltd. NA NA 5,745.0 NA
Moser Baer India Limited 5,230.7 NA 5,563.5 NA
Trident Limited NA 6,999.9 6,584.9 7,152.5
Surya Roshni Limited 5,876.9 NA NA NA
Sundaram Fasteners Ltd. NA NA 5,315.7 NA
Jayaswal Neco Industries Ltd. NA NA 6,586.1 NA
Sterlite Technologies 98,240.0 102,352.0 102,461.8 110,022.8
Manufacturing – Monthly Update
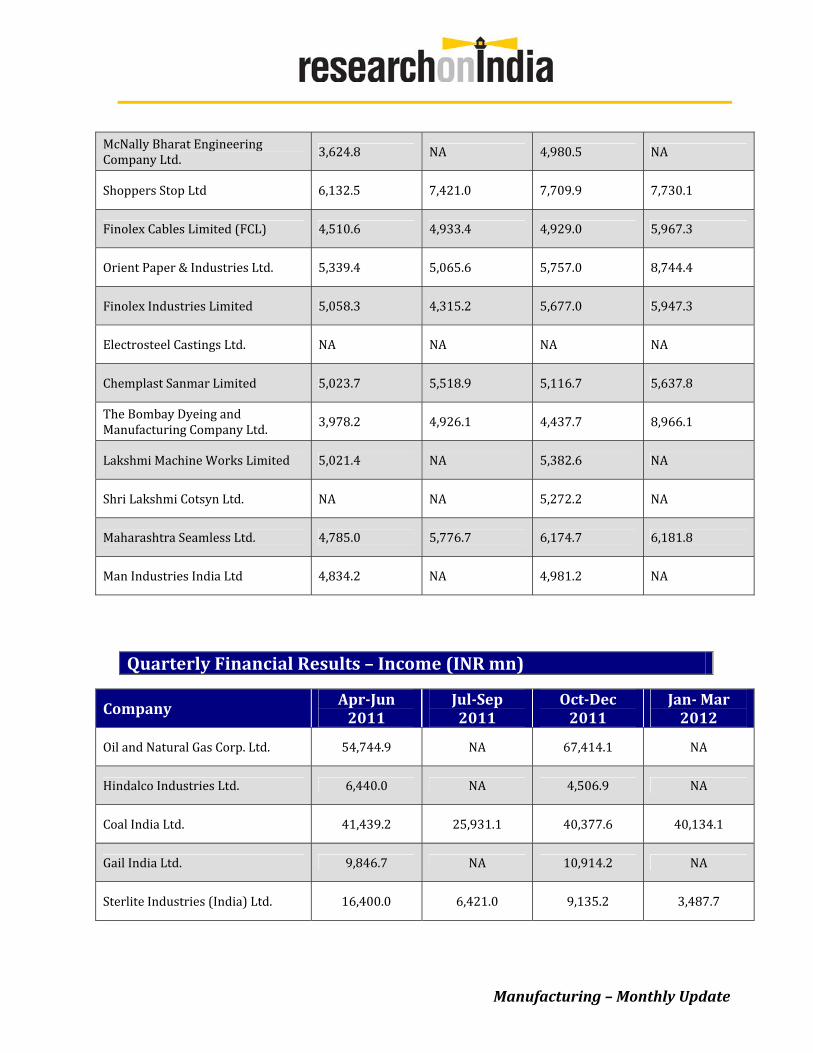
McNally Bharat Engineering Company Ltd. 3,624.8 NA 4,980.5 NA
Shoppers Stop Ltd 6,132.5 7,421.0 7,709.9 7,730.1
Finolex Cables Limited (FCL) 4,510.6 4,933.4 4,929.0 5,967.3
Orient Paper & Industries Ltd. 5,339.4 5,065.6 5,757.0 8,744.4
Finolex Industries Limited 5,058.3 4,315.2 5,677.0 5,947.3
Electrosteel Castings Ltd. NA NA NA NA
Chemplast Sanmar Limited 5,023.7 5,518.9 5,116.7 5,637.8
The Bombay Dyeing and Manufacturing Company Ltd.
3,978.2 4,926.1 4,437.7 8,966.1
Lakshmi Machine Works Limited 5,021.4 NA 5,382.6 NA
Shri Lakshmi Cotsyn Ltd. NA NA 5,272.2 NA
Maharashtra Seamless Ltd. 4,785.0 5,776.7 6,174.7 6,181.8
Ma a Ltd n Industries Indi 4,834.2 NA 4,981.2 NA
Quarterly Financial Results – Income (INR mn)
Company AprJun 2011
JulSep 2011
OctDec 2011
Jan Mar 2012
Oil and Natural Gas Corp. Ltd. 54,744.9 NA 67,414.1 NA
Hindalco Industries Ltd. 6,440.0 NA 4,506.9 NA
Coal India Ltd. 41,439.2 25,931.1 40,377.6 40,134.1
Gail India Ltd. 9,846.7 NA 10,914.2 NA
Sterlite Industries (India) Ltd. 16,400.0 6,421.0 9,135.2 3,487.7
Manufacturing – Monthly Update

Grasim Industries Ltd. 7,516.7 4,179.4 6,690.7 8,087.8
Aditya Birla Nuvo Ltd. 2,532.0 2,142.5 2,523.9 1,702.9
Pantaloons Retail (India) Ltd. 810.6 150.5 (79.6) (0.6)
NMDC Ltd. 18,011.5 19,631.5 18,588.1 16,422.8
Ashok Leyland Ltd. 862.5 1,540.8 669.0 2,587.4
Crompton Greaves Limited 794.7 1,166.6 771.4 1,003.2
Welspun Corp Ltd. 1,191.1 710.8 (701.9) 1,185.5
Alok Industries Ltd. 577.7 NA NA NA
JBF Industries Ltd. 522.5 760.1 711.8 235.4
National Aluminium Co. Ltd. 3,768.4 1,393.4 512.2 2,821.0
Havells India Ltd. 797.0 808.0 886.0 1,208.2
Voltas Ltd. 1,317.9 418.7 (1,154.1) 1,038.1
Jindal Saw Ltd 828.0 NA 365.4 NA
Jain Irrigation Systems Ltd. NA 115.7 NA NA
DCM Shriram Consolidated Limited (DSCL)
260.4 (384.1) (252.0) 494.9
Neyveli Lignite Corp. Ltd. NA NA 1,849.4 NA
Uflex Ltd. 960.9 573.3 511.8 509.5
Garden Silks Mills Ltd. (47.0) 95.2 (382.0) (450.1)
PSL Ltd NA NA 66.6 NA
BASF India Ltd. 526.6 341.9 60.3 79.8
Blue Star Ltd. NA NA (327.6) NA
Manufacturing – Monthly Update
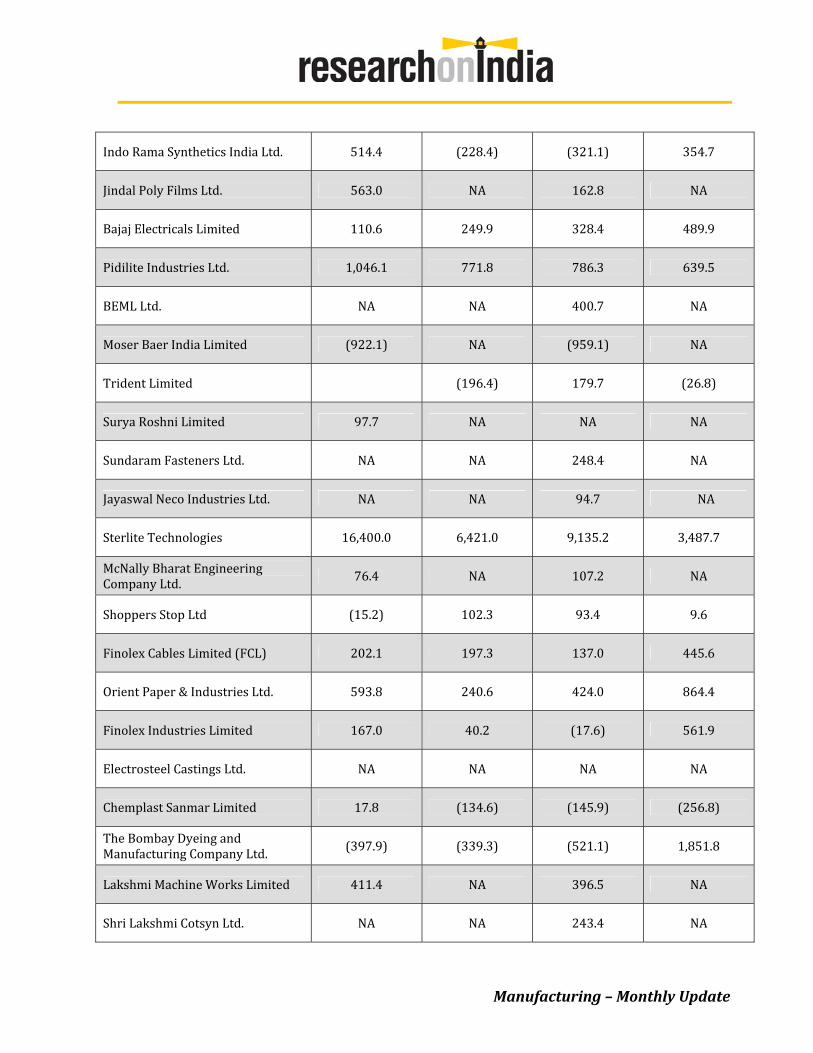
Indo Rama Synthetics India Ltd. 514.4 (228.4) (321.1) 354.7
Jindal Poly Films Ltd. 563.0 NA 162.8 NA
Bajaj Electricals Limited 110.6 249.9 328.4 489.9
Pidilite Industries Ltd. 1,046.1 771.8 786.3 639.5
BEML Ltd. NA NA 400.7 NA
Moser Baer India Limited (922.1) NA (959.1) NA
Trident Limited (196.4) 179.7 (26.8)
Surya Roshni Limited 97.7 NA NA NA
Sundaram Fasteners Ltd. NA NA 248.4 NA
Jayaswal Neco Industries Ltd. NA NA 94.7 NA
Sterlite Technologies 16,400.0 6,421.0 9,135.2 3,487.7
McNally Bharat Engineering Company Ltd.
76.4 NA 107.2 NA
Shoppers Stop Ltd (15.2) 102.3 93.4 9.6
Finolex Cables Limited (FCL) 202.1 197.3 137.0 445.6
Orient Paper & Industries Ltd. 593.8 240.6 424.0 864.4
Finolex Industries Limited 167.0 40.2 (17.6) 561.9
Electrosteel Castings Ltd. NA NA NA NA
Chemplast Sanmar Limited 17.8 (134.6) (145.9) (256.8)
The Bombay Dyeing and Manufacturing Company Ltd. (397.9) (339.3) (521.1) 1,851.8
Lakshmi Machine Works Limited 411.4 NA 396.5 NA
Shri Lakshmi Cotsyn Ltd. NA NA 243.4 NA
Manufacturing – Monthly Update

Maharashtra Seamless Ltd. 716.5 811.7 810.1 835.7
Man Industries India Ltd 235.8 NA 274.8 NA
Events Calendar
Halfday Seminar o n”Recent Trends in Business Strategy” Date: 11th Aug 2012
, Venue: Hotel The Metropole, Conference HallMadurai, Tamil Nadu, India
tion of Indian Industry Organizer: Confedera(CII) Website: www.cii.in Contact ID: [email protected] Contact No: +91‐452‐4391434
Conference on Industrial Automation Date: 25th Aug, 2012 Venue: Hotel Park Sheraton, Mowbrays Hall, Chennai, Tamilnadu, India Tamil Nadu
tion of Indian Industry Organizer: Confedera(CII) Website: www.cii.in Contact ID: [email protected] Contact No: + 91‐44‐42444510
Conceiv to Commercialie se : Accelerate your New Product Development Date: 29th ‐30th Aug, 2012 Venue: CII Naoroji Godrej Centre of Excellence, CII Naoroji Godrej Centre of Excellence, Vikhroli, , , India
tion of Indian Industry Organizer: Confedera(CII) Website: www.cii.in Contact ID: [email protected] Contact No: +91‐22‐2574 5146
Export Summit Date: 28th Aug, 2012 Venue: Delhi, New Delhi, India
tion of Indian Industry Organizer: Confedera(CII) Website: www.cii.in Contact ID: [email protected]
Manufacturing – Monthly Update

Research on India (ROI) is a leading source for market research on various sectors in ndia that offers premium research content from worldwide publishers of market
orts. Iresearch rep Contact us:
mW: https://www.researchonindia.co ; International: +91 (33) 4027 6214/5 T
E: India (Toll Free): 1800 102 1133: [email protected] Connect with Us
Disclaimer: This monthly update is published for general information only based on press articles and company releases. Research on India has not independently verified any of nformation and is not responsible for any loss or damage arising from use of this document. i
Manufacturing – Monthly Update