response surface statistical optimization of bacterial
TRANSCRIPT
Contents lists available at ScienceDirect
New BIOTECHNOLOGY
journal homepage: www.elsevier.com/locate/nbt
Response surface statistical optimization of bacterial nanocellulosefermentation in static culture using a low-cost medium
Ana Cristina Rodriguesa, Ana Isabel Fontãoa,1, Aires Coelhoa,1, Marta Leala,Francisco A.G. Soares da Silvaa,1, Yizao Wanb, Fernando Douradoa,⁎, Miguel Gamaa
a CEB- Centre of Biological Engineering, University of Minho, Campus de Gualtar, 4710-057, Braga, Portugalb School of Materials Science and Engineering, East China Jiaotong University, Nanchang, 330013, China
A R T I C L E I N F O
Keywords:BNC production optimizationLow-cost substratesResponse surface methodology-centralcomposite designCulture medium depthSurface area
A B S T R A C T
This work aimed at the optimization of bacterial nanocellulose (BNC) production by static culture, usingKomagataeibacter xylinus BPR 2001 (K. xylinus). Response surface methodology - central composite design wasused to evaluate the effect of inexpensive and widely available nutrient sources, namely molasses, ethanol, cornsteep liquor (CSL) and ammonium sulphate, on BNC production yield. The optimized parameters for maximumBNC production were % (m/v): molasses 5.38, CSL 1.91, ammonium sulphate 0.63, disodium phosphate 0.270,citric acid 0.115 and ethanol 1.38% (v/v). The experimental and predicted maximum BNC production yieldswere 7.5 ± 0.54 g/L and 6.64 ± 0.079 g/L, respectively and the experimental and predicted maximum BNCproductivity were 0.829 ± 0.046 g/L/day and 0.734 ± 0.079 g/L/day, after 9 days of static culture fermen-tation, at 30 °C. The effect of surface area and culture medium depth on production yield and productivity werealso studied. BNC dry mass production increased linearly with surface area, medium depth and fermentationtime. So long as nutrients were still available in the culture media, BNC mass productivity was constant. Theresults show that a high BNC production yield can be obtained by static culture of K. xylinus BPR 2001 using alow-cost medium. These are promising conditions for the static industrial scale BNC production, since as com-pared to agitated bioreactors, higher productivities may be reached, while avoiding high capital and operatingcosts.
Introduction
Bacterial nanocellulose (BNC) is an exopolysaccharide produced byKomagataeibacter xylinus (formerly Gluconacetobacter xylinus), a Gramnegative and strictly aerobic bacterium of the Acetobacteraceae family[1–6]. BNC shows several unique physicochemical and mechanicalproperties, including high purity, high crystallinity, high degree ofpolymerization [7], an ultrafine fiber network, high water holding andabsorbing abilities [8], high tensile strength in the wet state [9], andthe possibility to be shaped into 3D structures during synthesis. It isbiocompatible and biofunctional [10]. Due to these properties, thebiopolymer has been studied in several applications, including tissueregeneration, drug delivery systems, vascular grafts, in vitro and in vivoscaffolds for tissue engineering, electronic paper displays and in foodapplications [11–17]. These properties and applications have generated
a growing interest in the development of new strategies aimed at large-scale BNC production. Several fermentation technologies have beenattempted, such as agitated, air-lift, membrane and horizontal bior-eactors, using different fermentation media and overproducing mutantstrains. Stirred tank reactors can prevent the heterogeneity of the cul-ture broth, at the expense of a high energy cost for generation of me-chanical power. Airlift reactors typically require only one sixth of theenergy power used in stirred tank reactors. Nonetheless, the agitationpower of an airlift reactor is limited, resulting in low fluidity of theculture broth, especially at high cellulose concentrations. In addition,both agitation and aeration systems have been reported to result in thedevelopment of cellulose-negative mutants (non-cellulose producers,Cel−) [18–20]. In the case of membrane bioreactors, the major draw-backs include high operating costs and difficulty in collecting the cel-lulose from the reactors following fermentation [9,18–23].
https://doi.org/10.1016/j.nbt.2018.12.002Received 5 June 2018; Received in revised form 5 December 2018; Accepted 5 December 2018
Abbreviations: BNC, bacterial nanocellulose; K. xylinus, Komagataeibacter xylinus; CSL, corn steep liquor; RSM, Response Surface Methodology; CCD, CentralComposite Design; HS medium, Hestrin-Schramm culture medium; S, surface fermentation area; L, culture medium depth; V, culture medium volume
⁎ Corresponding author.E-mail address: [email protected] (F. Dourado).
1 These authors contributed equally to this work.
New BIOTECHNOLOGY 49 (2019) 19–27
Available online 06 December 20181871-6784/ © 2018 Elsevier B.V. All rights reserved.
“Traditional” static cultivation methods for BNC production, mostlyused in Asian countries, are difficult to implement on a large scale.Although the yield is relatively high, the long fermentation times re-quired, the need for large areas and intensive manpower and high la-bour costs have deterred such processes from implementation in largescale, modern facilities. Alongside the fermentation method (staticversus agitated/aerated), which impacts on the capital investment andoperating costs), the economic feasibility of BNC production is directlydependent on product yield. The production parameters in static cul-ture include the composition of the culture media, fermentation tem-perature, pH and time, inoculum ratio [18,24] and surface area to vo-lume ratio (air-liquid interface) of the culture medium (S/V) [20,25].The greater the medium surface area, the higher the production of BNC,given the aerobic character of the bacterium. Several reports haveanalysed the optimal surface area/volume ratio for BNC production instatic culture [20,25,26], but the results obtained cannot be easilycompared, due to differences in fermentation times, culture mediacomposition and strains used. As with many fermentation processes, thecost and availability of the substrates play a determining role in theeconomic feasibility of the process. Thus, it is important to explore theuse of widely available low-cost substrates, especially agro-industrialby-products, to improve BNC yield. While several reports have ad-dressed the use of different culture media to optimize BNC productionusing K. xylinus BPR 2001 under agitated condition, less attention hasbeen paid to the use of static culture specifically for K. xylinus BPR2001. Those studies relied on the use of fructose and corn steep liquor(CSL) as the carbon and nitrogen sources, combined with a largenumber (sometimes more than 20) of other nutrients, such as differentvitamins, amino acids and salts. Such complex culture media are im-practical for the large-scale implementation of a BNC production pro-cess (Table 1).
The cost of the nutrients, media composition, available surface area,
fermentation depth and time, should all be considered for economicBNC production in static culture. Here, we report optimization of BNCproduction by K. xylinus BPR 2001 under static culture conditions,using a simple culture medium composition. Optimization was per-formed using response surface methodology (RSM) - central compositedesign (CCD). The effect of four nutrients - molasses and ethanol as thecarbon sources, CSL as the nitrogen and protein source and ammoniumsulphate - on the BNC production yield (g/L) (as the response variable)was assessed. In addition, the effect of the surface area and culturemedium depth on the BNC production yield and productivity, wereevaluated.
Materials and methods
Bacterial strain
K. xylinus subsp sucrofermentants BPR 2001 (ATCC 700178), fromthe American Type Culture Collection, was used for the production ofBNC under static conditions. The strain was maintained in Hestrin-Schramm culture medium (HS medium) [46], in solid state with 2%(m/v) agar (Acros Organics).
Inoculum preparation and static culture fermentation
BPR 2001 cells were grown in 1 L conical flasks, containing 100mLHS medium, comprising (in % m/v) glucose 2.0 (Fisher Chemical),peptone 0.5 (OXOID), yeast extract 0.5 (OXOID), disodium phosphate(Na2HPO4) 0.27 (Panreac) and citric acid 0.115 (Panreac). The initialpH was set to 5.5 using 18% (v/v) HCL (Fisher-Chemical). The mediumwas autoclaved at 121 °C, 1 bar for 20min before use. The culture wasincubated for 2 d at 30 °C under static conditions. Thereafter, the cel-lulose pellicle formed was vigorously shaken in order to remove active
Table 1Summary of the data available on the BNC production yield with K. xylinus BPR2001.
CarbonSource
NitrogenSource
Type of culture Additives/ aBNC production yield
Fructose CSL AgitatedJar fermenter(with oxygen suplementation, batch andfed-batch conditions)
• BNC yield 7.7 g/L [27];• bComplex medium • endo-p-l,4-glucanase from Bacillus suhtilis • BNC yield 4.5 g/L [28];• Agar • BNC yield 12.8 g/L [29];• Complex medium • BNC yield 7.5 g/L [30];• Complex medium • Agar • BNC yield 14.3 g/L [31];• KH2PO4 • (NH4)2SO4 • MgSO4·7H2O • BNC yield 1.13 g/L [32].
AgitatedShaken flasks
• Complex medium and Polyacrylamide-co-acrylic acid • BNC yield 6.5 g/L [33];• Complex medium • Carboxymethyl celulose • Microcrystalline celulose • Agarand Sodium alginate • BNC yield 8.2 g/L [34].
Agitatedair-lift reactor
• Complex medium • Agar • Xanthan • BNC yield 8.7 g/L [35];• Complex medium • BNC yield 3.8 g/L and 10.4 g/L [36,37].
AgitatedPlastic composite support rotatingdisk bioreactor(PCS-RDB),
• Complex medium • Carboxymethyl celulose • BNC yield 13 g/L [38];• Complex medium • Microcrystalline cellulose (Avicel) • Carboxymethylcellulose(CMC) • Agar • Sodium alginate • BNC yield 0.64 g/slice [39].
Treated Molasses Agitatedjar fermenter
• Complex medium • BNC yield 14.3 g/L and 12.8 g/L [30,40].
Wheat straw hydrolysate AgitatedFlask shaken
• Complex medium • BNC yield 10.6 g/L [41].
Wheat straw hydrolysateCorn fibersDistilller´s dried grains withSolubles
AgitatedFlask shaken
• Complex medium • BNC yield 5.2 g/L[42].
Glucose or dextrose Flask shaken • 1-Methylcyclopropene • magnesium sulphate • ammonium sulphate • BNC yield1.2 g/L [43].
Maple syrup Yeast extract Flask shaken • Ethanol • Acetic acid • MgSO4·7H2O • Agar • BNC yield 3.2 g/L [44].Carob Haricot bean Static • BNC yield 6.5 g/L [45].
aBNC production yield is represented as g dry BNC mass/Litre of culture media.bBy complex medium is meant a combination of culture medium to which different vitamins, amino acids and salts were added. Sometimes the culture mediumcontains about 20 or more components.
A.C. Rodrigues et al. New BIOTECHNOLOGY 49 (2019) 19–27
20
cells entrapped within the cellulose matrix; 4 mL (10% (v/v) of the finalvolume) of this inoculum was transferred to 100mL conical flasks,containing a final volume of 40mL of different combinations of culturemedia, prepared using molasses (a gift from RAR Refinarias de AçúcarReunidas, S.A.; Portugal), CSL (a gift from COPAM CompanhiaPortuguesa de Amidos, S.A.; Portugal), ammonium sulphate (Panreac)and ethanol (Fisher-Chemical), as described below. The inoculatedmedia were incubated for 9 d, at 30 °C under static conditions. Aftercultivation, the BNC membranes were collected, purified and the pro-duction yield (in g/L) was determined as described below.
Optimization of BNC production using response surface methodology (RSM)- central composite design
In this study, the optimization process of BNC production firstlyentailed identifying the preferred nutrients (carbon and nitrogensources) for BNC production based on the literature (Table 1) andvarying one factor at a time while keeping the others constant (data notshown). Based on the collected information, preliminary fermentationassays were performed to evaluate the effect of the selected nutrients(and their concentrations), on BNC yield. Data collected from theseexperiments allowed better determination of the boundaries for eachvariable to be tested (levels of factors). Molasses and CSL are the mosteconomical carbon and nitrogen sources commonly used in industrialfermentations [40,47] (Table 1). CSL is a nutrient-rich by-productsupply of amino acids, vitamins and minerals, and has been reported tohave buffering capacity [48]. According to the literature review,ethanol and ammonium sulphate have been observed to increase BNCproduction yield [20,43,49–51]. Also, certain Acetobacteraceae strainsare known to be capable of using ethanol as an additional carbon source[18,21,49–51]. Supplementing a culture medium with ethanol also al-lowed repression of the spontaneous mutations of BNC producing cells(Cel+) to non-producing cells (Cel−) and increased cells ATP produc-tion [20,49–52]. As such, these compounds were included in our mediaformulations.
The optimization process then focused on evaluating the effect offour independent variables: molasses (A) and ethanol (D) as carbonsources, nitrogen from CSL (B) and ammonium sulphate (C), on theyield of BNC, using response surface methodology based on centralcomposite design (Tables 2 and 3). The software Design Expert 7.1.5(Stat-Ease, Inc., USA, Windows operating system) was used to de-termine the experimental design matrix and its statistical experimentaldesign analysis. All the assays/formulations were performed in tripli-cate, except the central point of the factorial design, were 5 replicateswere performed, resulting in a total of 77 experiments and 25 differentculture media formulations (Table 3). All combinations of the fermen-tation medium included 0.27% (m/v) Na2HPO4 and 0.115% (m/v) ci-tric acid. The initial pH used was set to 5.5 in all media. HS medium wasused as control.
Three-dimensional curves of the response surfaces were generatedusing Design Expert 7.1.5 (Stat-Ease, Inc., USA, Windows operatingsystem) to visualize individual effects and interaction between sig-nificant parameters. All experiments were performed independently,following the sequential order shown in Table 3. Each run was per-formed in triplicate and an average value of the responses was used for
the presentation of the results. The model was evaluated using theFisher´s statistical test for analysis or variance (ANOVA).
Effect of surface area at a constant S/V ratio on BNC production yield
The effect of surface fermentation area (S) on BNC yield was eval-uated. Containers having variable fermentation areas and a fixed fer-mentation broth depth (of 2.5 cm) were used, resulting in a fixed S/Vratio of 0.4 cm−1. Fermentation broth containing molasses 4% (m/v),CSL 0.7% (m/v) (protein basis), ethanol 1.5% (v/v), ammonium sul-phate 0.5% (m/v), Na2HPO4 0.27% (m/v) and citric acid 0.115% (m/v), initial pH 5.5, was sterilized. The medium was then inoculated andtransferred to the containers with the different surface areas. Thesewere incubated for 15 d under static conditions at 30 °C. BNC was thencollected, purified and the production yield (in g/L) determined asdescribed below.
Effect of surface area/culture medium depth ratio (S/L) on BNC productionyield
The effect of the culture medium depth (L) on the BNC yield wasevaluated. Containers having the same fermentation area (S, 336 cm2),were filled with inoculated fermentation broth (as described above) at adepth (L) of 1 cm (320mL), 2.5 cm (620mL) and 4 cm (1000mL),yielding S/L ratios of 336, 134.4 and 84 cm and S/V ratios of 1.05, 0.54
Table 2Levels of factors chosen for the experimental central composite design.
Sources Variable Symbol LowerLimit(-2)
LowCoded(-1)
CenterCoded(0)
HighCoded(+1)
HigherLimit(+2)
Units
Carbon Molasses (total sugars) (A) 2.00 3.13 4.25 5.38 6.50 % (m/v)Ethanol (D) 1.00 1.38 1.75 2.13 2.50 % (v/v)
Nitrogen CSL (protein basis) (B) 0.15 0.74 1.33 1.91 2.50 % (m/v)Ammonium Sulphate total (C) 0.00 0.63 1.25 1.88 2.50 % (m/v)
Table 3Central Composite design matrix for the four variables. Coded values and realvalues, where coded values given in parentheses.
# Run A:Molasses% m (total ofsugar/v)
B:CSL% m (total ofprotein/v)
C:AmmoniumSulphate% (m/v)
D:Ethanol% (v/v)
1 |2 |15 (-2) 2.00 (0) 1.33 (0) 1.25 (0) 1.754 |55 |72 (-1) 3.13 (+1) 1.91 (+1) 1.88 (-1) 1.385 |20 |49 (-1) 3.13 (-1) 0.74 (+1) 1.88 (-1) 1.388 |59 |74 (-1) 3.13 (-1) 0.74 (+1) 1.88 (+1) 2.1314 |32 |68 (-1) 3.13 (+1) 1.91 (-1) 0.63 (-1) 1.3839 |56 |58 (-1) 3.13 (+1) 1.91 (+1) 1.88 (+1) 2.139 |29 |52 (-1) 3.13 (-1) 0.74 (-1) 0.63 (-1) 1.3833 |60 |66 (-1) 3.13 (-1) 0.74 (-1) 0.63 (+1) 2.1323 |43 |71 (-1) 3.13 (+1) 1.91 (-1) 0.63 (+1) 2.137 |24 |64 (0) 4.25 (+2) 2.50 (0) 1.25 (0) 1.7512 |16 |40 (0) 4.25 (0) 1.33 (-2) 0.00 (0) 1.7521 |26 |28
|48 |65(0) 4.25 (0) 1.33 (0) 1.25 (0) 1.75
27 |34 |62 (0) 4.25 (0) 1.33 (0) 1.25 (+2) 2.5031 |50 |73 (0) 4.25 (-2) 0.15 (0) 1.25 (0) 1.7535 |45 |61 (0) 4.25 (0) 1.33 (+2) 2.50 (0) 1.7551 |54 |70 (0) 4.25 (0) 1.33 (0) 1.25 (-2) 1.0025 |75 |76 (+1) 5.38 (+1) 1.91 (+1) 1.88 (-1) 1.3822 |44 |77 (+1) 5.38 (-1) 0.74 (-1) 0.63 (-1) 1.3810 |63 |69 (+1) 5.38 (+1) 1.91 (-1) 0.63 (+1) 2.136 |30 |42 (+1) 5.38 (-1) 0.74 (-1) 0.63 (+1) 2.1341 |46 |57 (+1) 5.38 (+1) 1.91 (-1) 0.63 (-1) 1.3811 |36 |67 (+1) 5.38 (+1) 1.91 (+1) 1.88 (+1) 2.1319 |37 |53 (+1) 5.38 (-1) 0.74 (+1) 1.88 (-1) 1.383 |13 |47 (+1) 5.38 (-1) 0.74 (+1) 1.88 (+1) 2.1317 |18 |38 (+2) 6.50 (0) 1.33 (0) 1.25 (0) 1.75
A.C. Rodrigues et al. New BIOTECHNOLOGY 49 (2019) 19–27
21
and 0.34 cm−1, respectively. All were incubated for 9, 15 and 21 dunder static conditions at 30 °C. BNC was purified and the productionyield (g/L) was determined as described below.
BNC purification and BNC yield determination
After cultivation, the BNC membranes obtained were washed withdistilled water at room temperature (RT) to remove culture mediumresidues, then washed with 0.1 M NaOH (Fisher-Chemical) at RT; thissolution was changed twice daily until the membranes turned com-pletely white by visual inspection. The bleached membranes were thenwashed with distilled water at RT until the pH became that of thedistilled water. The purified BNC was oven dried to constant mass at50 °C and weighed to determine production yield (expressed in g of dryBNC/L of culture media).
Analytical methods- Total sugars and protein quantification
Analysis of total molasses sugars was by HPLC, using a Metacarb 87H column (300, 7.8 mm, Varian, USA), PU-2080 Plus pump (JASCO),DG-2080-53 degasser (JASCO), AS2057-Plus automatic sample injector(JASCO) and a 2031 Plus RI detector (JASCO) under the followingconditions: mobile phase 0.005M H2SO4, flow rate 0.5 mL/min, andcolumn temperature 35 °C (Oven Elder CH-150). The injected volumewas 20 μL. The concentrations of sucrose, glucose and fructose weredetermined based on calibration curves obtained using pure com-pounds. The composition of molasses (g/L) determined was sucrose687.7 ± 1.23, glucose 20.6 ± 6.22 and fructose 12.8 ± 2.05.
Total protein analysis of CSL was performed by BCA Protein assayskit (Pierce® BCA 23227 Protein Assay Kit, Thermo Scientific). The totalprotein CSL composition was 167.5 ± 8.6 g/L.
Statistical analysis
The statistical analyses One-way and Two-way ANOVA were per-formed using GraphPad Prism version 5 for Windows, GraphPadSoftware, San Diego, California, USA.
Results and discussion
Response surface methodology – central composite design
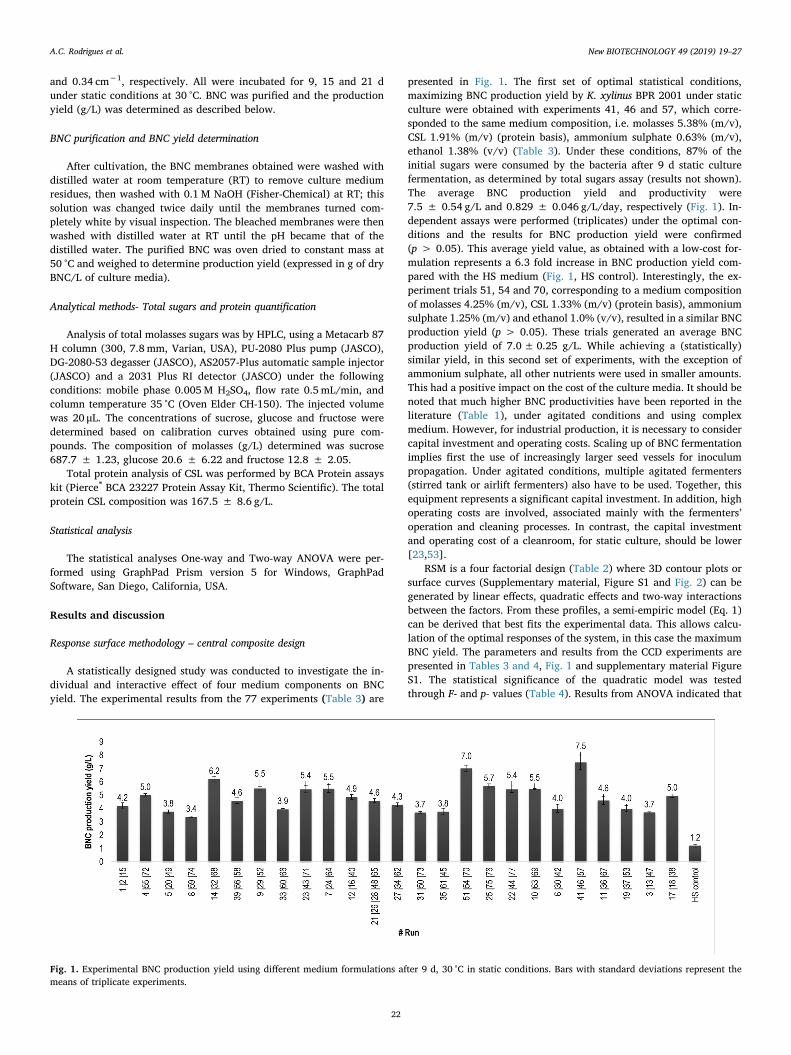
A statistically designed study was conducted to investigate the in-dividual and interactive effect of four medium components on BNCyield. The experimental results from the 77 experiments (Table 3) are
presented in Fig. 1. The first set of optimal statistical conditions,maximizing BNC production yield by K. xylinus BPR 2001 under staticculture were obtained with experiments 41, 46 and 57, which corre-sponded to the same medium composition, i.e. molasses 5.38% (m/v),CSL 1.91% (m/v) (protein basis), ammonium sulphate 0.63% (m/v),ethanol 1.38% (v/v) (Table 3). Under these conditions, 87% of theinitial sugars were consumed by the bacteria after 9 d static culturefermentation, as determined by total sugars assay (results not shown).The average BNC production yield and productivity were7.5 ± 0.54 g/L and 0.829 ± 0.046 g/L/day, respectively (Fig. 1). In-dependent assays were performed (triplicates) under the optimal con-ditions and the results for BNC production yield were confirmed(p > 0.05). This average yield value, as obtained with a low-cost for-mulation represents a 6.3 fold increase in BNC production yield com-pared with the HS medium (Fig. 1, HS control). Interestingly, the ex-periment trials 51, 54 and 70, corresponding to a medium compositionof molasses 4.25% (m/v), CSL 1.33% (m/v) (protein basis), ammoniumsulphate 1.25% (m/v) and ethanol 1.0% (v/v), resulted in a similar BNCproduction yield (p > 0.05). These trials generated an average BNCproduction yield of 7.0± 0.25 g/L. While achieving a (statistically)similar yield, in this second set of experiments, with the exception ofammonium sulphate, all other nutrients were used in smaller amounts.This had a positive impact on the cost of the culture media. It should benoted that much higher BNC productivities have been reported in theliterature (Table 1), under agitated conditions and using complexmedium. However, for industrial production, it is necessary to considercapital investment and operating costs. Scaling up of BNC fermentationimplies first the use of increasingly larger seed vessels for inoculumpropagation. Under agitated conditions, multiple agitated fermenters(stirred tank or airlift fermenters) also have to be used. Together, thisequipment represents a significant capital investment. In addition, highoperating costs are involved, associated mainly with the fermenters’operation and cleaning processes. In contrast, the capital investmentand operating cost of a cleanroom, for static culture, should be lower[23,53].
RSM is a four factorial design (Table 2) where 3D contour plots orsurface curves (Supplementary material, Figure S1 and Fig. 2) can begenerated by linear effects, quadratic effects and two-way interactionsbetween the factors. From these profiles, a semi-empiric model (Eq. 1)can be derived that best fits the experimental data. This allows calcu-lation of the optimal responses of the system, in this case the maximumBNC yield. The parameters and results from the CCD experiments arepresented in Tables 3 and 4, Fig. 1 and supplementary material FigureS1. The statistical significance of the quadratic model was testedthrough F- and p- values (Table 4). Results from ANOVA indicated that
Fig. 1. Experimental BNC production yield using different medium formulations after 9 d, 30 °C in static conditions. Bars with standard deviations represent themeans of triplicate experiments.
A.C. Rodrigues et al. New BIOTECHNOLOGY 49 (2019) 19–27
22
the quadratic regression used to produce a second order model wassignificant, as revealed from the p- and F-values: the calculated ModelF-value of 29.56 and the p-value of< 0.0001 indicate that the model issignificant (i.e. there is only 0.01% probability that the value of “ModelF-Value” is due to noise). The “Lack of Fit-F-Value” of 2.81 indicatesthat the Lack of Fit is significant. There is only a 0.74% chance that a"Lack of Fit F-value" this large could occur due to noise. Also, a sig-nificant lack of fit (0.0074, Table 4) suggests that there may be some
systematic variation, unaccounted for in the hypothesized model. Thismay be due to the exact replicate values of the independent variable inthe model that provide an estimate of pure error.
The second–order polynomial equation of the model fitted for BNCproduction before eliminating the non-significant terms is:
BNCproduction yield (g/L) = + 12.77+ 0.24 * molasses + 0.30 * CSL– 1.80 * ammonium sulphate – 8.06 * ethanol + 0.093 * molasses *CSL+0.037 * molasses * ammonium sulphate – 0.19 * molasses *
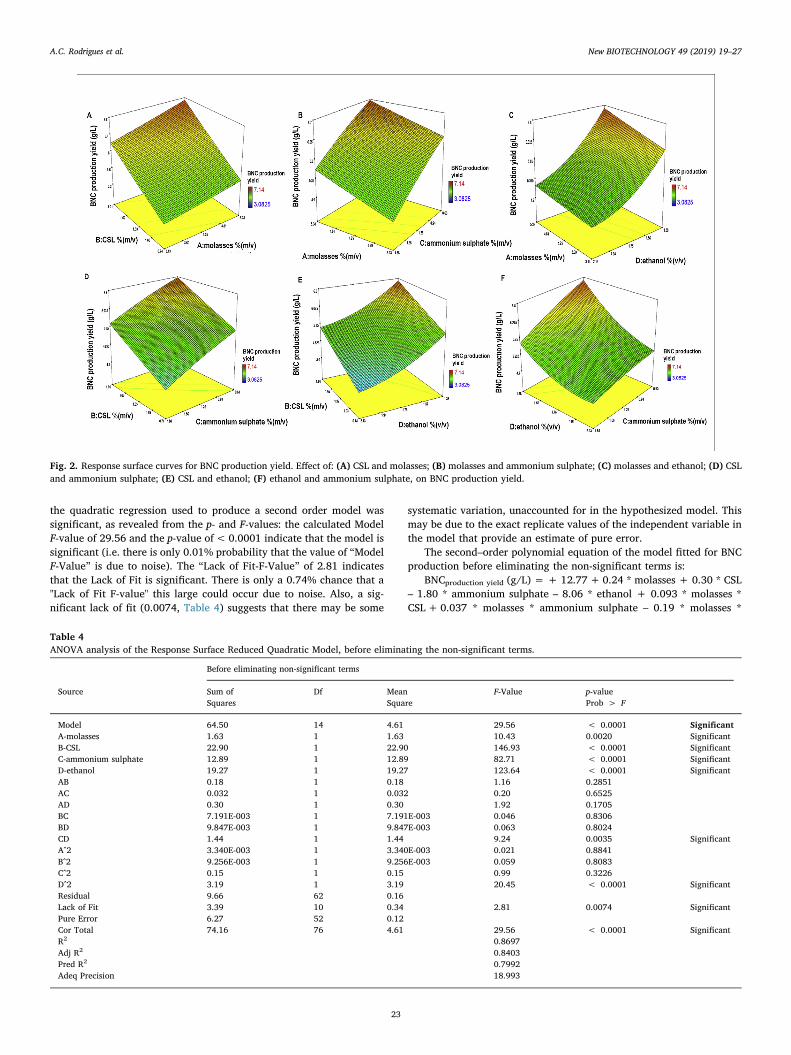
Fig. 2. Response surface curves for BNC production yield. Effect of: (A) CSL and molasses; (B) molasses and ammonium sulphate; (C) molasses and ethanol; (D) CSLand ammonium sulphate; (E) CSL and ethanol; (F) ethanol and ammonium sulphate, on BNC production yield.
Table 4ANOVA analysis of the Response Surface Reduced Quadratic Model, before eliminating the non-significant terms.
Before eliminating non-significant terms
Source Sum ofSquares
Df MeanSquare
F-Value p-valueProb > F
Model 64.50 14 4.61 29.56 < 0.0001 SignificantA-molasses 1.63 1 1.63 10.43 0.0020 SignificantB-CSL 22.90 1 22.90 146.93 < 0.0001 SignificantC-ammonium sulphate 12.89 1 12.89 82.71 < 0.0001 SignificantD-ethanol 19.27 1 19.27 123.64 < 0.0001 SignificantAB 0.18 1 0.18 1.16 0.2851AC 0.032 1 0.032 0.20 0.6525AD 0.30 1 0.30 1.92 0.1705BC 7.191E-003 1 7.191E-003 0.046 0.8306BD 9.847E-003 1 9.847E-003 0.063 0.8024CD 1.44 1 1.44 9.24 0.0035 SignificantA^2 3.340E-003 1 3.340E-003 0.021 0.8841B^2 9.256E-003 1 9.256E-003 0.059 0.8083C^2 0.15 1 0.15 0.99 0.3226D^2 3.19 1 3.19 20.45 < 0.0001 SignificantResidual 9.66 62 0.16Lack of Fit 3.39 10 0.34 2.81 0.0074 SignificantPure Error 6.27 52 0.12Cor Total 74.16 76 4.61 29.56 < 0.0001 SignificantR2 0.8697Adj R2 0.8403Pred R2 0.7992Adeq Precision 18.993
A.C. Rodrigues et al. New BIOTECHNOLOGY 49 (2019) 19–27
23
ethanol + 0.033 * CSL * ammonium sulphate + 0.065 * CSL * ethanol+ 0.74 + ammonium sulphate * ethanol + 6.65E-03 * molasses2 +0.041 * CSL2 – 0.15 * ammonium sulphate2 + 1.85 * ethanol2 (Eq. 1)
{Degree of freedom=14; F-value= 29.56; p-value<0.0001;R2=0.8697}
Model terms with values of p-value Prob > F (Table 4) lower than0.05 indicated that the model terms are significant; for p-value Prob> F higher than 0.1, the model terms are non-significant. In this case,the model terms A (molasses), B (CSL), C (ammonium sulphate), D(ethanol), CD and D2 were considered significant. The R2 value providesa measure of how much variability in the observed response values canbe explained by the experimental factors and their interactions. Thecloser R2 value to 1.00, the stronger the model is and the better itpredicted the observed response. It was suggested that the R2 valueshould be at least 0.80, for a good model fitness [54]. Here, the cal-culated R2 value of 0.8697 (Table 4), indicated that 13.03% of the totalvariation could not be explained by the empirical model; this expressesa good enough quadratic fit to navigate the design space. Thus, theresponse surface model developed in this study for predicting the BNCproduction may be considered satisfactory. The signal to noise ratio wasmeasured by Adeq Precision value (of 18.993); a ratio greater than 4also indicates that this model can be used to navigate the design space.
From the above, the second order polynomial equation of the modelfitted for BNC production, after eliminating the non-significant terms(Table 4), is:
BNCproduction yield (g/L)= 13.43+ 0.13 * molasses + 0.96 * CSL -1.97 * ammonium sulphate - 8.99 * ethanol + 0.74 * ammonium sul-phate * ethanol + 1.91 * ethanol2 (Eq. 2)
{Degree of freedom=6; F-value= 70.70; p-value<0.0001;R2=0.8584}
whereby the F-value increased, meaning that the mean squares of themodel are larger than the square residual average. Thus, with a higherthe F-value, the more significant p-value for ANOVA and the moresignificant the model is.
The optimal concentrations of the four factors that maximized BNCproduction yield were predicted using the optimization function of thestatistical experimental designs Design Expert 7.1.5. Molasses 5.38%(m/v), CSL 1.91% (m/v) (protein basis), ammonium sulphate 0.63%(m/v), ethanol 1.38% (v/v) were chosen as the optimal concentrations(optimized medium), allowing the highest BNC yield. The predictedmedium composition coincided with experiment trials 41, 46 and 57(Table 3). No statistical differences were observed between the pre-dicted maximum production yield and productivity (6.64 ± 0.4 g/Land 0.737 ± 0.079 g/L/d) and the experimental results(7.5 ± 0.54 g/L and 0.829 ± 0.046 g/L/d) (p > 0.05). The optimizedresults were also confirmed (p > 0.05) by conducting a further fer-mentation experiment in triplicate at the above-optimized values, re-sulting in a production yield and productivity of 7.6± 0.56 g/L and0.849± 0.062 g/L/d, respectively. A Parity plot illustrating the dis-tribution of experimental (actual) and predicted (model) values isshown in Supplementary material, Figure S1. Data points are scatteredalong the diagonal line, also suggesting that the model is adequate toexplain BNC production within the experimental range studied.
Effect of terms on bacterial nanocellulose production
3D response surface graphs (Fig. 2) were plotted to illustrate theinteraction of the different paired factors and to determine the optimumof each paired factor for maximum response. Each graph represents thecombinations of two test factors in relation to BNC production yield (g/L). The data in Fig. 2 A indicate that the increase in both the carbon(molasses) and protein/nitrogen sources (CSL) resulted in increasedBNC production. From the combined effect of molasses and ammonium
sulphate concentration (Fig. 2 B), the highest production was obtainedwith the lowest ammonium sulphate concentration and the highestmolasses concentration. Similar results were obtained with the com-bined effect of molasses and ethanol (Fig. 2 C). The effects of CSL andethanol concentrations, and of CSL and ammonium sulphate, on BNCproduction yield are illustrated in Fig. 2 D and E. Yield increased as theconcentrations of CSL and ethanol/ammonium sulphate increased anddecreased, respectively. The main medium combination of ethanol andammonium sulphate (CD, Table 4) showed the highest p-value forProb > F (0.0035) and therefore represents a more significant modelterm combination. Finally, BNC production yield increased with thedecrease in ethanol and ammonium sulphate (Fig. 2 F). Ethanol is awell-known carbon source during BNC fermentation and ammoniumsulphate is a source of nitrogen [20,49–52]. It is possible that higherconcentrations of these nutrients could have led to a substrate growthinhibition and/or affected BNC production. Indeed, Figs. 2 B, C, D andE, where ethanol or ammonium sulphate are present, all show an in-crease in BNC yield, along with the decrease in these nutrients.
Effect of variable surface area, at constant S/V ratio
Under static culture conditions, due to the aerobic nature of K. xy-linus, BNC is produced at the air/liquid interface. As synthesis pro-gresses, the extracellular 3D nanofibrillar pellicle accumulates down-ward into the culture medium, while the metabolically active layerremains at the uppermost interface. In the lower pellicle layer, en-trapped cells become inactive or die due to lack of oxygen. BNC yield isknown to be dependent on the interplay between surface area andvolume of the culture medium and the fermentation time [55]. Previousstudies have examined the ratio of surface area to medium volume,attempting to optimize the BNC yield. In one case [26], an optimalsurface area/volume ratio of 2.2 cm−1 was reported whereas another[20] found that a ratio (S/V) of 0.71 cm−1 gave the highest yield usingthe strain Acetobacter xylinum E25 and 7 days of fermentation. In ad-dition, it was reported [25] that a ratio of 0.39 cm−1 gave the best yieldusing Gluconacetobacter xylinus ATCC 53,524 and 14 d of fermentation.
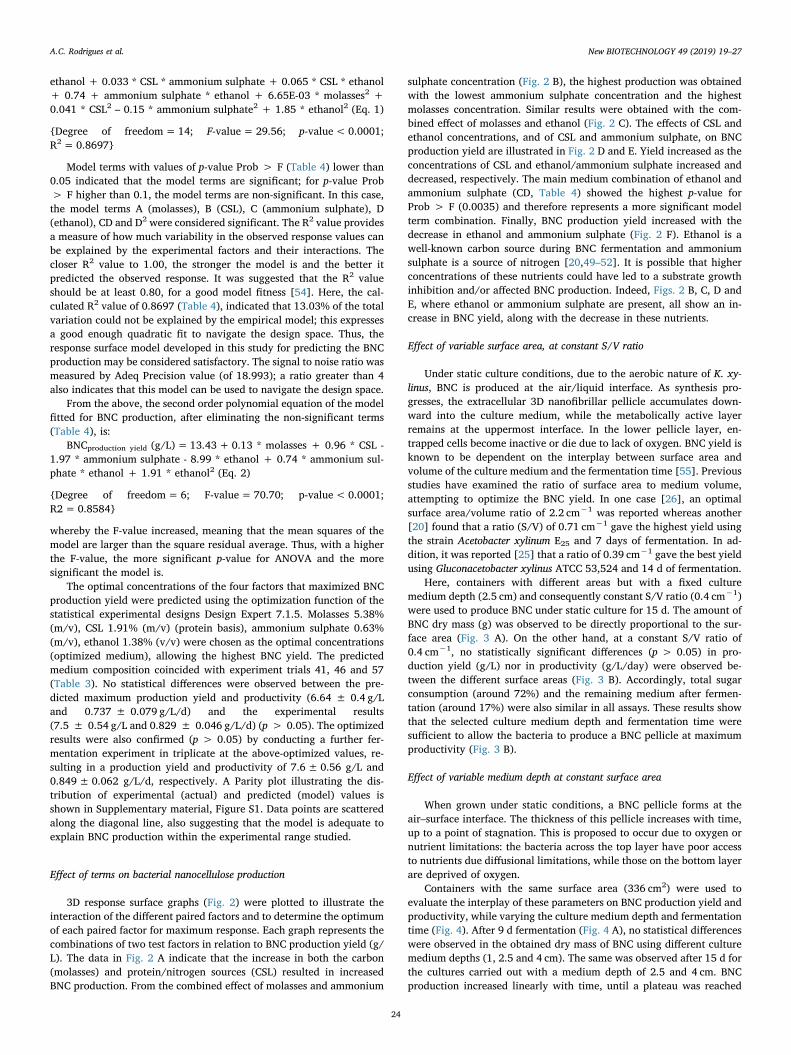
Here, containers with different areas but with a fixed culturemedium depth (2.5 cm) and consequently constant S/V ratio (0.4 cm−1)were used to produce BNC under static culture for 15 d. The amount ofBNC dry mass (g) was observed to be directly proportional to the sur-face area (Fig. 3 A). On the other hand, at a constant S/V ratio of0.4 cm−1, no statistically significant differences (p > 0.05) in pro-duction yield (g/L) nor in productivity (g/L/day) were observed be-tween the different surface areas (Fig. 3 B). Accordingly, total sugarconsumption (around 72%) and the remaining medium after fermen-tation (around 17%) were also similar in all assays. These results showthat the selected culture medium depth and fermentation time weresufficient to allow the bacteria to produce a BNC pellicle at maximumproductivity (Fig. 3 B).
Effect of variable medium depth at constant surface area
When grown under static conditions, a BNC pellicle forms at theair–surface interface. The thickness of this pellicle increases with time,up to a point of stagnation. This is proposed to occur due to oxygen ornutrient limitations: the bacteria across the top layer have poor accessto nutrients due diffusional limitations, while those on the bottom layerare deprived of oxygen.
Containers with the same surface area (336 cm2) were used toevaluate the interplay of these parameters on BNC production yield andproductivity, while varying the culture medium depth and fermentationtime (Fig. 4). After 9 d fermentation (Fig. 4 A), no statistical differenceswere observed in the obtained dry mass of BNC using different culturemedium depths (1, 2.5 and 4 cm). The same was observed after 15 d forthe cultures carried out with a medium depth of 2.5 and 4 cm. BNCproduction increased linearly with time, until a plateau was reached
A.C. Rodrigues et al. New BIOTECHNOLOGY 49 (2019) 19–27
24
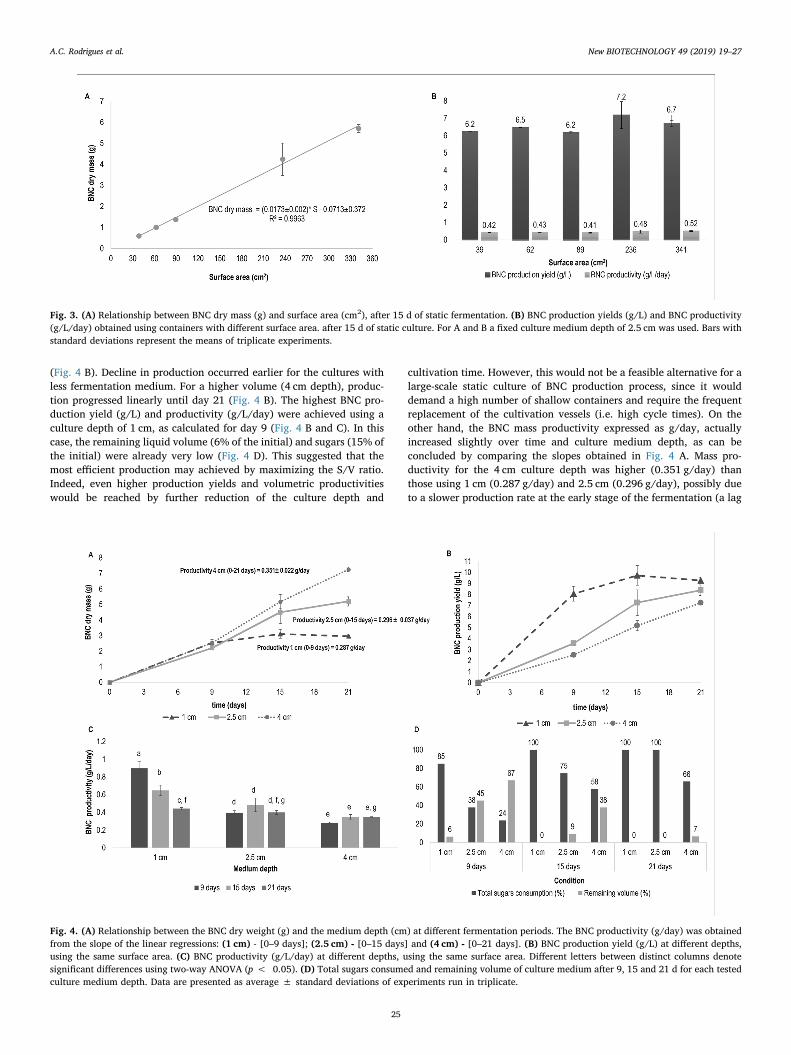
(Fig. 4 B). Decline in production occurred earlier for the cultures withless fermentation medium. For a higher volume (4 cm depth), produc-tion progressed linearly until day 21 (Fig. 4 B). The highest BNC pro-duction yield (g/L) and productivity (g/L/day) were achieved using aculture depth of 1 cm, as calculated for day 9 (Fig. 4 B and C). In thiscase, the remaining liquid volume (6% of the initial) and sugars (15% ofthe initial) were already very low (Fig. 4 D). This suggested that themost efficient production may achieved by maximizing the S/V ratio.Indeed, even higher production yields and volumetric productivitieswould be reached by further reduction of the culture depth and
cultivation time. However, this would not be a feasible alternative for alarge-scale static culture of BNC production process, since it woulddemand a high number of shallow containers and require the frequentreplacement of the cultivation vessels (i.e. high cycle times). On theother hand, the BNC mass productivity expressed as g/day, actuallyincreased slightly over time and culture medium depth, as can beconcluded by comparing the slopes obtained in Fig. 4 A. Mass pro-ductivity for the 4 cm culture depth was higher (0.351 g/day) thanthose using 1 cm (0.287 g/day) and 2.5 cm (0.296 g/day), possibly dueto a slower production rate at the early stage of the fermentation (a lag
Fig. 3. (A) Relationship between BNC dry mass (g) and surface area (cm2), after 15 d of static fermentation. (B) BNC production yields (g/L) and BNC productivity(g/L/day) obtained using containers with different surface area. after 15 d of static culture. For A and B a fixed culture medium depth of 2.5 cm was used. Bars withstandard deviations represent the means of triplicate experiments.
Fig. 4. (A) Relationship between the BNC dry weight (g) and the medium depth (cm) at different fermentation periods. The BNC productivity (g/day) was obtainedfrom the slope of the linear regressions: (1 cm) - [0–9 days]; (2.5 cm) - [0–15 days] and (4 cm) - [0–21 days]. (B) BNC production yield (g/L) at different depths,using the same surface area. (C) BNC productivity (g/L/day) at different depths, using the same surface area. Different letters between distinct columns denotesignificant differences using two-way ANOVA (p < 0.05). (D) Total sugars consumed and remaining volume of culture medium after 9, 15 and 21 d for each testedculture medium depth. Data are presented as average ± standard deviations of experiments run in triplicate.
A.C. Rodrigues et al. New BIOTECHNOLOGY 49 (2019) 19–27
25
phase). This could be explained by a lower cell density at early stages,while as the fermentation progressed, for 1 cm culture depth (lowervolume), nutrients will have been consumed, limiting productivity. It isimportant to recall that, for a fixed surface area, cell density is roughlythe same, regardless of culture media depth, because bacteria grow atthe interface air/liquid. Thus, mass productivity may represent a morerelevant parameter of the performance of the static culture fermenta-tion system than the volumetric productivity.
These results demonstrate that, for a culture medium depth of 4 cm,there were no oxygen or nutrient limitations affecting BNC productionfor up to 21 d, since mass productivity was constant within that timerange. In this case, although significant fraction of sugars were stillavailable (34% of the initial), the residual liquid volume was alreadyvery low (7% of the initial), hence the BNC production was likely todecline thereafter (Fig. 4 D). Furthermore, these results allow one toplan a cost-effective large scale production of BNC, by equating thevolume of fermentation trays and fermentation periods; lower volumeswill have shorter cycling times and higher volumetric productivity, butpossibly higher operating costs (related to trays discharging, refillingwith new fermentation batch and downstream BNC processing),whereas larger volumes may require wider fermentation areas, as thetrays will be stored for longer fermentation times, but larger equipmentwill be required for the downstream processing.
Conclusions
In this study, response surface methodology with central compositedesign was used to optimize the culture medium formulation for K.xylinus BPR 2001, using inexpensive and widely available nutrientsources. Through RSM, the optimum medium composition was % (m/v)molasses 5.38, CSL 1.91 (protein basis), ammonium sulphate 0.63 andethanol 1.38% (v/v). With this composition, after 9 d static culturefermentation, BNC production yield and productivity were of6.4 ± 0.54 g/L and 0.74 ± 0.079 g/L/day, respectively. For 15 dfermentation, at a fixed culture media depth, a direct correlation be-tween the fermentation area and BNC dry mass was observed. Also, at afixed fermentation area, an almost linear BNC productivity of0.32 ± 0.037 g/L/day, could be maintained for up to 21 d, using a4 cm culture medium depth. Moreover, for this experimental set up, nonutrient diffusional limitations were observed, the mass productivitybeing fairly constant overtime.
To date, most studies on BNC production by K. xylinus BPR 2001have used agitated bioreactors and complex culture medium. This workdemonstrates that is possible to obtain high yields in static culture,using low cost substrates and a minimal medium composition. Thisstrain and substrates combination should expectably decrease the costsof BNC production.
Conflict of interest
All authors declare that they have no conflict of interest.
Acknowledgements
The authors would like to acknowledge the Portuguese Foundationfor Science and Technology (FCT) for the financial support of the PhDgrant SFRH/BD/89547/2012 attributed to Ana Cristina Rodrigues, thefinancial support from project SkinChip: Disruptive cellulose-basedmicrofluidic device for 3D skin modelling, PTDC/BBB-BIO/1889/2014.This study was also supported by the Portuguese Foundation for Scienceand Technology (FCT) under the scope of the strategic funding of UID/BIO/04469/2013 unit and COMPETE 2020 (POCI-01-0145-FEDER-006684) and BioTecNorte operation (NORTE-01-0145-FEDER-000004)funded by European Regional Development Fund under the scope ofNORTE 2020 - Programa Operacional Regional do Norte.
The authors acknowledge COPAM Companhia Portuguesa de
Amidos, S.A. (Portugal) and RAR Refinarias de Açúcar Reunidas, S.A.(Portugal) for kindly providing CSL and molasses, respectively.
Appendix A. Supplementary data
Supplementary material related to this article can be found, in theonline version, at doi:https://doi.org/10.1016/j.nbt.2018.12.002.
References
[1] Cleenwerck I, De Wachter M, Gonzalez A, De Vuyst L, De Vos P. Differentiation ofspecies of the family Acetobacteraceae by AFLP DNA fingerprinting: gluconaceto-bacter kombuchae is a later heterotypic synonym of Gluconacetobacter hansenii. IntJ Syst Evol Microbiol 2009;59(7):1771–86. https://doi.org/10.1099/ijs.0.005157-0.
[2] Kersters K, Lisdiyanti P, Komagata K, Swings J. The family acetobacteraceae: thegenera acetobacter, acidomonas, asaia, gluconacetobacter, gluconobacter, and kozakia.3 ed.Dworkin M, Falkow S, Rosenberg E, Schleifer K-H, Stackebrandt E, editors.Prokaryotes, 5. New York: Springer; 2006. p. 163–200.
[3] Matsushita K, Inque T, Theeragool G, Trcek J, Toyama H, Adachi O. Acetic acidproduction in acetic acid bacteria leading to their "death" and survival. In: YamadaM, editor. Survival and death in bacteria. Kerala/India: Research Signpost; 2005. p.169-18.
[4] Sievers M, Family II Swings J, et al. Acetobacteraceae. 2nd ed.Staley JT, editor.Bergey’s manual® of systematic bacteriology, 2C. New York: Springer-Verlag NewYork LLC; 2005. p. 41–94.
[5] Yamada Y, Hoshino K-I, Ishikawa T. Taxonomic studies of acetic acid Bacteria andallied organisms. Part XI. The phylogeny of acetic acid Bacteria Based on the partialsequences of 16S ribosomal RNA: the elevation of the subgenus gluconoacetobacterto the generic level. Biosci Biotechnol Biochem 1997;61(8):1244–51. https://doi.org/10.1271/bbb.61.1244.
[6] Yamada Y, Hosono R, Lisdyanti P, Widyastuti Y, Saono S, et al. Identification ofacetic acid bacteria isolated from Indonesian sources, especially of isolates classifiedin the genus Gluconobacter. J Gen Appl Microbiol 1999;45(1):23–8. https://doi.org/10.2323/jgam.45.23.
[7] Ashori A, Sheykhnazari S, Tabarsa T, Shakeri A, Golalipour M. Bacterial cellulose/silica nanocomposites: preparation and characterization. Carbohydr Polym2012;90(1):413–8. https://doi.org/10.1016/j.carbpol.2012.05.060.
[8] Saibuatong OA, Phisalaphong M. Novo aloe vera-bacterial cellulose composite filmfrom biosynthesis. Carbohydr Polym 2010;79(2):455–60. https://doi.org/10.1016/j.carbpol.2009.08.039.
[9] Andrade FK, Pertile RAN, Dourado F, Gama FM. Bacterial cellulose: properties,production and applications. In: Lejeune A, Deprez T, editors. Cellulose: structureand properties, derivatives and industrial uses. New York: Nova Science PublishersInc; 2010. p. 427–58.
[10] Klemm D, Kramer F, Moritz S, Lindström T, Ankerfors M, et al. Nanocelluloses: anew family of nature-based materials. Angew Chem Int Ed Engl 2011;50:5438–66.https://doi.org/10.1002/anie.201001273.
[11] Czaja WK, Young DJ, Kawecki M, Brown RM. The future prospects of microbialcellulose in biomedical applications. Biomacromolecules 2007;8(1):1–12. https://doi.org/10.1021/bm060620d.
[12] de Azeredo HMC. Antimicrobial nanostructures in food packaging. Trends Food SciTechnol 2013;30:56–69. https://doi.org/10.1016/j.tifs.2012.11.006.
[13] Almeida IF, Pereira T, NHCS Silva, Gomes FP, Silvestre AJD, et al. Costa PC.Bacterial cellulose membranes as drug delivery systems: an in vivo skin compat-ibility study. Eur J Pharm Biopharm 2014;86:332–6. https://doi.org/10.1016/j.ejpb.2013.08.008.
[14] Oliveira Barud HG, Barud H da S, Cavicchioli M, do Amaral TS, de Oliveira JuniorOB, et al. Preparation and characterization of a bacterial cellulose/silk fibroinsponge scaffold for tissue regeneration. Carbohydr Polym 2015;128:41–51. https://doi.org/10.1016/j.carbpol.2015.04.007.
[15] Martínez-Sanz M, Lopez-Rubio A, Villano M, Oliveira CSS, Majone M, et al.Production of bacterial nanobiocomposites of polyhydroxyalkanoates derived fromwaste and bacterial nanocellulose by the electrospinning enabling melt com-pounding method. J Appl Polym Sci 2016:133. https://doi.org/10.1002/app.42486.
[16] Zhou T, Chen D, Jiu J, Nge TT, Sugahara T, et al. Electrically conductive bacterialcellulose composite membranes produced by the incorporation of graphite nano-platelets in pristine bacterial cellulose membranes. J Polym Sci Polym Lett Ed2013;7(9):756–66. https://doi.org/10.3144/expresspolymlett.2013.73.
[17] Esa F, Tasirin SM, Rahman NA. Overview of bacterial cellulose production andapplication. Agric Agric Sci Procedia 2014;2:113–9. https://doi.org/10.1016/j.aaspro.2014.11.017.
[18] Chawla PR, Bajaj IB, Survase SA, Singhal RS. Microbial cellulose: fermentativeproduction and applications. Food Technol Biotechnol 2009;47(2):107–24.
[19] Lee KY, Buldum G, Mantalaris A, Bismarck A. More than meets the eye in bacterialcellulose: biosynthesis, bioprocessing, and applications in advanced fiber compo-sites. Macromol Biosci 2014;4(1):10–32. https://doi.org/10.1002/mabi.201300298.
[20] Krystynowicz A, Czaja W, Wiktorowska-Jezierska A, Gonçalves-Miskiewicz M,Bielecki S. Factors affecting the yield and properties of bacterial cellulose. J IndMicrobiol Biotechnol 2002;29:89–195. https://doi.org/10.1038/sj.jim.7000303.
[21] Keshk SMAS. Bacterial cellulose production and its industrial applications. J
A.C. Rodrigues et al. New BIOTECHNOLOGY 49 (2019) 19–27
26
Bioprocess Biotech 2014;4(02):1–10. https://doi.org/10.4172/2155-9821.1000150.
[22] Shah N, Ul-Islam M, Khattak WA, Park JK. Overview of bacterial cellulose com-posites: a multipurpose advanced material. Carbohydr Polym 2013;98(2):1585–98.https://doi.org/10.1016/j.carbpol.2013.08.018.
[23] Dourado F, Fontão AI, Leal M, Rodrigues AC, Gama M. process modeling andtechno-economic evaluation of an industrial bacterial NanoCellulose fermentationprocess Chapter 12 In: Gama M, Bielecky S, Dourado F, editors. “Bacterial nano-cellulose: from biotechnology to bio-economy”Amsterdam, Netherlands: Elsevier;2016. p. 199–214.
[24] Jonas R, Farah LF. Production and application of microbial cellulose. Polym DegradStab 1998;59:101–6. https://doi.org/10.1016/S0141-3910(97)00197-3.
[25] Ruka D, Simon G, Dean K. Altering the growth conditions of Gluconacetobacterxylinus to maximize the yield of bacterial cellulose. Carbohydr Polym2012;89:613–22. https://doi.org/10.1016/j.carbpol.2012.03.059.
[26] Joris K, Biliet F, Drieghe S, Brack D, Vandamme E. Microbial production of β-1,4-glucans. Meded Fac Landbouwwet-Rijksuniv Gent 1990;55:1563–6.
[27] Toyosaki H, Naritomi T, Akira S, Matsuoka M, Tschuida T, Yoshinaga F. Screeningof bacterial cellulose-producing acetobacter strains suitable for agitated culture.Biosci Biotechnol Biochem 1995;59:1498–502. https://doi.org/10.1271/bbb.59.1498.
[28] Tonouchi N, Tahara N, Tsuchida T, Yoshinaga F, Beppu T, Horinouchi S. Addition ofa small amount of an endoglucanase enhances cellulose production by Acetobacterxylinum. Biosci Biotechnol Biochem 1995;59:805–8. https://doi.org/10.1271/bbb.59.805.
[29] Bae S, Sugano Y, Shoda M. Improvement of bacterial celulose production by ad-dition of agar in a jar fermentor. J Biosci Bioeng 2004;97:33–8. https://doi.org/10.1016/S1389-1723(04)70162-0.
[30] Bae SO, Shoda M. Production of bacterial cellulose by Acetobacter xylinum BPR2001using molasses medium in jar fermentor. Appl Microbiol Biotechnol 2005;67:45–51.https://doi.org/10.1021/bp0498490.
[31] Bae S, Shoda M. Statistical optimization of culture conditions for bacterial celluloseproduction using box-behnken design. Biotechnol Bioeng 2005;90:20–8. https://doi.org/10.1002/bit.20325.
[32] Reinalti I, Hrymak AN, Margaritis A. Kinetics of cell growth and crystalline nano-cellulose production by Komagataeibacter xylinus. Biochem Eng J 2017;127:21–31.https://doi.org/10.1016/j.bej.2017.07.007.
[33] Joseph G, Rowe GE, Margaritis A, Wan W. Effects of polyacrylamide co-acrylic acidon cellulose production by Acetobacter xylinum. J Chem Technol Biotechnol2003;78:964–70. https://doi.org/10.1002/jctb.869.
[34] Cheng K-C, Catchmark JM, Demirci A. Effect of different additives on bacterialcellulose production by acetobacter xylinum and analysis of material property.Cellulose 2009;16:1033–45. https://doi.org/10.1007/s10570-009-9346-5.
[35] Chao Y, Mitarai M, Sugano Y, Shoda M. Effect of addition of water soluble poly-saccharides on bacterial cellulose production in a 50 L airlift reactor. BiotechnolProg 2001;17:781–5. https://doi.org/10.1021/bp010046b.
[36] Chao Y, Ishida T, Sugano Y, Shoda M. Bacterial cellulose production by Acetobacterxylinum in a 50-L internal-loop airlift reactor. Biotechnol Bioeng 2000;68:345–52.https://doi.org/10.1002/(SICI)1097-0290(20000505)68:3<345::AID-BIT13>3.0.CO;2-M.
[37] Chao Y, Sugano Y, Shoda M. Bacterial cellulose production under oxygen-enrichedair at different fructose concentration in a 50-liter, internal-loop airlift reactor. ApplMicrobiol Biotechnol 2001;55:673–9. https://doi.org/10.1007/s002530000503.
[38] Cheng K-C, Catchmark JM, Demirci A. Effects of CMC addition on bacterial cellu-lose production in a biofilm reactor and its paper sheets analysis.Biomacromolecules 2011;12:730–6. https://doi.org/10.1021/bm101363t.
[39] Lin S-P, Liu C-T, Hsu K-D, Hung Y-T, Shih T-Y, Cheng K-C. Production of bacterial
cellulose with various additives in a PCS rotating disk bioreactor and its materialproperty analysis. Cellulose 2016;23:367–77. https://doi.org/10.1007/s10570-015-0855-0.
[40] Bae S, Shoda M. Bacterial cellulose production by fed-batch fermentation in mo-lasses medium. Biotechnol Prog 2004;20:1366–71. https://doi.org/10.1021/bp0498490.
[41] Al-Abdallah W, Dahman Y. Production of green biocellulose nanofibers byGluconacetobacter xylinus through utilizing the renewable resources of agricultureresidues. Bioprocess Biosyst Eng 2013;36:1735–43. https://doi.org/10.1007/s00449-013-0948-9.
[42] Dahman Y, Jayasuriya KE, Kalis M. Potential of biocellulose nanofibers productionfrom agricultural renewable resources: preliminary study. Apply BiochemBiotechnol 2010;162(6):1647–59. https://doi.org/10.1007/s12010-010-8946-8.
[43] Hu Y, Catchmark JM. Influence of 1-methylcyclopropene (1-MCP) on the produc-tion of bacterial cellulose biosynthesized by Acetobacter xylinum under the agitatedculture. Lett Appl Microbiol 2010;51:109–13. https://doi.org/10.1111/j.1472765X.2010.02866.x.
[44] Zeng X, Small DP, Wan W. Statistical optimization of culture conditions for bacterialcellulose production by Acetobacter xylinum BPR 2001 from maple syrup. CarbohydrPolym 2011;85:506–13. https://doi.org/10.1016/j.carbpol.2011.02.034.
[45] Bilgi E, Bayir E, Sendemir-Urkmez A, Hames EE. Optimization Bacterial celluloseproduction Gluconacetobacter xylinus using carob and haricot bean. Int J BiolMacromol 2016;90:2–10. https://doi.org/10.1016/j.ijbiomac.2016.02.052.
[46] Hestrin S, Schramm M. Preparation of freeze-dried cells capable of polymerizingglucose to cellulose. Biochem J 1954;58:345–52. https://doi.org/10.1042/bj0580345.
[47] Premjet S, Premjet D, Ohtani Y. The effect of ingredients of sugar cane molasses onbacterial cellulose production by Acetobacter xylinum ATCC 10245. Sen-i Gakkaishi2007;63:193–9. https://doi.org/10.2115/fiber.63.193.
[48] Noro N, Sugano Y, Shoda M. Utilization of the buffering capacity of corn steepliquor in bacterial cellulose production by Acetobacter xylinum. Appl MicrobiolBiotechnol 2004;64:199–205. https://doi.org/10.1007/s00253-003-1457-6.
[49] Naromiti T, Kouda T, Yano H, Yoshinaga F. Effect of ethanol on bacterial celluloseproduction in continuous culture from fructose. J Ferment Bioeng1998;85:598–603. https://doi.org/10.1016/S0922-338X(98)80012-3.
[50] Son HJ, Heo MS, Kim YG, Lee SJ. Optimization of fermentation conditions for theproduction of bacterial cellulose by a newly isolated Acetobacter sp. A9 in shakingcultures. Biotechnol Appl Biochem 2001;33:1–5. https://doi.org/10.1042/BA20000065.
[51] Park JK, Jung JY, Park YH. Cellulose production by Gluconacetobacter hansenii in amedium containing ethanol. Biotechnol Lett 2003;25:2055–9. https://doi.org/10.1023/B:BILE.0000007065.63682.18.
[52] Dourado F, Ryngaillo M, Jedrzejczak-Krzeptowska M, Bielecki S, Gama M. Chapter1 - Taxonomic Review and Microbial Ecology. in Bacterial NanocelluloseFermentation. In: Gama M, Bielecky S, Dourado F, editors. “Bacterial nanocellulose:from biotechnology to bio-economy”. Amsterdam, Netherlands: Elsevier; 2016. p.1–17.
[53] Dourado F, Fontão AI, Leal M, Rodrigues AC, Gama M. Process modelling andtechno-economic evaluation of an industrial air-lift bacterial cellulose fermentationprocess Chapter 1 In: Lee Koon-Yang, editor. nanocellulose and sustainability:production, properties, applications, and case studiesUSA: CRC Press; 2018. p.1–13.
[54] Joglekar AM, May AT. Product excellence through design of experiments. CerealFood World 1987;32:857–68.
[55] Borzani W, Desouza SJ. Mechanism of the film thickness increasing during thebacterial production of cellulose on non-agitated liquid-media. Biotechnol Lett1995;17:1271–2. https://doi.org/10.1007/BF00128400.
A.C. Rodrigues et al. New BIOTECHNOLOGY 49 (2019) 19–27
27