restaurants jollibee foods corporation (jfc.ps
TRANSCRIPT

DISCLOSURE APPENDIX AT THE BACK OF THIS REPORT CONTAINS IMPORTANT DISCLOSURES, ANALYST CERTIFICATIONS, LEGAL ENTITY DISCLOSURE AND THE STATUS OF NON-US ANALYSTS. US Disclosure: Credit Suisse does and seeks to do business with companies covered in its research reports. As a result, investors should be aware that the Firm may have a conflict of interest that could affect the objectivity of this report. Investors should consider this report as only a single factor in making their investment decision.
27 September 2016 Asia Pacific/Philippines
Equity Research Restaurants
Jollibee Foods Corporation (JFC.PS /
JFC PM) Rating OUTPERFORM Price (26 Sep 16, P) 249.80 Target price (P) (from 262.30) 296.00 Upside/downside (%) 18.5 Mkt cap (P/US$ mn) 267,210 / 5,537 Enterprise value (P mn) 264,327 Number of shares (mn) 1,070 Free float (%) 40.6 52-wk price range (P) 260-188 ADTO-6M (US$ mn) 3.5 *Stock ratings are relative to the relevant country benchmark.
¹Target price is for 12 months.
Research Analysts
Sofia Cabral
63 2 858 7757
Arnab Mitra
91 22 6777 3806
INCREASE TARGET PRICE
Bouncing back stronger than ever
■ Turning things around and set for new heights. We believe JFC is set to
sustain a recovery in returns moving into 2017-18E. Our base case now
forecasts JFC to deliver a 2017-18E average ROIC of 21.6%, a clear
turnaround from 2015's ROIC of 14.5%. Despite adjusting EPS forecasts
downward by 4% on average, we still see EPS growth accelerating to 16.5%
p.a. in 2017-18E.
■ The two-pronged approach paves the way for domestic growth. We
think JFC's ability to grow lies in its domestic operations, on the back of
stable demand and continued store expansion. We expect its domestic
growth to be led by the company's two-pronged approach: (1) its ability to
expand its business in a value-accretive manner, and (2) the implementation
of a proactive pricing approach to inventory management. We expect
domestic contribution to revenue to expand to 80% by 2018E versus the 78%
seen in 2015A.
■ International ventures add upside risk. Our current base case has not built
in a turnaround in its international ventures. However, as management has
begun to identify areas of improvement, we believe positive development in
these businesses could help improve international store productivity and
bolster overall bottomline. We forecast international revenue growth of 9.7%
p.a. over 2016-18E vs 13.2% p.a. over 2013-15A.
■ Premium for a reason, reiterate OUTPERFORM. JFC is currently trading at
a 41x P/E, above the global sector average for restaurants of 32x P/E. We
expect consensus revisions to turn around into 2H16 as our 2017-18E
forecasts are higher than consensus by 2.7%. Our 12-month TP of
P296.0/share, implying an 18% potential upside, is based on a 41x target
forward P/E multiple applied to 2017E EPS. This is based on a valuation
framework that looks at P/E based on returns first, and then earnings growth.
Key risks include macroeconomy, commodity prices and execution risks.
Share price performance
The price relative chart measures performance against the
THE PHILIPPINE STOCK EXC PSEI INDEX which closed
at 7,632.46 on 26/09/16. On 26/09/16 the spot exchange
rate was P48.26/US$1
Performance 1M 3M 12M Absolute (%) -1.3 6.3 33.6 Relative (%) 1.5 6.7 23.2
Financial and valuation metrics
Year 12/15A 12/16E 12/17E 12/18E Revenue (P mn) 100,779.7 115,680.3 131,426.2 149,342.5 EBITDA (P mn) 8,780.7 11,626.8 13,787.1 15,849.4 EBIT (P mn) 5,355.0 7,559.8 9,170.0 10,571.3 Net profit (P mn) 5,901.2 6,627.7 7,887.2 8,983.8 EPS (CS adj.) (P) 5.42 6.07 7.22 8.22 Change from previous EPS (%) n.a. (5.2) (3.5) (3.2) Consensus EPS (P) n.a. 6.04 6.90 8.16 EPS growth (%) 9.4 11.9 19.0 13.9 P/E (x) 46.1 41.2 34.6 30.4 Dividend yield (%) 0.7 0.8 1.0 1.1 EV/EBITDA (x) 30.3 22.7 19.0 16.4 P/B (x) 8.45 7.39 6.41 5.57 ROE (%) 19.8 19.5 20.2 20.0 Net debt/equity (%) Net Cash Net Cash Net Cash Net Cash
Source: Company data, Thomson Reuters, Credit Suisse estimates
27 September 2016
Jollibee Foods Corporation (JFC.PS / JFC PM) 2
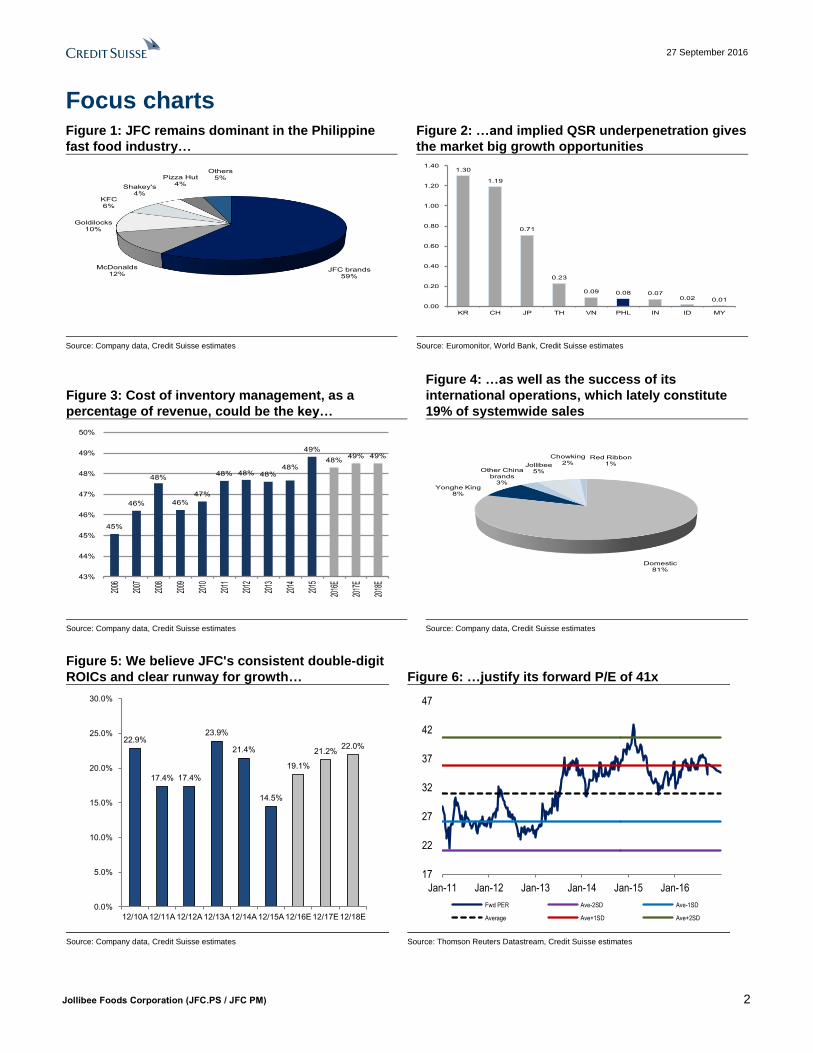
Focus charts Figure 1: JFC remains dominant in the Philippine
fast food industry…
Figure 2: …and implied QSR underpenetration gives
the market big growth opportunities
Source: Company data, Credit Suisse estimates Source: Euromonitor, World Bank, Credit Suisse estimates
Figure 3: Cost of inventory management, as a
percentage of revenue, could be the key…
Figure 4: …as well as the success of its
international operations, which lately constitute
19% of systemwide sales
Source: Company data, Credit Suisse estimates Source: Company data, Credit Suisse estimates
Figure 5: We believe JFC's consistent double-digit
ROICs and clear runway for growth… Figure 6: …justify its forward P/E of 41x
Source: Company data, Credit Suisse estimates Source: Thomson Reuters Datastream, Credit Suisse estimates
JFC brands59%
McDonalds12%
Goldilocks10%
KFC6%
Shakey's4%
Pizza Hut4%
Others5%
1.30
1.19
0.71
0.23
0.09 0.08 0.070.02 0.01
0.00
0.20
0.40
0.60
0.80
1.00
1.20
1.40
KR CH JP TH VN PHL IN ID MY
45%
46%
48%
46%
47%
48% 48% 48%48%
49%
48%49% 49%
43%
44%
45%
46%
47%
48%
49%
50%
2006
2007
2008
2009
2010
2011
2012
2013
2014
2015
2016
E
2017
E
2018
E
Domestic 81%
Yonghe King8%
Other China brands
3%
Jollibee 5%
Chowking 2%
Red Ribbon 1%
22.9%
17.4% 17.4%
23.9%
21.4%
14.5%
19.1%
21.2%22.0%
0.0%
5.0%
10.0%
15.0%
20.0%
25.0%
30.0%
12/10A 12/11A 12/12A 12/13A 12/14A 12/15A 12/16E 12/17E 12/18E
17
22
27
32
37
42
47
Jan-11 Jan-12 Jan-13 Jan-14 Jan-15 Jan-16
Fwd PER Ave-2SD Ave-1SD
Average Ave+1SD Ave+2SD

27 September 2016
Jollibee Foods Corporation (JFC.PS / JFC PM) 3
Bouncing back stronger than ever JFC is turning around from its slip last year and, more importantly, its re-energised “two-
pronged” approach is set to deliver sustainable growth into FY17-18E. In our view, there's
potential not just for the company to recover from the previous year's cost side issues, but
to effectively expand its existing asset base and continue to deliver escalating returns in
the future.
Turning things around and set for new heights
We believe JFC is set to sustain a recovery in returns moving into 2017-18E. Our base
case now forecasts JFC to deliver a 2017-18E average ROIC of 21.6%, a clear turnaround
from 2015's ROIC of 14.5%. We believe that JFC's ability to continuously grow lies in a
two-pronged approach, namely, (1) its ability to expand its business domestically in a
value-accretive manner; and (2) the implementation of a proactive approach to inventory
management. Playing domestic defense. The bulk of JFC's business lies in its Philippine
operations which, as of 1H16, contributed roughly 80% to its revenue. In our view,
domestic operations will continue to drive the company's business on the back of
unabated domestic demand and implied QSR underpenetration compared to peers. A
more proactive approach to inventory management. Along with its expansion efforts, a
strategic pricing approach, which the company has committed to implementing proactively,
could work to offset unexpected increases in raw material prices and allow the company
room for GP margin expansion. We believe management will be able to bring down cost of
inventories as a percentage of revenue to 48.4%, on average, over 2016-18E from the
48.8% seen in 2015. Resultantly, we see GPM expanding to 22.1%, on average, from
2016-18E versus GPM of 21.5% reported, on average, over the past five years.
International ventures add upside risk
Our current base case has not built in a turnaround in its international ventures,
particularly its brand Yonghe King (8% of systemwide sales) and its recent acquisition of
Smashburger. However, as management has recently begun to identify areas of
improvement, we believe positive development in these businesses could provide possible
upside risk to earnings estimates. For 2016-18E, we see steady international revenue
growth of approximately 9.7% p.a., on average. This compares with the 13.2% p.a., on
average, international revenue growth recorded over 2013-15A.
Premium for a reason
JFC currently trades at a 41x P/E, above the global sector average for restaurants of 32x
P/E, which we justify based on JFC's clear medium-term growth story and its ability to
deliver escalating returns. Our 2017-18E EPS forecasts are 2.7% higher than consensus
on average. With a visible turnaround in FY16E and as both topline growth and margin
expansion gather pace into FY17-18E, we expect the stock to re-rate further.
Target P/E based TP of P296.0. We utilise a stylised model created by our Global
Financial Strategies team to guide our target P/E multiple. The model looks at P/Es, given
different scenarios for ROIC and earnings growth. Based on an average ROIC of 21.6%
from 2017-18E and EPS growth of 16.5% p.a. over the same period, we set a target P/E of
41x. Applying this to our 2017E EPS forecast of P7.22 yields a target price of P296.0.
Key risks: (i) a significant change in the macroeconomic environment which could
dampen consumer sentiment and impact earnings; (ii) commodity price volatility; and (iii)
execution risks related to its domestic and international expansion.
27 September 2016
Jollibee Foods Corporation (JFC.PS / JFC PM) 4
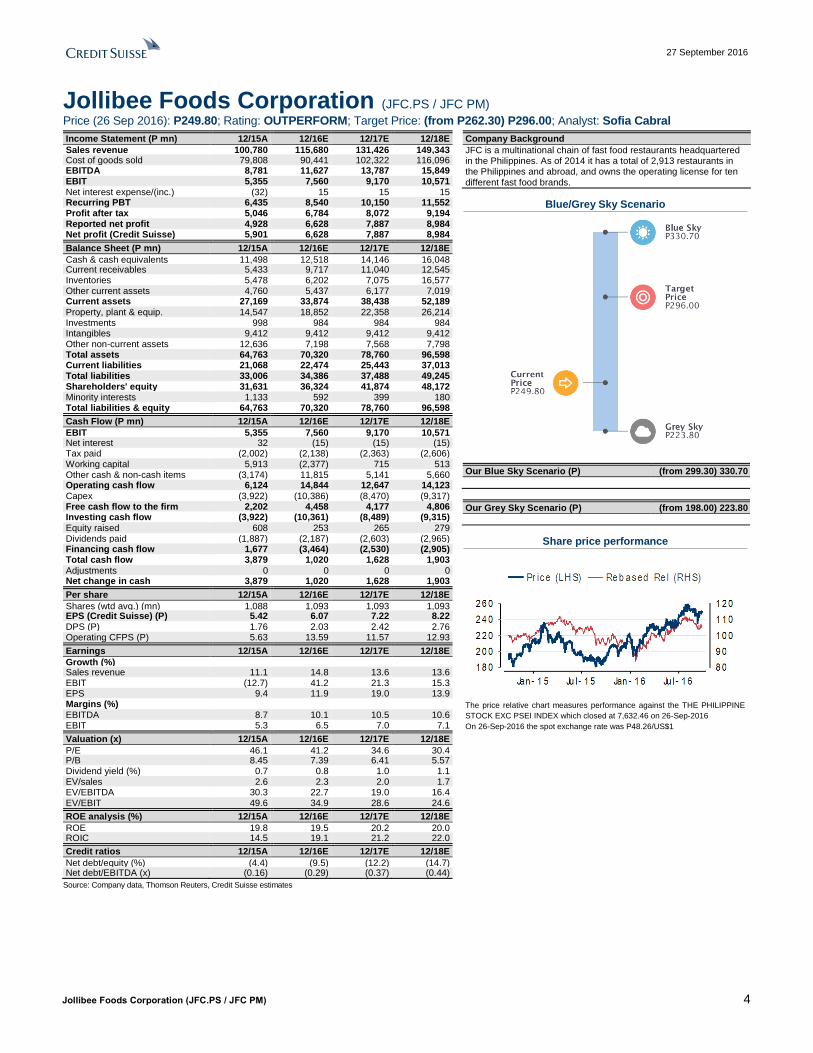
Jollibee Foods Corporation (JFC.PS / JFC PM)
Price (26 Sep 2016): P249.80; Rating: OUTPERFORM; Target Price: (from P262.30) P296.00; Analyst: Sofia Cabral
Income Statement (P mn) 12/15A 12/16E 12/17E 12/18E
Sales revenue 100,780 115,680 131,426 149,343 Cost of goods sold 79,808 90,441 102,322 116,096 EBITDA 8,781 11,627 13,787 15,849 EBIT 5,355 7,560 9,170 10,571 Net interest expense/(inc.) (32) 15 15 15 Recurring PBT 6,435 8,540 10,150 11,552 Profit after tax 5,046 6,784 8,072 9,194 Reported net profit 4,928 6,628 7,887 8,984 Net profit (Credit Suisse) 5,901 6,628 7,887 8,984
Balance Sheet (P mn) 12/15A 12/16E 12/17E 12/18E
Cash & cash equivalents 11,498 12,518 14,146 16,048 Current receivables 5,433 9,717 11,040 12,545 Inventories 5,478 6,202 7,075 16,577 Other current assets 4,760 5,437 6,177 7,019 Current assets 27,169 33,874 38,438 52,189 Property, plant & equip. 14,547 18,852 22,358 26,214 Investments 998 984 984 984 Intangibles 9,412 9,412 9,412 9,412 Other non-current assets 12,636 7,198 7,568 7,798 Total assets 64,763 70,320 78,760 96,598 Current liabilities 21,068 22,474 25,443 37,013 Total liabilities 33,006 34,386 37,488 49,245 Shareholders' equity 31,631 36,324 41,874 48,172 Minority interests 1,133 592 399 180 Total liabilities & equity 64,763 70,320 78,760 96,598
Cash Flow (P mn) 12/15A 12/16E 12/17E 12/18E
EBIT 5,355 7,560 9,170 10,571 Net interest 32 (15) (15) (15) Tax paid (2,002) (2,138) (2,363) (2,606) Working capital 5,913 (2,377) 715 513 Other cash & non-cash items (3,174) 11,815 5,141 5,660 Operating cash flow 6,124 14,844 12,647 14,123 Capex (3,922) (10,386) (8,470) (9,317) Free cash flow to the firm 2,202 4,458 4,177 4,806 Investing cash flow (3,922) (10,361) (8,489) (9,315) Equity raised 608 253 265 279 Dividends paid (1,887) (2,187) (2,603) (2,965) Financing cash flow 1,677 (3,464) (2,530) (2,905) Total cash flow 3,879 1,020 1,628 1,903 Adjustments 0 0 0 0 Net change in cash 3,879 1,020 1,628 1,903
Per share 12/15A 12/16E 12/17E 12/18E
Shares (wtd avg.) (mn) 1,088 1,093 1,093 1,093 EPS (Credit Suisse) (P) 5.42 6.07 7.22 8.22 DPS (P) 1.76 2.03 2.42 2.76 Operating CFPS (P) 5.63 13.59 11.57 12.93
Earnings 12/15A 12/16E 12/17E 12/18E
Growth (%) Sales revenue 11.1 14.8 13.6 13.6 EBIT (12.7) 41.2 21.3 15.3 EPS 9.4 11.9 19.0 13.9 Margins (%) EBITDA 8.7 10.1 10.5 10.6 EBIT 5.3 6.5 7.0 7.1
Valuation (x) 12/15A 12/16E 12/17E 12/18E
P/E 46.1 41.2 34.6 30.4 P/B 8.45 7.39 6.41 5.57 Dividend yield (%) 0.7 0.8 1.0 1.1 EV/sales 2.6 2.3 2.0 1.7 EV/EBITDA 30.3 22.7 19.0 16.4 EV/EBIT 49.6 34.9 28.6 24.6
ROE analysis (%) 12/15A 12/16E 12/17E 12/18E
ROE 19.8 19.5 20.2 20.0 ROIC 14.5 19.1 21.2 22.0
Credit ratios 12/15A 12/16E 12/17E 12/18E
Net debt/equity (%) (4.4) (9.5) (12.2) (14.7) Net debt/EBITDA (x) (0.16) (0.29) (0.37) (0.44)
Company Background
JFC is a multinational chain of fast food restaurants headquartered in the Philippines. As of 2014 it has a total of 2,913 restaurants in the Philippines and abroad, and owns the operating license for ten different fast food brands.
Blue/Grey Sky Scenario
Our Blue Sky Scenario (P) (from 299.30) 330.70
Our Grey Sky Scenario (P) (from 198.00) 223.80
Share price performance
The price relative chart measures performance against the THE PHILIPPINE
STOCK EXC PSEI INDEX which closed at 7,632.46 on 26-Sep-2016
On 26-Sep-2016 the spot exchange rate was P48.26/US$1
Source: Company data, Thomson Reuters, Credit Suisse estimates

27 September 2016
Jollibee Foods Corporation (JFC.PS / JFC PM) 5
Turning things around and set for new heights We believe JFC is set to deliver a 2017-18E average ROIC of 21.6%, a clear turnaround
from 2015's ROIC of 14.5%. Contraction in 2015 average ROIC was due to one-time costs
related to its Smashburger acquisition and IT-related expenses. Overall GP margins were
also affected by domestic cost side issues beginning as early as 2014 related to port
congestion and a significant increase in raw material prices, particularly beef. In light of
this, we believe that the foregoing was one time occurrences and 2015 can serve as a
learned lesson for a stronger and better JFC as well as a springboard for, not only steady,
but sustainable growth moving forward.
In our view, JFC's ability to continuously grow lies in a two-pronged approach: (1) its ability
to expand and make value-accretive ventures domestically, and (2) the implementation of
a proactive approach to inventory management.
First engine: Playing domestic defense
JFC has a distinguished home court advantage
JFC continues to dominate its home court through its efficient and effective store rollout
over the years as, according to 1H16 company data, JFC outlets constituted 59% of the
Philippines' total store network (Figure 7). Additionally, according to Euromonitor, as of
2015 it constituted 56% of the Philippine fast food industry in terms of value. JFC's
dominance in the Philippines fast food market can further be underscored by its
comparison with other international markets. According to Euromonitor, in 2015, China's
top QSR player, Yum! Brands Inc., accounted for 4% of the Chinese fast food market in
terms of value while, in the US, the top player McDonald's constituted 16% of the total fast
food market over the same period of time. The bulk of JFC's business lies in its Philippine
operations which, as of 1H16, contributed roughly 80% to net sales. In our view, JFC's
domestic operations will continue to drive growth moving forward as the current
environment presents an array of available expansion opportunities for the market, such
as the industry's implied QSR underpenetration relative to peers (Figure 8).
Figure 7: Phils store network market share—2015 Figure 8: QSR outlets per capita ('000s)
Source: Company data, Credit Suisse estimates Source: Euromonitor, World Bank, Credit Suisse estimates
We note that the Philippines still holds one of the lowest QSR penetration rates in the
region, which we have measured by QSR outlets per 1000 persons. According to
Euromonitor, the average number of QSR outlets per person in the region was measured
at approximately 0.41, with the Philippines coming in at 0.08. The company has also
JFC brands59%
McDonalds12%
Goldilocks10%
KFC6%
Shakey's4%
Pizza Hut4%
Others5%
1.30
1.19
0.71
0.23
0.09 0.08 0.070.02 0.01
0.00
0.20
0.40
0.60
0.80
1.00
1.20
1.40
KR CH JP TH VN PHL IN ID MY
27 September 2016
Jollibee Foods Corporation (JFC.PS / JFC PM) 6
stated that JFC's penetration rate of Philippine cities, measured as the percentage of
areas in the country where JFC has store presence in, is approximated at 80%. In
municipalities, JFC store penetration rate is approximated at 8%, suggesting further room
for growth in these kinds of areas.
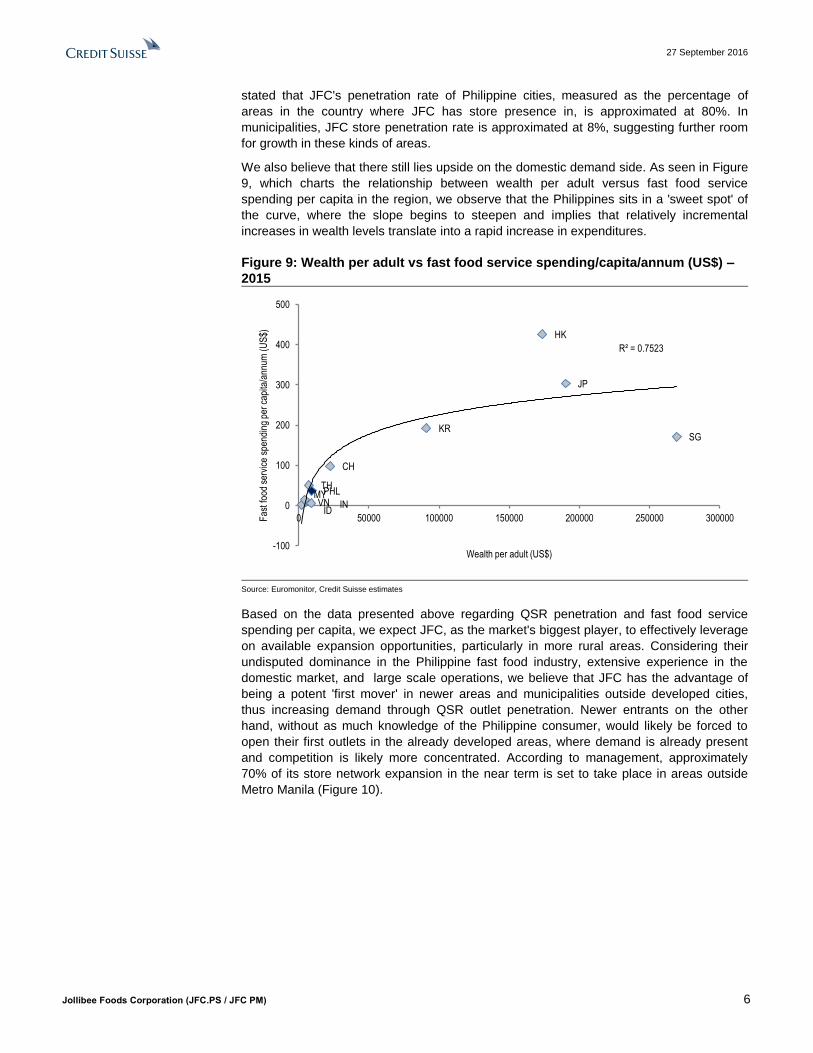
We also believe that there still lies upside on the domestic demand side. As seen in Figure
9, which charts the relationship between wealth per adult versus fast food service
spending per capita in the region, we observe that the Philippines sits in a 'sweet spot' of
the curve, where the slope begins to steepen and implies that relatively incremental
increases in wealth levels translate into a rapid increase in expenditures.
Figure 9: Wealth per adult vs fast food service spending/capita/annum (US$) –
2015
Source: Euromonitor, Credit Suisse estimates
Based on the data presented above regarding QSR penetration and fast food service
spending per capita, we expect JFC, as the market's biggest player, to effectively leverage
on available expansion opportunities, particularly in more rural areas. Considering their
undisputed dominance in the Philippine fast food industry, extensive experience in the
domestic market, and large scale operations, we believe that JFC has the advantage of
being a potent 'first mover' in newer areas and municipalities outside developed cities,
thus increasing demand through QSR outlet penetration. Newer entrants on the other
hand, without as much knowledge of the Philippine consumer, would likely be forced to
open their first outlets in the already developed areas, where demand is already present
and competition is likely more concentrated. According to management, approximately
70% of its store network expansion in the near term is set to take place in areas outside
Metro Manila (Figure 10).
VN
TH
KRSG
PHLMY
JP
IDIN
HK
CH
R² = 0.7523
-100
0
100
200
300
400
500
0 50000 100000 150000 200000 250000 300000Fas
t foo
d se
rvic
e sp
endi
ng p
er c
apita
/ann
um (
US
$)
Wealth per adult (US$)
27 September 2016
Jollibee Foods Corporation (JFC.PS / JFC PM) 7
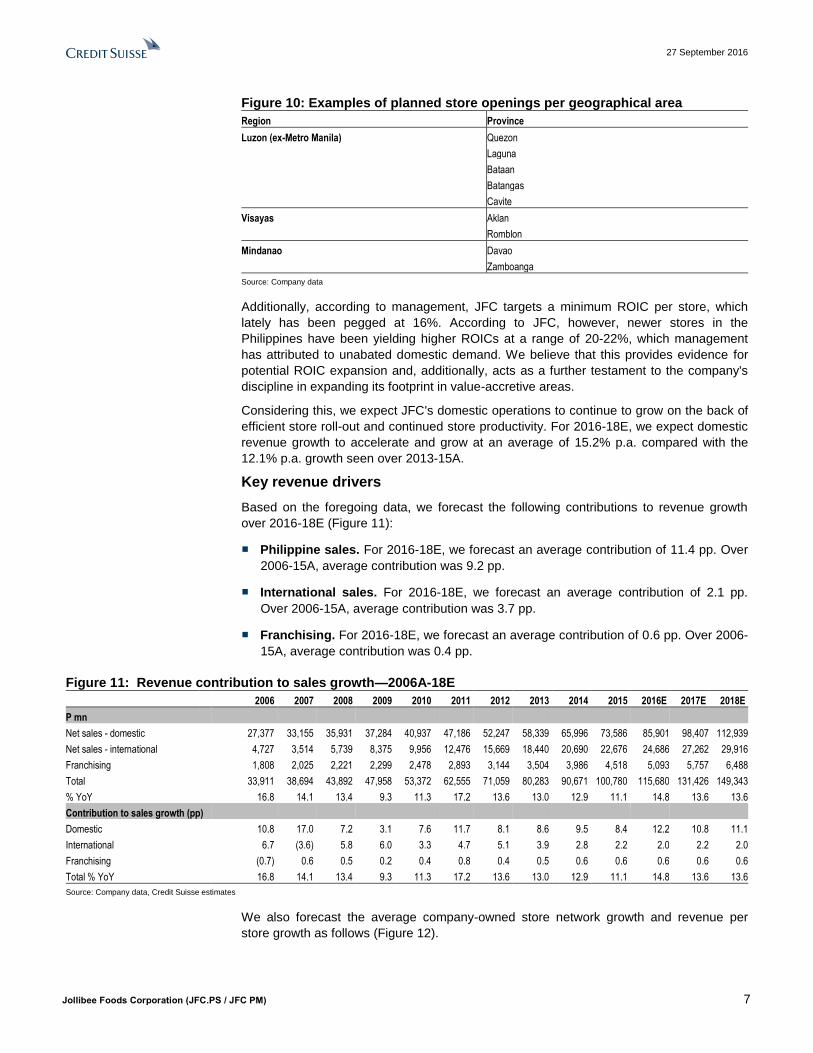
Figure 10: Examples of planned store openings per geographical area
Region Province
Luzon (ex-Metro Manila) Quezon
Laguna
Bataan
Batangas
Cavite
Visayas Aklan
Romblon
Mindanao Davao
Zamboanga
Source: Company data
Additionally, according to management, JFC targets a minimum ROIC per store, which
lately has been pegged at 16%. According to JFC, however, newer stores in the
Philippines have been yielding higher ROICs at a range of 20-22%, which management
has attributed to unabated domestic demand. We believe that this provides evidence for
potential ROIC expansion and, additionally, acts as a further testament to the company's
discipline in expanding its footprint in value-accretive areas.
Considering this, we expect JFC's domestic operations to continue to grow on the back of
efficient store roll-out and continued store productivity. For 2016-18E, we expect domestic
revenue growth to accelerate and grow at an average of 15.2% p.a. compared with the
12.1% p.a. growth seen over 2013-15A.
Key revenue drivers
Based on the foregoing data, we forecast the following contributions to revenue growth
over 2016-18E (Figure 11):
■ Philippine sales. For 2016-18E, we forecast an average contribution of 11.4 pp. Over
2006-15A, average contribution was 9.2 pp.
■ International sales. For 2016-18E, we forecast an average contribution of 2.1 pp.
Over 2006-15A, average contribution was 3.7 pp.
■ Franchising. For 2016-18E, we forecast an average contribution of 0.6 pp. Over 2006-
15A, average contribution was 0.4 pp.
Figure 11: Revenue contribution to sales growth—2006A-18E
2006 2007 2008 2009 2010 2011 2012 2013 2014 2015 2016E 2017E 2018E
P mn
Net sales - domestic 27,377 33,155 35,931 37,284 40,937 47,186 52,247 58,339 65,996 73,586 85,901 98,407 112,939
Net sales - international 4,727 3,514 5,739 8,375 9,956 12,476 15,669 18,440 20,690 22,676 24,686 27,262 29,916
Franchising 1,808 2,025 2,221 2,299 2,478 2,893 3,144 3,504 3,986 4,518 5,093 5,757 6,488
Total 33,911 38,694 43,892 47,958 53,372 62,555 71,059 80,283 90,671 100,780 115,680 131,426 149,343
% YoY 16.8 14.1 13.4 9.3 11.3 17.2 13.6 13.0 12.9 11.1 14.8 13.6 13.6
Contribution to sales growth (pp)
Domestic 10.8 17.0 7.2 3.1 7.6 11.7 8.1 8.6 9.5 8.4 12.2 10.8 11.1
International 6.7 (3.6) 5.8 6.0 3.3 4.7 5.1 3.9 2.8 2.2 2.0 2.2 2.0
Franchising (0.7) 0.6 0.5 0.2 0.4 0.8 0.4 0.5 0.6 0.6 0.6 0.6 0.6
Total % YoY 16.8 14.1 13.4 9.3 11.3 17.2 13.6 13.0 12.9 11.1 14.8 13.6 13.6
Source: Company data, Credit Suisse estimates
We also forecast the average company-owned store network growth and revenue per
store growth as follows (Figure 12).

27 September 2016
Jollibee Foods Corporation (JFC.PS / JFC PM) 8
Figure 12: Revenue per store and avg. store network growth—2006A-18E
2006 2007 2008 2009 2010 2011 2012 2013 2014 2015 2016E 2017E 2018E
Philippines
Average co-owned stores %YoY 18.9% 8.0% 5.6% 3.1% 4.8% 4.5% 4.5% 5.8% 7.0% 10.5% 10.1% 8.1% 8.3%
Revenue per store %YoY -5.0% 12.1% 2.6% 0.7% 4.7% 10.2% 6.0% 5.5% 5.8% 0.9% 6.0% 6.0% 6.0%
International
Average co-owned stores %YoY 19.2% 7.3% 31.5% 31.5% 18.9% 20.6% 19.1% 11.4% 4.0% 2.4% 3.2% 4.6% 4.5%
Revenue per store %YoY 43.1% -30.7% 24.2% 10.9% 0.0% 3.9% 5.5% 5.7% 7.9% 7.0% 5.5% 5.5% 5.0%
Source: Company data, Credit Suisse estimates
Second engine: A more proactive approach to
inventory management
Management looking to neutralise input cost surprises
Management is now implementing an updated pricing policy that we believe could stand to
neutralise input costs. Up until 2013, management was mostly applying incremental price
hikes of less than 1%, at least twice or thrice a year, for its domestic brands. This proved
inadequate in 2014, however, as raw material prices rose at an unprecedented pace. In
4Q14, management was eventually required to implement a 4% YoY price hike with
disastrous results to topline, the effect of which trickled into 2015.
We believe management has since learned an invaluable lesson in terms of the
importance of proactive pricing, which is reiterated now more than ever as the company
acknowledges the risk of a rise in raw material costs in 2H16 or 2017. Its updated pricing
approach of more frequent, 1% price hikes (done every three or four months across more
of its brands) while input costs are still stable could effectively solve the problem of
potential cost surprises before they occur, without the consumer feeling the impact of a
material one-time price adjustment.
Cost of inventories the biggest cost component
A sizable portion of JFC's cost of sales is dedicated to its cost of inventories. Cost of
inventories as a percentage of total revenue was measured at an average of 47.9% over
2011-15A (Figure 13). Note that, within cost of inventories, raw materials constitute
roughly 20-25% of revenue, and imported beef constitutes the bulk of this.
We forecast the new pricing strategy can help bring down cost of inventories as a
percentage of revenue to 48.4%, on average, for 2016-18E from the 48.8% hike seen in
2015.
27 September 2016
Jollibee Foods Corporation (JFC.PS / JFC PM) 9
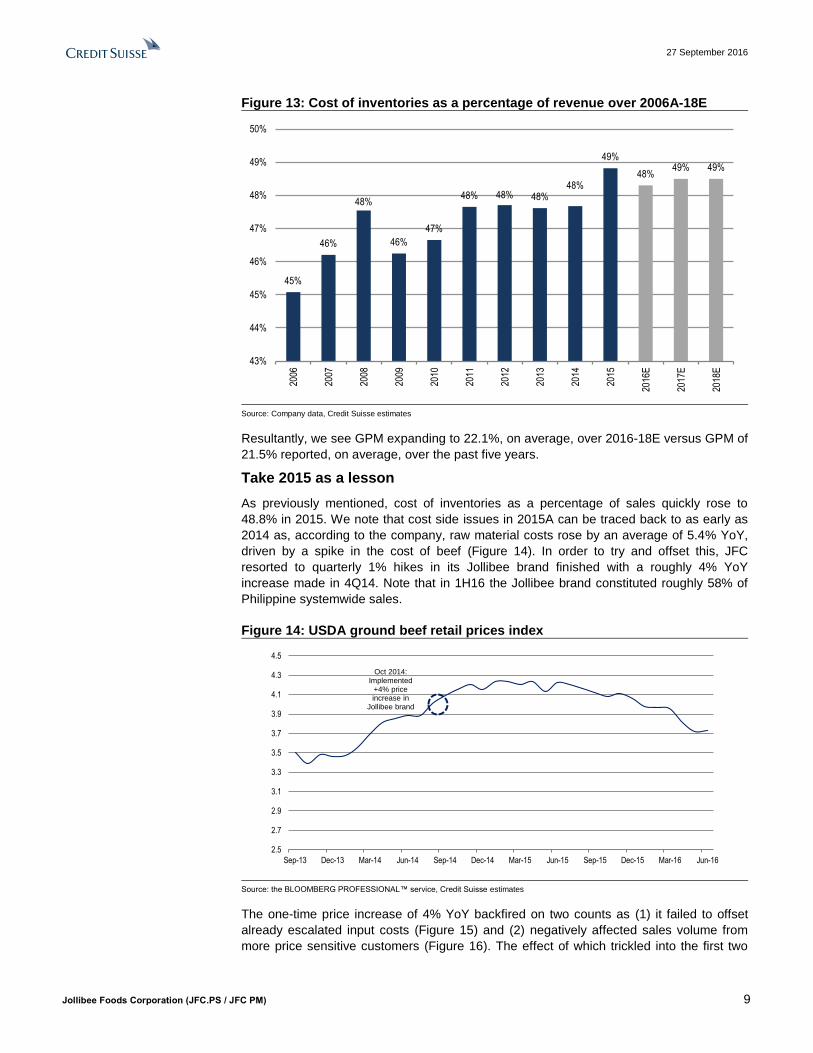
Figure 13: Cost of inventories as a percentage of revenue over 2006A-18E
Source: Company data, Credit Suisse estimates
Resultantly, we see GPM expanding to 22.1%, on average, over 2016-18E versus GPM of
21.5% reported, on average, over the past five years.
Take 2015 as a lesson
As previously mentioned, cost of inventories as a percentage of sales quickly rose to
48.8% in 2015. We note that cost side issues in 2015A can be traced back to as early as
2014 as, according to the company, raw material costs rose by an average of 5.4% YoY,
driven by a spike in the cost of beef (Figure 14). In order to try and offset this, JFC
resorted to quarterly 1% hikes in its Jollibee brand finished with a roughly 4% YoY
increase made in 4Q14. Note that in 1H16 the Jollibee brand constituted roughly 58% of
Philippine systemwide sales.
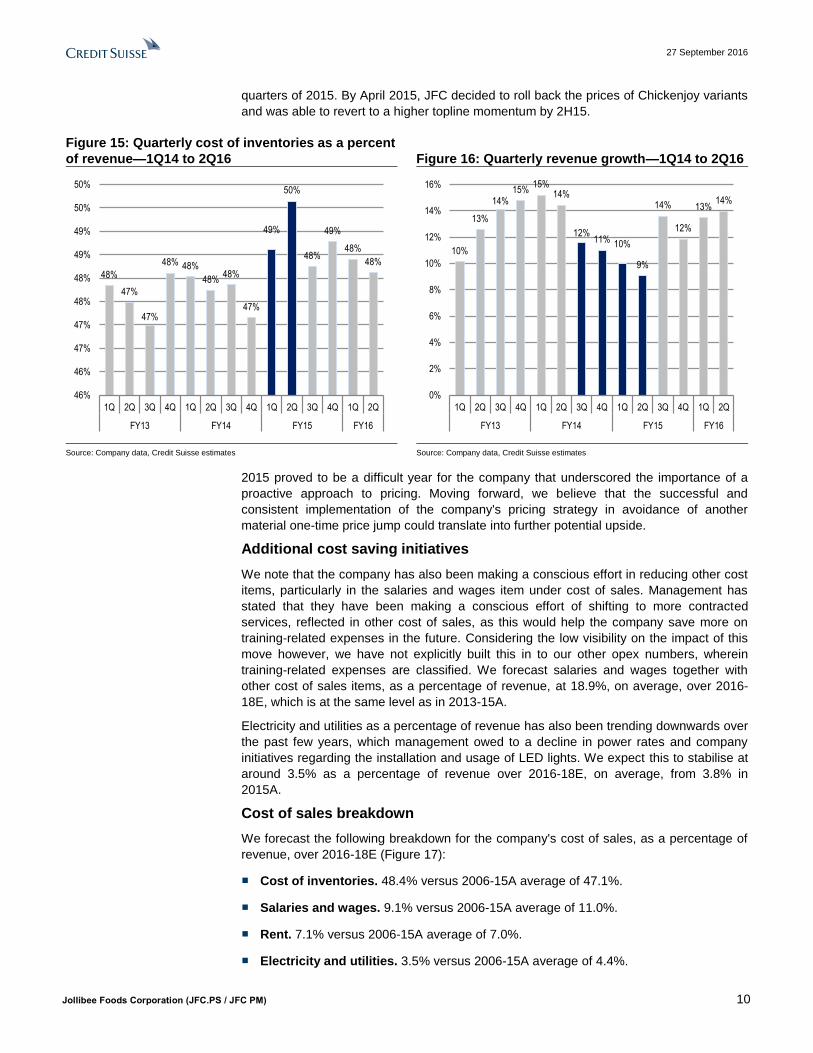
Figure 14: USDA ground beef retail prices index
Source: the BLOOMBERG PROFESSIONAL™ service, Credit Suisse estimates
The one-time price increase of 4% YoY backfired on two counts as (1) it failed to offset
already escalated input costs (Figure 15) and (2) negatively affected sales volume from
more price sensitive customers (Figure 16). The effect of which trickled into the first two
45%
46%
48%
46%
47%
48% 48% 48%48%
49%
48%49% 49%
43%
44%
45%
46%
47%
48%
49%
50%
2006
2007
2008
2009
2010
2011
2012
2013
2014
2015
2016
E
2017
E
2018
E
2.5
2.7
2.9
3.1
3.3
3.5
3.7
3.9
4.1
4.3
4.5
Sep-13 Dec-13 Mar-14 Jun-14 Sep-14 Dec-14 Mar-15 Jun-15 Sep-15 Dec-15 Mar-16 Jun-16
Oct 2014: Implemented
+4% price increase in
Jollibee brand
27 September 2016
Jollibee Foods Corporation (JFC.PS / JFC PM) 10
quarters of 2015. By April 2015, JFC decided to roll back the prices of Chickenjoy variants
and was able to revert to a higher topline momentum by 2H15.
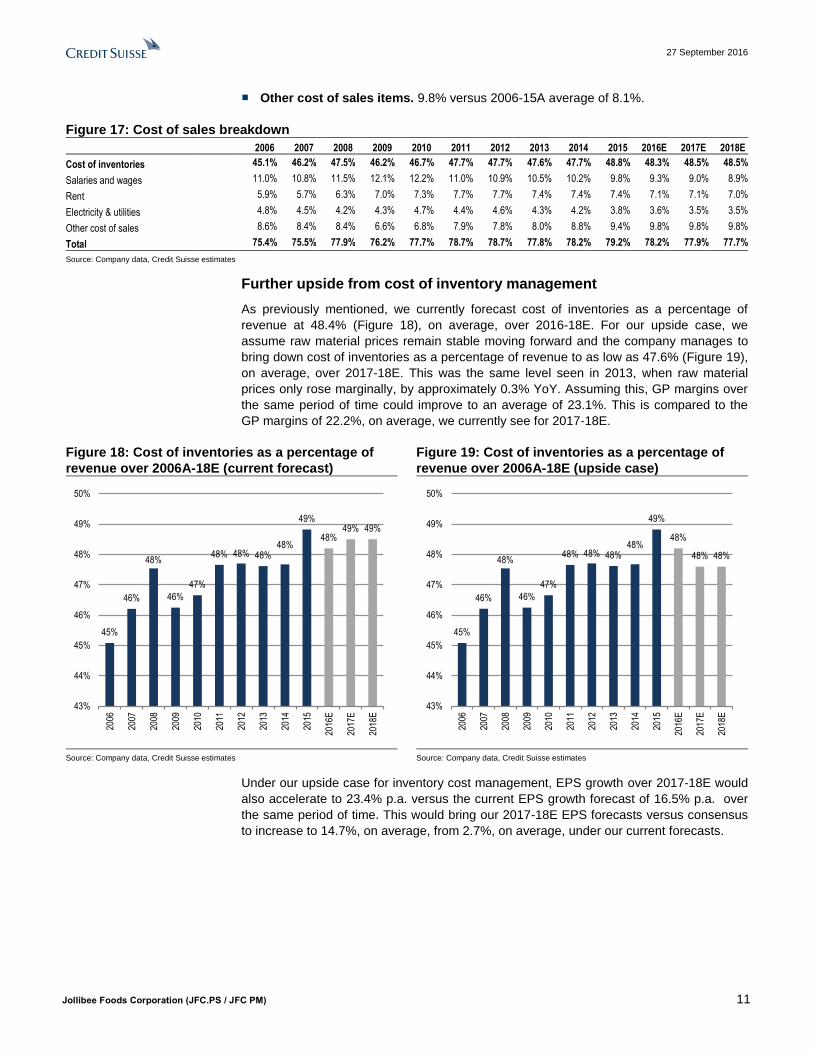
Figure 15: Quarterly cost of inventories as a percent
of revenue—1Q14 to 2Q16 Figure 16: Quarterly revenue growth—1Q14 to 2Q16
Source: Company data, Credit Suisse estimates Source: Company data, Credit Suisse estimates
2015 proved to be a difficult year for the company that underscored the importance of a
proactive approach to pricing. Moving forward, we believe that the successful and
consistent implementation of the company's pricing strategy in avoidance of another
material one-time price jump could translate into further potential upside.
Additional cost saving initiatives
We note that the company has also been making a conscious effort in reducing other cost
items, particularly in the salaries and wages item under cost of sales. Management has
stated that they have been making a conscious effort of shifting to more contracted
services, reflected in other cost of sales, as this would help the company save more on
training-related expenses in the future. Considering the low visibility on the impact of this
move however, we have not explicitly built this in to our other opex numbers, wherein
training-related expenses are classified. We forecast salaries and wages together with
other cost of sales items, as a percentage of revenue, at 18.9%, on average, over 2016-
18E, which is at the same level as in 2013-15A.
Electricity and utilities as a percentage of revenue has also been trending downwards over
the past few years, which management owed to a decline in power rates and company
initiatives regarding the installation and usage of LED lights. We expect this to stabilise at
around 3.5% as a percentage of revenue over 2016-18E, on average, from 3.8% in
2015A.
Cost of sales breakdown
We forecast the following breakdown for the company's cost of sales, as a percentage of
revenue, over 2016-18E (Figure 17):
■ Cost of inventories. 48.4% versus 2006-15A average of 47.1%.
■ Salaries and wages. 9.1% versus 2006-15A average of 11.0%.
■ Rent. 7.1% versus 2006-15A average of 7.0%.
■ Electricity and utilities. 3.5% versus 2006-15A average of 4.4%.
48%
47%
47%
48% 48%
48%48%
47%
49%
50%
48%
49%
48%
48%
46%
46%
47%
47%
48%
48%
49%
49%
50%
50%
1Q 2Q 3Q 4Q 1Q 2Q 3Q 4Q 1Q 2Q 3Q 4Q 1Q 2Q
FY13 FY14 FY15 FY16
10%
13%
14%15%
15%14%
12%11% 10%
9%
14%
12%
13%14%
0%
2%
4%
6%
8%
10%
12%
14%
16%
1Q 2Q 3Q 4Q 1Q 2Q 3Q 4Q 1Q 2Q 3Q 4Q 1Q 2Q
FY13 FY14 FY15 FY16
27 September 2016
Jollibee Foods Corporation (JFC.PS / JFC PM) 11
■ Other cost of sales items. 9.8% versus 2006-15A average of 8.1%.
Figure 17: Cost of sales breakdown
2006 2007 2008 2009 2010 2011 2012 2013 2014 2015 2016E 2017E 2018E
Cost of inventories 45.1% 46.2% 47.5% 46.2% 46.7% 47.7% 47.7% 47.6% 47.7% 48.8% 48.3% 48.5% 48.5%
Salaries and wages 11.0% 10.8% 11.5% 12.1% 12.2% 11.0% 10.9% 10.5% 10.2% 9.8% 9.3% 9.0% 8.9%
Rent 5.9% 5.7% 6.3% 7.0% 7.3% 7.7% 7.7% 7.4% 7.4% 7.4% 7.1% 7.1% 7.0%
Electricity & utilities 4.8% 4.5% 4.2% 4.3% 4.7% 4.4% 4.6% 4.3% 4.2% 3.8% 3.6% 3.5% 3.5%
Other cost of sales 8.6% 8.4% 8.4% 6.6% 6.8% 7.9% 7.8% 8.0% 8.8% 9.4% 9.8% 9.8% 9.8%
Total 75.4% 75.5% 77.9% 76.2% 77.7% 78.7% 78.7% 77.8% 78.2% 79.2% 78.2% 77.9% 77.7%
Source: Company data, Credit Suisse estimates
Further upside from cost of inventory management
As previously mentioned, we currently forecast cost of inventories as a percentage of
revenue at 48.4% (Figure 18), on average, over 2016-18E. For our upside case, we
assume raw material prices remain stable moving forward and the company manages to
bring down cost of inventories as a percentage of revenue to as low as 47.6% (Figure 19),
on average, over 2017-18E. This was the same level seen in 2013, when raw material
prices only rose marginally, by approximately 0.3% YoY. Assuming this, GP margins over
the same period of time could improve to an average of 23.1%. This is compared to the
GP margins of 22.2%, on average, we currently see for 2017-18E.
Figure 18: Cost of inventories as a percentage of
revenue over 2006A-18E (current forecast)
Figure 19: Cost of inventories as a percentage of
revenue over 2006A-18E (upside case)
Source: Company data, Credit Suisse estimates Source: Company data, Credit Suisse estimates
Under our upside case for inventory cost management, EPS growth over 2017-18E would
also accelerate to 23.4% p.a. versus the current EPS growth forecast of 16.5% p.a. over
the same period of time. This would bring our 2017-18E EPS forecasts versus consensus
to increase to 14.7%, on average, from 2.7%, on average, under our current forecasts.
45%
46%
48%
46%
47%
48% 48% 48%48%
49%
48%49% 49%
43%
44%
45%
46%
47%
48%
49%
50%
2006
2007
2008
2009
2010
2011
2012
2013
2014
2015
2016
E
2017
E
2018
E
45%
46%
48%
46%
47%
48% 48% 48%48%
49%
48%
48% 48%
43%
44%
45%
46%
47%
48%
49%
50%
2006
2007
2008
2009
2010
2011
2012
2013
2014
2015
2016
E
2017
E
2018
E
27 September 2016
Jollibee Foods Corporation (JFC.PS / JFC PM) 12
International ventures add upside risk We believe that additional upside potential lies in JFC's international operations. Note that
our current base case has not built in a turnaround in JFC's international ventures,
particularly its brand Yonghe King and its recent acquisition of Smashburger.
Management, however, has recently begun to identify areas of improvements in these
ventures, such as a renewed focus on diversifying their menu offerings, new price
promotions and a sharper expansion strategy. We believe that positive development in
these businesses, in addition to continued growth on the international front, could provide
upside risk to earnings estimates.
Firming up the international front
The Bee goes global
While growing its domestic business, we note that the company has been keeping busy on
the global front through a number of acquisitions and joint ventures made every two years
or so in different markets (Figure 20). JFC generally has two methods in going about its
international strategy, wherein (1) it acquires or partners with a local brand in order to
penetrate the mainstream fast food market or (2) it brings its domestic brands to areas
with a large concentration of OFWs.
For 2016-18E, we see steady international revenue growth of approximately 9.7% p.a., on
average. This is compared to the 13.2% p.a., on average, international revenue growth
recorded over 2013-15A. Note, however, that 2013A international revenue numbers were
boosted by the company's acquisition of a majority stake in San Ping Wang in March
2012.
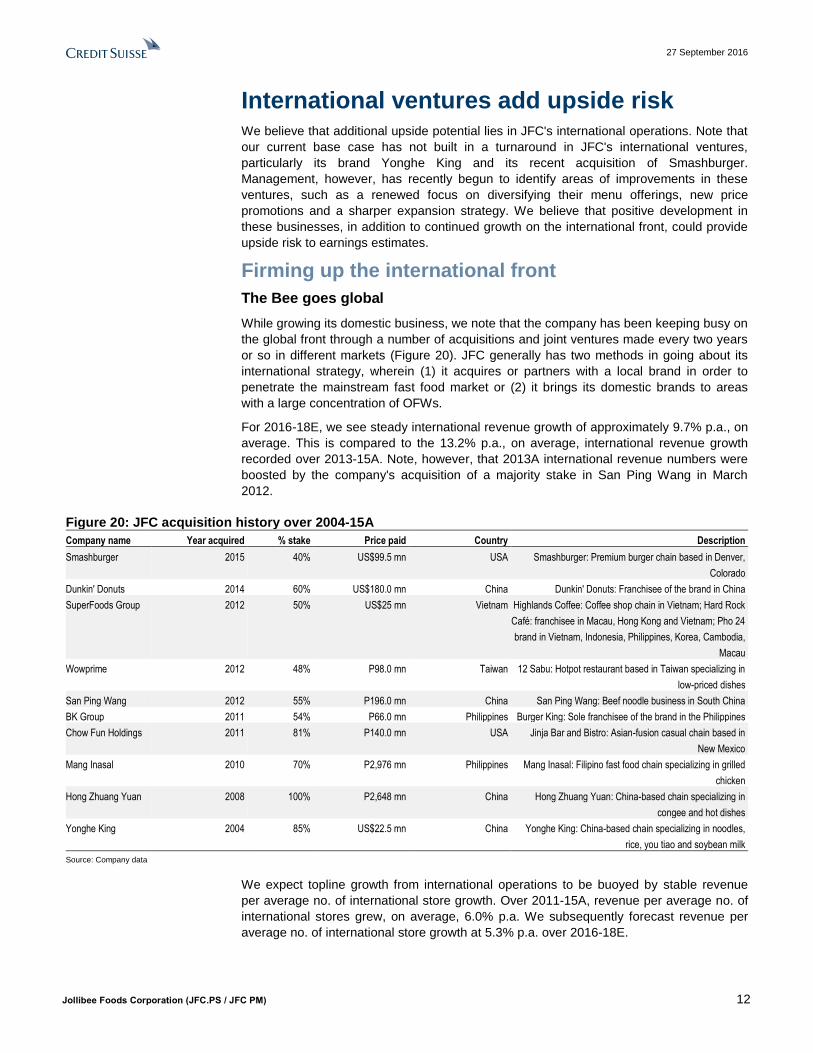
Figure 20: JFC acquisition history over 2004-15A
Company name Year acquired % stake Price paid Country Description
Smashburger 2015 40% US$99.5 mn USA Smashburger: Premium burger chain based in Denver,
Colorado
Dunkin' Donuts 2014 60% US$180.0 mn China Dunkin' Donuts: Franchisee of the brand in China
SuperFoods Group 2012 50% US$25 mn Vietnam Highlands Coffee: Coffee shop chain in Vietnam; Hard Rock
Café: franchisee in Macau, Hong Kong and Vietnam; Pho 24
brand in Vietnam, Indonesia, Philippines, Korea, Cambodia,
Macau
Wowprime 2012 48% P98.0 mn Taiwan 12 Sabu: Hotpot restaurant based in Taiwan specializing in
low-priced dishes
San Ping Wang 2012 55% P196.0 mn China San Ping Wang: Beef noodle business in South China
BK Group 2011 54% P66.0 mn Philippines Burger King: Sole franchisee of the brand in the Philippines
Chow Fun Holdings 2011 81% P140.0 mn USA Jinja Bar and Bistro: Asian-fusion casual chain based in
New Mexico
Mang Inasal 2010 70% P2,976 mn Philippines Mang Inasal: Filipino fast food chain specializing in grilled
chicken
Hong Zhuang Yuan 2008 100% P2,648 mn China Hong Zhuang Yuan: China-based chain specializing in
congee and hot dishes
Yonghe King 2004 85% US$22.5 mn China Yonghe King: China-based chain specializing in noodles,
rice, you tiao and soybean milk
Source: Company data
We expect topline growth from international operations to be buoyed by stable revenue
per average no. of international store growth. Over 2011-15A, revenue per average no. of
international stores grew, on average, 6.0% p.a. We subsequently forecast revenue per
average no. of international store growth at 5.3% p.a. over 2016-18E.

27 September 2016
Jollibee Foods Corporation (JFC.PS / JFC PM) 13
New approach to competition could turn the game around in China
As of 1H16, JFC's China operations (11% of total systemwide sales, as seen in Figure 21)
have been feeling downward pressure coming from the aggressive efforts of Western
brands such as McDonald's and KFC on the matters of pricing, a continued roll-out in
promotions, and location. Yonghe King, the brand primarily affected by this, accounts for
roughly 73% of JFC's China operations. We believe, however, that with the successful
execution of management's new strategy in counteracting competition, JFC could very
well turn things around in the medium term.
Figure 21: JFC systemwide sales split between
foreign brands—1H16 Figure 22: China fast food value market share—2015
Source: Company data, Credit Suisse estimates Source: Euromonitor, Credit Suisse estimates
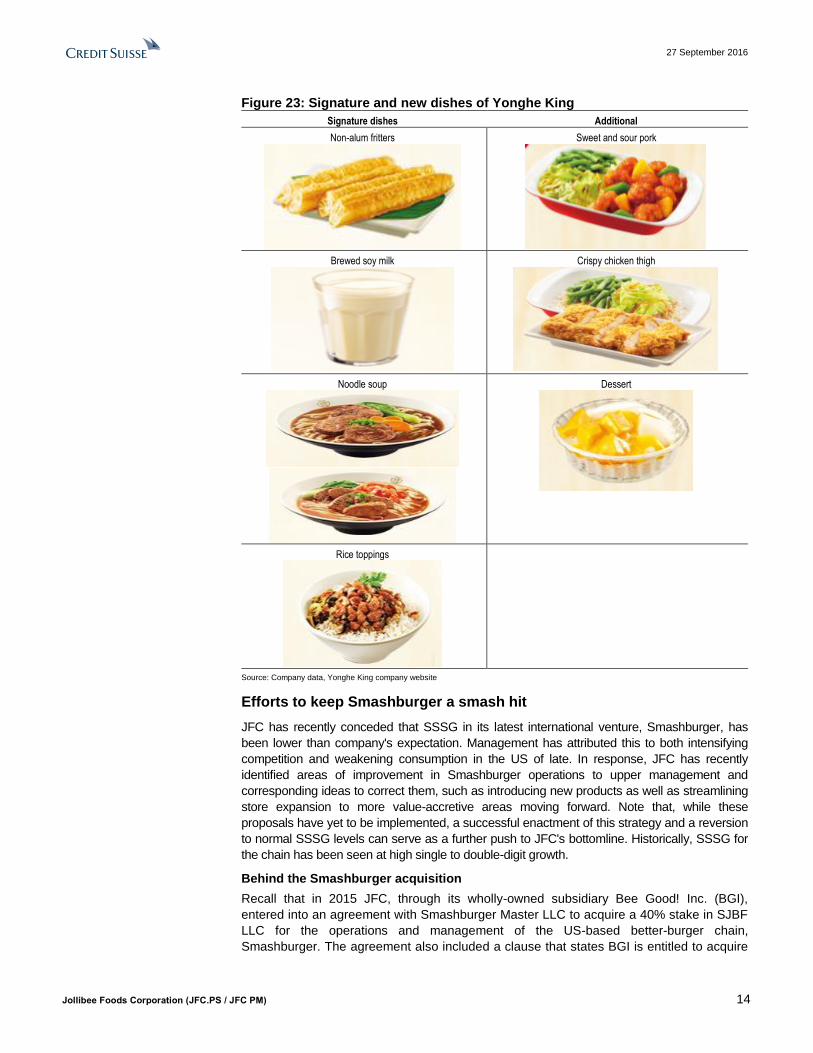
JFC has already initiated new approaches in addressing the competition issue for Yonghe
King. The company, for example, has begun diversifying its menu offerings by introducing
new items diverging from its typical noodle offerings (Figure 23).
JFC has also started introducing price promotions in certain areas of China, which are
supposedly more price sensitive. With management noting a slight improvement in
transaction count recently, the company hopes to see a turnaround for its Yonghe King
brand by 2017. We have not priced this in to our numbers, but assuming the company's
efforts to counteract competition are successful, this could translate into a potential upside
for JFC's international revenue numbers.
Despite more aggressive competition in China, we also note that the Asian fast food
segment continues to dominate consumer preferences as it accounted for 86%, on
average, of the Chinese fast food market (in terms of value) over 2011-15A. This implies
room for JFC's China brands to continue to grow as the data suggests a certain degree of
insulation for the Asian fast food segment in terms of demand and preference.
Domestic 81%
Yonghe King8%
Other China brands
3%
Jollibee 5%
Chowking 2%
Red Ribbon 1%
Asian 86%
Bakery Products
1%
Burger3%
Chicken8% Other
2%
27 September 2016
Jollibee Foods Corporation (JFC.PS / JFC PM) 14
Figure 23: Signature and new dishes of Yonghe King
Signature dishes Additional
Non-alum fritters
Sweet and sour pork
Brewed soy milk
Crispy chicken thigh
Noodle soup
Dessert
Rice toppings
Source: Company data, Yonghe King company website
Efforts to keep Smashburger a smash hit
JFC has recently conceded that SSSG in its latest international venture, Smashburger, has
been lower than company's expectation. Management has attributed this to both intensifying
competition and weakening consumption in the US of late. In response, JFC has recently
identified areas of improvement in Smashburger operations to upper management and
corresponding ideas to correct them, such as introducing new products as well as streamlining
store expansion to more value-accretive areas moving forward. Note that, while these
proposals have yet to be implemented, a successful enactment of this strategy and a reversion
to normal SSSG levels can serve as a further push to JFC's bottomline. Historically, SSSG for
the chain has been seen at high single to double-digit growth.
Behind the Smashburger acquisition
Recall that in 2015 JFC, through its wholly-owned subsidiary Bee Good! Inc. (BGI),
entered into an agreement with Smashburger Master LLC to acquire a 40% stake in SJBF
LLC for the operations and management of the US-based better-burger chain,
Smashburger. The agreement also included a clause that states BGI is entitled to acquire
27 September 2016
Jollibee Foods Corporation (JFC.PS / JFC PM) 15
an additional 35% in Smashburger between 2018 and 2021 and the balance of 25%
between 2019 and 2026, at the latest.
The acquisition was a landmark one over the company's history as it marked JFC's first
move to tap into the US burger market by serving its mainstream customers. Note that the
acquisition is also a strategic one as Smashburger, characterised by its 100% certified
Angus beef burgers, more gourmet ingredients, and higher price points, sits well within the
fast casual segment.
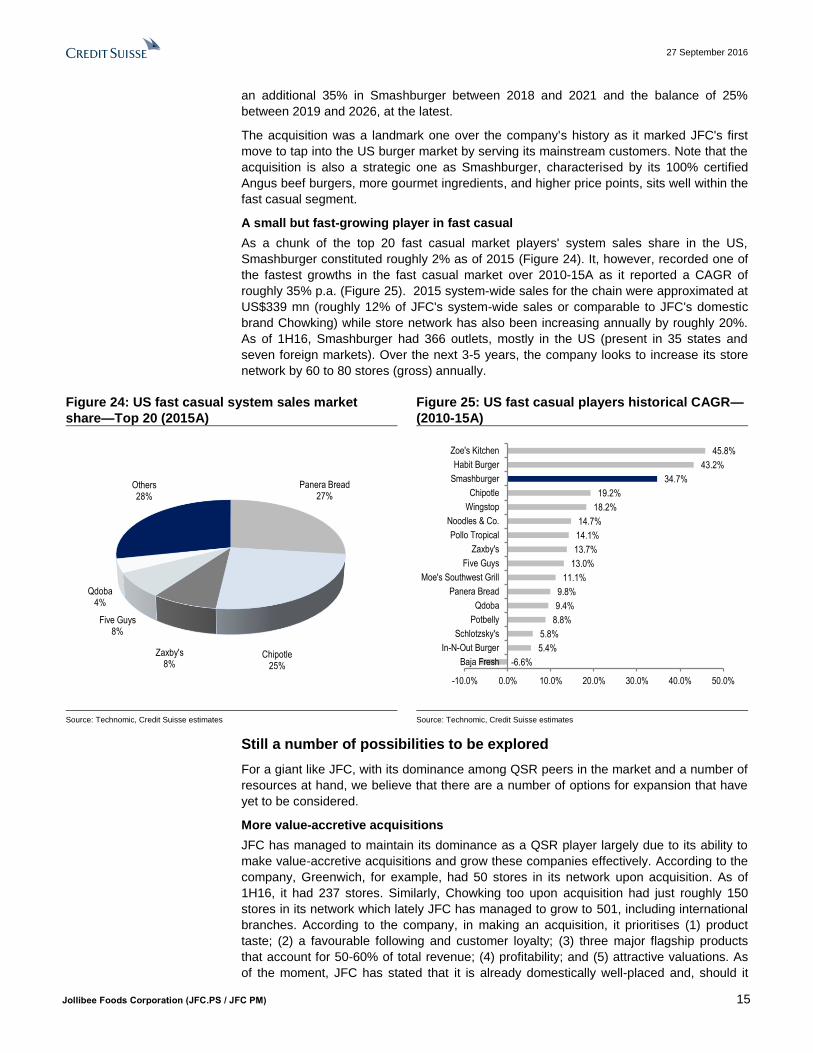
A small but fast-growing player in fast casual
As a chunk of the top 20 fast casual market players' system sales share in the US,
Smashburger constituted roughly 2% as of 2015 (Figure 24). It, however, recorded one of
the fastest growths in the fast casual market over 2010-15A as it reported a CAGR of
roughly 35% p.a. (Figure 25). 2015 system-wide sales for the chain were approximated at
US$339 mn (roughly 12% of JFC's system-wide sales or comparable to JFC's domestic
brand Chowking) while store network has also been increasing annually by roughly 20%.
As of 1H16, Smashburger had 366 outlets, mostly in the US (present in 35 states and
seven foreign markets). Over the next 3-5 years, the company looks to increase its store
network by 60 to 80 stores (gross) annually.
Figure 24: US fast casual system sales market
share—Top 20 (2015A)
Figure 25: US fast casual players historical CAGR—
(2010-15A)
Source: Technomic, Credit Suisse estimates Source: Technomic, Credit Suisse estimates
Still a number of possibilities to be explored
For a giant like JFC, with its dominance among QSR peers in the market and a number of
resources at hand, we believe that there are a number of options for expansion that have
yet to be considered.
More value-accretive acquisitions
JFC has managed to maintain its dominance as a QSR player largely due to its ability to
make value-accretive acquisitions and grow these companies effectively. According to the
company, Greenwich, for example, had 50 stores in its network upon acquisition. As of
1H16, it had 237 stores. Similarly, Chowking too upon acquisition had just roughly 150
stores in its network which lately JFC has managed to grow to 501, including international
branches. According to the company, in making an acquisition, it prioritises (1) product
taste; (2) a favourable following and customer loyalty; (3) three major flagship products
that account for 50-60% of total revenue; (4) profitability; and (5) attractive valuations. As
of the moment, JFC has stated that it is already domestically well-placed and, should it
Panera Bread27%
Chipotle25%
Zaxby's8%
Five Guys8%
Qdoba4%
Others28%
-6.6%
5.4%
5.8%
8.8%
9.4%
9.8%
11.1%
13.0%
13.7%
14.1%
14.7%
18.2%
19.2%
34.7%
43.2%
45.8%
-10.0% 0.0% 10.0% 20.0% 30.0% 40.0% 50.0%
Baja Fresh
In-N-Out Burger
Schlotzsky's
Potbelly
Qdoba
Panera Bread
Moe's Southwest Grill
Five Guys
Zaxby's
Pollo Tropical
Noodles & Co.
Wingstop
Chipotle
Smashburger
Habit Burger
Zoe's Kitchen
27 September 2016
Jollibee Foods Corporation (JFC.PS / JFC PM) 16
make another acquisition, it would be in the international market, preferably in the fast
casual segment.
Jollibee in the USA (more OFW areas that the chain hasn't penetrated yet)
As of June, JFC had 85 stores in the US, 33 of which were Jollibee stores. The company
notes that its US-based stores have been recording high-single-digit SSSG with its
Jollibee stores posting double-digit SSSG. Existing Jollibee stores in the US are situated
predominantly on the West Coast with recent openings in Chicago, Queens and New
Jersey. The company plans to open more in Manhattan and Chicago as well as in
Canada.
Development of a mobile app like McDonald's, further IT enhancements
In order to more effectively reach their customers, it is not unlikely that JFC will launch a
mobile app or other varied online platforms which consumers can access through their
smartphones to order food more conveniently. McDonald's launched their mobile
application in 2014, followed shortly by Krispy Kreme which released its version in 2015.
We expect the emerging trend of online platforms in the Philippine fast food industry to
continue to grow, considering the Filipinos' increasing dependence on technology and
need for convenience. Additionally, in our view, chained players like Jollibee are more
likely to leverage on this development as their wider access to resources would allow them
to keep up more easily with the fast-changing lifestyles and preferences of Filipinos.
27 September 2016
Jollibee Foods Corporation (JFC.PS / JFC PM) 17
Premium for a reason; reiterate OUTPERFORM JFC currently trades at a 41x P/E, above the global sector average for restaurants of 32x
P/E, which we justify based on JFC's clear medium-term growth story and its ability to
deliver escalating returns. Over 2017-18E, we see average ROIC expanding to 21.6% and
EPS growth at 16.5% p.a. Our 2017-18E EPS forecasts are 2.7% higher than consensus
on average.
Attractive risk-reward profile
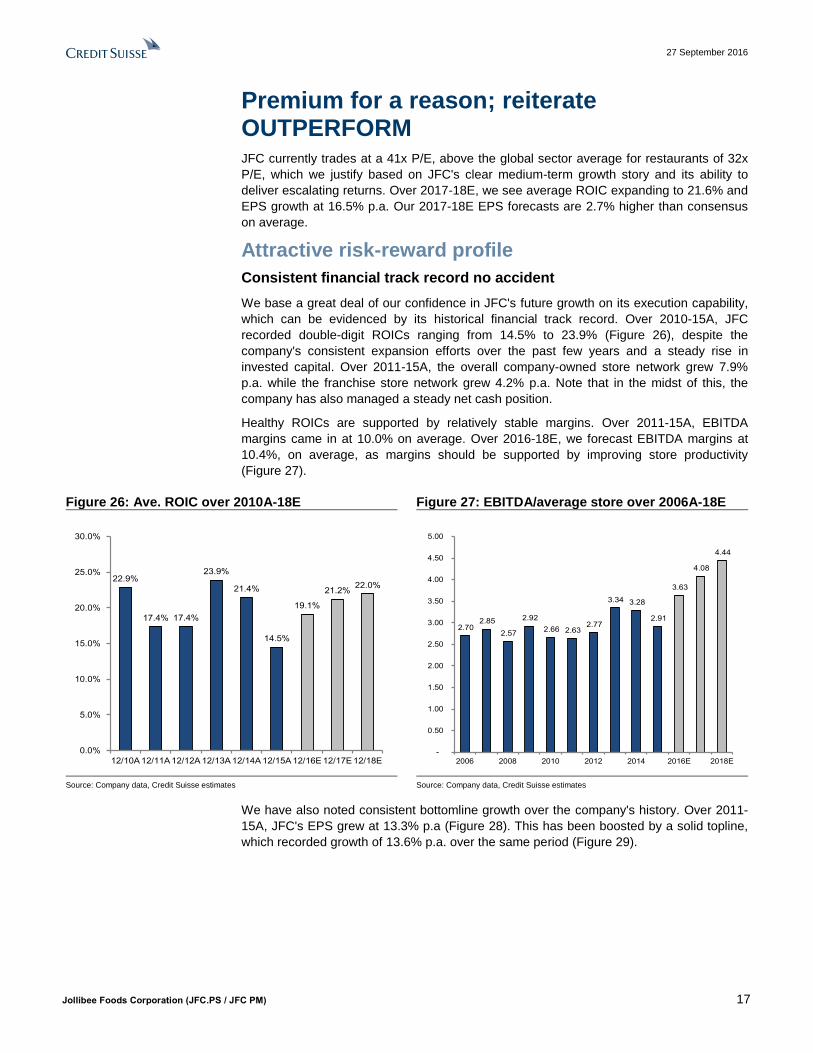
Consistent financial track record no accident
We base a great deal of our confidence in JFC's future growth on its execution capability,
which can be evidenced by its historical financial track record. Over 2010-15A, JFC
recorded double-digit ROICs ranging from 14.5% to 23.9% (Figure 26), despite the
company's consistent expansion efforts over the past few years and a steady rise in
invested capital. Over 2011-15A, the overall company-owned store network grew 7.9%
p.a. while the franchise store network grew 4.2% p.a. Note that in the midst of this, the
company has also managed a steady net cash position.
Healthy ROICs are supported by relatively stable margins. Over 2011-15A, EBITDA
margins came in at 10.0% on average. Over 2016-18E, we forecast EBITDA margins at
10.4%, on average, as margins should be supported by improving store productivity
(Figure 27).
Figure 26: Ave. ROIC over 2010A-18E Figure 27: EBITDA/average store over 2006A-18E
Source: Company data, Credit Suisse estimates Source: Company data, Credit Suisse estimates
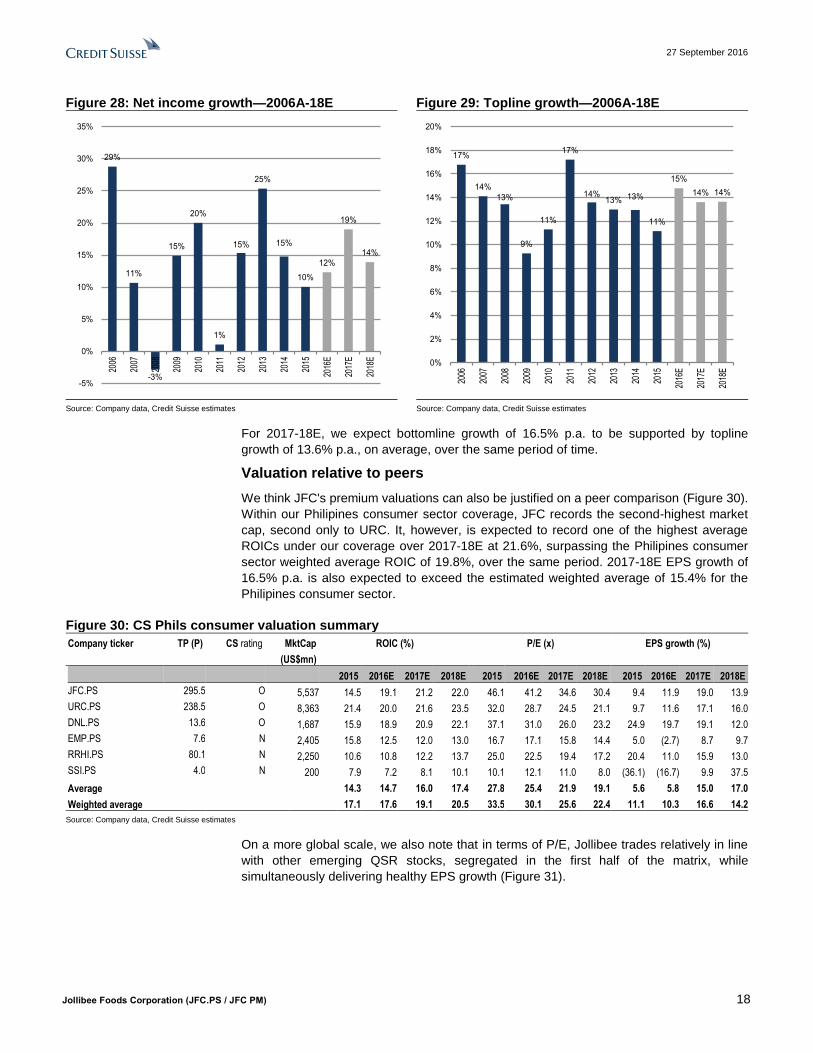
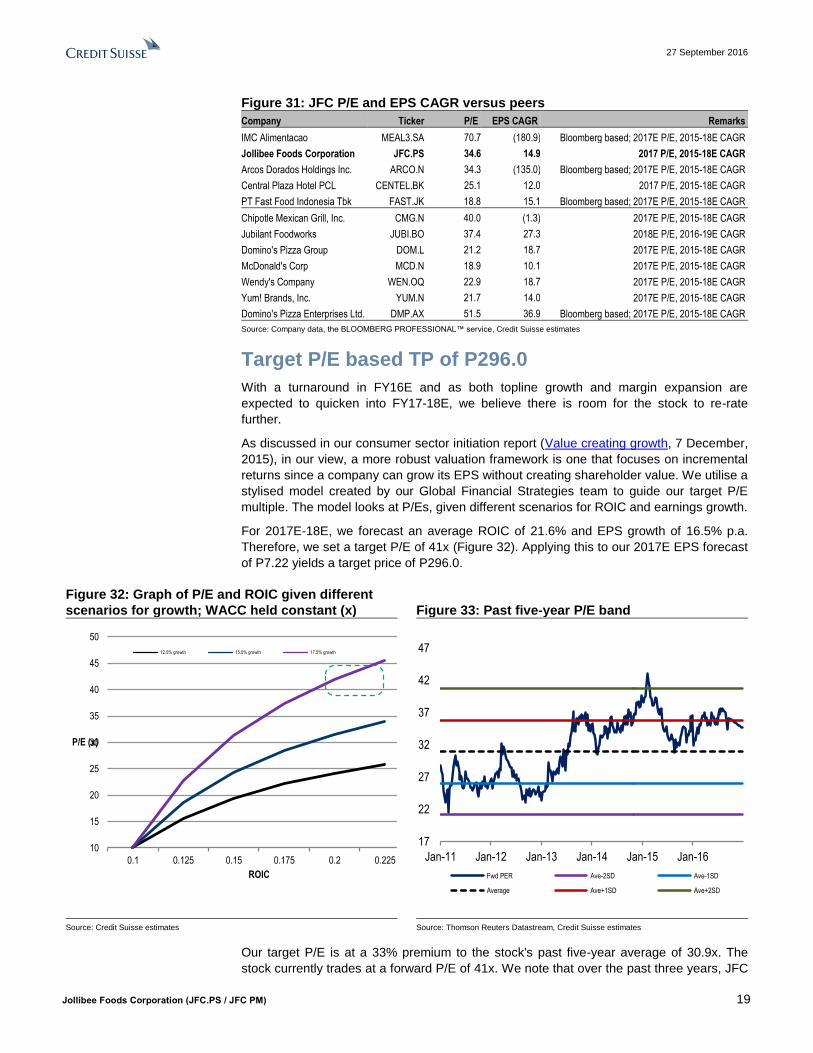
We have also noted consistent bottomline growth over the company's history. Over 2011-
15A, JFC's EPS grew at 13.3% p.a (Figure 28). This has been boosted by a solid topline,
which recorded growth of 13.6% p.a. over the same period (Figure 29).
22.9%
17.4% 17.4%
23.9%
21.4%
14.5%
19.1%
21.2%22.0%
0.0%
5.0%
10.0%
15.0%
20.0%
25.0%
30.0%
12/10A 12/11A 12/12A 12/13A 12/14A 12/15A 12/16E 12/17E 12/18E
2.70 2.85
2.57
2.92
2.66 2.63 2.77
3.34 3.28
2.91
3.63
4.08
4.44
-
0.50
1.00
1.50
2.00
2.50
3.00
3.50
4.00
4.50
5.00
2006 2008 2010 2012 2014 2016E 2018E
27 September 2016
Jollibee Foods Corporation (JFC.PS / JFC PM) 18
Figure 28: Net income growth—2006A-18E Figure 29: Topline growth—2006A-18E
Source: Company data, Credit Suisse estimates Source: Company data, Credit Suisse estimates
For 2017-18E, we expect bottomline growth of 16.5% p.a. to be supported by topline
growth of 13.6% p.a., on average, over the same period of time.
Valuation relative to peers
We think JFC's premium valuations can also be justified on a peer comparison (Figure 30).
Within our Philipines consumer sector coverage, JFC records the second-highest market
cap, second only to URC. It, however, is expected to record one of the highest average
ROICs under our coverage over 2017-18E at 21.6%, surpassing the Philipines consumer
sector weighted average ROIC of 19.8%, over the same period. 2017-18E EPS growth of
16.5% p.a. is also expected to exceed the estimated weighted average of 15.4% for the
Philipines consumer sector.
Figure 30: CS Phils consumer valuation summary
Company ticker TP (P) CS rating MktCap
(US$mn)
ROIC (%) P/E (x) EPS growth (%)
2015 2016E 2017E 2018E 2015 2016E 2017E 2018E 2015 2016E 2017E 2018E
JFC.PS 295.5 O 5,537 14.5 19.1 21.2 22.0 46.1 41.2 34.6 30.4 9.4 11.9 19.0 13.9
URC.PS 238.5 O 8,363 21.4 20.0 21.6 23.5 32.0 28.7 24.5 21.1 9.7 11.6 17.1 16.0
DNL.PS 13.6 O 1,687 15.9 18.9 20.9 22.1 37.1 31.0 26.0 23.2 24.9 19.7 19.1 12.0
EMP.PS 7.6 N 2,405 15.8 12.5 12.0 13.0 16.7 17.1 15.8 14.4 5.0 (2.7) 8.7 9.7
RRHI.PS 80.1 N 2,250 10.6 10.8 12.2 13.7 25.0 22.5 19.4 17.2 20.4 11.0 15.9 13.0
SSI.PS 4.0 N 200 7.9 7.2 8.1 10.1 10.1 12.1 11.0 8.0 (36.1) (16.7) 9.9 37.5
Average 14.3 14.7 16.0 17.4 27.8 25.4 21.9 19.1 5.6 5.8 15.0 17.0
Weighted average 17.1 17.6 19.1 20.5 33.5 30.1 25.6 22.4 11.1 10.3 16.6 14.2
Source: Company data, Credit Suisse estimates
On a more global scale, we also note that in terms of P/E, Jollibee trades relatively in line
with other emerging QSR stocks, segregated in the first half of the matrix, while
simultaneously delivering healthy EPS growth (Figure 31).
29%
11%
-3%
15%
20%
1%
15%
25%
15%
10%
12%
19%
14%
-5%
0%
5%
10%
15%
20%
25%
30%
35%
2006
2007
2008
2009
2010
2011
2012
2013
2014
2015
2016
E
2017
E
2018
E
17%
14%
13%
9%
11%
17%
14%13% 13%
11%
15%
14% 14%
0%
2%
4%
6%
8%
10%
12%
14%
16%
18%
20%
2006
2007
2008
2009
2010
2011
2012
2013
2014
2015
2016
E
2017
E
2018
E
27 September 2016
Jollibee Foods Corporation (JFC.PS / JFC PM) 19
Figure 31: JFC P/E and EPS CAGR versus peers
Company Ticker P/E EPS CAGR Remarks
IMC Alimentacao MEAL3.SA 70.7 (180.9) Bloomberg based; 2017E P/E, 2015-18E CAGR
Jollibee Foods Corporation JFC.PS 34.6 14.9 2017 P/E, 2015-18E CAGR
Arcos Dorados Holdings Inc. ARCO.N 34.3 (135.0) Bloomberg based; 2017E P/E, 2015-18E CAGR
Central Plaza Hotel PCL CENTEL.BK 25.1 12.0 2017 P/E, 2015-18E CAGR
PT Fast Food Indonesia Tbk FAST.JK 18.8 15.1 Bloomberg based; 2017E P/E, 2015-18E CAGR
Chipotle Mexican Grill, Inc. CMG.N 40.0 (1.3) 2017E P/E, 2015-18E CAGR
Jubilant Foodworks JUBI.BO 37.4 27.3 2018E P/E, 2016-19E CAGR
Domino's Pizza Group DOM.L 21.2 18.7 2017E P/E, 2015-18E CAGR
McDonald's Corp MCD.N 18.9 10.1 2017E P/E, 2015-18E CAGR
Wendy's Company WEN.OQ 22.9 18.7 2017E P/E, 2015-18E CAGR
Yum! Brands, Inc. YUM.N 21.7 14.0 2017E P/E, 2015-18E CAGR
Domino's Pizza Enterprises Ltd. DMP.AX 51.5 36.9 Bloomberg based; 2017E P/E, 2015-18E CAGR
Source: Company data, the BLOOMBERG PROFESSIONAL™ service, Credit Suisse estimates
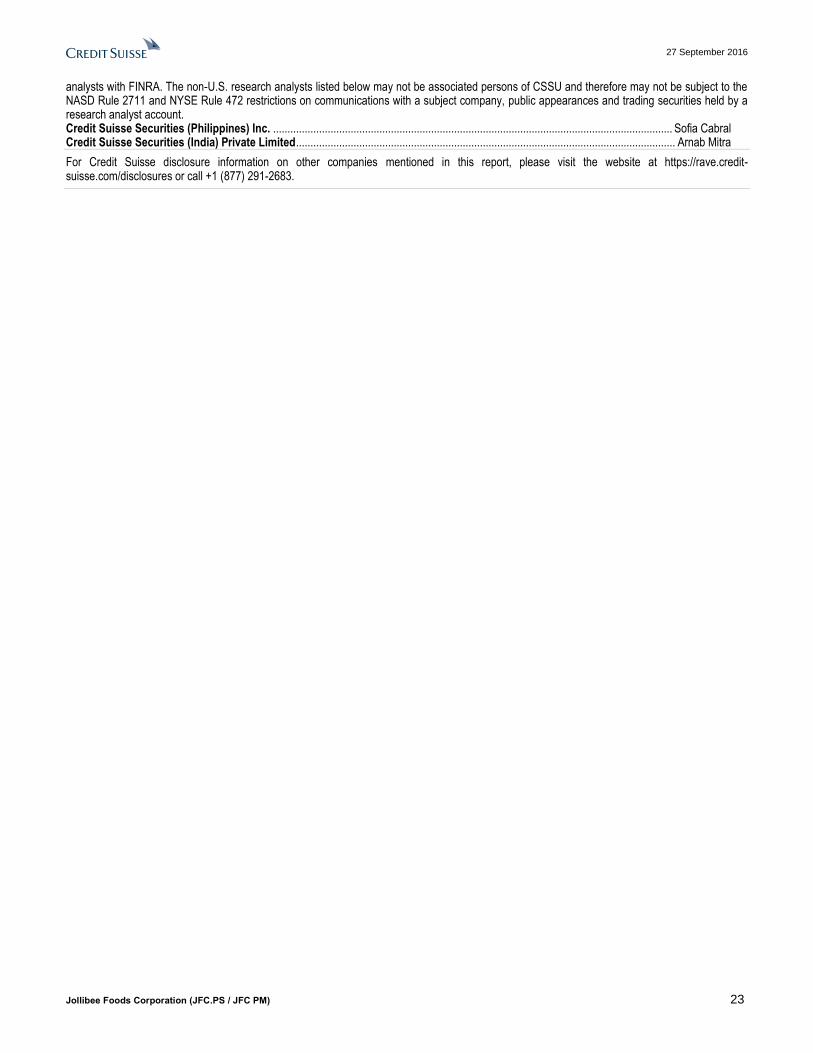
Target P/E based TP of P296.0
With a turnaround in FY16E and as both topline growth and margin expansion are
expected to quicken into FY17-18E, we believe there is room for the stock to re-rate
further.
As discussed in our consumer sector initiation report (Value creating growth, 7 December,
2015), in our view, a more robust valuation framework is one that focuses on incremental
returns since a company can grow its EPS without creating shareholder value. We utilise a
stylised model created by our Global Financial Strategies team to guide our target P/E
multiple. The model looks at P/Es, given different scenarios for ROIC and earnings growth.
For 2017E-18E, we forecast an average ROIC of 21.6% and EPS growth of 16.5% p.a.
Therefore, we set a target P/E of 41x (Figure 32). Applying this to our 2017E EPS forecast
of P7.22 yields a target price of P296.0.
Figure 32: Graph of P/E and ROIC given different
scenarios for growth; WACC held constant (x) Figure 33: Past five-year P/E band
Source: Credit Suisse estimates Source: Thomson Reuters Datastream, Credit Suisse estimates
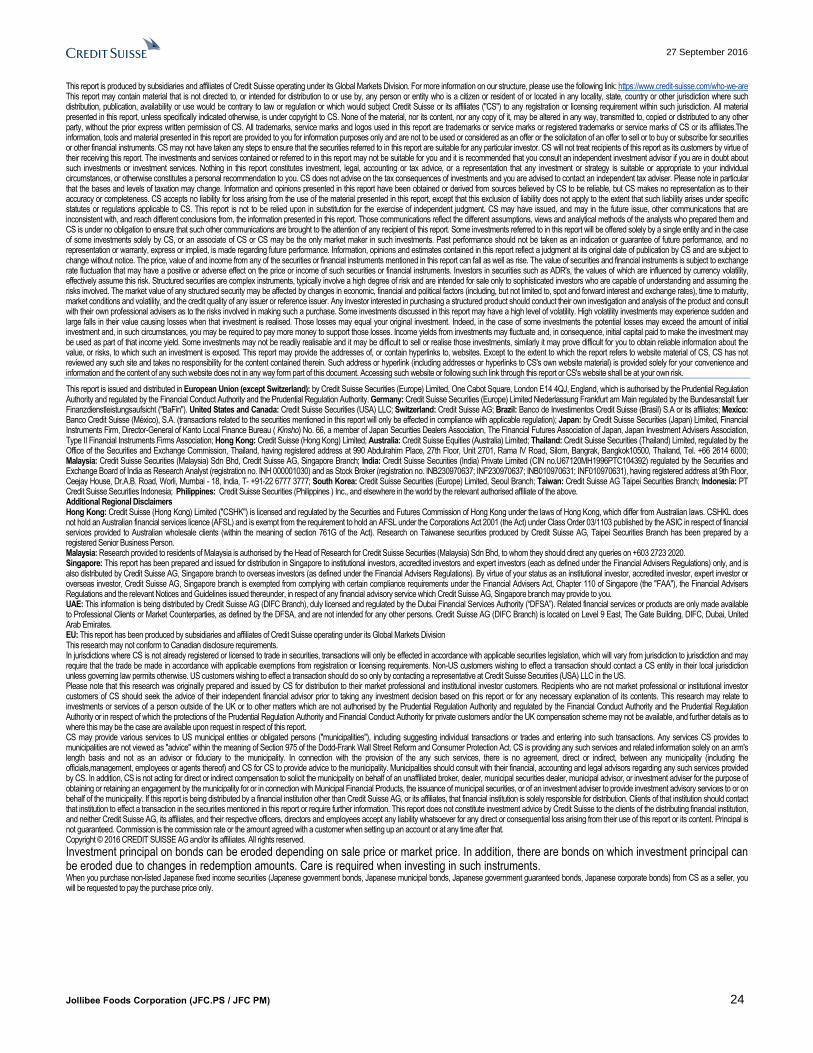
Our target P/E is at a 33% premium to the stock's past five-year average of 30.9x. The
stock currently trades at a forward P/E of 41x. We note that over the past three years, JFC
10
15
20
25
30
35
40
45
50
0.1 0.125 0.15 0.175 0.2 0.225
P/E (x)
ROIC
12.5% growth 15.0% growth 17.5% growth
17
22
27
32
37
42
47
Jan-11 Jan-12 Jan-13 Jan-14 Jan-15 Jan-16
Fwd PER Ave-2SD Ave-1SD
Average Ave+1SD Ave+2SD

27 September 2016
Jollibee Foods Corporation (JFC.PS / JFC PM) 20
has traded, on average, at a 123% premium to the market. This could be the inherent
scarcity premium placed on the stock as it is one of two pure consumer plays available in
the index. According to Bloomberg, the stock currently trades slightly below historical
levels at a 118% premium to the market.
Figure 34: JFC premium to market
2007 2008 2009 2010 2011 2012 2013 2014 2015 2016E
PCOMP 16.0 12.3 14.0 13.5 15.7 18.1 17.3 20.5 20.6 19.4
JFC 22.0 18.3 21.1 29.5 28.8 28.5 38.9 42.4 48.6 42.2
Premium to market 37.7% 49.3% 50.7% 119.2% 83.1% 57.6% 124.7% 106.8% 136.2% 117.6%
Source: Bloomberg, Credit Suisse estimates
Investment risks
Macroeconomic risks
As the Philippines continues to provide the bulk of JFC's business at 80% of revenue
recently, any adverse change in the current economic and political environment that could
prove negative to consumer sentiment could also potentially act as a definite downside
risk to our numbers. The current proposal being discussed regarding the implementation
of a soft drinks tax, for example, looks to impose an extra charge of P10 for every liter of
sugary drinks with a mandatory increase of 4% every year effective January 2017. While
the company states that this kind of measure would be passed on to customers, a material
change in price could again deter more price-sensitive customers and dampen consumer
demand. Current end-of-contract scheme talks also imply upside risks to costs and
operating expenses. As of 2016, approximately 72% of JFC's employees are employed on
a contractual basis.
Commodity price risk
The company has observed that commodity prices normally increase after elections as
inflation picks up. While the company is looking to proactively manage this with its
standard pricing policy, a significant increase in inventory cost that the company would be
unable to offset could again reduce our current earnings estimates. As of 1H16, cost of
inventories as a percentage of revenue stood at 48.3%.
Execution risks
The success of JFC's future growth lies in its ability to expand successfully, organically or
through M&As. Risks regarding overexpansion of its store network, unprofitable business
ventures, or entry into crowded fast food markets could serve as potential downside risks
to our numbers. Increased competition, particularly in its businesses abroad, could also
weaken topline growth.

27 September 2016
Jollibee Foods Corporation (JFC.PS / JFC PM) 21
Companies Mentioned (Price as of 26-Sep-2016) Arcos Dorados (ARCO.N, $5.39) Central Plaza Hotel PCL (CENTEL.BK, Bt40.0) Chipotle Mexican Grill, Inc. (CMG.N, $419.88) D&L Industries, Inc. (DNL.PS, P11.4) Domino's Pizza (DMP.AX, A$71.49) Domino's Pizza Group (DOM.L, 358.2p) Emperador Inc. (EMP.PS, P7.2) Fast Food ID (FAST.JK, Rp1,370) International Meal Company Holdings (MEAL3.SA, R$5.3) Jollibee Foods Corporation (JFC.PS, P249.8, OUTPERFORM, TP P296.0) Jubilant Foodworks (JUBI.BO, Rs958.6) McDonald's Corp (MCD.N, $116.53) Robinsons Retail Holdings, Inc. (RRHI.PS, P78.4) SSI Group, Inc. (SSI.PS, P2.92) Universal Robina Corporation (URC.PS, P185.0) Wendy's Company (WEN.OQ, $10.8) Yum! Brands, Inc. (YUM.N, $89.52)
Disclosure Appendix
Important Global Disclosures Sofia Cabral and Arnab Mitra each certify, with respect to the companies or securities that the individual analyzes, that (1) the views expressed in this report accurately reflect his or her personal views about all of the subject companies and securities and (2) no part of his or her compensation was, is or will be directly or indirectly related to the specific recommendations or views expressed in this report.
3-Year Price and Rating History for Jollibee Foods Corporation (JFC.PS)
JFC.PS Closing Price Target Price
Date (P) (P) Rating
06-Dec-13 170.00 205.00 O *
24-Feb-15 219.60 202.00 N
07-Dec-15 206.00 261.90 O *
19-May-16 233.60 262.30
10-Aug-16 252.20 262.30 *
* Asterisk signifies initiation or assumption of coverage.
O U T PERFO RM
N EU T RA L
The analyst(s) responsible for preparing this research report received Compensation that is based upon various factors including Credit Suisse's total revenues, a portion of which are generated by Credit Suisse's investment banking activities
As of December 10, 2012 Analysts’ stock rating are defined as follows: Outperform (O) : The stock’s total return is expected to outperform the relevant benchmark* over the next 12 months. Neutral (N) : The stock’s total return is expected to be in line with the relevant benchmark* over the next 12 months. Underperform (U) : The stock’s total return is expected to underperform the relevant benchmark* over the next 12 months. *Relevant benchmark by region: As of 10th December 2012, Japanese ratings are based on a stock’s total return relative to the analyst's coverage universe which consists of all companies covered by the analyst within the relevant sector, with Outperforms representing the most attractive, Neutrals the less attractive, and Underperforms the least attractive investment opportunities. As of 2nd October 2012, U.S . and Canadian as well as European ratings are based on a stock’s total return relative to the analyst's coverage universe which consists of all companies covered by the analyst within the relevant sector, with Outperforms representing the most attractive, Neutrals the less attractive, and Underperforms the least attractive investment opportunities. For Latin American and non -Japan Asia stocks, ratings are based on a stock’s total return relative to the average total return of the relevant country or region al benchmark; prior to 2nd October 2012 U.S. and Canadian ratings were based on (1) a stock’s absolute total return potential to its current share price and (2) the relative attractiv eness of a stock’s total return potential within an analyst’s coverage universe. For Australian and New Zealand stocks, the expected total return (ETR) calculation includes 12 -month rolling dividend yield. An Outperform rating is assigned where an ETR is greater than or equal to 7.5%; Underperform where an ETR less than or equa l to 5%. A Neutral may be assigned where the ETR is between -5% and 15%. The overlapping rating range allows analysts to assign a rating that puts ETR in the context of associated risks. Prior to 18 May 2015, ETR ranges for Outperform and Underperform ratings did not overlap with Neutral thresholds between 15% and 7.5%, which was in operation from 7 July 2011. Restricted (R) : In certain circumstances, Credit Suisse policy and/or applicable law and regulations preclude certain types of communications, including an investment recommendation, during the course of Credit Suisse's engagement in an investment banking transaction and in certain other circumstances. Not Rated (NR) : Credit Suisse Equity Research does not have an investment rating or view on the stock or any other securities related to the company at this time. Not Covered (NC) : Credit Suisse Equity Research does not provide ongoing coverage of the company or offer an investment rating or investment view on the equity security of the company or related products.

27 September 2016
Jollibee Foods Corporation (JFC.PS / JFC PM) 22
Volatility Indicator [V] : A stock is defined as volatile if the stock price has moved up or down by 20% or more in a month in at least 8 of the past 24 months or the analyst expects significant volatility going forward.
Analysts’ sector weightings are distinct from analysts’ stock ratings and are based on the analyst’s expectations for the fundamentals and/or valuation of the sector* relative to the group’s historic fundamentals and/or valuation: Overweight : The analyst’s expectation for the sector’s fundamentals and/or valuation is favorable over the next 12 months. Market Weight : The analyst’s expectation for the sector’s fundamentals and/or valuation is neutral over the next 12 months. Underweight : The analyst’s expectation for the sector’s fundamentals and/or valuation is cautious over the next 12 months. *An analyst’s coverage sector consists of all companies covered by the analyst within the relevant sector. An analyst may cover multiple sectors.
Credit Suisse's distribution of stock ratings (and banking clients) is:
Global Ratings Distribution
Rating Versus universe (%) Of which banking clients (%) Outperform/Buy* 53% (50% banking clients) Neutral/Hold* 29% (24% banking clients) Underperform/Sell* 18% (44% banking clients) Restricted 0% *For purposes of the NYSE and NASD ratings distribution disclosure requirements, our stock ratings of Outperform, Neutral, an d Underperform most closely correspond to Buy, Hold, and Sell, respectively; however, the meanings are not the same, as our stock ratings are determined on a relative basis. (Please refer to definitions above.) An investor's decision to buy or sell a security should be based on investment objectives, current holdin gs, and other individual factors.
Credit Suisse’s policy is to update research reports as it deems appropriate, based on developments with the subject company, the sector or the market that may have a material impact on the research views or opinions stated herein. Credit Suisse's policy is only to publish investment research that is impartial, independent, clear, fair and not misleading. For more detail please refer to Credit Suisse's Policies for Managing Conflicts of Interest in connection with Investment Research: http://www.csfb.com/research-and-analytics/disclaimer/managing_conflicts_disclaimer.html Credit Suisse does not provide any tax advice. Any statement herein regarding any US federal tax is not intended or written to be used, and cannot be used, by any taxpayer for the purposes of avoiding any penalties.
Target Price and Rating Valuation Methodology and Risks: (12 months) for Jollibee Foods Corporation (JFC.PS)
Method: Utilising the stylised model from our CS Global Financial Strategies team, 2017E-18E average forecasts for ROIC of 21.6% and EPS growth of 16.5% p.a., we set a target P/E of 41.0x. Applying this to our 2017E EPS forecast yields a target price of P296.0. Our OUTPERFORM rating for Jollibee Foods Corporation reflects our positive view on the fundamentals of consumption growth in the Philippines and execution ability of the company.
Risk: Risks to our P296.0 target price and OUTPERFORM for Jollibee Foods Corporation include downward EPS revisions and lower-than-expected ROIC.
Please refer to the firm's disclosure website at https://rave.credit-suisse.com/disclosures for the definitions of abbreviations typically used in the target price method and risk sections.
See the Companies Mentioned section for full company names Please visit https://credit-suisse.com/in/researchdisclosure for additional disclosures mandated vide Securities And Exchange Board of India (Research Analysts) Regulations, 2014 Credit Suisse may have interest in (JUBI.BO)
For date and time of production, dissemination and history of recommendation for the subject company(ies) featured in this report, disseminated within the past 12 months, please refer to the link: https://rave.credit-suisse.com/disclosures/view/report?i=260190&v=-1nb8tlmy49otdl2l3spunc9my .
Important Regional Disclosures Singapore recipients should contact Credit Suisse AG, Singapore Branch for any matters arising from this research report. The analyst(s) involved in the preparation of this report may participate in events hosted by the subject company, including site visits. Credit Suisse does not accept or permit analysts to accept payment or reimbursement for travel expenses associated with these events. Restrictions on certain Canadian securities are indicated by the following abbreviations: NVS--Non-Voting shares; RVS--Restricted Voting Shares; SVS--Subordinate Voting Shares. Individuals receiving this report from a Canadian investment dealer that is not affiliated with Credit Suisse should be advised that this report may not contain regulatory disclosures the non-affiliated Canadian investment dealer would be required to make if this were its own report. For Credit Suisse Securities (Canada), Inc.'s policies and procedures regarding the dissemination of equity research, please visit https://www.credit-suisse.com/sites/disclaimers-ib/en/canada-research-policy.html. Principal is not guaranteed in the case of equities because equity prices are variable. Commission is the commission rate or the amount agreed with a customer when setting up an account or at any time after that. This research report is authored by: Credit Suisse Securities (Philippines) Inc. ........................................................................................................................................... Sofia Cabral Credit Suisse Securities (India) Private Limited .................................................................................................................................... Arnab Mitra To the extent this is a report authored in whole or in part by a non-U.S. analyst and is made available in the U.S., the following are important disclosures regarding any non-U.S. analyst contributors: The non-U.S. research analysts listed below (if any) are not registered/qualified as research
27 September 2016
Jollibee Foods Corporation (JFC.PS / JFC PM) 23
analysts with FINRA. The non-U.S. research analysts listed below may not be associated persons of CSSU and therefore may not be subject to the NASD Rule 2711 and NYSE Rule 472 restrictions on communications with a subject company, public appearances and trading securities held by a research analyst account. Credit Suisse Securities (Philippines) Inc. ........................................................................................................................................... Sofia Cabral Credit Suisse Securities (India) Private Limited .................................................................................................................................... Arnab Mitra
For Credit Suisse disclosure information on other companies mentioned in this report, please visit the website at https://rave.credit-suisse.com/disclosures or call +1 (877) 291-2683.
27 September 2016
Jollibee Foods Corporation (JFC.PS / JFC PM) 24
This report is produced by subsidiaries and affiliates of Credit Suisse operating under its Global Markets Division. For more information on our structure, please use the following link: https://www.credit-suisse.com/who-we-are This report may contain material that is not directed to, or intended for distribution to or use by, any person or entity who is a citizen or resident of or located in any locality, state, country or other jurisdiction where such distribution, publication, availability or use would be contrary to law or regulation or which would subject Credit Suisse or its affiliates ("CS") to any registration or licensing requirement within such jurisdiction. All material presented in this report, unless specifically indicated otherwise, is under copyright to CS. None of the material, nor its content, nor any copy of it, may be altered in any way, transmitted to, copied or distributed to any other party, without the prior express written permission of CS. All trademarks, service marks and logos used in this report are trademarks or service marks or registered trademarks or service marks of CS or its affiliates.The information, tools and material presented in this report are provided to you for information purposes only and are not to be used or considered as an offer or the solicitation of an offer to sell or to buy or subscribe for securities or other financial instruments. CS may not have taken any steps to ensure that the securities referred to in this report are suitable for any particular investor. CS will not treat recipients of this report as its customers by virtue of their receiving this report. The investments and services contained or referred to in this report may not be suitable for you and it is recommended that you consult an independent investment advisor if you are in doubt about such investments or investment services. Nothing in this report constitutes investment, legal, accounting or tax advice, or a representation that any investment or strategy is suitable or appropriate to your individual circumstances, or otherwise constitutes a personal recommendation to you. CS does not advise on the tax consequences of investments and you are advised to contact an independent tax adviser. Please note in particular that the bases and levels of taxation may change. Information and opinions presented in this report have been obtained or derived from sources believed by CS to be reliable, but CS makes no representation as to their accuracy or completeness. CS accepts no liability for loss arising from the use of the material presented in this report, except that this exclusion of liability does not apply to the extent that such liability arises under specific statutes or regulations applicable to CS. This report is not to be relied upon in substitution for the exercise of independent judgment. CS may have issued, and may in the future issue, other communications that are inconsistent with, and reach different conclusions from, the information presented in this report. Those communications reflect the different assumptions, views and analytical methods of the analysts who prepared them and CS is under no obligation to ensure that such other communications are brought to the attention of any recipient of this report. Some investments referred to in this report will be offered solely by a single entity and in the case of some investments solely by CS, or an associate of CS or CS may be the only market maker in such investments. Past performance should not be taken as an indication or guarantee of future performance, and no representation or warranty, express or implied, is made regarding future performance. Information, opinions and estimates contained in this report reflect a judgment at its original date of publication by CS and are subject to change without notice. The price, value of and income from any of the securities or financial instruments mentioned in this report can fall as well as rise. The value of securities and financial instruments is subject to exchange rate fluctuation that may have a positive or adverse effect on the price or income of such securities or financial instruments. Investors in securities such as ADR's, the values of which are influenced by currency volatility, effectively assume this risk. Structured securities are complex instruments, typically involve a high degree of risk and are intended for sale only to sophisticated investors who are capable of understanding and assuming the risks involved. The market value of any structured security may be affected by changes in economic, financial and political factors (including, but not limited to, spot and forward interest and exchange rates), time to maturity, market conditions and volatility, and the credit quality of any issuer or reference issuer. Any investor interested in purchasing a structured product should conduct their own investigation and analysis of the product and consult with their own professional advisers as to the risks involved in making such a purchase. Some investments discussed in this report may have a high level of volatility. High volatility investments may experience sudden and large falls in their value causing losses when that investment is realised. Those losses may equal your original investment. Indeed, in the case of some investments the potential losses may exceed the amount of initial investment and, in such circumstances, you may be required to pay more money to support those losses. Income yields from investments may fluctuate and, in consequence, initial capital paid to make the investment may be used as part of that income yield. Some investments may not be readily realisable and it may be difficult to sell or realise those investments, similarly it may prove difficult for you to obtain reliable information about the value, or risks, to which such an investment is exposed. This report may provide the addresses of, or contain hyperlinks to, websites. Except to the extent to which the report refers to website material of CS, CS has not reviewed any such site and takes no responsibility for the content contained therein. Such address or hyperlink (including addresses or hyperlinks to CS's own website material) is provided solely for your convenience and information and the content of any such website does not in any way form part of this document. Accessing such website or following such link through this report or CS's website shall be at your own risk.
This report is issued and distributed in European Union (except Switzerland): by Credit Suisse Securities (Europe) Limited, One Cabot Square, London E14 4QJ, England, which is authorised by the Prudential Regulation Authority and regulated by the Financial Conduct Authority and the Prudential Regulation Authority. Germany: Credit Suisse Securities (Europe) Limited Niederlassung Frankfurt am Main regulated by the Bundesanstalt fuer Finanzdienstleistungsaufsicht ("BaFin"). United States and Canada: Credit Suisse Securities (USA) LLC; Switzerland: Credit Suisse AG; Brazil: Banco de Investimentos Credit Suisse (Brasil) S.A or its affiliates; Mexico: Banco Credit Suisse (México), S.A. (transactions related to the securities mentioned in this report will only be effected in compliance with applicable regulation); Japan: by Credit Suisse Securities (Japan) Limited, Financial Instruments Firm, Director-General of Kanto Local Finance Bureau ( Kinsho) No. 66, a member of Japan Securities Dealers Association, The Financial Futures Association of Japan, Japan Investment Advisers Association, Type II Financial Instruments Firms Association; Hong Kong: Credit Suisse (Hong Kong) Limited; Australia: Credit Suisse Equities (Australia) Limited; Thailand: Credit Suisse Securities (Thailand) Limited, regulated by the Office of the Securities and Exchange Commission, Thailand, having registered address at 990 Abdulrahim Place, 27th Floor, Unit 2701, Rama IV Road, Silom, Bangrak, Bangkok10500, Thailand, Tel. +66 2614 6000; Malaysia: Credit Suisse Securities (Malaysia) Sdn Bhd, Credit Suisse AG, Singapore Branch; India: Credit Suisse Securities (India) Private Limited (CIN no.U67120MH1996PTC104392) regulated by the Securities and Exchange Board of India as Research Analyst (registration no. INH 000001030) and as Stock Broker (registration no. INB230970637; INF230970637; INB010970631; INF010970631), having registered address at 9th Floor, Ceejay House, Dr.A.B. Road, Worli, Mumbai - 18, India, T- +91-22 6777 3777; South Korea: Credit Suisse Securities (Europe) Limited, Seoul Branch; Taiwan: Credit Suisse AG Taipei Securities Branch; Indonesia: PT Credit Suisse Securities Indonesia; Philippines: Credit Suisse Securities (Philippines ) Inc., and elsewhere in the world by the relevant authorised affiliate of the above. Additional Regional Disclaimers Hong Kong: Credit Suisse (Hong Kong) Limited ("CSHK") is licensed and regulated by the Securities and Futures Commission of Hong Kong under the laws of Hong Kong, which differ from Australian laws. CSHKL does not hold an Australian financial services licence (AFSL) and is exempt from the requirement to hold an AFSL under the Corporations Act 2001 (the Act) under Class Order 03/1103 published by the ASIC in respect of financial services provided to Australian wholesale clients (within the meaning of section 761G of the Act). Research on Taiwanese securities produced by Credit Suisse AG, Taipei Securities Branch has been prepared by a registered Senior Business Person. Malaysia: Research provided to residents of Malaysia is authorised by the Head of Research for Credit Suisse Securities (Malaysia) Sdn Bhd, to whom they should direct any queries on +603 2723 2020. Singapore: This report has been prepared and issued for distribution in Singapore to institutional investors, accredited investors and expert investors (each as defined under the Financial Advisers Regulations) only, and is also distributed by Credit Suisse AG, Singapore branch to overseas investors (as defined under the Financial Advisers Regulations). By virtue of your status as an institutional investor, accredited investor, expert investor or overseas investor, Credit Suisse AG, Singapore branch is exempted from complying with certain compliance requirements under the Financial Advisers Act, Chapter 110 of Singapore (the "FAA"), the Financial Advisers Regulations and the relevant Notices and Guidelines issued thereunder, in respect of any financial advisory service which Credit Suisse AG, Singapore branch may provide to you. UAE: This information is being distributed by Credit Suisse AG (DIFC Branch), duly licensed and regulated by the Dubai Financial Services Authority (“DFSA”). Related financial services or products are only made available to Professional Clients or Market Counterparties, as defined by the DFSA, and are not intended for any other persons. Credit Suisse AG (DIFC Branch) is located on Level 9 East, The Gate Building, DIFC, Dubai, United Arab Emirates. EU: This report has been produced by subsidiaries and affiliates of Credit Suisse operating under its Global Markets Division This research may not conform to Canadian disclosure requirements. In jurisdictions where CS is not already registered or licensed to trade in securities, transactions will only be effected in accordance with applicable securities legislation, which will vary from jurisdiction to jurisdiction and may require that the trade be made in accordance with applicable exemptions from registration or licensing requirements. Non-US customers wishing to effect a transaction should contact a CS entity in their local jurisdiction unless governing law permits otherwise. US customers wishing to effect a transaction should do so only by contacting a representative at Credit Suisse Securities (USA) LLC in the US. Please note that this research was originally prepared and issued by CS for distribution to their market professional and institutional investor customers. Recipients who are not market professional or institutional investor customers of CS should seek the advice of their independent financial advisor prior to taking any investment decision based on this report or for any necessary explanation of its contents. This research may relate to investments or services of a person outside of the UK or to other matters which are not authorised by the Prudential Regulation Authority and regulated by the Financial Conduct Authority and the Prudential Regulation Authority or in respect of which the protections of the Prudential Regulation Authority and Financial Conduct Authority for private customers and/or the UK compensation scheme may not be available, and further details as to where this may be the case are available upon request in respect of this report. CS may provide various services to US municipal entities or obligated persons ("municipalities"), including suggesting individual transactions or trades and entering into such transactions. Any services CS provides to municipalities are not viewed as "advice" within the meaning of Section 975 of the Dodd-Frank Wall Street Reform and Consumer Protection Act. CS is providing any such services and related information solely on an arm's length basis and not as an advisor or fiduciary to the municipality. In connection with the provision of the any such services, there is no agreement, direct or indirect, between any municipality (including the officials,management, employees or agents thereof) and CS for CS to provide advice to the municipality. Municipalities should consult with their financial, accounting and legal advisors regarding any such services provided by CS. In addition, CS is not acting for direct or indirect compensation to solicit the municipality on behalf of an unaffiliated broker, dealer, municipal securities dealer, municipal advisor, or investment adviser for the purpose of obtaining or retaining an engagement by the municipality for or in connection with Municipal Financial Products, the issuance of municipal securities, or of an investment adviser to provide investment advisory services to or on behalf of the municipality. If this report is being distributed by a financial institution other than Credit Suisse AG, or its affiliates, that financial institution is solely responsible for distribution. Clients of that institution should contact that institution to effect a transaction in the securities mentioned in this report or require further information. This report does not constitute investment advice by Credit Suisse to the clients of the distributing financial institution, and neither Credit Suisse AG, its affiliates, and their respective officers, directors and employees accept any liability whatsoever for any direct or consequential loss arising from their use of this report or its content. Principal is not guaranteed. Commission is the commission rate or the amount agreed with a customer when setting up an account or at any time after that. Copyright © 2016 CREDIT SUISSE AG and/or its affiliates. All rights reserved.
Investment principal on bonds can be eroded depending on sale price or market price. In addition, there are bonds on which investment principal can be eroded due to changes in redemption amounts. Care is required when investing in such instruments. When you purchase non-listed Japanese fixed income securities (Japanese government bonds, Japanese municipal bonds, Japanese government guaranteed bonds, Japanese corporate bonds) from CS as a seller, you will be requested to pay the purchase price only.