retail-price drivers and retailer...
TRANSCRIPT

Retail-Price Drivers and Retailer Profits
Vincent Nijs1, Shuba Srinivasan,2 and Koen Pauwels3
October 10, 2005
1 Assistant Professor, Kellogg School of Management, Northwestern University, Phone: (847) 491 4574, Fax: (847) 491 2498, E-mail: [email protected].
2 Associate Professor, The A. Gary Anderson School of Management, University of California, Riverside, CA 92521, Phone: (909) 787-6447, Fax: (909) 787-3970, E-mail: [email protected].
3 Associate Professor, Tuck School of Business at Dartmouth, Hanover, NH 03755, Phone: (603) 646 1097, E-fax:
1 502 396 5295, E-mail: [email protected].
The authors thank Kusum Ailawadi, Eric Anderson, Marnik Dekimpe, Mike Hanssens, Carl Mela, Joel Urbany, and Scott Neslin for their comments and suggestions. The paper also benefited from comments by seminar participants at the 2003 Marketing Science Conference, the Tuck School of Business at Dartmouth, and the Kellogg School of Management. Finally, the authors are grateful to the Dominick’s project at the Graduate School of Business, University of Chicago, and to A.C. Nielsen for making the data available.
Retail-Price Drivers and Retailer Profits
Abstract
What are the drivers of retailer pricing tactics over time? Based on multivariate time-series
analysis of two rich data sets we quantify the relative importance of competitive retailer prices,
past pricing history, brand demand, wholesale price, and retailer category-management
considerations as dynamic drivers of retail prices. Interestingly, competitive retailer prices
account for less than 10% of the over-time variation in retail prices. Instead, pricing history,
wholesale price, and brand demand are the main dynamic drivers of retail-price variation over
time. Moreover, the influence of these price drivers on retailer pricing tactics is linked to retailer
category margin. We find that demand-based pricing and category-management considerations
are associated with higher retailer margins. In contrast, dependence on past pricing history and
pricing based on store traffic considerations imply lower retailer margins.
Key words: retailer price drivers, time series models, generalized forecast error variance
decomposition.

- 1 -
1. Introduction
In today's competitive environment retailers face the complicated task of setting prices for many
items. A typical grocery store in the United States now carries around 31,000 items in
approximately 600 product categories (Kahn and McAlister 1997). A recent article underscores
the complexity of the pricing problem: “While most companies are savvy about cutting costs,
few have figured out how much money they are giving up by using ‘lunk-headed’ pricing due to
a lack of detailed information about market demand” (Business Week 2000). Also, the trade press
suggests that retailers lack good tools for making pricing decisions (AMR Research 2000), as
they have been slow to adopt sophisticated pricing models (Stores 2002). Therefore, model-
recommended courses of action may differ greatly from the actual retail prices observed over
time.
As a result, uncovering the drivers of retail prices is of great importance to marketing
executives and academics. Surprisingly, there has been little empirical research in this area. Two
notable exceptions are Chintagunta (2002) and Shankar and Bolton (2004). The former
investigates category pricing behavior by decomposing retail prices into: Wholesale price,
markup, additional promotional payments, retailer store brand objectives, and inter-retail
competition for a single category in a single retail chain. Our study extends Chintagunta’s work
by using time-series models to develop empirical generalizations on the impact dynamics of:
Cost-, customer-, company-, competitor-, market-, and category-drivers of retail prices over
time, across brands, categories, and stores/chains. Shankar and Bolton (2004) use a cross-
sectional design to study pricing strategies, focusing on price consistency, price-promotion
intensity, price-promotion coordination, and relative brand price level. In contrast, we study
dynamic pricing tactics with a focus on uncovering the drivers of retail prices over time.
From a modeling perspective, our study shares the basic VARX approach with Srinivasan
et al. (2004). However, our research offers contributions in substantive, data, and methodological

- 2 -
areas. First, Srinivasan et al. consider whether manufacturers or retailers benefit more from price
promotions, while we focus on the drivers of retail prices across brands and categories over time.
Second, they study which brand, category, and market conditions influence price promotion
elasticities and the allocation of their benefits across manufacturers and retailers. In contrast, we
link the influence of price drivers on retailer pricing tactics to retailer category margin levels,
while controlling for brand and category characteristics. Our study also offers several
methodological contributions that are discussed in Section 3.
Our research contributes to the existing literature on retail-price drivers by answering
three unresolved questions: What are the drivers of retailer pricing tactics over time? To what
extent do these drivers account for the variation in retail prices over time? And finally, how does
the relative importance of these different drivers affect retailer margins? We address these
questions in three empirical steps. First, we estimate the dynamic interactions between retail
prices and their drivers using time-series models. Generalized Forecast Error Variance
Decomposition (GFEVD) is used to quantify the relative influence of these drivers on retailer
pricing. Finally, we analyze the association between retailer profits (category gross margin) and
the price drivers identified in step two.
The paper is structured as follows: section two describes the drivers of retailer pricing;
section three introduces the methodology, and section four presents the data; the results show the
relative prominence of price drivers in section five, and section six examines the link between
the influence of these price drivers on retailer pricing tactics and retailer category margin. We
conclude with managerial implications and suggestions for future research in section seven.
- 3 -
2. Dynamic Drivers of Retail Prices
Previous marketing literature suggests that retail prices for a focal brand are affected by
competitive retailer pricing and store traffic (e.g., Chintagunta 2002), pricing history of the focal
brand (e.g., Krishna et al. 2001), demand for the focal brand (e.g., Pesendorfer 2001), wholesale
prices of the focal brand (e.g., Krishna et al. 2001), and category-management considerations
(e.g., Zenor 1994).
Competitive retailer activity. Competitive retail activity is expected to influence retailer prices
and performance. For instance, price promotions by competing retailers may reduce store traffic,
inducing the retailer to lower prices (Chintagunta 2002; Hall et al. 1997). However, empirical
evidence on the link between retail prices and store traffic/store switching is mixed. Chintagunta
(2002) concludes retail prices have a weak impact on store traffic for the five brands under
consideration in his study. Likewise, research by Walters and colleagues (e.g.,Walters and
MacKenzie 1988) indicates that the link is weak at best.
Pricing history. Empirical studies on price rigidity show that a large proportion of the variation
in prices, often in excess of 90%, is driven by pricing history (Dutta et al. 2002). For example,
past pricing actions – such as temporary price reductions – can boost sales, inducing the retailer
to promote in subsequent periods even when it lowers retailer profits (Einhorn and Hogarth
1986; Srinivasan et al. 2004). Additional reasons for the dependency on pricing history include
satisficing behavior due to limited information processing capacity (March and Simon 1958),
formal budgeting rules that promote the status quo (Hulbert 1981), loss aversion (Tversky and
Kahneman 1991), and decision anchoring (Plous 1993).
Recent experiments by Krishna et al. (2001) demonstrate that decision anchoring applies
to retail pricing in the form of “a powerful tendency to rely on past prices in determining future

- 4 -
prices” (Krishna et al. 2001, p.1). When given a price history the experiments’ subjects set future
prices too low, mostly because they give more weight to extreme observations (i.e., price deals)
than regular prices. This phenomenon reflects a perceptual averaging of past prices (Alba et al.
1999). Moreover, after a price promotion, retail prices take a longer time to revert back to their
mean than do sales (Srinivasan et al. 2004). Finally, Kopalle et al. (1999), Dekimpe and
Hanssens (1999), and Van Heerde et al. (2000) report that price promotions often lead to
subsequent price promotions.
Given the convergent evidence from theory, experiments, and empirical analyses, we
expect that retail prices for a focal brand will depend strongly on its past retail prices.
Brand demand. Both marketing theory and practice suggest that a brand’s level of demand is an
important input into its pricing decisions. Indeed, a UK survey (Hall et al. 1997) reveals that
retailers rate demand considerations as the most important price driver, ahead of wholesale prices
and inter-retailer competition. In particular, low demand is often a motivation for remedial
action, and (temporary) price reductions offer a quick fix to boost sales and meet performance
quotas (Neslin 2002). Retailers understand the important relationship between price and demand
and use that knowledge when setting retail prices (i.e., a brand’s demand history affects its
current and future prices).
Wholesale prices. Both retailer surveys (Hall et al. 1997) and experimental studies (Krishna et al.
2001) confirm that costs are an important consideration for managers in setting retail prices.
Almost half the marketing budget of consumer packaged goods manufacturers is allocated to
trade deals (Cox Direct 1998). The extensive use of trade deals leads to frequent changes in
wholesale prices and is an important determinant of retailer profitability (Economist 1992).

- 5 -
Retail prices are not only affected by current but also by past wholesale prices, as retailers
forward buy and anticipate trade deal patterns (Hall et al. 2002).
Category management. The move towards category management (Progressive Grocer 2001)
implies that retailers increasingly consider the demand, costs, and prices of competing brands in
a joint decision-making process when setting prices for a focal brand (Zenor 1994). Retailers set
prices for different brands to maximize total category profits (see e.g., Raju et al. 1995), and
prefer to promote only one brand at a time in a given category (Leeflang and Wittink 1992;
Tellis and Zufryden 1995). Manufacturer’s wholesale prices will affect the selection of the brand
(Hall et al. 2002) and may in turn influence the retail prices of all brands in a specific category
(Besanko et al. 2005).
3. Methodology
Our empirical analysis proceeds in three steps. First, we estimate the dynamic interactions
between retail prices and their drivers using Vector-Autoregressive models with eXogenous
variables (VARX). Second, GFEVD is used to quantify the relative influence of these drivers on
retailer pricing. Finally, the influence of these price drivers on retailer pricing tactics, identified
in step two, is linked to retailer profitability. Table 1 provides references for further details.
--- Table 1 about here ---
Step 1: Vector-Autoregressive Model Specification
VARX models are well suited to measure retail-pricing dynamics.1 First, the endogenous
treatment of marketing actions implies that they are explained by both past marketing actions and
past performance variables. Second, VARX models are able to capture complex feedback loops
that may impact retail prices over time. For instance, a price promotion in a given week may
generate a high demand response, inducing the retailer to offer additional price promotions in

- 6 -
subsequent weeks. Competing retailers may respond with price promotions to maintain store
traffic. By capturing such feedback loops, VARX estimation yields a comprehensive picture of
observable retail-price drivers.
In our empirical analysis we use two different data sources: The first contains store-level
data from the Denver area and the second contains store-level data from the Dominick’s retail
chain in the Chicago area. The Denver database provides information on competitive retail prices
but not wholesale prices, while the Dominick’s database contains information on wholesale
prices and store traffic, but not competitive retailer prices (see section 4 for further details).
For the Denver database we estimate a 7-equation VARX model per product category per
store, where the endogenous variables are the sales volume for the top two brands (Si, i=1,2), an
other-brands composite (S3), and the retail prices and competitive retail prices for the two major
brands (RPi and CPi, i=1,2). In addition to the intercept (α), we add five sets of exogenous
control variables: (i) a deterministic-trend t to capture the impact of omitted, gradually-changing
variables, (ii) a set of dummy variables (HD) that equal one in the shopping periods around
major holidays (Chevalier et al. 2003), (iii) four-weekly dummy variables (SD) to account for
seasonal fluctuations in sales or prices, (iv) a step dummy variable for the impact of new-product
introductions (NP), and (v) feature (F) and display (D) variables2 for each brand (see Nijs et al.
2001, Pauwels et al. 2002, and Srinivasan et al. 2004 for a similar specification). The VARX is
described in equation (1):

- 7 -
where Σ is the covariance matrix of the residuals [εS1,t, εS2,t, εS3,t, εRP1,t, εRP2,t, εCP1,t, εCP2,t]’. We
use a stepwise procedure to determine the appropriate lag-length K and to eliminate redundant
parameters (details are provided in Appendix A).3
For the Dominick’s database we estimate an 11-equation VARX model per category per
store, with sales volume of the top three brands (Si, i=1,2,3), an other-brands composite (S4),
wholesale and retail prices of the top three brands (WPi and RPi, i=1,2,3), and store traffic (ST); a
proxy for inter-retailer competition (Chintagunta 2002).4 The exogenous variables are the same
as those in equation (1).5
Our use of VARX models warrants further discussion in light of recent attention to the
implications of the Lucas critique for marketing research (e.g., Bronnenberg et al. 2005; Franses
2005; Van Heerde et al. 2005). In contrast to structural models, our reduced-form models do not
allow us to interpret individual coefficients or draw normative implications. Instead, a reduced-
form VARX model is appropriate for ‘innovation accounting’ (Enders 2004, p 280), i.e.,
1 1 1 1 11 11,
2 2 2 2 21 12,
3 3 3 3 31 13,
1, 1 1 1
2,
1,
2,
H Sh s
S S S ht S st Sh st
H Sh s
S S S ht S st Sh st
H Sh s
S S S ht S st Sh st
ht RP RP RP h
t
t
t
t HD SD NPS
t HD SD NPS
t HD SD NPS
RP t HD
RP
CP
CP
α δ θ λ η
α δ θ λ η
α δ θ λ η
α δ θ
= =
= =
= =
+ + + +
+ + + +
+ + + +
= + +
⎡ ⎤⎢ ⎥⎢ ⎥⎢ ⎥⎢ ⎥⎢ ⎥⎢ ⎥⎢ ⎥⎢ ⎥⎢ ⎥⎣ ⎦
∑ ∑∑ ∑∑ ∑
1,1
1 11 1
2 2 2 2 21 1
1 1 1 1 11 1
2 2 2 2 21 1
H S s
t RP st RPh s
H Sh s
RP RP RP ht RP st RPh s
H Sh s
CP CP CP ht CP st CPh s
H Sh s
CP CP CP ht CP st CPh s
SD NP
t HD SD NP
t HD SD NP
t HD SD NP
β
λ η
α δ θ λ η
α δ θ λ η
α δ θ λ η
= =
= =
= =
= =
++ +
+ + + +
+ + + +
+ + + +
⎡ ⎤⎢ ⎥⎢ ⎥⎢ ⎥⎢ ⎥⎢ ⎥⎢ ⎥⎢ ⎥⎢ ⎥⎢ ⎥⎢ ⎥⎢ ⎥⎣ ⎦
∑ ∑∑ ∑∑ ∑∑ ∑
1,1,7
2,2,1 2,7
3,3,1 3,7
1,4,1 4,71
2,5,1 5,7
1,6,1 6,7
2,7 ,1 7 ,7
1,1 1,
1
0
...
...
...
...
...
...
...
...
k kt k
k kt k
k kt k
Kk k
t kk k k
t k
k kt k
k kt k
l l
l
S
S
S
RP
RP
CP
CP
β
β β
β β
β β
β β
β β
β β
γ γ
−
−
−
−
=
−
−
−
=
+
⎡ ⎤ ⎡ ⎤⎢ ⎥ ⎢ ⎥⎢ ⎥ ⎢ ⎥⎢ ⎥ ⎢ ⎥⎢ ⎥ ⎢ ⎥⎢ ⎥ ⎢ ⎥⎢ ⎥ ⎢ ⎥⎢ ⎥ ⎢ ⎥⎢ ⎥ ⎢ ⎥⎢ ⎥ ⎢ ⎥⎣ ⎦⎣ ⎦
∑
∑
1,4
2,2,1 2,4
1,
3,3,1 3,4
2,
1,4,1 4,4
1,
2,5,1 5,4
2,
1,6,1 6,4
2,7 ,1 7 ,4
...
...
...
...
...
...
S t
S t
t l
S t
t l
RP t
t l
RP t
t l
CP t
CP t
l l
l l
l l
l l
l l
l l
F
F
D
D
ε
εγ γ
εγ γ
εγ γ
εγ γ
εγ γ
εγ γ
−
−
−
−
+
⎡ ⎤ ⎡ ⎤⎢ ⎥ ⎢ ⎥⎢ ⎥ ⎢ ⎥⎡ ⎤⎢ ⎥ ⎢ ⎥⎢ ⎥⎢ ⎥ ⎢ ⎥⎢ ⎥ +⎢ ⎥ ⎢ ⎥⎢ ⎥⎢ ⎥ ⎢ ⎥⎢ ⎥⎢ ⎥ ⎢ ⎥⎣ ⎦⎢ ⎥ ⎢ ⎥⎢ ⎥ ⎢ ⎥⎣ ⎦⎣ ⎦
(1)
- 8 -
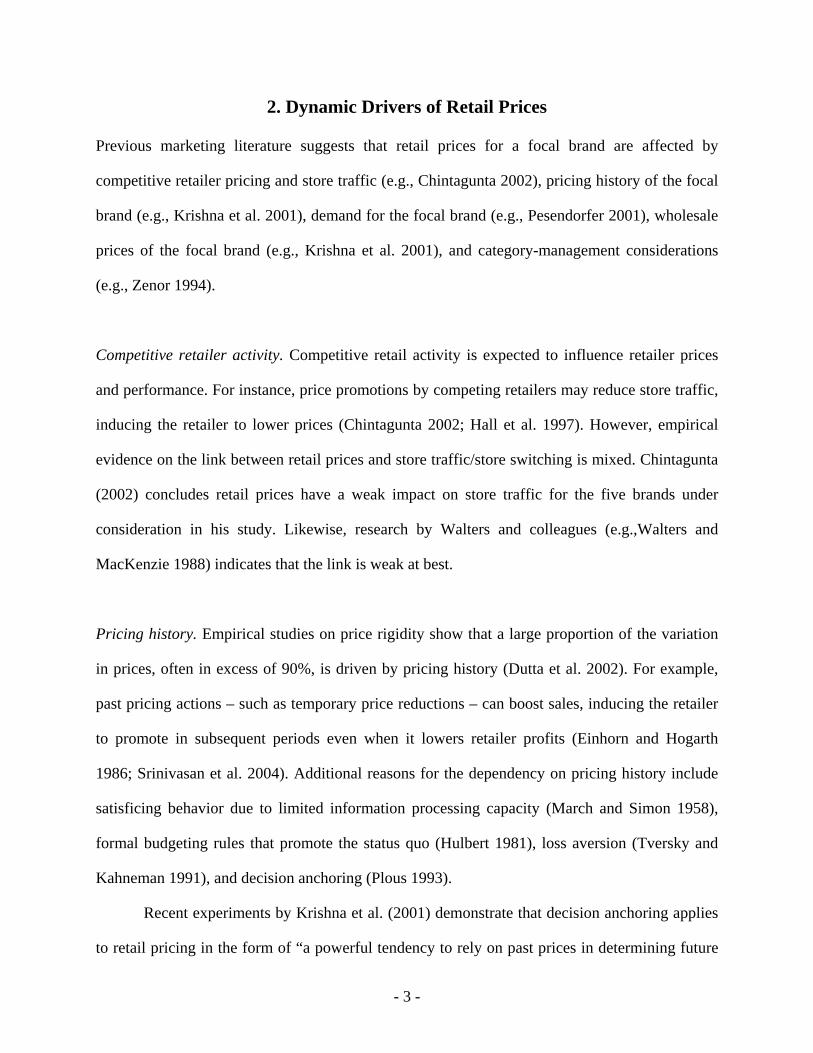
providing descriptive insights on the patterns observed in the data using variance decomposition
and/or impulse response analysis. The purpose of this paper is to assess which factors drive retail
prices over time. Hence, we do not impose structural restrictions on the dynamic relations
between variables (see Sims 1980; Sudhir 2001). Rather, we focus on developing a rich and
flexible empirical model of retail pricing (see also Besanko et al. 2005 for a recent discussion of
the merits of reduced-form models). An important assumption of our approach is that
innovations or ‘shocks’ do not alter the nature of the underlying data generating process (Darnell
and Evans 1990, p. 121). Since we are interested in tactical ‘day-to-day’ pricing, rather than
strategic regime changes, the use of a reduced-form VARX model is appropriate (Van Heerde et
al. 2005). Moreover, the proposed VARX model explicitly accounts for endogeneity; an
important threat to consistency (Franses 2005, p. 12).
Step 2: Dynamic Price Drivers: Generalized Forecast Error Variance Decomposition
We use GFEVD (Pesaran and Shin 1998) to quantify the dynamic influence of competitive retail
prices, brand demand, wholesale price and competitive wholesale price, and category-
management considerations on a brand's retail price. In essence, GFEVD provides a measure of
the relative impact over time of shocks initiated by each of the individual endogenous variables
in a VARX model (see Hanssens 1998 for a marketing application of FEVD).6 Analogous to a
‘dynamic R2’, it calculates the percentage of variation in retailer pricing for a brand that can be
attributed to both contemporaneous and past changes in each of the endogenous variables in
equation (1) (including retailer pricing for the brand itself; i.e., pricing history). An important
issue in standard FEVD is the need to impose a causal ordering for model identification
purposes. In practical applications of FEVD, available theory is often insufficient to justify the
selection of one ordering over another. Indeed, since we seek to identify and quantify drivers of

- 9 -
retail prices any imposed ordering appears troublesome. Therefore, we minimize the impact of
variable ordering by estimating GFEVD (Pesaran and Shin 1998) using equation (2):
( )( )( )( )( )
2
02
0 1
, , 1, , . (2)t g
ijg lij t m g
ijl j
lt i j m
l
ψθ
ψ=
= =
= =∑
∑ ∑K
where ( )lgijψ is the value of a Generalized Impulse Response Function (GIRF) following a shock
to variable j on variable i at time l.7 For details on the calculation of GIRFs see, for example,
Dekimpe and Hanssens (1999) and Nijs et al. (2001).8 Moreover, our GFEVD metric is an
extension of the one introduced by Pesaran and Shin 1998, since it will always sum to 100%.
The relative importance of the drivers is derived from the GFEVD values at 26 weeks,
which reduces sensitivity to short-term fluctuations.9 To evaluate the accuracy of our GFEVD
estimates, we obtain standard errors using Monte Carlo simulations (see Benkwitz et al. 2001
and Horváth 2003 for an equivalent procedure to estimate the standard errors for IRFs).
Step 3: Relating Dynamic Price Drivers to Retailer Performance
In the final step of our analysis we investigate the link between the influence of these price
drivers on retailer pricing tactics identified in step two and retailer category margin. The
independent variables are the driver importance metrics for the various price drivers quantified in
step two. We are mainly interested in how the influence of these retail-price drivers on retailer
pricing tactics is related to retailer margins, however, we do control for a series of covariates
based on prior research (Bell et al. 1999; Blattberg et al. 1995; Narasimhan et al. 1996; Nijs et al.
2001; Srinivasan et al. 2004). Specifically, we estimate the following regression equation:
0 1 2 3 4 5 6 1
2 3 4 5
6 7
(
_ _ _
) (3)
jk jk ijk ijk ijk ijk ijk ijk
jk jk jk jk
k k jk
MARGIN ST PH BD WP CMP CMC NB
PROM FRQ PROM DPT CAT CONC NRBR
STOCK IMPULSE
α α α α α α α β
β β β β
β β ε
= + + + + + + +
+ + + +
+ + +

- 10 -
where jkMARGIN is the margin in category k in store j and jkε is the error term. We denote the
price drivers for brand i by ST (store traffic), PH (pricing history), BD (brand demand), WP
(wholesale price), CMP (category management -- price) and CMC (category management --
cost).10 The covariates are NB (national brand vs. private label), PROM_FRQ (price-promotional
frequency), PROM_DPT (price-promotional depth), CAT_CONC (category concentration),
NRBR (number of brands in the category), STOCK (ability to stockpile) and IMPULSE (is the
product an impulse good). Measurement details are provided in Appendix B.
Estimation of equation (3) by OLS (θOLS ) will provide consistent parameter estimates
(see Murphy and Topel 1985). However, the standard errors of these parameters may be biased
since the price drivers are estimated with error. We use the bootstrap method outlined in
Appendix A.2 to obtain corrected standard errors.
In addition to the substantive differences to Srinivasan et al. (2004) outlined in the
introduction, our paper offers important contributions in terms of methodology and richness of
data. First, we analyze an additional dataset to Srinivasan et al.: The Denver data, for which
competing retailer prices are available. Second, while they study 25 categories within a single
retail chain, our study is based on an analysis of 10,850 brand-store combinations in multiple
chains in two retail markets. As such, the extensive data allow us to draw meaningful empirical
generalizations. Third, while they use impulse response functions, we apply Generalized
Forecast Error Variance Decomposition (GFEVD) for the first time in marketing. Our estimates
are obtained from a rich VARX model to which we apply an innovative specification algorithm
that ensures well-behaved residuals and model parsimony. This allows us to accurately quantify
the dynamic influence on a brand’s retail price of its own past price, competitive retail prices,
brand demand, wholesale price and competitive wholesale price, and category-management

- 11 -
considerations. Finally, we develop a bootstrap algorithm to correct the standard error bias
introduced when using OLS to estimate a two-stage econometric model.
To review and illustrate our approach, Panel A in Figure 1 shows output of the GFEVD
for two brands in a Dominick’s store in the toothbrush category. Panel B in Figure 1 shows the
GFEVD for two brands in the cheese category in the same Dominick’s store.
--- Figure 1 about here ---
Past price dependence is the dominant driver for the two brands in the toothbrush
category, explaining respectively [72%, 74%] of the variation in prices. Brand demand accounts
for only [5%, 7%] of the variation. The remaining price drivers – category-management
considerations (demand, price, and costs of competing brands), wholesale prices, and store traffic
– account for the remaining variation in retail prices, respectively [23%, 19%]. In sharp contrast
to the toothbrush category, past price dependence explains [39%, 41%] of the variation in retail
prices for the two brands in the cheese category. Brand demand accounts for [27%, 22%] and
wholesale prices account for [21%, 21%] of the variation; category-management considerations
and store traffic account for the remainder of the variation in retail prices [13%, 16%].
The average weekly retailer gross margin in a category is $510 per store. For the
toothbrush category [Panel A, Figure 1] the weekly retail profit is no more than $39, i.e., 92%
below the $510 average cross-category profit. In contrast, the weekly retail profit is $2018 for
the cheese category [Panel B, Figure 1], i.e., a striking 295% above average. In the former case, a
higher emphasis on past pricing history in setting retail prices is associated with lower retailer
margins. In contrast, in the latter case, a higher emphasis on brand demand in setting retail prices
is associated with higher retailer margins. Evidently, besides price drivers, these categories may
also show differences in the characteristics included as covariates in equation (3). The relevant
question then becomes whether these examples are representative of a more general pattern. We
investigate this issue in sections 5 and 6.

- 12 -
4. Data Description
We use data from two sources: Store-level scanner data from multiple retail chains in the Denver
market and from the Dominick's retail chain in Chicago. We describe these databases below.
4.1 Denver Data
Data from the Denver market, provided by A.C. Nielsen, consists of weekly store-level data for
the period 01/02/93 through 05/13/95 (123 weeks).11 For each of 55 supermarkets, the data
contain the weekly sales, prices, newspaper feature ads, coupons, and in-aisle display activity for
each of the products carried in 43 categories. We focus on the top two brands in each category in
each store; a total of 4,730 brand-store combinations. This data set offers the opportunity to
evaluate the impact of competitive retailer activity on pricing, however, it does not have
information on wholesale prices charged by manufacturers.
4.2 Dominick's Data
The second database contains scanner records for 24 product categories in 85 stores from the
Dominick’s retail chain; one of the two largest chains in the Chicago area. Data are available
from September 1989 to May 1997; a total of 399 weeks. Relevant variables include: sales, retail
and wholesale prices, feature and display, and store traffic. We focus on the top three brands in
each category in each store; a total of 6,120 brand-store combinations. This data set allows us to
investigate the link between price drivers and retailer margins, however, it does not contain
information on prices in competing retail stores.

- 13 -
5. Results: Dynamic Drivers of Retail Prices
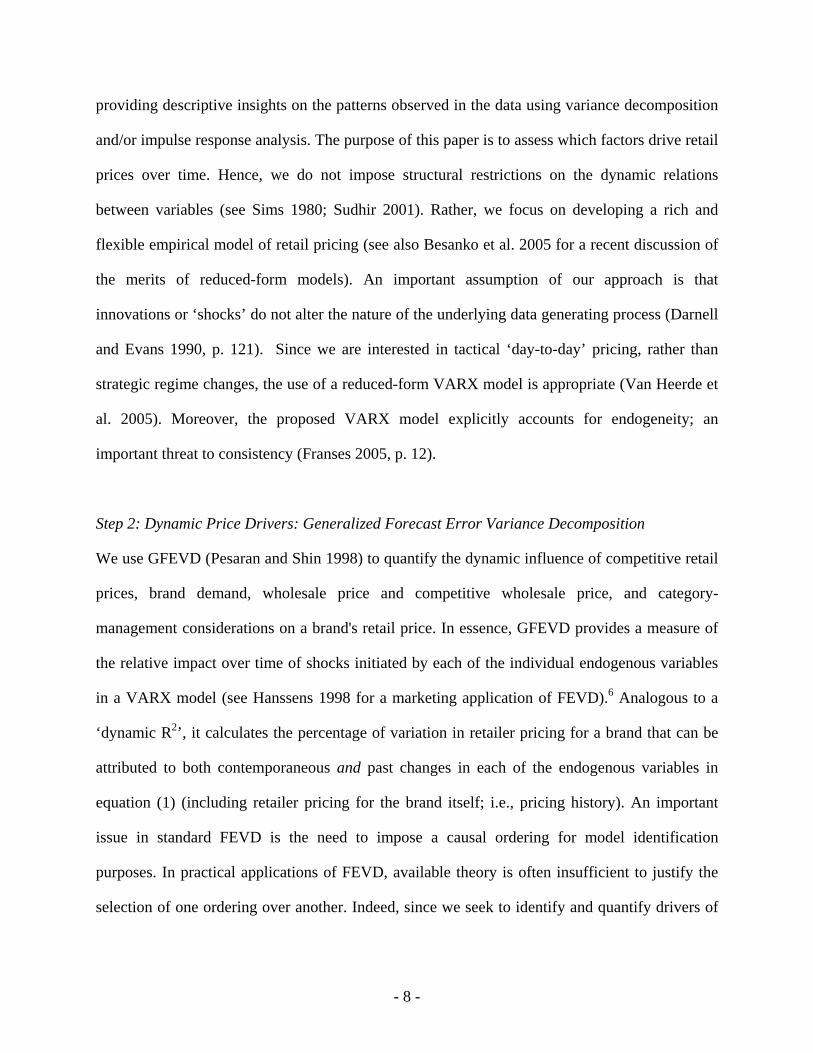
Based on our GFEVD analysis, we derive empirical generalizations on the drivers of retail prices
and summarize them in Table 2. Detailed findings per category are reported for the Denver data
in Table 3 and for the Dominick's data in Table 4.
--- Tables 2, 3 and 4 about here ---
Competitive retail activity. For the Denver data competitive retailer prices account for 5.5%
(3.1% + 2.4%) of the dynamic fluctuations in retail prices across the 43 categories. This finding
is consistent with previous research which suggests that, even though retailers track each others’
prices, inter-retailer competition accounts for only a small proportion of the variation in retail
prices (e.g., Urbany et al. 2000; Chintagunta 2002). Indeed, Rao et al. (1995) demonstrated the
empirical regularity that retail-price promotions are essentially independent across competitors.
Their theoretical explanation is that retail-price promotions are competitive mixed strategies.
Since each firm is uncertain about its competitor’s strategy, its promotion (re)actions must be
independent of its competitor’s action. If this is the case, one should observe each retailer
promoting with the same probabilities both when the competitive retailer promotes and when she
does not promote. Hence, competitive retail promotions should be independent; a claim validated
by our empirical results. For the Dominick’s data, we use store traffic as a proxy for inter-retailer
competition. Again, we find that lower store traffic triggers only a minimal dynamic price
response in subsequent weeks. This result is generalized across all categories and consistent with
previous reports of weak links between price promotions and store traffic (see, for example,
Walters and Rinne 1986; Walters and Mackenzie 1988). Our findings are also in line with those
of Shankar and Bolton (2004) who study strategic pricing issues (see the last author’s website for
a detailed comparison of findings).
Pricing history. A brand’s past prices are the dominant driver of retail prices in each category
studied; they account for 62.3% of the dynamic variation in retail prices for the Denver data and

- 14 -
for 49.6% of the dynamic variation in retail prices for the Dominick's data. Our result on pricing
history confirms that there is a “powerful tendency to rely on past prices in determining future
prices” (Krishna et al. 2001). We further investigate the performance implications of this
behavior in section 6.
Brand demand. Brand demand accounts for approximately 15.9% of the variation in retail prices
for the Denver data and for 11.4% of the variation in retail prices for the Dominick’s data. These
results indicate that retailers acknowledge the essential relationship between prices and sales and
incorporate demand considerations into retail pricing decisions (Hall et al. 1997).12
Wholesale price. Wholesale prices are an important driver of retail prices across categories and
account for 26.4% of the variance in retail price in the Dominick’s data set, second only to
pricing history. Retailers clearly take wholesale prices into consideration when setting retail
prices. Information on wholesale prices is not available for the Denver data.
Category management. Category-management considerations account for 9.6% (3.0% + 6.6%)
of the variation in retail prices in the Denver data, and for 7.9% (2.5% + 2.8% + 2.6%) of the
variation in retail prices for the Dominick’s data.13 Consistent with reported practice (Hall et al.
2002), category-management considerations are less important in driving retail prices compared
to pricing history and brand demand.
A notable exception to this empirical generalization is the highly competitive soft drink
category, where competing brands’ demand, costs, and prices account for over 26.1% of
variation in prices (Dominick’s). Prior evidence of alternating retail-price promotions by major
competitors Coke and Pepsi (see, for example, Lal 1990) offers a plausible explanation for this
result. Furthermore, for Coke and Pepsi in the Dominick’s stores, the brand’s price accounts for

- 15 -
approximately 47% of the variation while competitive price accounts for 17%;,close to a two
thirds/one third split between these two components (see Krishna 1994).
In sum, across 10,850 brand-store combinations in 67 categories in two different retail areas, we
find the following order of importance among dynamic retail-price drivers for the Denver and
Dominick’s data sets: Pricing history (62.3%, 49.6%), wholesale price (26.4%, Dominick’s
only), brand demand (15.9%, 11.4%), category management (9.6%, 7.9%), and retail
competition (5.5% Denver data only)/store traffic (0.7% Dominick’s data only). Our results from
step two show considerable variability in the relative importance of price drivers across
categories, which we explore next.
6. Results: Retail Price Drivers and Retailer Profits
In the third and final stage of our empirical analysis, we examine the link between retailer gross
category margin and the importance of each retail-price driver for the Dominick’s data set. Since
retailer gross category margins are available only for the Dominick’s data, a similar analysis for
the Denver data set is infeasible.14
--- Table 5 about here ---
Competitive retailer activity. Our findings indicate that when store traffic considerations feature
more prominently in retailer pricing, retailer margins are lower. This may occur if the added
revenues from incremental demand are not large enough to compensate for the margin loss on
subsidized sales (Drèze 1995). As expected, pricing a category as a ‘loss-leader’ can diminish
category profits.
Pricing history. The rationale for past price dependence is a debated issue in the marketing and
economics literature. Past price dependence may be caused by the inability of managers to deal

- 16 -
with multiple objectives in the face of limited information (Nagle and Holden 1995) and
complicated demand dynamics (Kopalle et al. 1999) or may result from profit optimization
behavior (Maskin and Tirole 1988). As the influence of past price dependence in retail pricing is
associated with lower retailer margins, our results are consistent with the former view. This
finding reflects both anecdotal (Business Week 2000) and experimental evidence (Krishna et al.
2001) of limited managerial sophistication in pricing.
Brand demand. Being customer-oriented requires a detailed understanding of the dynamic price-
demand response of consumers (e.g., Hall et al. 1997). For instance, unsatisfactory performance
may lead managers to take corrective marketing and pricing actions to improve results in
subsequent periods. Such demand understanding should increase the profit impact for the retailer
(Hall et al. 2002). Our results suggest that demand-based considerations in retail pricing are
indeed associated with higher retailer profitability.
Wholesale price. In contrast, the importance of wholesale prices in retailer price setting does not
significantly impact retailer margins. This does not imply that retailers should ignore costs.
However, it suggests that rigid adherence to a cost-plus pricing approach does not hurt nor
benefit retail margins. Since manufacturers may have different goals and pay-offs from
promotions (e.g., Villas-Boas and Lal 1998), it is not always in the best interest of the retailer to
simply pass-through manufacturer price changes (Besanko et al. 2005). Instead, pass-through
rates should depend on retailer profit considerations, such as category management and the price
sensitivity of consumer demand (Moorthy 2005; Tyagi 1999).
Category management. We find that the category management price driver is associated with
higher retailer margin. This finding lends support to the promise of increased retailer profitability
from the adoption of category-management pricing practices (e.g., Zenor 1994; Progressive

- 17 -
Grocer 2001). Most notably, it is consistent with Hall et al.’s (2002) demonstration that a retailer
would benefit from moving from single brand profit optimization to category profit optimization.
7. Implications and Conclusions
Based on our analysis of 10,850 brand-store combinations in 67 categories in two retail areas, we
conclude that retail prices are driven by, in order of importance: 1) pricing history, 2) wholesale
prices, 3) brand demand, 4) category management, and 5) store traffic/inter-retailer price
competition. Our study offers several actionable implications for marketing researchers,
manufacturers, and retailers:
Implications for Marketing Researchers: Our approach offers several improvements over extant
methodology. First, our VARX model specification algorithm enhances efficiency and
parsimony. It ensures that the model residuals are well behaved (i.e., no autocorrelation) while
limiting the level of parameterization. This is especially important given the size of the VARX
needed to study price drivers and the high degree of autocorrelation found in both data bases
used in this research. Second, we apply GFEVD for the first time in marketing. Finally, we
develop a bootstrap procedure to correct the standard-error bias introduced when using OLS to
estimate a two-stage econometric model.
Implications for Manufacturers: First, our extensive analysis of price drivers provides insights
into inter-brand competition by quantifying the extent to which prices and demand of competing
brands determine retail prices. Second, our findings indicate which manufacturers/brands need to
be most concerned about competitive brands. This is reflected in the relative importance of
competitive brands’ prices and demand as drivers of the focal brand’s retail price. Third, this

- 18 -
study helps manufacturers get a better understanding of retail pricing and the extent to which
they are affected by wholesale prices for individual retail chains. These insights cannot be
obtained just by observing retail prices due to the confounding effects of other retail price
drivers.
Implications for Retailers: First, from a retailer’s perspective, the striking differences in price
driver importance across brands and categories should give pause. Are these differences
intentional? Did they result from a routine based on principles that were once valid but are now
obsolete? While only retailers themselves can truly answer these questions, our findings can help
them pose the right questions. Second, retailers are interested in the extent of inter-retail
competition in their markets: Strong competitive pricing reaction could greatly affect the
outcome of their own actions. Our findings on inter-retail competition help retailers put such
competitive concerns into perspective. Finally, our results demonstrate the importance of
understanding which retail price drivers improve profit performance. Specifically, customer-
oriented, or demand-based, pricing combined with the move towards ECR and category
management has positive bottom-line profit implications, while rigid adherence to cost-plus
pricing by the retailer does not help (or hurt) margins. Moreover, our research shows that pricing
a category as a loss leader will hurt category profitability while inertia in retailer price-setting is
also decidedly unprofitable.
Overall, our findings raise several important questions for future research. Why is pricing
history such a dominant driver of retail-price setting? Interviews with retailers may reveal
motivations such as pricing complexity, preference for the status quo, fear of competitive
reaction, etc. Although our current research has assessed the link between drivers of retail prices
and the profit consequences of these drivers, future studies should seek explanations for the
observed differences in retail-price drivers across categories. For example, the antecedents of

- 19 -
price drivers could be related to specific brand, market structure, and product category
characteristics.
Our study has several limitations that are at the same time opportunities for future
research. First, the Dominick’s database provides information on wholesale prices and margins,
but lacks data on manufacturer promotional expenses such as, slotting allowances, buy-back
charges, and failure fees. Second, our data do not allow us to account for certain potential retail
price drivers, such as manufacturer advertising and other brand building activities. Third, due to
data limitations we are not able to specify models that incorporate both wholesale prices and
retailer competition simultaneously. Fourth, we include the top two brands in the model for the
Denver data and the top three brands in the model for the Dominick’s data. Ideally we would
include data on all brands, but this would significantly increase the level of parameterization in
our model and severely limit our ability to provide detailed estimates of pricing dynamics.
Finally, although our study uncovers associations of price drivers and performance, it cannot
prove the existence of causal relationships.
We conclude by suggesting that retailers need to find opportunities to price products that
will enhance profitability in an industry where margins are under ever increasing pressure. We
identify the price drivers that generate these opportunities. Moreover, our research sheds light on
the tradeoffs that retailers face when focusing on the different dynamic drivers of retail prices.
Understanding and formalizing these tradeoffs remains a fascinating area for marketing
researchers and practitioners.

Figure 1: Plot of retail price drivers for two leading brands in two categories
Panel A: Toothbrush category
Panel B: Cheese category
0%
10%
20%
30%
40%
50%
60%
70%
80%
Pricing
histo
ry
Deman
d
Who
lesale
price
Cat_Pric
e
Cat_Dem
and
Cat_Cos
t
Store t
raffic
Brand 1Brand 2
0%
5%
10%
15%
20%
25%
30%
35%
40%
45%
Pricing
histo
ry
Deman
d
Who
lesale
price
Cat_Pric
e
Cat_Dem
and
Cat_Cos
t
Store t
raffic
Brand 1Brand 2

Table 1: Overview of analysis steps
Methodology
Econometrics literature
Marketing literature
Research questions
1A.Unit root tests Augmented Dickey-Fuller Structural break test
Enders (2004) Perron (1989) Perron (1990) Zivot and Andrews (1992)
Pauwels et al. (2002) Kornelis et al. (2001)
Are performance and marketing variables (mean/trend) stationary or evolving (unit root)? Is there a structural break in the time series of the performance and price variables?
1B. VARX model Vector Autoregressive model with exogenous variables (VARX)
Lütkepohl (1993)
Dekimpe and Hanssens (1995) Nijs et al. (2001) Srinivasan et al. (2004)
How do performance and price variables interact, accounting for exogenous factors?
2. Variance decomposition Forecast error variance decomposition Generalized Forecast error variance decomposition
Enders (2004) Pesaran and Shin (1998)
Hanssens (1998) Pauwels et al. (2004) This paper
What are the drivers of retail price…? …without imposing a causal ordering on the variables?
3 Second-stage regression Regression analysis linking the results of steps 2 and 3
Greene (1997) Murphy and Topel (1985) Bradley and Tibshirani (1993)
Nijs et al. (2001) Srinivasan et al. (2004)
Are price drivers associated with retailer profits?

Table 2: Dynamic drivers of retail prices across categories (summary)
Retail-price drivers Denver data
Median (n=3460)
Dominick’s data
Median (n=5190) Competitive retail activity
Competitive retail price Store traffic
5.5%
---
---
0.7%
Pricing history
62.3% 49.6%
Brand demand
15.9%
11.4%
Wholesale price
--- 26.4%
Category management
9.6% 7.9%
Note: From the GFEVD, we obtain the estimates in Tables 2, 3, and 4 as follows: For the Denver data price drivers are measured as follows: • Competitive retail activity is measured as the sum of the following two drivers:
o Competitive Retail Price Same Brand (CRPS) is the percentage of variability in retail prices accounted for by the prices of the same brand charged by competing retailers.15
o Competitive Retail Price Competing Brand (CRPC) is the percentage of variability in retail prices accounted for by the prices of the competing brand charged by competing retailers.
• Pricing history (PH) is the percentage of variability in retail prices accounted for by past prices. • Brand demand (BD) is the percentage of variability in retail prices accounted for by a brand’s sales volume. • Category management is measured as the sum of the following two drivers:
o Category Management Price (CMP) is the percentage of variability in retail prices accounted for by the price of the competing brand in the category (i.e., the sum of variance explained by the price of each competing brand).
o Category Management Demand (CMD) is the percentage of variability in retail prices accounted for by the sales volume of the competing brand in the category (i.e., the sum of variance explained by the demand for each competing brand).
For the Dominick’s data drivers are measured as follows: • Competitive retail activity:
o Store traffic (ST) is the percentage of variability in retail prices accounted for by store traffic. • Pricing history (PH) is the percentage of variability in retail prices accounted for by past prices. • Brand demand (BD) is the percentage of variability in retail prices accounted for by a brand’s sales volume. • Wholesale price (WP) is the percentage of variability in retail prices accounted for by wholesale price of the
brand. • Category management is measured as the sum of the following three drivers:
o Category Management Price (CMP) is the percentage of variability in retail prices accounted for by the price of the two competing brands in the category.
o Category Management Demand (CMD) is the percentage of variability in retail prices accounted for by the demand for the two competing brands in the category.
o Category management Cost (CMC) is the percentage of variability in retail prices accounted for by the cost of the two competing brands in the category (i.e., the sum of variance explained by the cost of each competing brand).
Table 3: Dynamic drivers of retail prices based on GFEVD analysis -- Denver data 25th Median 75th 25th Median 75th 25th Median 75th 25th Median 75th 25th Median 75th 25th Median 75th
Jams 0.6% 1.9% 5.3% 1.1% 2.8% 5.0% 55.3% 59.5% 67.0% 13.7% 21.5% 24.7% 1.7% 3.7% 6.5% 3.2% 7.0% 10.6%Jelly 1.2% 2.5% 4.6% 1.0% 1.9% 4.2% 54.3% 61.3% 68.5% 14.4% 19.2% 24.1% 2.2% 4.1% 6.7% 4.1% 6.7% 10.4%Peanut Butter 1.7% 4.3% 8.0% 1.4% 2.8% 5.3% 56.3% 66.4% 74.8% 8.0% 12.7% 17.2% 1.3% 2.4% 5.1% 3.5% 5.4% 9.1%Apple Juice 0.9% 1.8% 4.7% 0.9% 2.0% 3.6% 61.8% 69.1% 76.8% 12.1% 17.5% 21.0% 1.1% 2.3% 5.0% 2.7% 4.4% 7.9%Grape Juice 1.3% 3.7% 6.9% 0.5% 0.9% 2.6% 74.9% 80.0% 86.9% 4.8% 7.0% 8.1% 0.5% 1.4% 2.8% 2.8% 4.7% 7.2%Orange Juice (canned) 1.1% 2.2% 5.7% 2.1% 3.8% 8.3% 66.1% 69.9% 76.1% 3.7% 7.6% 15.6% 1.8% 4.8% 8.3% 4.6% 6.5% 10.4%Orange Juice (other) 1.1% 2.1% 4.4% 0.9% 1.7% 3.8% 54.0% 60.9% 67.7% 15.4% 21.9% 27.6% 1.2% 2.1% 4.2% 4.2% 6.7% 9.1%Margarine 0.8% 2.2% 4.5% 0.7% 1.8% 3.2% 48.2% 54.0% 60.0% 19.9% 24.8% 27.6% 2.5% 4.9% 10.0% 4.8% 7.9% 12.6%Orange Juice (frozen) 1.4% 2.3% 4.2% 0.4% 1.2% 2.9% 54.5% 63.1% 72.4% 12.3% 18.7% 25.2% 1.6% 4.2% 7.3% 3.1% 5.2% 9.9%Tomato Juice 1.2% 2.4% 4.1% 1.5% 1.9% 3.4% 53.7% 58.4% 60.6% 15.1% 24.2% 26.5% 2.2% 3.0% 5.2% 6.8% 10.9% 14.2%Macaroni 0.5% 1.3% 2.6% 0.8% 1.3% 2.9% 51.7% 63.3% 69.5% 15.1% 21.1% 27.7% 1.2% 2.9% 5.2% 4.3% 8.3% 11.5%Spaghetti 0.6% 1.1% 2.5% 1.1% 2.0% 4.0% 52.0% 56.8% 63.0% 16.5% 23.6% 28.1% 1.0% 3.0% 5.7% 5.5% 11.2% 15.2%Softdrinks (diet) 2.3% 4.9% 8.4% 2.9% 5.6% 10.6% 45.5% 56.5% 67.2% 6.9% 10.8% 15.4% 4.6% 6.9% 9.8% 5.8% 9.8% 16.0%Shampoo 2.1% 3.8% 6.2% 1.0% 2.9% 6.2% 48.5% 62.3% 71.9% 8.1% 13.4% 22.8% 1.3% 3.1% 5.8% 5.0% 7.7% 13.8%Conditioners 1.8% 4.6% 8.2% 0.8% 3.3% 6.2% 49.4% 58.3% 72.5% 9.3% 16.6% 25.8% 1.2% 2.6% 5.6% 3.6% 6.4% 12.3%Softdrinks (regular) 2.5% 4.8% 10.5% 1.5% 3.5% 6.3% 47.0% 57.0% 73.7% 7.5% 11.4% 17.2% 2.1% 3.2% 7.4% 7.5% 11.3% 18.7%Artificial Sweetners 0.9% 2.2% 4.2% 1.2% 2.1% 4.7% 61.0% 74.1% 82.7% 4.1% 5.6% 16.1% 1.2% 2.7% 6.6% 3.6% 5.0% 8.8%Soup (canned) 2.7% 3.7% 5.4% 0.9% 1.9% 4.1% 54.0% 58.7% 62.5% 23.1% 26.6% 30.1% 0.7% 1.6% 3.0% 2.5% 4.8% 7.4%Soup Mix 1.4% 2.4% 4.8% 0.7% 2.0% 2.4% 64.9% 69.1% 82.8% 8.3% 14.1% 18.8% 1.5% 1.8% 5.0% 3.3% 4.8% 6.9%Spaghetti (sauce) 1.2% 2.6% 5.7% 1.0% 2.4% 5.0% 57.8% 65.9% 73.9% 6.5% 16.9% 24.2% 1.6% 2.7% 5.7% 2.5% 4.5% 9.9%Spaghetti (mix) 0.3% 2.0% 6.5% 0.5% 1.2% 5.2% 61.3% 77.4% 84.6% 1.3% 3.7% 7.7% 0.7% 1.8% 4.4% 2.7% 5.3% 9.1%Cookies 1.1% 3.0% 4.6% 0.8% 1.8% 4.7% 59.5% 63.4% 73.5% 11.2% 19.4% 26.8% 1.2% 2.4% 4.3% 3.0% 4.3% 7.7%Syrup 1.7% 4.2% 7.2% 1.2% 4.0% 7.6% 49.6% 58.5% 69.6% 10.7% 18.2% 22.4% 1.1% 3.0% 5.4% 4.5% 7.5% 11.2%Tea bags 1.0% 2.3% 4.2% 1.1% 2.2% 3.6% 59.0% 67.8% 75.8% 9.3% 14.2% 21.2% 1.1% 1.8% 4.4% 4.5% 7.2% 9.3%Tea (liquid) 1.9% 7.1% 12.7% 1.5% 2.5% 5.1% 54.5% 61.7% 68.0% 7.7% 11.6% 17.2% 2.6% 5.2% 7.7% 4.7% 6.5% 11.6%Beer 3.4% 9.0% 17.2% 1.9% 4.3% 7.5% 30.8% 52.3% 67.5% 6.9% 11.8% 15.7% 1.5% 4.8% 22.3% 4.4% 9.3% 15.1%Light Beer 6.4% 7.5% 13.2% 4.8% 6.7% 8.6% 40.8% 48.4% 53.2% 7.3% 11.4% 18.8% 7.1% 10.1% 13.7% 7.4% 10.8% 15.5%Cereal 1.4% 2.8% 5.2% 1.2% 2.3% 4.5% 49.0% 57.6% 64.3% 18.6% 23.8% 29.8% 1.2% 3.0% 6.9% 2.5% 6.0% 11.1%Frosting 3.0% 7.1% 11.8% 1.4% 3.4% 5.3% 52.9% 60.0% 70.6% 6.0% 10.5% 15.0% 1.8% 4.5% 7.2% 5.8% 9.3% 13.8%Cake Mix 2.0% 3.6% 11.0% 0.7% 1.5% 2.6% 52.6% 61.3% 68.8% 11.8% 16.7% 23.8% 1.0% 1.7% 4.0% 6.1% 8.2% 11.4%Coffee (ground) 7.8% 24.8% 31.9% 7.9% 16.8% 27.7% 20.0% 30.3% 40.4% 5.0% 8.2% 12.1% 2.6% 5.9% 15.3% 3.2% 5.4% 8.2%Coffee (soluble) 8.3% 16.9% 45.4% 15.0% 19.9% 24.1% 24.4% 28.1% 40.8% 3.8% 5.2% 6.7% 3.7% 5.5% 9.3% 2.5% 5.0% 9.6%Cigarettes 6.3% 10.3% 26.6% 2.6% 4.9% 9.1% 38.8% 45.5% 60.8% 5.1% 9.4% 12.1% 3.3% 8.6% 10.9% 4.7% 6.0% 9.9%Soda 2.1% 4.1% 9.2% 1.0% 2.7% 4.7% 51.2% 60.6% 71.9% 7.4% 15.0% 19.4% 1.1% 3.0% 5.7% 5.0% 10.0% 15.1%Sprayed Butter 1.0% 4.2% 11.0% 1.2% 2.5% 4.8% 47.7% 67.6% 77.1% 8.2% 12.4% 17.1% 2.2% 4.6% 8.0% 3.0% 5.8% 11.6%Flavored Snacks 1.6% 6.2% 12.3% 1.3% 3.3% 7.4% 51.0% 63.3% 71.4% 6.8% 11.1% 15.8% 0.8% 1.7% 5.2% 3.0% 7.6% 11.0%Detergent (powder) 0.9% 2.4% 4.9% 1.6% 2.7% 6.1% 54.5% 62.8% 72.1% 12.7% 17.2% 27.1% 1.0% 2.3% 5.4% 3.2% 5.7% 9.0%Detergent (liquid, light duty) 1.2% 2.4% 3.9% 0.8% 2.4% 5.9% 58.8% 62.7% 68.5% 18.9% 23.2% 27.9% 0.5% 1.4% 3.7% 2.7% 4.6% 7.7%Detergent (liquid, heavy duty) 2.5% 5.2% 11.6% 1.9% 3.7% 5.1% 59.5% 66.9% 75.2% 2.2% 4.7% 7.5% 2.4% 4.8% 9.3% 3.4% 6.2% 11.7%Dishwasher detergent 0.7% 2.3% 5.9% 1.3% 2.5% 5.2% 61.7% 70.2% 78.4% 6.5% 11.5% 19.5% 1.0% 1.8% 3.7% 3.5% 5.8% 9.6%Diapers 2.6% 4.4% 11.3% 1.7% 3.6% 6.7% 51.0% 60.7% 69.2% 7.1% 10.2% 14.3% 1.8% 3.7% 7.7% 7.0% 10.0% 13.3%Fabric softner (liquid) 1.1% 2.0% 4.6% 1.0% 2.2% 3.9% 67.8% 76.3% 82.9% 6.0% 10.4% 13.6% 0.7% 1.8% 4.4% 3.4% 5.0% 8.3%Fabric softner (dry) 0.6% 2.1% 4.4% 0.8% 2.3% 5.2% 59.9% 65.9% 74.6% 9.8% 14.4% 20.5% 1.4% 2.9% 5.0% 2.7% 5.4% 10.1%Total 1.2% 3.1% 6.4% 1.0% 2.4% 5.3% 52.9% 62.3% 72.1% 8.6% 15.9% 23.4% 1.3% 3.0% 6.3% 3.7% 6.6% 11.3%
CM Demand (CMD)CM Price (CMP)Pricing History (PH)CRP Comp. (CRPC) Brand Demand (BD)CRP Same (CRPS)
o See footnote to Table 2 for a description of the price drivers. o We report the median estimates by category (2 brands per category in 55 stores). o Total observations: 3460
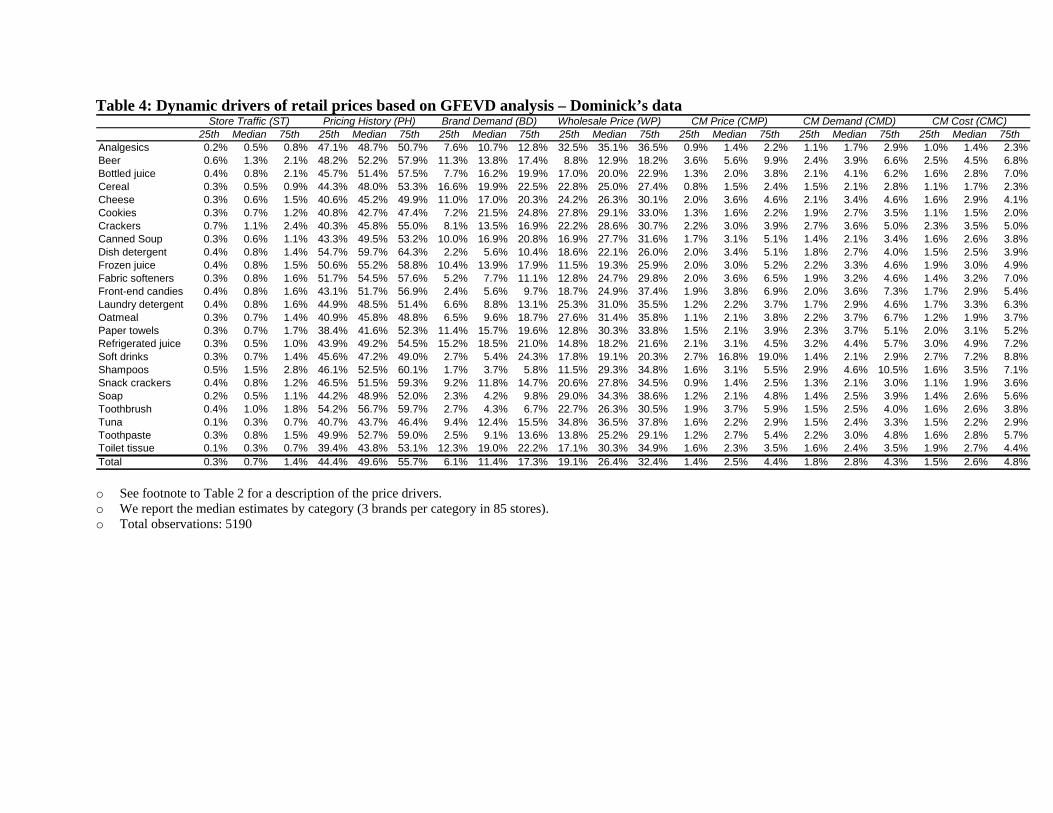
Table 4: Dynamic drivers of retail prices based on GFEVD analysis – Dominick’s data
25th Median 75th 25th Median 75th 25th Median 75th 25th Median 75th 25th Median 75th 25th Median 75th 25th Median 75thAnalgesics 0.2% 0.5% 0.8% 47.1% 48.7% 50.7% 7.6% 10.7% 12.8% 32.5% 35.1% 36.5% 0.9% 1.4% 2.2% 1.1% 1.7% 2.9% 1.0% 1.4% 2.3%Beer 0.6% 1.3% 2.1% 48.2% 52.2% 57.9% 11.3% 13.8% 17.4% 8.8% 12.9% 18.2% 3.6% 5.6% 9.9% 2.4% 3.9% 6.6% 2.5% 4.5% 6.8%Bottled juice 0.4% 0.8% 2.1% 45.7% 51.4% 57.5% 7.7% 16.2% 19.9% 17.0% 20.0% 22.9% 1.3% 2.0% 3.8% 2.1% 4.1% 6.2% 1.6% 2.8% 7.0%Cereal 0.3% 0.5% 0.9% 44.3% 48.0% 53.3% 16.6% 19.9% 22.5% 22.8% 25.0% 27.4% 0.8% 1.5% 2.4% 1.5% 2.1% 2.8% 1.1% 1.7% 2.3%Cheese 0.3% 0.6% 1.5% 40.6% 45.2% 49.9% 11.0% 17.0% 20.3% 24.2% 26.3% 30.1% 2.0% 3.6% 4.6% 2.1% 3.4% 4.6% 1.6% 2.9% 4.1%Cookies 0.3% 0.7% 1.2% 40.8% 42.7% 47.4% 7.2% 21.5% 24.8% 27.8% 29.1% 33.0% 1.3% 1.6% 2.2% 1.9% 2.7% 3.5% 1.1% 1.5% 2.0%Crackers 0.7% 1.1% 2.4% 40.3% 45.8% 55.0% 8.1% 13.5% 16.9% 22.2% 28.6% 30.7% 2.2% 3.0% 3.9% 2.7% 3.6% 5.0% 2.3% 3.5% 5.0%Canned Soup 0.3% 0.6% 1.1% 43.3% 49.5% 53.2% 10.0% 16.9% 20.8% 16.9% 27.7% 31.6% 1.7% 3.1% 5.1% 1.4% 2.1% 3.4% 1.6% 2.6% 3.8%Dish detergent 0.4% 0.8% 1.4% 54.7% 59.7% 64.3% 2.2% 5.6% 10.4% 18.6% 22.1% 26.0% 2.0% 3.4% 5.1% 1.8% 2.7% 4.0% 1.5% 2.5% 3.9%Frozen juice 0.4% 0.8% 1.5% 50.6% 55.2% 58.8% 10.4% 13.9% 17.9% 11.5% 19.3% 25.9% 2.0% 3.0% 5.2% 2.2% 3.3% 4.6% 1.9% 3.0% 4.9%Fabric softeners 0.3% 0.8% 1.6% 51.7% 54.5% 57.6% 5.2% 7.7% 11.1% 12.8% 24.7% 29.8% 2.0% 3.6% 6.5% 1.9% 3.2% 4.6% 1.4% 3.2% 7.0%Front-end candies 0.4% 0.8% 1.6% 43.1% 51.7% 56.9% 2.4% 5.6% 9.7% 18.7% 24.9% 37.4% 1.9% 3.8% 6.9% 2.0% 3.6% 7.3% 1.7% 2.9% 5.4%Laundry detergent 0.4% 0.8% 1.6% 44.9% 48.5% 51.4% 6.6% 8.8% 13.1% 25.3% 31.0% 35.5% 1.2% 2.2% 3.7% 1.7% 2.9% 4.6% 1.7% 3.3% 6.3%Oatmeal 0.3% 0.7% 1.4% 40.9% 45.8% 48.8% 6.5% 9.6% 18.7% 27.6% 31.4% 35.8% 1.1% 2.1% 3.8% 2.2% 3.7% 6.7% 1.2% 1.9% 3.7%Paper towels 0.3% 0.7% 1.7% 38.4% 41.6% 52.3% 11.4% 15.7% 19.6% 12.8% 30.3% 33.8% 1.5% 2.1% 3.9% 2.3% 3.7% 5.1% 2.0% 3.1% 5.2%Refrigerated juice 0.3% 0.5% 1.0% 43.9% 49.2% 54.5% 15.2% 18.5% 21.0% 14.8% 18.2% 21.6% 2.1% 3.1% 4.5% 3.2% 4.4% 5.7% 3.0% 4.9% 7.2%Soft drinks 0.3% 0.7% 1.4% 45.6% 47.2% 49.0% 2.7% 5.4% 24.3% 17.8% 19.1% 20.3% 2.7% 16.8% 19.0% 1.4% 2.1% 2.9% 2.7% 7.2% 8.8%Shampoos 0.5% 1.5% 2.8% 46.1% 52.5% 60.1% 1.7% 3.7% 5.8% 11.5% 29.3% 34.8% 1.6% 3.1% 5.5% 2.9% 4.6% 10.5% 1.6% 3.5% 7.1%Snack crackers 0.4% 0.8% 1.2% 46.5% 51.5% 59.3% 9.2% 11.8% 14.7% 20.6% 27.8% 34.5% 0.9% 1.4% 2.5% 1.3% 2.1% 3.0% 1.1% 1.9% 3.6%Soap 0.2% 0.5% 1.1% 44.2% 48.9% 52.0% 2.3% 4.2% 9.8% 29.0% 34.3% 38.6% 1.2% 2.1% 4.8% 1.4% 2.5% 3.9% 1.4% 2.6% 5.6%Toothbrush 0.4% 1.0% 1.8% 54.2% 56.7% 59.7% 2.7% 4.3% 6.7% 22.7% 26.3% 30.5% 1.9% 3.7% 5.9% 1.5% 2.5% 4.0% 1.6% 2.6% 3.8%Tuna 0.1% 0.3% 0.7% 40.7% 43.7% 46.4% 9.4% 12.4% 15.5% 34.8% 36.5% 37.8% 1.6% 2.2% 2.9% 1.5% 2.4% 3.3% 1.5% 2.2% 2.9%Toothpaste 0.3% 0.8% 1.5% 49.9% 52.7% 59.0% 2.5% 9.1% 13.6% 13.8% 25.2% 29.1% 1.2% 2.7% 5.4% 2.2% 3.0% 4.8% 1.6% 2.8% 5.7%Toilet tissue 0.1% 0.3% 0.7% 39.4% 43.8% 53.1% 12.3% 19.0% 22.2% 17.1% 30.3% 34.9% 1.6% 2.3% 3.5% 1.6% 2.4% 3.5% 1.9% 2.7% 4.4%Total 0.3% 0.7% 1.4% 44.4% 49.6% 55.7% 6.1% 11.4% 17.3% 19.1% 26.4% 32.4% 1.4% 2.5% 4.4% 1.8% 2.8% 4.3% 1.5% 2.6% 4.8%
Store Traffic (ST) CM Price (CMP) CM Demand (CMD) CM Cost (CMC)Pricing History (PH) Brand Demand (BD) Wholesale Price (WP)
o See footnote to Table 2 for a description of the price drivers. o We report the median estimates by category (3 brands per category in 85 stores). o Total observations: 5190
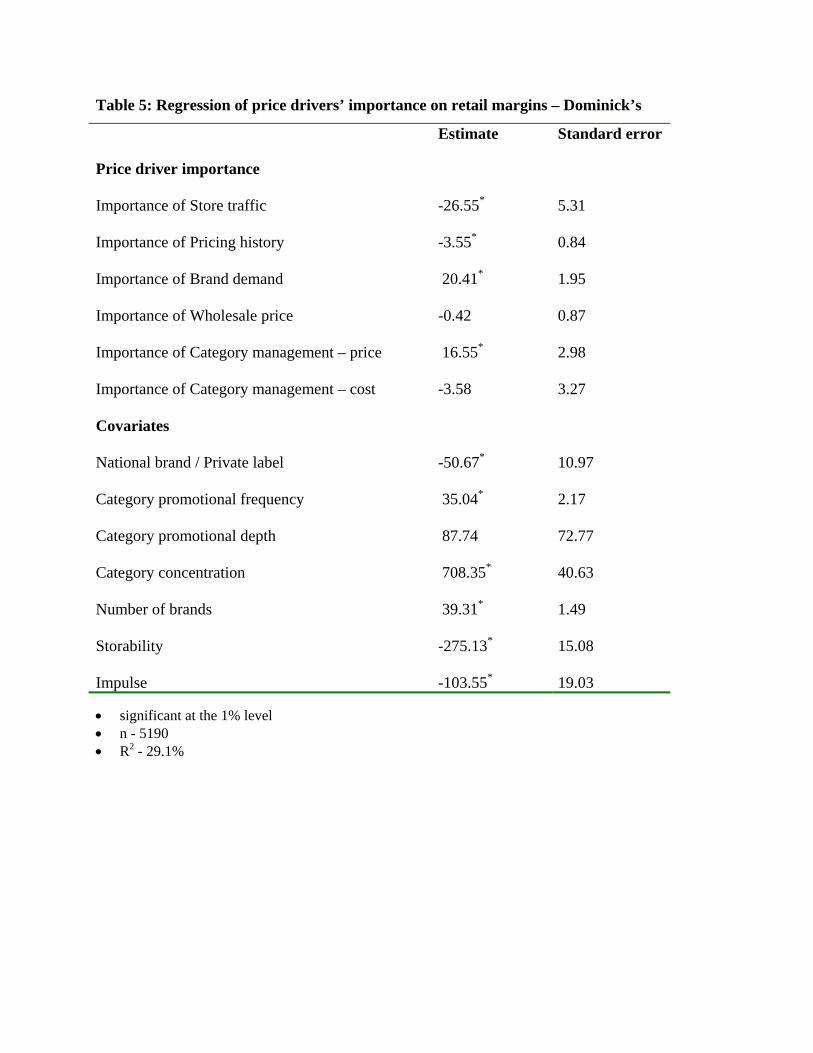
Table 5: Regression of price drivers’ importance on retail margins – Dominick’s
Estimate Standard error
Price driver importance Importance of Store traffic Importance of Pricing history Importance of Brand demand Importance of Wholesale price Importance of Category management – price Importance of Category management – cost
-26.55* -3.55* 20.41* -0.42 16.55*
-3.58
5.31 0.84 1.95 0.87 2.98 3.27
Covariates National brand / Private label Category promotional frequency Category promotional depth Category concentration Number of brands Storability Impulse
-50.67* 35.04* 87.74 708.35* 39.31* -275.13* -103.55*
10.97 2.17 72.77 40.63 1.49 15.08 19.03
• significant at the 1% level • n - 5190 • R2 - 29.1%

References
Alba, Joseph W., Carl F. Mela, Terry. A. Shimp, Joel E. Urbany. 1999. The Effect of Discount Frequency and Depth on Consumer Price Judgments. J. Consumer Res. 26 (2) 99-114.
AMR Research, Inc. 2000. The report on retail applications. September 1-20.
Ball, Laurence, N. Gregory Mankiw. 1994. “A Sticky-Price Manifesto,” Carnegie-Rochester Conference Series on Public Policy. 127-152.
Bell, David R., Jeongwen Chiang, V. Padmanabhan. 1999. The decomposition of promotional response: An empirical generalization. Marketing Sci. 18(4) 504-526.
Benkwitz, Alexander, Helmut Lütkepohl, J. Wolters. 2001. Comparison of bootstrap confidence intervals for impulse responses of German monetary systems. Macroeconomic Dynamics 5 81-100.
Besanko, David, Jean-Pierre Dubé, Sachin Gupta. 2005. Own-brand and cross-brand retail pass-through. Marketing Sci. 2005 24(1)123 -137.
Blattberg, Robert, Richard Briesch, Ed Fox. 1995. How promotions work. Marketing Sci. 14(3) 122-132.
Bradley, Efron, Robert J. Tibshirani. 1993. An Introduction to the Bootstrap: Monographs on Statistics and Applied Probability. Vol. 57 Chapman and Hall, NY.
Bronnenberg, Bart J., Peter E. Rossi, Naufel J. Vilcassim. 2005. Structural modeling and policy simulation. J. Marketing Res. 42(February) 22-26.
Bruggeman, Ralf, Helmut Lütkepohl. 2001. Lag selection in subset VAR models with an application to a U.S. monetary system. R. Friedmann, L. Knüppel, Helmut, Lütkepohl. eds. Econometric Studies: A Festschrift in Honour of Joachim Frohn. LIT Verlag, Münster, Germany.
Business Week (2000), “The Power of Smart Pricing,” (April 10). Chintagunta, Pradeep K. 2002. Investigating category pricing behavior at a retail chain. J.
Marketing Res. 32(May) 141-154.
Chintagunta, Pradeep K., Jean-Pierre Dubé, Vishal Singh. 2003. Balancing Profitability and Customer Welfare in a Supermarket Chain. Quart. J. Econom 1(1) 111-147.
Chevalier, Judith A., Anil K. Kashyap, Peter E. Rossi. 2003. Why don’t prices rise during periods of peak demand? Evidence from scanner data. American Economic Review 93(1) 15-37.
Cox Direct. (1998). Annual survey of promotional practices. 20 Cox Direct, Largo, Fl.
Darnell, Adrian.C., J. Lynne Evans. 1990. The Limits of Econometrics, Aldershot, Hants, England, Edward Elgar, Brookfielt, VT
Dekimpe, Marnik G., Dominique M. Hanssens. 1995. The persistence of marketing effects on sales. Marketing Sci. 14(1) 1-21.

Dekimpe, Marnik G., Dominique M. Hanssens. 1999. Sustained spending and persistent response: A new look at long-term marketing profitability. J. Marketing Res. 36(November) 397-412.
Deleersnyder, Barbara, Inge Geyskens, Katrijn Gielens, Marnik G. Dekimpe. 2002. How cannibalistic is the Internet channel? A study of the newspaper industry in the United Kingdom and the Netherlands. Internat. J. Res. Marketing. 19 337-348.
Dutta, Shantanu, Mark Bergen, Daniel Levy. 2002. Price Flexibility in Channels of Distribution: Evidence from Scanner Data. J. Econom. Dynam. Control 26 11(September) 1845-1900.
Economist. 1992. “Procter's Gamble,” (July 25).
Einhorn, Hillel J., Robin M. Hogarth. 1986. Decision Making Under Ambiguity. J. of Business 59(4, part 2), S225-S250.
Enders, Walter. 2004. Applied Econometric Time Series, NY, John Wiley, NY.
Foekens E. W., Leeflang Peter S. H., Wittink Dick R. 1999. Varying parameter models to accommodate dynamic promotion effects. J. Econometrics 89 249-268.
Franses, Philip H. 2005. Diagnostics, Expectations and Endogeneity. J. Marketing Res. 42 (February), 27-29.
Greene, William H. 1997. Econometric Analysis, 3rd ed. Prentice Hall, London.
Hall, Joseph M., Praveen K. Kopalle, Aradhna Krishna. 2002. A multi-product model of retailer dynamic pricing and ordering decisions: Normative and Empirical Analysis. Working paper, Tuck School of Business, Dartmouth College, Hanover, NH.
Hall, Simon, Mark Walsh, Anthony Yates. 1997. How Do UK companies set prices? Bank of England, London, EC2R8AH.
Hamilton, James. 1994. Time Series Analysis, Princeton University Press, Princeton, NJ.
Hanssens, Dominique M. 1998. Order Forecasts, Retail Sales and the Marketing Mix for Consumer Durables. J. Forecasting 17 327–346.
Horváth, Csilla. 2003. Dynamic Analysis of a Competitive Marketing System, Doctoral Dissertation, University of Groningen, The Netherlands.
Hulbert, James M. 1981. Descriptive models of marketing decisions. , Randall L. Schultz, Andris A. Zoltners (eds.). Marketing Decision Models, Elsevier, NY, North Holland, NY 8-49.
Kahn, Barbara E., Leigh McAlister. 1997. Grocery Revolution: The New Focus on the Consumer, Addison-Wesley Pub. Co, Reading, MA.
Kopalle, Praveen, Carl F. Mela, Lawrence Marsh. 1999. The dynamic effect of discounting on sales: Empirical evidence and normative pricing implications. Marketing Sci. 18(3) 317-332.
Krishna, Aradhna. 1994. The impact of dealing patterns on purchase behavior. Marketing Sci. 13(4) 351-373.
Krishna, Aradhna, Carl F. Mela, Joel Urbany. 2001. Inertia in Pricing. Working paper, University of Notre Dame, IN.
Lal, Rajiv. 1990. Price promotions: Limiting competitive encroachment. Marketing Sci, 9(3) 263-278.
Leeflang, Peter S. H., Dick R. Wittink. 1992. Diagnosing competitive reactions using (aggregated) scanner data. Internat. J. Res. Marketing 9 39-57.
Levy, Daniel, Mark Bergen, Shantanu Dutta, Robert Venable. 1997. The Magnitude of Menu Costs: Direct Evidence From Large U.S. Supermarket Chains. Quart. J. Econom. 112 791-825.
Lütkepohl, Helmut. 1993. Introduction to Multiple Time Series Analysis, Springer-Verlag, Berlin.
Lütkepohl, Helmut, M. Krätzig (eds.). 2004. Applied Time Series Econometrics, Cambridge, UK, Cambridge University Press, NY.
March, James G., Herbert Simon. 1958. Organisations, Wiley, NY.
Maskin, Eric, Jean Tirole. 1988. A Theory of Dynamic Oligopoly II: Price Competition, Kinked Demand Curves, and Edgeworth Cycles. Econometrica 56 571-599.
Moorthy, Sridhar. 2005. A General Theory of Pass-through in Channels with Category Management and Retail Competition. Marketing Sci. 24 110–122.
Murphy, Kevin M., Robert H. Topel. 1985. Estimation and Inference in Two-Step Econometric Models. J. Bus. Econom. Statistics 3(4) 370-79.
Nagle, Thomas T., Reed T. Holden. 1995. The Strategy and Tactics of Pricing, 2nd ed. Prentice Hall, Englewood Cliffs, NJ.
Narasimhan, Chakravarthi, Scott A. Neslin, Subrata K. Sen. 1996. Promotional elasticities and category characteristics. J. Marketing 60(2) 17-31.
Neslin, Scott A. 2002. Sales Promotions, MSI Monograph, Cambridge, MA.
Nijs, Vincent, Marnik G. Dekimpe, Jan-Benedict. E.M. Steenkamp, Dominique M. Hanssens 2001. The category demand effects of price promotions. Marketing Sci. 20(1) 1-22.
Pauwels, Koen, Dominique M. Hanssens, S. Siddarth. 2002. The long-term effects of price promotions on category incidence, brand choice and purchase quantity. J. Marketing Res. 39(November) 421-439.
Pauwels, Koen, Jorge Silva-Risso, Shuba Srinivasan, Dominique Hanssens. 2004. New products, sales promotions and firm value, with application to the automobile industry. J. Marketing 68(October) 142-156.
Pauwels, Koen, Shuba Srinivasan. 2004. Who benefits from store brand entry. Marketing Sci, 23(3) 364-390.
Perron, Pierre. 1989. The great crash, the oil price shock and the unit root hypothesis. Econometrica 57(6) 1361–1401.
Perron, Pierre. 1990. Testing for a unit root in a time series with a changing mean. J. Bus. Econom. Statistics 8(2) 153–162.
Pesaran, Hashem H., Yongcheol Shin. 1998. Generalized impulse response analysis in linear multivariate models. Economic Lett. 58(1) 17-29.

Pesaran, Hashem H., Ron P. Smith. 1998. Structural analysis of cointegrating VARs. J. Econom. Surveys 12 471-506.
Pesendorfer, Martin. 2001. Retail Sales: A Study of Pricing Behavior in Supermarkets. J. Business 69(2) 307-342.
Plous, Scott. 1993. The psychology of judgment and decision making. McGraw-Hill, NY.
Progressive Grocer. 2001. “Categorizing success”. 80 4(April). 51.
Raju, Jagmohan S. 1992. The effect of price promotions on variability in product category sales. Marketing Sci. 11(3) 207-220.
Raju, Jagmohan S., Sethuraman, Raj, Sanjay Dhar. 1995. The introduction and performance of store brands. Management Sci. 41(June) 957-978.
Rao, Ram C., Ramesh Arjunji, B. P. S. Murthi. 1995. Game theory and empirical generalizations concerning competitive promotions. Marketing Sci. 14(3, 2) 89-100.
Shankar, Venkatesh, Ruth Bolton. 2004. An empirical analysis of the determinants of retailer pricing strategy. Marketing Sci. 23(1) 28-49.
Srinivasan, Shuba, Koen Pauwels, Dominique Hanssens, Marnik Dekimpe. 2004. Do promotions benefit manufacturers, retailers or both? Management Sci. 50(5) 617-629.
Sims, Christopher A. 1980. Macroeconomics and Reality. Econometrica 48 1-48.
Steenkamp, Jan-Benedict, Vincent Nijs, Dominique Hanssens, Marnik Dekimpe. 2005. Competitive reactions and the cross-sales effects of advertising and promotion. Marketing Sci. 24(1) 35-54.
Stores. 2002. “Retailers slow to adopt analytics software”. (June).
Sudhir, K. 2001. Structural analysis of manufacturer pricing in the presence of a strategic retailer. Marketing Sci. 20(3) 244-264.
Tellis, Gerard J., Fred Zufryden. 1995. Cracking the retailer’s decision problem: Which brand to discount, how much, when and why? Marketing Sci. 14(3) 271-299.
Tversky, Amos, Daniel Kahneman. 1991. Loss aversion in riskless choice: A reference dependent model. Quart. J. Econom. 107(4) 1039-1061.
Tyagi, Rajeev K. 1999. A characterization of retailer response to manufacturer trade deals. J. Marketing Res .36 510-516.
Urbany, Joel E., Peter Dickson, Alan Sawyer. 2000. Insights into cross- and within-store price search: Retailer estimates vs. consumer self-reports. J. Retailing 76(2) 243-258.
Van Aalst M., Lauren Sloot, L. van der Blom en L. Kivits 2005. Het 'grote voordeel' van een jaar prijsoorlog. Working paper, Erasmus Food Management Institute, 2005-01.
Van Heerde, Harald J., Peter S.H. Leeflang, Dick R. Wittink. 2000. The estimation of pre- and post-promotion dips with store-level scanner data. J. Marketing Res. 37(August) 383-395.
Van Heerde, Harald J., Marnik. G. Dekimpe, William P. Putsis, Jr. 2005. Marketing models and the Lucas critique. J. Marketing Res. 42 (February), 15-21.

Villas-Boas, Miguel, Rajiv Lal. 1998. Price promotions and trade deals with multi-product retailers. Management Sci. 44(May) 935-949.
Walters, Rockney G., Scott B. MacKenzie. 1988. A structural equation analysis of the impact of price promotions on store performance. J. Marketing Res. 25(February) 51-63.
Walters, Rockney G., Hekki Rinne. 1986. An empirical investigation into the impact of price promotions on retail store performance. J. Retailing 62 (3), 237-266.
Wynne, Mark A. 1995. Sticky Prices: What is the Evidence? Federal Reserve Bank of Dallas Economic Review (First Quarter) 112.
Zenor, Michael J. 1994. The profit benefits of category management. J. Marketing Res. 31(May) 202-213.
Zivot, Eric, Donald W. K. Andrews. 1992. Further Evidence on the Great Crash, the Oil-Price Shock, and the Unit-Root Hypothesis. J. Bus. Econom. Statistics 10(3) 251-270.

Technical appendix A
A.1 VARX specification
To accurately estimate (G)FEVD it is important to include all relevant, endogenous variables
in the VARX model used to derive them. In our setting this requires a large VARX model (7-
equations for the Denver data, 11-equations for the Dominick’s data). Models of this size
quickly run into parameterization problems. For example, adding one lag to an 11-equation
VARX would require the estimation of 121 additional parameters. A commonly used
approach is to estimate the model with differing lags and select the specification that
minimizes some criterion variable (e.g., BIC or AIC). Given the size of our VARX models
this approach is likely to either (1) select a lag-length that is too short for some of the
endogenous variables, causing autocorrelated residuals, or (2) lead to over-parameterization.
To ensure that our model residuals are well behaved (i.e., no autocorrelation is found) and
that the model is not over-parameterized we use a five-step procedure to specify a subset
VARX model. This procedure is outlined below and builds on work by Lütkepohl (1993),
Bruggeman and Lütkepohl (2001), and Lütkepohl and Krätzig (2004).
1. For each individual equation in the VARX determine the lag length that minimizes the
BIC criterion. The equation will include the same number of lags of all endogenous
variables.
2. Determine if the residuals for each VARX equation are free of autocorrelation using the
Breusch-Godfrey LM test (Lütkepohl 1993). If the null of no autocorrelation is rejected,
add lags until the autocorrelation is successfully removed or a maximum number of lags
has been included. For the Denver data set we use a maximum of six lags; for the
Dominick’s data the maximum is set to eight. If autocorrelation problems persist after the
maximum number of lags has been reached, additional lags may be added for only the
endogenous variable for the equation under investigation. Up to six or eight additional
lags are allowed for the Denver and Dominick’s data sets respectively. Residual
autocorrelation tests are conducted after each equation revision.
3. Once the basic lag structure has been determined for each equation, the individual
parameter estimates are evaluated to determine if the level of parameterization can be
reduced. In each equation the parameter with the smallest t-statistic, in absolute value, is
removed. Parameters are then re-estimated and evaluated on their t-statistic. This
procedure is repeated until all remaining parameters have a t-statistic larger than one in
absolute value (Bruggeman and Lütkepohl 2001). It has been shown that utilizing the t-
statistic in this manner is equivalent to using either the BIC or AIC criterion, depending
on the threshold value for parameter elimination (Lütkepohl and Krätzig 2004).
4. Autocorrelation tests are again conducted for each equation. If any of the tests show
evidence of autocorrelation the results of the model are dropped from further analysis.
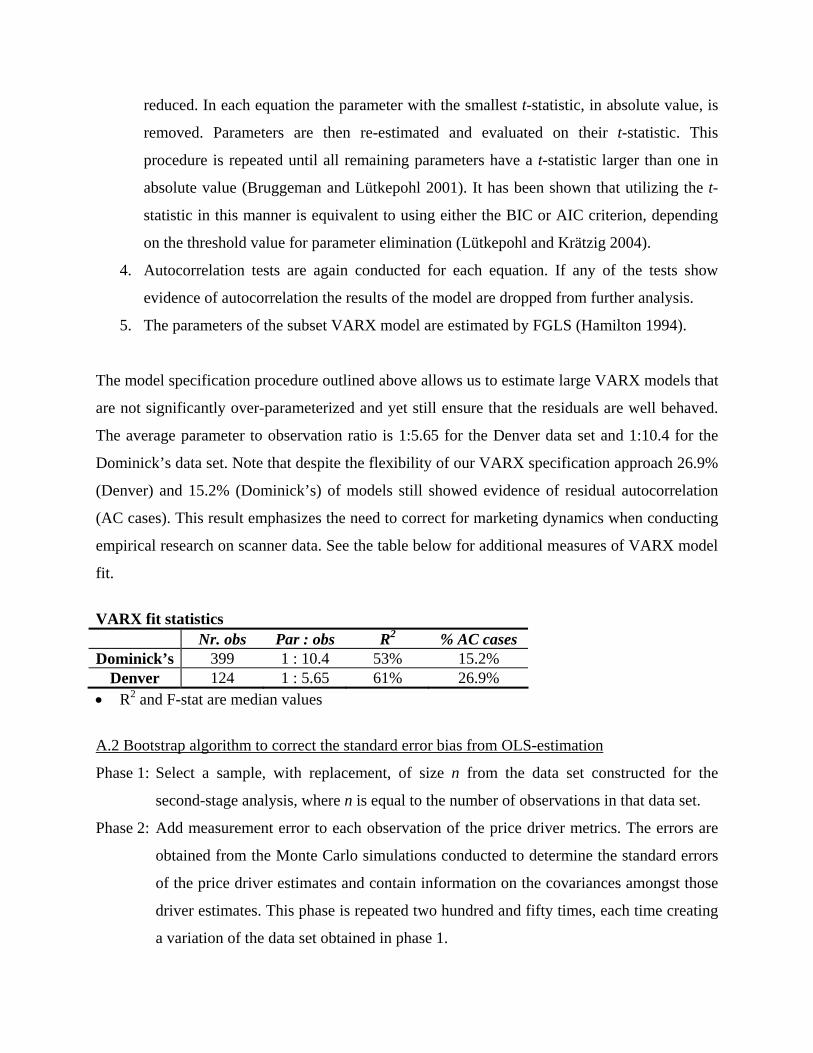
5. The parameters of the subset VARX model are estimated by FGLS (Hamilton 1994).
The model specification procedure outlined above allows us to estimate large VARX models that
are not significantly over-parameterized and yet still ensure that the residuals are well behaved.
The average parameter to observation ratio is 1:5.65 for the Denver data set and 1:10.4 for the
Dominick’s data set. Note that despite the flexibility of our VARX specification approach 26.9%
(Denver) and 15.2% (Dominick’s) of models still showed evidence of residual autocorrelation
(AC cases). This result emphasizes the need to correct for marketing dynamics when conducting
empirical research on scanner data. See the table below for additional measures of VARX model
fit.
VARX fit statistics Nr. obs Par : obs R2 % AC cases Dominick’s 399 1 : 10.4 53% 15.2%
Denver 124 1 : 5.65 61% 26.9% • R2 and F-stat are median values
A.2 Bootstrap algorithm to correct the standard error bias from OLS-estimation
Phase 1: Select a sample, with replacement, of size n from the data set constructed for the
second-stage analysis, where n is equal to the number of observations in that data set.
Phase 2: Add measurement error to each observation of the price driver metrics. The errors are
obtained from the Monte Carlo simulations conducted to determine the standard errors
of the price driver estimates and contain information on the covariances amongst those
driver estimates. This phase is repeated two hundred and fifty times, each time creating
a variation of the data set obtained in phase 1.

Phase 3: Calculate parameter estimates θ* for equation (3) for each of the two hundred and fifty
augmented data sets created in phase 2.
We repeat phases 1 through 3 one thousand times. The standard deviation across the two-
hundred and fifty thousand parameter vectors ( )000,250*2*1* ,,, θθθ K is our estimate of the standard
error of θOLS (see Bradley and Tibshirani 1993 for details).

Appendix B
B.1 Variable Operationalization
Retailer profitability. For the retailer, we compute the retailer’s total category margins (defined
in dollars) as ( ), , ,1
It i t i t i ti
RM S P WP=
= × −∑ where i denotes the brand and I is the total number of
brands in the category.
Store traffic. Store traffic is defined as the total number of customers visiting the store that buy at
least one item in a given week.
Holiday dummy variables. Following Chevalier et al. (2003), we specify dummy variables that
equal one in the shopping periods around the following holidays: Lent, Easter, Memorial Day,
July 4th, Labor Day, Halloween, Thanksgiving, the week following Thanksgiving, Christmas,
and the Superbowl. Since front-end candy (one of the categories we analyze) is less likely to be
bought immediately after Halloween, we add an additional dummy variable for the week
following the holiday. For consistency, these eleven holiday dummy variables are incorporated
in all categories analyzed.
B.2 Retail competition.
In the absence of information on the location of stores in the Denver database we empirically
identify those stores that are considered by the consumer as close competitors. Specifically,
competitive retail prices for the top two brands where determined using information on shopping
behavior from a consumer panel. For a store, the average competitive price charged for a brand
at time t is a weighted average of the prices charged for that brand in all other stores. The
weights are determined by counting the number of people in the panel that shop in both the focal
and the competing store. To illustrate the computation, suppose we have one brand (X), 3 stores
(A, B, and C), and 100 consumers. If 50 consumers shop at stores A and B and 10 consumers
shop at stores A and C this indicates that stores A and B are closer competitors than store A and
C. The competitive retail price for brand X included in a time-series model for store A would be
calculated as (50 × Price X in store B + 10 × Price X in store C) / 60.

B.3 Covariates
We operationalize the covariates used in step 3 of our analysis as follows:
National brand versus private label (NB). A dummy variable indicates whether the promoting
brand is a national brand (=1) or a private label (=0).
Promotional frequency (PROM_FRQ). We define promotional frequency as the number of
weeks in which negative price-promotion shocks are at least 5% of the brand's regular price. The
regular price, in turn, is defined as the maximum price of the brand, following Raju (1992) and
Foekens et al. (1999). The category level measure is calculated as the market-share weighted
average of the promotional frequency of the brands in the category.
Promotional depth (PROM_DPT). A brand's price-promotion depth is defined as the
(percentage) difference between a promotional price (as defined for the frequency count) and the
brand's regular price. The category level measure is calculated as the market-share weighted
average of the promotional depth of the brands in the category.
Category concentration (CAT_CONC). We measure the category concentration as the
cumulative market share of the top three brands.
Number of Brands (NRBR). The number of brands in the category is included to capture the
extent of brand proliferation (Narasimhan et al. 1996).
Impulse buying (IMPULSE) and Storability (STOCK). We use storability and impulse-buying
scales defined by Narasimhan et al. (1996) to construct dummy variables indicating whether the
product category is considered perishable or storable (=1), and whether or not it is an impulse
good (=1).16
Endnotes 1 Our analysis focuses on cases where prices are either mean or trend stationary. Previous authors have shown that
96% of price series for the Dominick’s data are stationary (e.g., Srinivasan et al. 2004). While the rare instances where there is evolution in prices may be interesting to analyze from a marketing standpoint, estimating (G)FEVD is infeasible since the variance for evolving variables is (theoretically) infinite.
2 To avoid over-parameterization, we include feature and display as exogenous variables (Pesaran and Smith 1998). Recent research has shown little is gained by allowing for more intricate feature and display dynamics (Nijs et al. 2001, Van Heerde et al. 2000).
3 An alternative method to solve some parameterization concerns is to pool across stores. In our study, this would however, reduce the number of estimates available for studying the impact of drivers of prices on performance, introducing a potential ’degrees of freedom problem’ in step 3 of our analysis. We aim to achieve a balance between accuracy and statistical adequacy through the adopted VARX specification.
4 It is possible that the retailer sets prices interdependently across categories. An empirical analysis of correlations among price residuals across categories indicates, however, that such dependencies are small to negligible. To the extent that they do exist these effects can be captured by the store traffic variable (Chintagunta 2002). As such, we leave the issue of cross-category price and demand dependencies for future research.
5 Feature and display indicators are called ‘price specials’ and ‘bonus buys’ in the Dominick’s data description (http://gsbwww.uchicago.edu/research/mkt/Databases/DFF/W.html). Following Chintagunta et al. (2003), we refer to these marketing activities using the more common labels ‘feature’ and ‘display’. We operationalize the variables as the percentage of SKUs of the brands that are promoted in a given week.
6 The proposed VARX model does not assume that, if week k contains a shock week k+1 does not. If, for example, a price promotion in the data always lasts three weeks, this is accounted for in the model. These subsequent shocks are not considered as separate shocks to the system but as an initial shock and its subsequent effects.
7 In GFEVD an initial shock is allowed to (but need not, depending on the size of the corresponding residual correlation) affect all other endogenous variables instantaneously. Generalized IRFs, which rely on an equivalent assumption, have recently applied in a marketing setting by Dekimpe and Hanssens (1999), Nijs et al. (2001), Pauwels et al. (2002), Steenkamp et al. (2005), and Srinivasan et al. (2004).
8 The use of impulse response functions to calculate the forecast error variance decomposition is equivalent to using forecast errors. See Lütkepohl 1993, section 2.3.3 and Pesaran and Shin 1998 for a similar approach.
9 Previous studies have shown that a period of 26 weeks (2 quarters) is sufficient for stationary series in consumer-packaged goods to capture dynamic effects (Pauwels and Srinivasan 2004, Srinivasan et al. 2004).
10 Because our first-stage estimates of the price drivers sum to one, we must exclude one of them from the second-stage analysis to avoid perfect multicollinearity. Since category management considerations are measured by three metrics, we exclude one metric, namely category demand.
11 Recent economic research (Ball and Mankiw 1994, Wynne 1995) argues that weekly store-level price data of small representative staple retail items are the most appropriate for studying the drivers of retail prices, since the retailer actually sets final goods prices, typically on a weekly level. Moreover, previous research finds that supermarket chains similar to Dominick’s change prices of as many of 15 percent of the products they carry every week, in spite of the fact that their cost of changing prices compromises over 35 percent of their net margin (Levy et al 1997).
12 As mentioned in Section 2, retailers may form expectations on trade deal patters. Such expectations are captured in the VARX model estimates since expectations are formed based on past realizations of the data generating process. Future research could attempt to explicitly capture such expectations, perhaps by incorporating leads of wholesale prices, as in Van Heerde et al. (2000).
13 Since the Denver data lack wholesale price information, results may be overstated due to the fact that wholesale price changes could cause correlation between a brand's price and the prices/demand of other brands in the category. This correlation can arise because retailers – attempting to entice category consumers to buy a certain

brand – may adjust brand prices in response to a reduction in wholesale prices of competing brands in the product category (Besanko et al. 2005).
14 We tested for the endogeneity of retailer margins by conducting the Hausman-Wu test (Davidson and MacKinnon 1993; Gielens and Dekimpe 2001). The procedure is implemented in turn for each potentially endogenous variable as follows: in the test equation, we include both the variable and its instruments, which are derived as the forecasts from an auxiliary regression linking the variable to the other control variables. A test on the significance of these instruments then constitutes the exogeneity test. None of these tests revealed any violation of the assumed exogeneity of the RHS variables (using a significance level of p < 0.05), indicating that our specification is robust to this issue.
15 For private label brands, CRPS is the price of the private label product in the same category in competing retail stores. We argue that this is the relevant comparison because private labels are likely to be in similar price tiers, and are used to compete with other retailers. For instance, in the ongoing Dutch retailing price war, several of the price cutting rounds involved the private label of the initiating retailer, to which the competing retailers responded by cutting prices on their own private labels (Van Aalst et al. 2005).
16 We are grateful to Scott Neslin for making the storability and impulse-purchase scales available to us.