retail sales and use taxes annual report fiscal year … year 2017...iowa department of revenue...
TRANSCRIPT

Retail Sales and Use Taxes Annual Report
Fiscal Year 2017
Released December 2017
Tax Research and Program Analysis Section

IOWA DEPARTMENT OF REVENUE SALES AND USE TAXES ANNUAL REPORT
FISCAL YEAR 2017 TABLE OF CONTENTS
Introduction Page
Foreword........................................................................................................ 1-2
Glossary.............................................................................................................. 3
Tax Collection Distributions
Distribution of Sales and Use Tax Collections by Tax Type for Fiscal Years 2010-2017 ................................................................................. 4
Retail Sales and Use Tax Collections by Tax Type in Millions for Fiscal Years 2010-2017 ................................................................................. 5 Retail Sales Tax Summary
History of Iowa Retail Sales Tax ......................................................................... 6
Year in Review.................................................................................................... 7
Retail Sales Tax Statistics
Distribution of Retail Sales Tax Collections by Quarter for Fiscal Years 2010-2017 ................................................................................. 8
Retail Sales Tax Collections in Millions by Quarter for Fiscal Years 2010-2017 ................................................................................. 9 Retail Sales Tax by City Population .................................................................. 10
Retail Sales Tax by Filing Frequency ................................................................ 11
Retail Taxable Sales and Tax by Amount of Taxable Sales .............................. 12
Total Retail Sales and Exempt Sales by Amount of Total Sales ……………………13
Retail Sales Tax by Amount of Tax Due ........................................................... 14
Change in Retail Sales Tax Returns, Establishments, and Computed Tax by Business Group ................................................................................................ 15 Use Tax Summary
History of Iowa Use Taxes ................................................................................ 16
Use Tax Statistics
Iowa Use Taxes ................................................................................................ 17
Retailer's Use Tax by Amount of Tax Due ........................................................ 18
Consumer's Use Tax by Amount of Tax Due .................................................... 19
Iowa Department of Revenue Annual Report 1
Forward
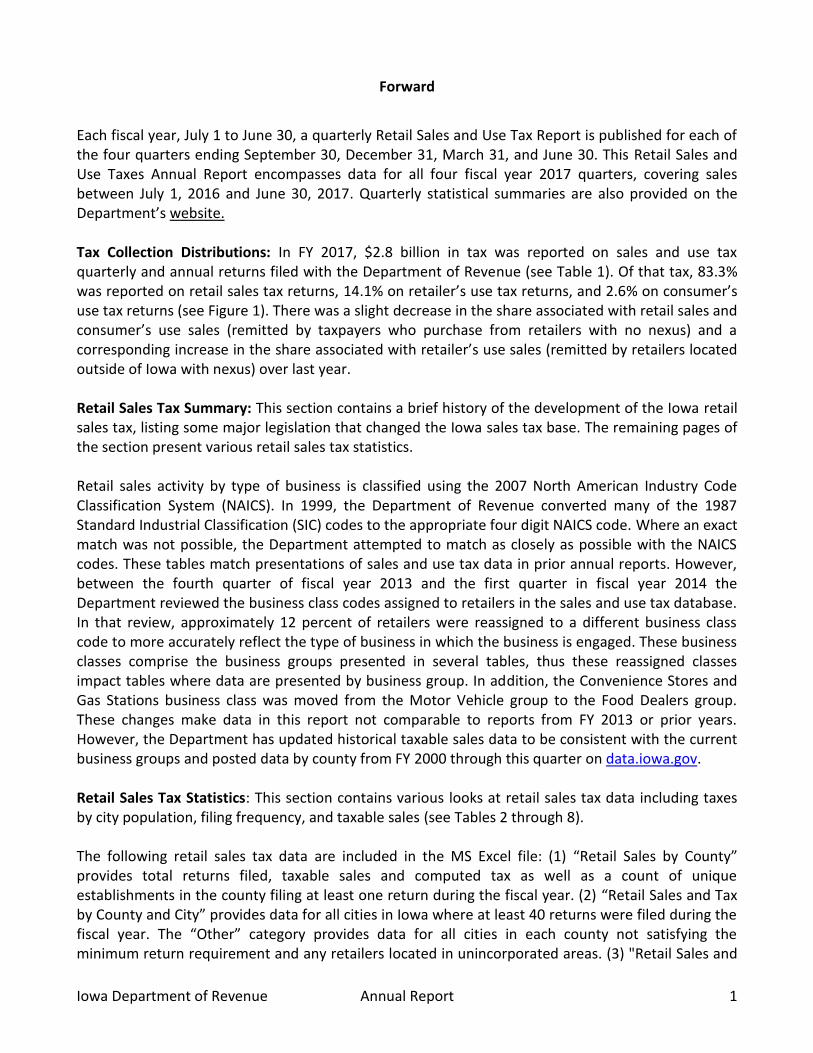
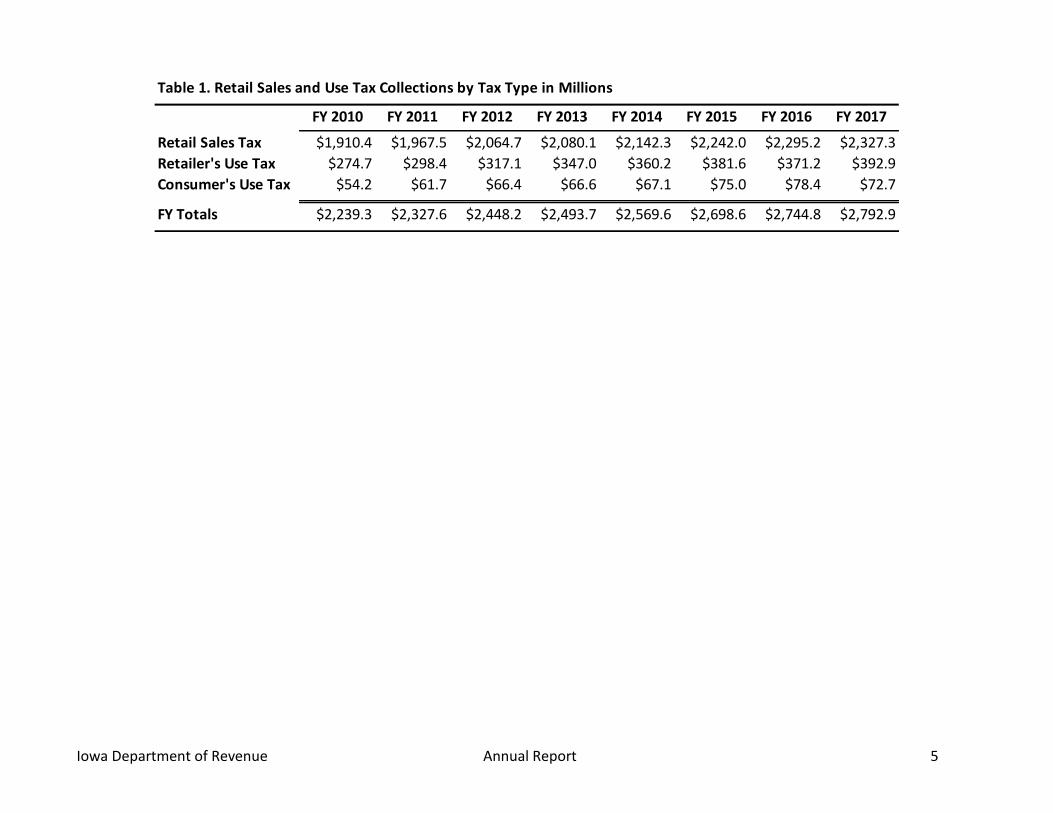
Each fiscal year, July 1 to June 30, a quarterly Retail Sales and Use Tax Report is published for each of the four quarters ending September 30, December 31, March 31, and June 30. This Retail Sales and Use Taxes Annual Report encompasses data for all four fiscal year 2017 quarters, covering sales between July 1, 2016 and June 30, 2017. Quarterly statistical summaries are also provided on the Department’s website. Tax Collection Distributions: In FY 2017, $2.8 billion in tax was reported on sales and use tax quarterly and annual returns filed with the Department of Revenue (see Table 1). Of that tax, 83.3% was reported on retail sales tax returns, 14.1% on retailer’s use tax returns, and 2.6% on consumer’s use tax returns (see Figure 1). There was a slight decrease in the share associated with retail sales and consumer’s use sales (remitted by taxpayers who purchase from retailers with no nexus) and a corresponding increase in the share associated with retailer’s use sales (remitted by retailers located outside of Iowa with nexus) over last year. Retail Sales Tax Summary: This section contains a brief history of the development of the Iowa retail sales tax, listing some major legislation that changed the Iowa sales tax base. The remaining pages of the section present various retail sales tax statistics. Retail sales activity by type of business is classified using the 2007 North American Industry Code Classification System (NAICS). In 1999, the Department of Revenue converted many of the 1987 Standard Industrial Classification (SIC) codes to the appropriate four digit NAICS code. Where an exact match was not possible, the Department attempted to match as closely as possible with the NAICS codes. These tables match presentations of sales and use tax data in prior annual reports. However, between the fourth quarter of fiscal year 2013 and the first quarter in fiscal year 2014 the Department reviewed the business class codes assigned to retailers in the sales and use tax database. In that review, approximately 12 percent of retailers were reassigned to a different business class code to more accurately reflect the type of business in which the business is engaged. These business classes comprise the business groups presented in several tables, thus these reassigned classes impact tables where data are presented by business group. In addition, the Convenience Stores and Gas Stations business class was moved from the Motor Vehicle group to the Food Dealers group. These changes make data in this report not comparable to reports from FY 2013 or prior years. However, the Department has updated historical taxable sales data to be consistent with the current business groups and posted data by county from FY 2000 through this quarter on data.iowa.gov. Retail Sales Tax Statistics: This section contains various looks at retail sales tax data including taxes by city population, filing frequency, and taxable sales (see Tables 2 through 8). The following retail sales tax data are included in the MS Excel file: (1) “Retail Sales by County” provides total returns filed, taxable sales and computed tax as well as a count of unique establishments in the county filing at least one return during the fiscal year. (2) “Retail Sales and Tax by County and City” provides data for all cities in Iowa where at least 40 returns were filed during the fiscal year. The “Other” category provides data for all cities in each county not satisfying the minimum return requirement and any retailers located in unincorporated areas. (3) "Retail Sales and

Iowa Department of Revenue Annual Report 2
Tax by County and Business Group” provides data by 12 business groups for each county. Breakouts are provided for each business group within a county where at least 20 or more returns were filed in a fiscal year. An "S", representing "Suppressed", is used for any business group that does not have at least 20 returns filed. (4) "Retail Sales and Tax by Business Classification" provides state-wide data by the 12 business groups further broken out into 82 business classifications. In order to protect the confidentiality of individual businesses, information for any business classification with less than 20 returns filed during the fiscal year are aggregated and put in the "Unclassified" category in the "Miscellaneous” group. Use Tax Summary: This section begins with a history of the development of the Iowa Use Tax followed by a summary of the various types of use taxes. Use Tax Statistics: This section contains retailer’s use and consumer’s use tax receipts in Tables 9 through 11. The MS excel workbook contains the following use tax data (1) “Retailer’s Use Tax by Business Class” provides sales by out-of-state retailers to Iowa taxpayers by the 12 business groups further broken out into 82 business classifications. In order to protect the confidentiality of individual businesses, information for any business classification with less than 20 returns filed during the fiscal year are aggregated and put in the "Unclassified" category in the "Miscellaneous” group, (2) “Consumer’s Use Tax by Business Class” provides purchases by Iowa taxpayers by the 12 business groups further broken out into 82 business classifications. In order to protect the confidentiality of individual businesses, information for any business classification with less than 20 returns filed during the fiscal year are aggregated and put in the "Unclassified" category in the "Miscellaneous” group, (3) “Consumer’s Use Tax by County” provides total returns filed, taxable sales and computed tax on returns filed by taxpayers making taxable purchases out-of-state for use in Iowa during the fiscal year. In addition, a summary of Local Hotel and Motel Tax Receipts by jurisdiction and Motor Vehicle Use Fees reported by County Treasurers are also included.

Iowa Department of Revenue Annual Report 3
Glossary
BUSINESS CLASSIFICATION Business classifications are based on the major type of activity
performed by the business. As a result, business classifications may include sales other than normally suggested by the class title. Classifications are based on the 2007 North American Industry Classification System (NAICS).
BUSINESS GROUP Consolidation of related business classifications into 12 broader
business groups. COMPUTED TAX The applicable tax rate times the taxable sales. CONSOLIDATED FILER A business with multiple locations in Iowa that aggregates sales
tax data over all the locations and files a single sales tax return per quarter.
NUMBER OF RETURNS A count of all quarterly or annual returns filed by a combination
of consolidated and nonconsolidated filers during the fiscal year. When state-level data is presented, the number of returns counts each consolidated filer as one return. When county-level and business classification data is presented the number of returns counts each consolidated location separately.
NUMBER OF ESTABLISHMENTS
An establishment is each unique location where business is conducted that filed at least one tax return during the fiscal year. However, the number of establishments includes each separate location of a consolidated filer even if only one return was filed for all of those locations.
OTHER Includes all businesses located in unincorporated areas of a
county and those cities with less than 40 returns filed for the annual report and 10 returns filed for a quarterly report.
TAXABLE SALES Gross receipts plus the value of taxable goods and services
consumed by the business that were purchased tax exempt, minus the amount of tax exempt sales.
UNCLASSIFIED Includes all businesses where less than 20 returns were filed for the applicable business classification during the fiscal year. These are included in the "Miscellaneous" business group.

Iowa Department of Revenue Annual Report 4
85.3% 84.5% 84.3% 83.4% 83.4% 83.1% 83.6% 83.3%
12.3% 12.8% 13.0% 13.9% 14.0% 14.1% 13.5% 14.1%
2.4% 2.7% 2.7% 2.7% 2.6% 2.8% 2.9% 2.6%
0%
20%
40%
60%
80%
100%
FY 2010 FY 2011 FY 2012 FY 2013 FY 2014 FY 2015 FY 2016 FY 2017
Dis
trib
uti
on
by
Tax
Typ
eFigure 1. Distribution of Sales and Use Tax Collections by Tax Type for
Fiscal Years 2010-2017
Retail Sales Tax Retailer's Use Tax Consumer's Use Tax
Iowa Department of Revenue Annual Report 5
Table 1. Retail Sales and Use Tax Collections by Tax Type in Millions
FY 2010 FY 2011 FY 2012 FY 2013 FY 2014 FY 2015 FY 2016 FY 2017
Retail Sales Tax $1,910.4 $1,967.5 $2,064.7 $2,080.1 $2,142.3 $2,242.0 $2,295.2 $2,327.3
Retailer's Use Tax $274.7 $298.4 $317.1 $347.0 $360.2 $381.6 $371.2 $392.9
Consumer's Use Tax $54.2 $61.7 $66.4 $66.6 $67.1 $75.0 $78.4 $72.7
FY Totals $2,239.3 $2,327.6 $2,448.2 $2,493.7 $2,569.6 $2,698.6 $2,744.8 $2,792.9

Iowa Department of Revenue Annual Report 6
History of Iowa Retail Sales Tax
A 6 percent tax is imposed on the gross receipts received from the retail sales of tangible personal property in Iowa and from receipts received for the performance of certain taxable services in Iowa. The amount of gross receipts is adjusted by adding the value of goods consumed by businesses that were purchased tax exempt and subtracting the amount of any exempt sales.
The Iowa sales tax was first imposed in 1934 at the rate of 2 percent. The tax was imposed only on the gross receipts received from the sale of tangible personal property; the sale of metered gas, electricity, water, and communication services; and the sale of admissions to places of amusement or athletic events. The tax was set to sunset in three years. On April 1, 1937 the tax was made permanent and a use tax was imposed. On July 1, 1955 the rate was increased to 2.5 percent. The rate was dropped back to 2 percent on July 1, 1957 but was increased to 3 percent effective October 1, 1967. The rate was increased to 4 percent on March 1, 1983, and to 5 percent on July 1, 1992. The most recent increase to 6 percent was effective July 1, 2008. The one percent increase to 6 percent is dedicated to school infrastructure and property tax relief, but is set to be repealed December 31, 2029.
Since 1934 there have been many changes to the Iowa sales tax base. Some of the major sales tax base expansions are listed below:
April 24, 1947: Retail sales tax was imposed on sales of all forms of amusement devices and commercial amusement enterprises.
January 1, 1966: Extended tax to hotel and motel rooms.
October 1, 1967: Extended tax to certain services.
July 1, 1971: Sales of all vehicles subject to registration were made subject to use tax.
July 1, 1985: An exception to the exemption for food for human consumption was made for candy, candy-coated items, certain beverages, and certain prepared food.
Some of the major exemptions are listed below:
July 1, 1974: The sales of food purchased for home consumption, prescription drugs, and medical devices were exempted.
July 1, 1979: Sales by cities and counties were exempted except utility services.
July 1, 1987: Purchases of certain farm and industrial equipment and machinery were exempted.
January 1, 2002: Phase out of Iowa sales tax on residential utilities was passed at a rate of 1 percent per year until the phase out was completed January 1, 2006.

Iowa Department of Revenue Annual Report 7
Year in Review
Summary of FY 2017 Annual Retail Sales Tax Data Total retail sales computed tax on returns filed for the fiscal year ending June 30, 2017 was $2,327.3 million, a 1.4 percent increase from the $2,295.2 million computed in fiscal year 2016 (see Figure 2). The number of quarterly and annual returns filed decreased from 295,335 in fiscal year 2016 to 293,967 in fiscal year 2017, a 0.5 percent decline (see Table 7). Summary of FY 2017 Quarterly Retail Sales Tax Data The December quarter had the most computed tax, 26.2 percent of the 2017 fiscal year total, with the June quarter second at 26.0 percent (see Table 2). The strong December quarter is typical, with the December quarter having the highest share of tax in fiscal years 2010 through 2013 and 2015 through 2017. Fiscal year 2014 was an exception when the June quarter was the strongest.

Iowa Department of Revenue Annual Report 8
Table 2. Distribution of Retail Sales Tax Collections by Quarter
FY 2010 FY 2011 FY 2012 FY 2013 FY 2014 FY 2015 FY 2016 FY 2017
September 25.6% 25.5% 25.3% 25.6% 25.5% 25.7% 25.7% 25.8%
December 26.1% 26.6% 26.3% 26.4% 26.2% 26.3% 26.1% 26.2%
March 22.4% 22.2% 22.7% 22.2% 21.9% 22.1% 22.2% 21.9%
June 25.9% 25.7% 25.7% 25.8% 26.3% 25.9% 26.0% 26.0%
FY Totals 100.0% 100.0% 100.0% 100.0% 100.0% 100.0% 100.0% 100.0%

Iowa Department of Revenue Annual Report 9
$489.9 $502.5 $521.7 $532.8 $546.6 $575.3 $588.8 $600.5
$497.8 $522.6 $543.5 $548.7 $561.4$590.0 $599.3 $610.9
$427.1$436.5
$468.8 $461.7 $470.2$496.2 $510.4 $510.0
$495.6$505.9
$530.7 $536.9$564.1
$580.5$596.7 $605.9$1,910.4 $1,967.5
$2,064.7 $2,080.1$2,142.3
$2,242.0$2,295.2 $2,327.3
$0
$500
$1,000
$1,500
$2,000
$2,500
FY 2010 FY 2011 FY 2012 FY 2013 FY 2014 FY 2015 FY 2016 FY 2017
Figure 2. Retail Sales Tax Collections in Millions by Quarter for Fiscal Years 2010-2017

Iowa Department of Revenue Annual Report 10
City Population
Number of
Returns
Percent of
Returns Computed Tax
Percent of
Tax
Growth in Tax
From FY 2016
50,000 and Above 76,737 22.74% $900,053,081 38.67% 0.66%
25,000 to 50,000 32,981 9.78% $315,974,597 13.58% 0.38%
10,000 to 25,000 34,655 10.27% $341,396,823 14.67% 2.36%
5,000 to 10,000 46,788 13.87% $288,392,165 12.39% 2.46%
2,500 to 5,000 38,945 11.54% $181,496,278 7.80% 3.07%
1,000 to 2,500 47,147 13.97% $147,123,987 6.32% 2.12%
500 to 1,000 28,267 8.38% $76,248,910 3.28% 1.77%
Less than 500 24,133 7.15% $59,080,989 2.54% 1.77%
Unincorporated Areas 7,742 2.29% $17,528,228 0.75% -3.98%
State Totals 337,395 100.00% $2,327,295,059 100.00% 1.39%
Percentages may not equal 100% due to rounding
Table 3. Retail Sales Tax
by City Population
Fiscal Year 2017

Iowa Department of Revenue Annual Report 11
Sales Tax Filing
Frequency
Number of
Quarterly or
Annual Returns
Distribution of
Quarterly or
Annual Returns Computed Tax
Distribution of
Quarterly or
Annual
Computed Tax
Growth in Tax
From FY 2016
Semi-Monthly 35,518 10.53% $1,498,976,073 64.41% 0.49%
Monthly 95,476 28.30% $661,011,510 28.40% 2.99%
Quarterly 184,111 54.57% $160,451,943 6.89% 3.04%
Annual & Other 22,290 6.61% $6,855,533 0.29% 12.09%
Total 337,395 100.0% $2,327,295,059 100.00% 1.39%
Notes:
Semi-Monthly: Businesses that remit more than $60,000 per year are required to remit tax receipts electronically
twice per month the last payment is due when the quarterly return is filed.
Monthly: Businesses that remit more than $6,000 but less than $60,000 per year are required to remit tax receipts
once per month the last payment is due when the quarterly return is filed.
Quarterly: Businesses that remit more than $120 but less than $6,000 per year are required to remit tax receipts
with each quarterly return.
Annual & Other: Businesses that remit less than $120 per year are required to file an annual return.
Table 4. Retail Sales Tax
by Filing Frequency
Fiscal Year 2017

Iowa Department of Revenue Annual Report 12
Amount of Taxable
Sales
Number of
Returns Taxable Sales Computed Tax
Percent of
Tax
$0-$499 67,876 $3,793,130 $227,225 0.01%
$500-$999 12,595 $9,289,366 $555,928 0.02%
$1,000-$1,999 18,620 $27,273,481 $1,632,606 0.07%
$2,000-$2,999 13,588 $33,564,925 $2,009,210 0.09%
$3,000-$3,999 10,986 $38,204,554 $2,286,150 0.10%
$4,000-$4,999 8,988 $40,287,060 $2,411,465 0.10%
$5,000-$9,999 30,149 $217,628,122 $13,028,276 0.56%
$10,000-$24,999 36,105 $588,433,561 $35,230,195 1.51%
$25,000-$49,999 26,141 $943,027,398 $56,462,492 2.43%
$50,000-$99,999 24,110 $1,733,340,938 $103,699,358 4.46%
$100,000-$249,999 24,699 $3,913,013,917 $233,392,175 10.03%
$250,000-$499,999 10,627 $3,686,938,922 $219,285,686 9.42%
$500,000-$999,999 5,150 $3,528,337,313 $209,241,517 8.99%
$1,000,000-$1,999,999 2,262 $3,112,500,426 $185,241,643 7.96%
$2,000,000-$4,999,999 1,293 $3,933,294,053 $234,852,933 10.09%
$5,000,000-$9,999,999 469 $3,183,839,184 $190,784,101 8.20%
$10,000,000 and Above 309 $13,963,745,594 $836,954,098 35.96%
State Totals 293,967 $38,956,511,944 $2,327,295,059 100.00%
Percentages may not sum to totals due to rounding.
The total number of returns does not equal totals presented in the other tables
of the report because consolidated returns are counted as only one return in this table.
Table 5. Retail Taxable Sales and Tax
by Amount of Taxable Sales Reported on Quarterly or Annual Return
Fiscal Year 2017

Iowa Department of Revenue Annual Report 13
Amount of Total Sales
Number of
Returns Total Sales
Percent of
Total Sales Exempt Sales
Exempt Sales
as Percent of
Total Sales
$0-$499 56,109 $4,392,644 0.00% $2,086,728 47.51%
$500-$999 10,441 $8,930,484 0.01% $3,919,912 43.89%
$1,000-$1,999 15,955 $25,312,114 0.02% $10,072,989 39.80%
$2,000-$2,999 11,932 $31,046,784 0.02% $12,200,706 39.30%
$3,000-$3,999 9,743 $35,558,287 0.03% $13,254,726 37.28%
$4,000-$4,999 8,099 $38,031,001 0.03% $13,512,568 35.53%
$5,000-$9,999 27,575 $205,542,721 0.16% $72,568,864 35.31%
$10,000-$24,999 34,577 $578,982,858 0.44% $228,792,886 39.52%
$25,000-$49,999 26,162 $961,985,973 0.74% $384,064,765 39.92%
$50,000-$99,999 25,806 $1,881,840,641 1.44% $709,294,415 37.69%
$100,000-$249,999 29,440 $4,754,892,168 3.64% $1,848,725,182 38.88%
$250,000-$499,999 15,208 $5,373,147,690 4.11% $2,448,329,865 45.57%
$500,000-$999,999 9,343 $6,581,356,154 5.04% $3,484,705,848 52.95%
$1,000,000-$1,999,999 5,664 $8,011,800,505 6.13% $5,282,407,082 65.93%
$2,000,000-$4,999,999 4,345 $13,596,002,470 10.40% $9,448,827,275 69.50%
$5,000,000-$9,999,999 1,833 $12,732,493,854 9.74% $9,363,980,574 73.54%
$10,000,000 and Above 1,735 $75,866,126,935 58.05% $58,404,186,954 76.98%
State Totals 293,967 $130,687,443,283 100.00% $91,730,931,339 70.19%
Total Sales =Gross Sales+Goods Consumed
Gross Sales are all sales of a business.
Goods Consumed are goods originally purchased tax free by a business for direct resale
or to be incorporated for resale but were used in the course of business or for personal use.
Exempt sales are sales made by the business in which sales tax was not required to be charged.
Taxable Sales=(Gross Sales+Goods Consumed-Exempt Sales)
The total number of returns does not equal totals presented in the other tables.
of the report because consolidated returns are counted as only one return in this table.
Table 6. Total Retail Sales and Exempt Sales
by Amount of Total Sales
Fiscal Year 2017

Iowa Department of Revenue Annual Report 14
Amount of Tax Due
Number of
Returns
Percent of
Returns Computed Tax
Percent of
Tax
Growth in Tax
From FY 2016
$0 - $24 65,704 22.35% $167,701 0.01% -3.74%
$25 - $49 11,018 3.75% $409,603 0.02% -0.06%
$50 - $99 17,005 5.78% $1,250,031 0.05% -0.74%
$100 - $149 12,810 4.36% $1,588,439 0.07% -1.83%
$150 - $199 10,287 3.50% $1,792,564 0.08% -1.56%
$200 - $249 8,624 2.93% $1,936,161 0.08% -1.21%
$250 - $499 29,526 10.04% $10,713,484 0.46% -1.59%
$500 - $999 28,258 9.61% $20,223,917 0.87% -0.27%
$1,000 - $1,499 15,749 5.36% $19,400,861 0.83% -2.05%
$1,500 - $1,999 10,839 3.69% $18,836,146 0.81% 1.13%
$2,000 - $2,499 8,460 2.88% $18,966,870 0.81% -1.64%
$2,500 - $2,999 6,847 2.33% $18,773,960 0.81% -1.02%
$3,000 - $3,999 10,151 3.45% $35,252,428 1.51% -1.03%
$4,000 - $4,999 7,791 2.65% $34,876,198 1.50% -1.74%
$5,000 - $9,999 21,368 7.27% $151,655,186 6.52% 0.25%
$10,000 - $24,999 17,957 6.11% $277,196,335 11.91% 1.56%
$25,000 - $49,999 6,344 2.16% $217,419,449 9.34% 1.69%
$50,000 - $99,999 2,729 0.93% $187,646,574 8.06% -0.17%
$100,000 - $199,999 1,317 0.45% $183,218,221 7.87% -1.11%
$200,000 - $499,999 807 0.27% $252,558,339 10.85% 2.70%
$500,000 - $999,999 202 0.07% $139,161,666 5.98% -4.73%
$1,000,000 and Above 174 0.06% $734,250,927 31.55% 4.02%
State Totals 293,967 100.00% $2,327,295,059 100.00% 1.39%
Percentages may not sum to totals due to rounding.
The total number of returns does not equal totals presented in the other tables of the report because
consolidated returns are counted as only one return in this table.
Table 7. Retail Sales Tax
by Amount of Tax Due Reported on Quarterly or Annual Return
Fiscal Year 2017

Iowa Department of Revenue Annual Report 15
6,118
Business Group FY 2016 FY 2017
Percent
Change FY 2016 FY 2017
Percent
Change FY 2016 FY 2017
Percent
Change
Apparel 6,225 6,215 -0.16% 1,877 1,908 1.65% $64,035,090 $61,554,138 -3.87%
Building Materials 5,943 5,695 -4.17% 1,762 1,722 -2.27% $165,801,567 $171,769,325 3.60%
Eating and Drinking 30,362 30,720 1.18% 8,610 8,769 1.85% $253,690,430 $258,376,588 1.85%
Food Dealers 12,724 12,607 -0.92% 3,575 3,548 -0.76% $208,692,021 $211,184,264 1.19%
General Merchandise 3,073 3,067 -0.20% 852 858 0.70% $283,183,667 $280,596,700 -0.91%
Home Furnishings 5,917 5,750 -2.82% 1,791 1,740 -2.85% $74,142,026 $73,679,803 -0.62%
Miscellaneous 49,763 49,819 0.11% 15,657 15,611 -0.29% $184,898,036 $187,301,315 1.30%
Motor Vehicle 9,340 9,241 -1.06% 2,769 2,752 -0.61% $111,602,318 $114,253,703 2.38%
Services 126,900 127,633 0.58% 40,085 39,791 -0.73% $311,079,755 $316,015,775 1.59%
Specialty Retail 56,083 56,480 0.71% 22,857 22,956 0.43% $183,122,171 $184,933,118 0.99%
Utilities and Transportation 14,134 13,029 -7.82% 3,631 3,581 -1.38% $220,188,699 $235,783,160 7.08%
Wholesale 17,346 17,139 -1.19% 5,168 5,029 -2.69% $234,863,639 $231,847,170 -1.28%
State Totals 337,810 337,395 -0.12% 108,634 108,265 -0.34% $2,295,299,418 $2,327,295,059 1.39%
Computed tax equals taxable goods and services subject to the 6% State sales tax multiplied by that rate plus hotel/motel room rentals and qualified construction
equipment purchases subject to the 5% State excise tax multiplied by that rate.
Table 8. Change in Retail Sales Tax Returns, Establishments and Computed Tax
by Business Group for Fiscal Years 2016 and 2017
Number of Returns Number of Establishments Computed Tax
The number of returns counts total quarterly or annual returns filed by businesses. The number of establishments counts the unique number of businesses that filed at
least one return during the fiscal year.

Iowa Department of Revenue Annual Report 16
History of Iowa Use Taxes
Effective July 1, 2008, Iowa raised the use tax to 6 percent of the purchase price of tangible personal property which is purchased outside of Iowa for use in Iowa. The tax is also owed on taxable services purchased outside of Iowa when such services or the result of such services are used in Iowa.
A use tax was first imposed in Iowa in 1937 in conjunction with the permanent adoption of the sales tax. Since its adoption, the development of the use tax has generally paralleled that of the sales tax both in terms of tax base and rates. Credits are provided, however, against the amount of use tax due in Iowa for any sales, use, or occupational taxes paid to another state.
Iowa use tax is collected under two complementary use taxes: Retailer’s Use Tax and Consumer’s Use Tax. Beginning July 1, 2008 the Motor Vehicle Use Tax was replaced with a one-time registration fee on new and used vehicles.
(1) Retailer’s Use Tax is collected by registered retailers from the purchaser on the sale of all taxable tangible property and services. Retailers located outside of the State who maintain a place of business in Iowa are required to register with the Department of Revenue and collect the tax on all sales made into Iowa.
(2) Consumer's Use Tax is paid by individuals or businesses that purchase taxable goods or services outside of Iowa for use in the State. Individuals or businesses that regularly purchase taxable goods or services of property on which the tax has not been paid are required to file a quarterly Consumer’s Use Tax return in conjunction with payment of the tax. Individuals who make occasional taxable purchases for use in Iowa are also required to remit Consumer’s Use Tax, but do not need to register for a use tax permit.
(3) A 5 percent one-time registration fee is imposed on the sale of new and used motor vehicles which are subject to registration in Iowa. The tax is imposed on the taxable price which is the delivered price less cash discounts and the value of any traded property. Payment of the tax is made to the County Treasurer where the vehicle is registered. Credits are also provided for sales or use taxes paid on motor vehicles to other states.

Iowa Department of Revenue Annual Report 17
Retailer's Use Tax by Business Group
Business Group
Number of
Returns
Percent of
Returns Taxable Sales Computed Tax
Percent
of Tax
Apparel 623 1.10% $132,008,414 $7,920,505 2.02%
Building Materials 1,110 1.96% $155,303,600 $9,318,216 2.37%
Eating and Drinking 429 0.76% $16,474,427 $988,466 0.25%
Food Dealers 353 0.62% $57,918,126 $3,475,088 0.88%
General Merchandise 126 0.22% $76,199,493 $4,571,970 1.16%
Home Furnishings 1,193 2.11% $102,552,542 $6,153,153 1.57%
Miscellaneous 14,381 25.41% $1,151,479,586 $69,083,182 17.58%
Motor Vehicle 703 1.24% $53,236,265 $3,194,176 0.81%
Services 14,237 25.15% $1,106,327,229 $66,365,193 16.89%
Specialty Retail 11,954 21.12% $1,262,877,577 $75,747,366 19.28%
Utilities and Transportation 2,613 4.62% $1,373,582,062 $82,414,924 20.97%
Wholesale 8,881 15.69% $1,064,094,032 $63,698,639 16.21%
State Totals 56,603 100.00% $6,552,053,353 $392,930,876 100.00%
Use Tax 2016 2017
Percentage
Change
Retailer's
Number of Returns 54,345 56,603 4.15%
Computed Tax $371,293,745 $392,930,876 5.83%
Consumer's
Number of Returns 26,190 26,066 -0.47%
Computed Tax $78,400,029 $72,684,560 -7.29%
Motor Vehicle
Number of Units 1,002,978 1,019,195 1.62%
Fee $323,835,599 $338,817,892 4.63%
Consumer's Remitted for Occasional Purchases
Number of Payments 927 697 -24.81%
Remitted Tax $569,783 $504,000 -11.55%
Table 9. Iowa Use Taxes
Fiscal Year 2017
Computed tax equals taxable goods and services subject to the 6% State sales tax multiplied by that rate plus
hotel/motel room rentals and qualified construction equipment purchases subject to the 5% State excise tax
Comparison of Use Taxes
Fiscal Year 2016 and 2017

Iowa Department of Revenue Annual Report 18
Amount of Tax Due
Number of
Returns
Percent of
Returns Computed Tax
Percent of
Tax
Growth in Tax
From FY 2016
$0 - $24 22,212 39.24% $29,125 0.01% 13.67%
$25 - $49 1,712 3.02% $62,792 0.02% 9.61%
$50 - $99 2,387 4.22% $175,154 0.04% 9.55%
$100 - $149 1,749 3.09% $215,102 0.05% 8.47%
$150 - $199 1,408 2.49% $244,522 0.06% 11.17%
$200 - $249 1,133 2.00% $253,996 0.06% 2.07%
$250 - $499 3,963 7.00% $1,437,022 0.37% 0.18%
$500 - $999 4,241 7.49% $3,073,022 0.78% 2.41%
$1,000 - $1,499 2,448 4.32% $3,020,678 0.77% 0.20%
$1,500 - $1,999 1,695 2.99% $2,942,135 0.75% -3.24%
$2,000 - $2,499 1,318 2.33% $2,937,725 0.75% 0.91%
$2,500 - $2,999 1,081 1.91% $2,970,111 0.76% 6.27%
$3,000 - $3,999 1,594 2.82% $5,542,373 1.41% 2.20%
$4,000 - $4,999 1,220 2.16% $5,463,311 1.39% 7.38%
$5,000 - $9,999 3,108 5.49% $22,161,445 5.64% 1.95%
$10,000 - $24,999 2,745 4.85% $43,428,227 11.05% 5.39%
$25,000 - $49,999 1,235 2.18% $43,248,853 11.01% -3.95%
$50,000 - $99,999 698 1.23% $48,691,963 12.39% 3.30%
$100,000 and Above 656 1.16% $207,033,319 52.69% 9.79%
State Totals 56,603 100.00% $392,930,876 100.00% 5.83%
Table 10. Retailer's Use Tax
by Amount of Tax Due on Quarterly or Annual Returns
Fiscal Year 2017

Iowa Department of Revenue Annual Report 19
Amount of Tax Due
Number of
Returns
Percent of
Returns Computed Tax
Percent of
Tax
Growth in Tax
From FY 2016
$0 - $24 11,514 44.17% $26,896 0.04% 0.15%
$25 - $49 1,434 5.50% $52,452 0.07% -10.49%
$50 - $99 1,833 7.03% $133,370 0.18% -3.36%
$100 - $149 1,155 4.43% $142,919 0.20% -0.46%
$150 - $199 889 3.41% $154,718 0.21% -1.58%
$200 - $249 703 2.70% $157,717 0.22% 6.77%
$250 - $499 2,008 7.70% $722,644 0.99% -0.15%
$500 - $999 1,782 6.84% $1,268,397 1.75% -0.81%
$1,000 - $1,499 948 3.64% $1,155,852 1.59% 1.93%
$1,500 - $1,999 609 2.34% $1,054,569 1.45% 0.47%
$2,000 - $2,499 392 1.50% $871,434 1.20% -8.88%
$2,500 - $2,999 277 1.06% $759,621 1.05% -16.64%
$3,000 - $3,999 444 1.70% $1,536,721 2.11% 0.42%
$4,000 - $4,999 278 1.07% $1,248,769 1.72% -0.55%
$5,000 - $9,999 703 2.70% $4,950,906 6.81% -3.91%
$10,000 - $24,999 681 2.61% $10,620,861 14.61% 3.02%
$25,000 - $49,999 232 0.89% $8,156,480 11.22% -2.53%
$50,000 - $99,999 90 0.35% $5,993,892 8.25% -25.99%
$100,000 and Above 94 0.36% $33,676,344 46.33% -8.88%
State Totals 26,066 100.00% $72,684,562 100.00% -7.29%
Table 11. Consumer's Use Tax
by Amount of Tax Due on Quarterly Returns or Annual Returns
Fiscal Year 2017