review clinical applications of tandem mass...
TRANSCRIPT
758 (2001) 27–48Journal of Chromatography B,www.elsevier.com/ locate /chromb
Review
Clinical applications of tandem mass spectrometry: ten years ofdiagnosis and screening for inherited metabolic diseases
*Mohamed S. RashedMetabolic Screening Laboratory, King Faisal Specialist Hospital and Research Centre, P.O. Box 3354, Takhasusi Road, Riyadh 11211,
Saudi Arabia
Abstract
This paper reviews the clinical applications of tandem mass spectrometry (MS–MS) in diagnosis and screening forinherited metabolic diseases in the last 10 years. The broad-spectrum of diseases covered, specificity, ease of samplepreparation, and high throughput provided by the MS–MS technology has led to the development of multi-disorder newbornscreening programs in many countries for amino acid disorders, organic acidemias, and fatty acid oxidation defects. Issuesrelated to sample acquisition, sample preparation, quantification of metabolites, and validation are discussed. Our currentexperience with the technique in screening is presented. The application of MS–MS in selective screening has revolutionizedthe field and made a major impact on the detection of certain disease classes such as the fatty acid oxidation defects. Newspecific and rapid MS–MS and LC–MS–MS methods for highly polar small molecules are supplementing or replacing someof the classical GC–MS methods for a multitude of metabolites and disorders. New exciting applications are appearing infields of prenatal, postnatal, and even postmortem diagnosis. Examples for pitfalls in the technique are also presented. 2001 Elsevier Science B.V. All rights reserved.
Keywords: Reviews; Inherited metabolic diseases; Acylcarnitines; Acylglycines
Contents
1. Introduction ............................................................................................................................................................................ 282. MS–MS-based newborn screening ........................................................................................................................................... 30
2.1. Samples and sample preparation ...................................................................................................................................... 302.2. Quantification of metabolites and choice of internal standards ............................................................................................ 312.3. Instrumentation and data acquisition................................................................................................................................. 312.4. Validation of methods...................................................................................................................................................... 322.5. Current experience with newborn screening ...................................................................................................................... 33
3. MS–MS-based selective screening ........................................................................................................................................... 343.1. Postnatal diagnosis.......................................................................................................................................................... 34
3.1.1. Determination of free carnitine and acylcarnitines.................................................................................................. 353.1.2. Determination of amino acids............................................................................................................................... 363.1.3. Analysis of acylglycines ...................................................................................................................................... 373.1.4. Analysis of organic acids ..................................................................................................................................... 39
*Fax: 1966-1-442-4546.E-mail address: [email protected] (M.S. Rashed).
0378-4347/01/$ – see front matter 2001 Elsevier Science B.V. All rights reserved.PI I : S0378-4347( 01 )00100-1
758 (2001) 27–4828 M.S. Rashed / J. Chromatogr. B
3.1.5. Analysis of purine and pyrimidines....................................................................................................................... 393.1.6. Analysis of bile acids and very-long-chain fatty acids ............................................................................................ 40
3.2. Postmortem diagnosis...................................................................................................................................................... 423.3. Prenatal diagnosis ........................................................................................................................................................... 423.4. In vitro loading studies .................................................................................................................................................... 43
4. Pitfalls in neonatal and selective screening by MS–MS.............................................................................................................. 435. Conclusions and perspectives ................................................................................................................................................... 456. Nomenclature ......................................................................................................................................................................... 46Acknowledgements ...................................................................................................................................................................... 46References .................................................................................................................................................................................. 46
1. Introduction circulating ACs, increased excretion of ACs in urine,and secondary C0 deficiency. Therefore, metabolic
Inherited metabolic disorders (IMDs) are a group profiling of free C0 and ACs in plasma, blood spots,of over 200 single gene disorders primarily inherited or urine provides a powerful selective screening toolas autosomal recessive traits. Many of these dis- for these disorders.orders carry serious clinical consequences to the Unlike AAs, for which existed many thin-layeraffected neonate or young infant, which include mild chromatography (TLC), high-performance liquidor severe irreversible mental retardation, physical chromatography (HPLC), electrophoresis, and gashandicaps, or even fatality. An accurate diagnosis of chromatography–mass chromatography (GC–MS)IMD is very important for reaching a rapid and methods, ACs were difficult to analyze due to theirfavorable patient outcome. The application of tan- polarity, zwitterionic nature, their relatively lowdem mass spectrometry (MS–MS) to the area of concentration in body fluids, and the lack of aIMDs first appeared about 10 years ago. The applica- chromophore. Various spectrophotometric, radio-tion of this technology has had a significant impact chemical, or mass spectrometric methods wereon the field realized in the significant increase in the developed for this purpose, with some still in usespectrum of diseases which can be screened, the [3–9]. However, these methods shared some of thedevelopment of multi-disease screening tests, the drawbacks of lack of sensitivity or specificity, labori-ever-increasing number of cases diagnosed among ous sample preparation, and long analytical time.sick children (selective screening), the detection of The initial excitement about MS–MS in this areadiseases thought to be present only in certain ethnic of research stemmed from its successful use ingroups, the saving of many lives, the acquisition of obtaining AC profiles from plasma and urine samplesthe technology by many clinical chemistry units or in a short analytical time of 2–3 min, with nobiochemical genetics laboratories, and the intro- chromatography. These profiles were highly specificduction of MS–MS in several newly developed or and diagnostic for the recently recognized fatty acidalready existing newborn screening (NBS) programs oxidation defects (FOADs) and for organicaround the world. acidemias due to disorders in branched-chain AA
Organic acidemias caused by mitochondrial catabolism disorders. For the first few years of theenzyme defects in the catabolism of branched-chain last decade the group at Duke University pioneeredamino acids (AAs) and mitochondrial fatty acid the use of fast atom bombardment (FAB) MS–MSoxidation defects constitute a group of .20 disorders for profiling ACs from dried blood spots (DBSs), orin which acyl-Coenzyme A (acyl-CoA) esters plasma [10,11]. The ‘‘soft’’ ionization characteristicsaccumulate in the mitochondria. In these disorders, of FAB allowed the analysis of ACs either as theirL-carnitine (C0) plays a key role in removing the methyl or butyl esters. Thus, precursor-ion scans ofpotentially toxic acylCoA esters through the forma- m /z 85, the major fragment produced by collision-tion of acylcarnitine (AC) esters and thereby releas- induced dissociation of all butylated ACs and theing CoA and restoring mitochondrial homeostasis second major fragment of the butyl ester of C0[1,2]. This results in increased concentrations of produced a mass spectrum that showed C0 and all
758 (2001) 27–48 29M.S. Rashed / J. Chromatogr. B
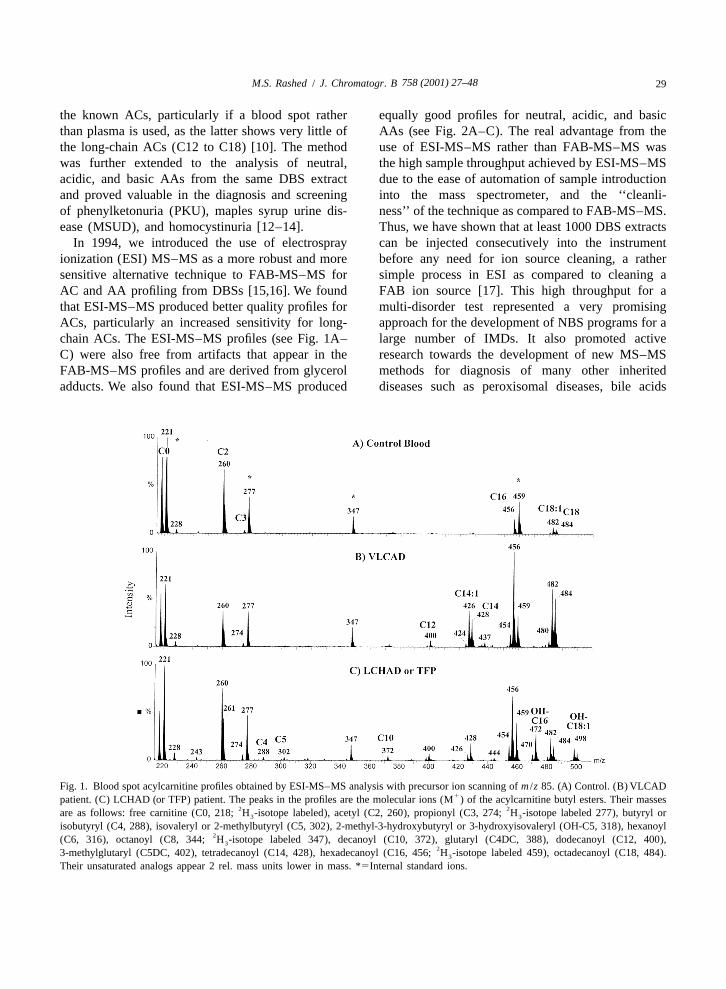
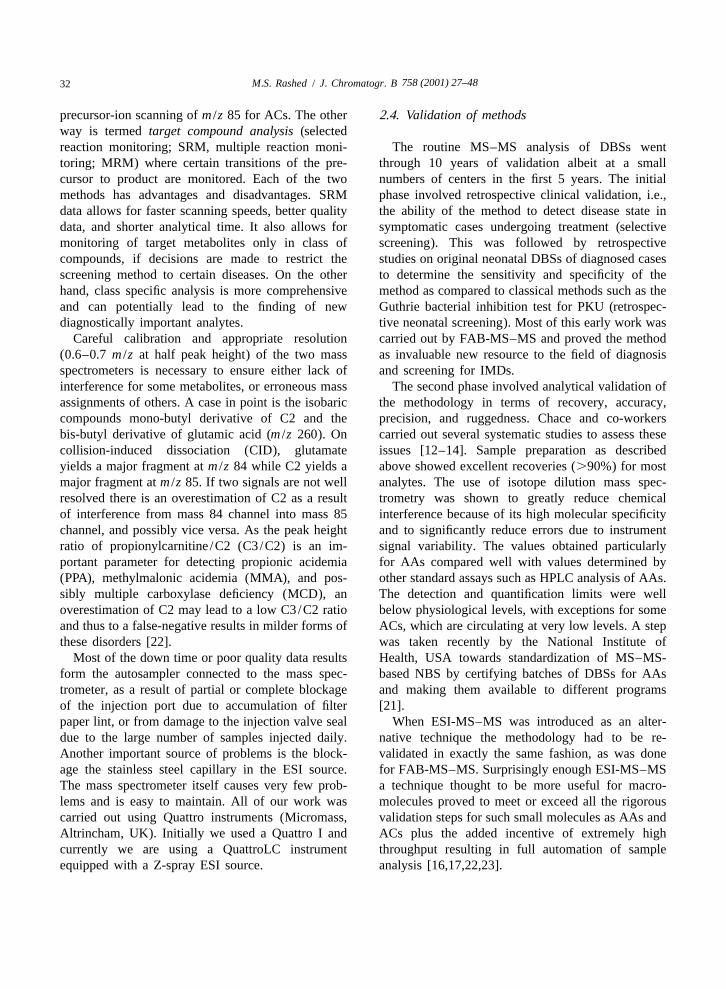
the known ACs, particularly if a blood spot rather equally good profiles for neutral, acidic, and basicthan plasma is used, as the latter shows very little of AAs (see Fig. 2A–C). The real advantage from thethe long-chain ACs (C12 to C18) [10]. The method use of ESI-MS–MS rather than FAB-MS–MS waswas further extended to the analysis of neutral, the high sample throughput achieved by ESI-MS–MSacidic, and basic AAs from the same DBS extract due to the ease of automation of sample introductionand proved valuable in the diagnosis and screening into the mass spectrometer, and the ‘‘cleanli-of phenylketonuria (PKU), maples syrup urine dis- ness’’ of the technique as compared to FAB-MS–MS.ease (MSUD), and homocystinuria [12–14]. Thus, we have shown that at least 1000 DBS extracts
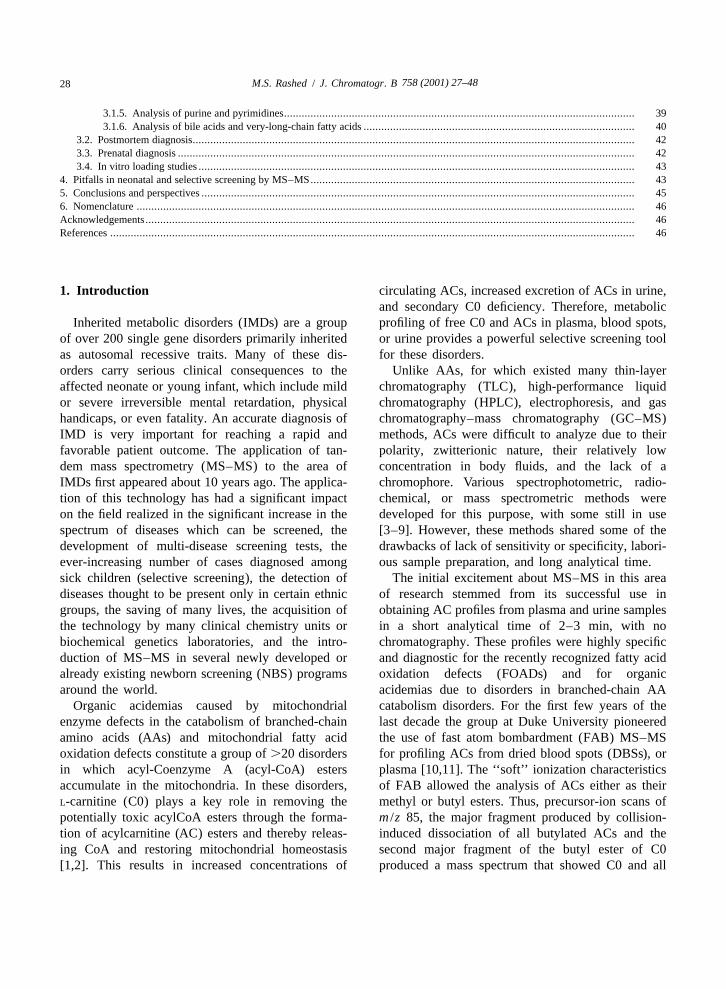
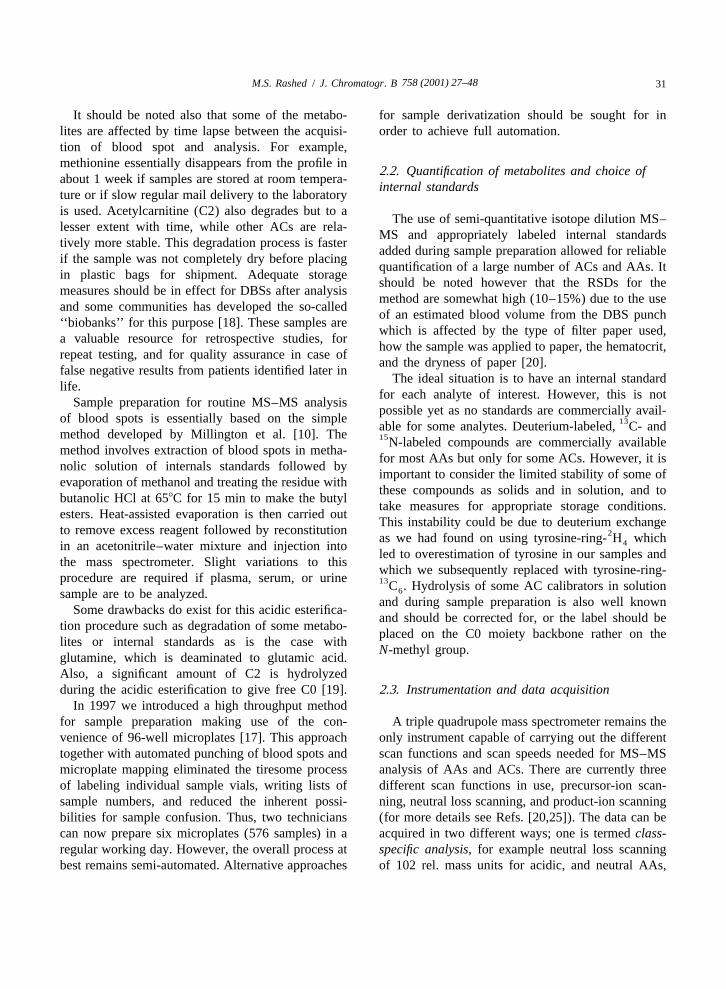
In 1994, we introduced the use of electrospray can be injected consecutively into the instrumentionization (ESI) MS–MS as a more robust and more before any need for ion source cleaning, a rathersensitive alternative technique to FAB-MS–MS for simple process in ESI as compared to cleaning aAC and AA profiling from DBSs [15,16]. We found FAB ion source [17]. This high throughput for athat ESI-MS–MS produced better quality profiles for multi-disorder test represented a very promisingACs, particularly an increased sensitivity for long- approach for the development of NBS programs for achain ACs. The ESI-MS–MS profiles (see Fig. 1A– large number of IMDs. It also promoted activeC) were also free from artifacts that appear in the research towards the development of new MS–MSFAB-MS–MS profiles and are derived from glycerol methods for diagnosis of many other inheritedadducts. We also found that ESI-MS–MS produced diseases such as peroxisomal diseases, bile acids
Fig. 1. Blood spot acylcarnitine profiles obtained by ESI-MS–MS analysis with precursor ion scanning of m /z 85. (A) Control. (B) VLCAD1patient. (C) LCHAD (or TFP) patient. The peaks in the profiles are the molecular ions (M ) of the acylcarnitine butyl esters. Their masses
2 2are as follows: free carnitine (C0, 218; H -isotope labeled), acetyl (C2, 260), propionyl (C3, 274; H -isotope labeled 277), butyryl or3 3
isobutyryl (C4, 288), isovaleryl or 2-methylbutyryl (C5, 302), 2-methyl-3-hydroxybutyryl or 3-hydroxyisovaleryl (OH-C5, 318), hexanoyl2(C6, 316), octanoyl (C8, 344; H -isotope labeled 347), decanoyl (C10, 372), glutaryl (C4DC, 388), dodecanoyl (C12, 400),3
23-methylglutaryl (C5DC, 402), tetradecanoyl (C14, 428), hexadecanoyl (C16, 456; H -isotope labeled 459), octadecanoyl (C18, 484).3
Their unsaturated analogs appear 2 rel. mass units lower in mass. *5Internal standard ions.
758 (2001) 27–4830 M.S. Rashed / J. Chromatogr. B
Fig. 2. Blood spots amino acid profiles obtained by ESI-MS–MS analysis with neutral loss scanning of 112 rel. mass units. (A) Control.1(B) MSUD patient. (C) PKU patient. *5Internal standard ion. The peaks in the profiles are the protonated molecular ions (MH ) of the
amino acid butyl esters.
disorders, purine and pyrimidine metabolism dis- the sensitivity for many analytes allowing the diag-orders. nosis in samples acquired in less than 24 h after
birth. There is also increased specificity resulting inlow false positives. However, this is tempered bysituations where the rise of the diagnostic marker
2. MS–MS-based newborn screening may be slow leading to false negative results. Itappears that the best time for sample collection for a
2.1. Samples and sample preparation large number of disorders lies between 48 and 72 h.This however poses a significant logistical problem
There is no doubt that the DBS remains the most for most communities and could significantly in-convenient, practical, and cheapest way of acquiring crease the cost of sample acquisition, or result in athe sample for NBS. However, there are several significant decrease in coverage of the newbornissues related to the time of sample collection, population.method of collection, shipment of samples, and DBS collection from a heel prick is supposedlystorage conditions that should be considered. Time simple, but yet we still find a lot of poor qualityof sample collection remains a chronic problem for samples that may result in both false negative andNBS programs because of the universal problem false positive results. Therefore, adequate trainingof early discharge of mother and baby from the and education of health professionals involved in thishospital. There is a general agreement among work- process should be taken in consideration wheners in the field that MS–MS analysis has increased initiating NBS programs.
758 (2001) 27–48 31M.S. Rashed / J. Chromatogr. B
It should be noted also that some of the metabo- for sample derivatization should be sought for inlites are affected by time lapse between the acquisi- order to achieve full automation.tion of blood spot and analysis. For example,methionine essentially disappears from the profile in
2.2. Quantification of metabolites and choice ofabout 1 week if samples are stored at room tempera-
internal standardsture or if slow regular mail delivery to the laboratoryis used. Acetylcarnitine (C2) also degrades but to a
The use of semi-quantitative isotope dilution MS–lesser extent with time, while other ACs are rela-
MS and appropriately labeled internal standardstively more stable. This degradation process is faster
added during sample preparation allowed for reliableif the sample was not completely dry before placing
quantification of a large number of ACs and AAs. Itin plastic bags for shipment. Adequate storage
should be noted however that the RSDs for themeasures should be in effect for DBSs after analysis
method are somewhat high (10–15%) due to the useand some communities has developed the so-called
of an estimated blood volume from the DBS punch‘‘biobanks’’ for this purpose [18]. These samples are
which is affected by the type of filter paper used,a valuable resource for retrospective studies, for
how the sample was applied to paper, the hematocrit,repeat testing, and for quality assurance in case of
and the dryness of paper [20].false negative results from patients identified later in
The ideal situation is to have an internal standardlife.
for each analyte of interest. However, this is notSample preparation for routine MS–MS analysis
possible yet as no standards are commercially avail-of blood spots is essentially based on the simple 13able for some analytes. Deuterium-labeled, C- andmethod developed by Millington et al. [10]. The 15N-labeled compounds are commercially availablemethod involves extraction of blood spots in metha-
for most AAs but only for some ACs. However, it isnolic solution of internals standards followed by
important to consider the limited stability of some ofevaporation of methanol and treating the residue with
these compounds as solids and in solution, and tobutanolic HCl at 658C for 15 min to make the butyl
take measures for appropriate storage conditions.esters. Heat-assisted evaporation is then carried out
This instability could be due to deuterium exchangeto remove excess reagent followed by reconstitution 2as we had found on using tyrosine-ring- H which4in an acetonitrile–water mixture and injection into
led to overestimation of tyrosine in our samples andthe mass spectrometer. Slight variations to this
which we subsequently replaced with tyrosine-ring-procedure are required if plasma, serum, or urine 13C . Hydrolysis of some AC calibrators in solution6sample are to be analyzed.
and during sample preparation is also well knownSome drawbacks do exist for this acidic esterifica-
and should be corrected for, or the label should betion procedure such as degradation of some metabo-
placed on the C0 moiety backbone rather on thelites or internal standards as is the case with
N-methyl group.glutamine, which is deaminated to glutamic acid.Also, a significant amount of C2 is hydrolyzedduring the acidic esterification to give free C0 [19]. 2.3. Instrumentation and data acquisition
In 1997 we introduced a high throughput methodfor sample preparation making use of the con- A triple quadrupole mass spectrometer remains thevenience of 96-well microplates [17]. This approach only instrument capable of carrying out the differenttogether with automated punching of blood spots and scan functions and scan speeds needed for MS–MSmicroplate mapping eliminated the tiresome process analysis of AAs and ACs. There are currently threeof labeling individual sample vials, writing lists of different scan functions in use, precursor-ion scan-sample numbers, and reduced the inherent possi- ning, neutral loss scanning, and product-ion scanningbilities for sample confusion. Thus, two technicians (for more details see Refs. [20,25]). The data can becan now prepare six microplates (576 samples) in a acquired in two different ways; one is termed class-regular working day. However, the overall process at specific analysis, for example neutral loss scanningbest remains semi-automated. Alternative approaches of 102 rel. mass units for acidic, and neutral AAs,
758 (2001) 27–4832 M.S. Rashed / J. Chromatogr. B
precursor-ion scanning of m /z 85 for ACs. The other 2.4. Validation of methodsway is termed target compound analysis (selectedreaction monitoring; SRM, multiple reaction moni- The routine MS–MS analysis of DBSs wenttoring; MRM) where certain transitions of the pre- through 10 years of validation albeit at a smallcursor to product are monitored. Each of the two numbers of centers in the first 5 years. The initialmethods has advantages and disadvantages. SRM phase involved retrospective clinical validation, i.e.,data allows for faster scanning speeds, better quality the ability of the method to detect disease state indata, and shorter analytical time. It also allows for symptomatic cases undergoing treatment (selectivemonitoring of target metabolites only in class of screening). This was followed by retrospectivecompounds, if decisions are made to restrict the studies on original neonatal DBSs of diagnosed casesscreening method to certain diseases. On the other to determine the sensitivity and specificity of thehand, class specific analysis is more comprehensive method as compared to classical methods such as theand can potentially lead to the finding of new Guthrie bacterial inhibition test for PKU (retrospec-diagnostically important analytes. tive neonatal screening). Most of this early work was
Careful calibration and appropriate resolution carried out by FAB-MS–MS and proved the method(0.6–0.7 m /z at half peak height) of the two mass as invaluable new resource to the field of diagnosisspectrometers is necessary to ensure either lack of and screening for IMDs.interference for some metabolites, or erroneous mass The second phase involved analytical validation ofassignments of others. A case in point is the isobaric the methodology in terms of recovery, accuracy,compounds mono-butyl derivative of C2 and the precision, and ruggedness. Chace and co-workersbis-butyl derivative of glutamic acid (m /z 260). On carried out several systematic studies to assess thesecollision-induced dissociation (CID), glutamate issues [12–14]. Sample preparation as describedyields a major fragment at m /z 84 while C2 yields a above showed excellent recoveries (.90%) for mostmajor fragment at m /z 85. If two signals are not well analytes. The use of isotope dilution mass spec-resolved there is an overestimation of C2 as a result trometry was shown to greatly reduce chemicalof interference from mass 84 channel into mass 85 interference because of its high molecular specificitychannel, and possibly vice versa. As the peak height and to significantly reduce errors due to instrumentratio of propionylcarnitine /C2 (C3/C2) is an im- signal variability. The values obtained particularlyportant parameter for detecting propionic acidemia for AAs compared well with values determined by(PPA), methylmalonic acidemia (MMA), and pos- other standard assays such as HPLC analysis of AAs.sibly multiple carboxylase deficiency (MCD), an The detection and quantification limits were welloverestimation of C2 may lead to a low C3/C2 ratio below physiological levels, with exceptions for someand thus to a false-negative results in milder forms of ACs, which are circulating at very low levels. A stepthese disorders [22]. was taken recently by the National Institute of
Most of the down time or poor quality data results Health, USA towards standardization of MS–MS-form the autosampler connected to the mass spec- based NBS by certifying batches of DBSs for AAstrometer, as a result of partial or complete blockage and making them available to different programsof the injection port due to accumulation of filter [21].paper lint, or from damage to the injection valve seal When ESI-MS–MS was introduced as an alter-due to the large number of samples injected daily. native technique the methodology had to be re-Another important source of problems is the block- validated in exactly the same fashion, as was doneage the stainless steel capillary in the ESI source. for FAB-MS–MS. Surprisingly enough ESI-MS–MSThe mass spectrometer itself causes very few prob- a technique thought to be more useful for macro-lems and is easy to maintain. All of our work was molecules proved to meet or exceed all the rigorouscarried out using Quattro instruments (Micromass, validation steps for such small molecules as AAs andAltrincham, UK). Initially we used a Quattro I and ACs plus the added incentive of extremely highcurrently we are using a QuattroLC instrument throughput resulting in full automation of sampleequipped with a Z-spray ESI source. analysis [16,17,22,23].
758 (2001) 27–48 33M.S. Rashed / J. Chromatogr. B
Another important aspect of validation related to three cases of PKU (one of which was a biopterin-data reduction is the use of software algorithms for dependent PKU), two MSUD, two argininosuccinicdata reduction and decision-making. The acquired acidemia, two citrullinemia, one non-ketoticraw data files contain a large number of signals that hyperglycinemia, two glutaric acidemia type-I (GA-has to be processed and a relatively large number of I), four MMA, one PPA, two isovaleric acidemiacalculations have to be carried out to obtain metabo- (IVA), and two medium-chain acyl-CoA dehydro-lite concentrations, or ratios of metabolites. The genase deficiency (MCAD). Three metabolites con-generated values have to be compared to cutoff tributed most to our falsely flagged samples. C3, orvalues so that appropriate decisions can be made the C3/C2 ratio was high in many infants and thisregarding a particular data file. This is a very correlated with the early collection of blood spot.laborious process and requires automation. These C5-Carnitine, which could be either isovalerylcar-algorithms should be rigorously validated to avoid nitine diagnostic for IVA, or pivalylcarnitine. Thefalse negative results, which could be costly to the latter interference results from the use of pivalic acidoverall program. prodrug antibiotics given during pregnancy or given
We described the development of a software to the infant [2]. Glycine, was found borderline highprogram for the automated processing of all data files in several samples, but was normal on repeat analy-to eliminate the labor-intensive and subjective pro- sis of the same sample, or a second sample.cess of manual data interpretation. We developed, Several other prospective NBS studies were alsotested, and validated a computer-assisted metabolic described recently. Naylor and Chace described aprofiling algorithm (CAMPA), and introduced it into 7-year study using both FAB-MS–MS and ESI-MS–our clinical service in 1997 [17]. CAMPA processed MS in analyzing more than 700 000 samples fromthe raw data, calculated all desired parameters, and newborns from several states in the USA [26]. Theyflagged abnormal results. Retrospective experiments prospectively diagnosed 163 cases, of which 86 werewere carried out to validate the performance of amino acid metabolism errors, 32 organic acidemias,CAMPA before its introduction into our daily ser- and 45 fatty acid oxidation defects. According tovice. The results indicated that the sensitivity of the these authors the presence of false positives with ACalgorithm was 100% and the weighted average screening was not a serious problem with the excep-cumulative specificity was 83.1%. Other similar tion of C3 where an appropriate cutoff value couldalgorithms were later made available either by the not be established because maternal and newborninstrument manufacturers, or written in the labora- cobalamin deficiencies affect the levels of C3.tory by users [24]. Wiley et al. described a 12-month experiment
where they screened 137 120 blood spots using ESI-2.5. Current experience with newborn screening MS–MS. Samples were collected between 48 and 72 h.
They detected 31 babies with an IMD, 17 PKU, oneIn a recent article we related our 3-year experience tetrahydrobiopterin deficiency, three hyperphenyl-
(1995–1998) for pilot prospective NBS using MS– alaninemia, one MSUD, one tyrosinemia type II, oneMS in the Saudi population. We screened 27 624 congenital lactic acidosis, two MCAD, one short-blood spots from newborns and identified 20 cases chain acyl-CoA dehydrogenase deficiency (SCAD),yielding a frequency of 1:1381 [25]. No false-nega- one beta-ketothiolase (BKT), two vitamin B12 de-tive cases were identified. However, sample collec- ficient babies of vegetarian mothers, and one GA-Ition time was quite early and averaged 24.87616.4 h, [24].which was a reason for concern. Several false- Shigematsu et al. described a pilot study wherepositive results were obtained. These were either 23 000 blood spots were screened by ESI-MS–MS ineliminated by repeat analysis by MS–MS on the Japan [27]. One PPA was detected. These authorssame or a second blood spot, by GC–MS analysis of also indicated a false positive rate in the diagnosis ofurine for organic acids, and by MS–MS analysis of IVA due to the use of pivalic acid-containing anti-cerebrospinal fluid (CSF) for determination of biotics of 0.37%. Liebl et al. described their 1-yearglycine. In the study described we have identified NBS experiment using MS–MS as well as other
758 (2001) 27–4834 M.S. Rashed / J. Chromatogr. B
screening tests. They screened 87 000 newborns and proposed a C8 concentration .1.0 mM, or a C8diagnosed 22 cases by MS–MS. Among these cases concentration between 0.38 and 1.0 mM couplednine were PKU, and six MCAD [28]. with evidence of C0 depletion (free C0,20 mM) is
MCAD appears to be the most common FAOD in predictive. They also proposed in such cases tothe West and the prognosis and the quality of life is check for the A985G mutation on the same bloodquite good for early detected and treated cases. spot. In cases with C8 of ,1.0 mM and negativeTherefore, there is a significant interest in neonatal homozygosity for the A985G mutation, further testsscreening for this disease. Actually, several states in are required to determine compound heterozygotesthe USA are now screening for this disease by MCAD, such as cis-4-decenoic acid determinationMS–MS. In this regard, Ziadeh et al. described a by GC–MS [31].prospective neonatal screening for MCAD in Penn- There appear to be a concern for false negativesylvania, PA, USA [29]. Their findings indicated a results from homocystinuria patients affected withhigh incidence for the disease and unexpected muta- CBS deficiency as none of the prospective studiestion frequencies. Thus, from 80 371 newborns described above reported any cases ofscreened they found nine babies with MCAD homocystinuria. The current methodology detects(1 /8390) plus two additional MCAD in high-risk homocystinuria by the finding of elevatedbabies. Molecular analysis showed 56% of the methionine. The early discharge of babies fromdetected patients to be compound heterozygotes for hospitals and the known slow increase of methioninethe common A985G mutation together with a second in this condition may lead to false negative results.mutation. This was in contrast to retrospective For this reason some centers has lowered their cutoffclinical studies, which have found only 20% to be values for methionine to 1 mg/dl (67 mM), or evencompound heterozygotes. In another study a com- 0.7 mg/dl (47 mM) [26].bined set of newborns from the above study andfrom newborns from North Carolina the frequencywas found to be 1:17 706 [14]. These authors used 3. MS–MS-based selective screeningFAB-MS–MS to validate the measurement ofoctanoylcarnitine (C8), the pathognomonic metabolite Although the main attraction of MS–MS in flowin MCAD as well as C6- and C10-carnitines using injection analysis mode (FIA), i.e., without chroma-2H -octanoylcarnitine as internal standard for all tography remains the proven high throughput multi-3
three analytes. Calibration curves using blood serially disorder detection applicable to NBS, the techniqueenriched with these three compounds were linear has found numerous new applications for selectivein the range of 0–10 mM. Good recovery, precision, screening and high-risk screening. The main incen-and inter- and intra-assay variation were obtained. tive in this case was the short analytical time eitherThe effect of patient age on the concentration of AC due to the elimination or shortening of the chromato-was studied in 16 older patients outside the neonatal graphic steps required for the analyte(s) of interest,age. In these patients, the diagnostic AC (C6, C8, elimination of interference, analysis of highly polarC10:1, and C10) were increased but to a lesser compounds, increase in assay precision, and simplifi-degree than observed in the neonatal period. This is cation of sample preparation, while retaining a highprobably due to progressive renal loss of C0. The level of sensitivity and specificity.authors determined however that a cutoff value of.0.3 mM and a ratio of C8/C10.2 to be predicative 3.1. Postnatal diagnosisof MCAD in all age groups.
Based on a somewhat similar study in the UK The routine MS–MS method of butylated orusing ESI-MS–MS Clayton et al. proposed a C8 methylated blood spots extracts or plasma extractsconcentration in the neonatal period (4 days to for profiling ACs and AAs has been in use for 102 weeks) of .1.2 mM with no increase in carnitine years. Numerous retrospective studies and singlespecies ,C6 or .C10 is diagnostic for MCAD [30]. case reports have been published highlighting MS–For blood spots collected later than 2 weeks, they MS as a powerful tool for selective screening for a
758 (2001) 27–48 35M.S. Rashed / J. Chromatogr. B
large number of FOADs, organic acidemias, and concentration ratios (e.g., phenylalanine / tyrosineaminoacidopathies [32–37]. Table 1 provides a list ratio), or peak height ratios (e.g., C3/C2 peak heightof diseases diagnosed by MS–MS analysis of blood ratio). To determine cutoff values for these analytesspots. The list covers diseases detected in patients (or parameters) we used the percentile method.rather than NBS and is based on the authors’ own Accordingly, the values obtained for each analyteexperience and from reviewing the current literature. were ranked, and the 0.5th and 99.5th percentiles
In 1997 we carried out a study where we analyzed were calculated. We compared these values with those.1000 blood spots from our normal newborn popu- obtained for a large data set obtained from affectedlation to establish reference ranges and cutoff values individuals suffering from different disorders.for AAs and ACs [17]. Thus, over 40 different Most of these diagnostic parameters showed a clearparameters were calculated from each data file. distinction between the abnormal values obtainedThese were concentration of some key metabolites, from patients with metabolic disorders and the upper
cutoff value from the population of unaffectednewborns.
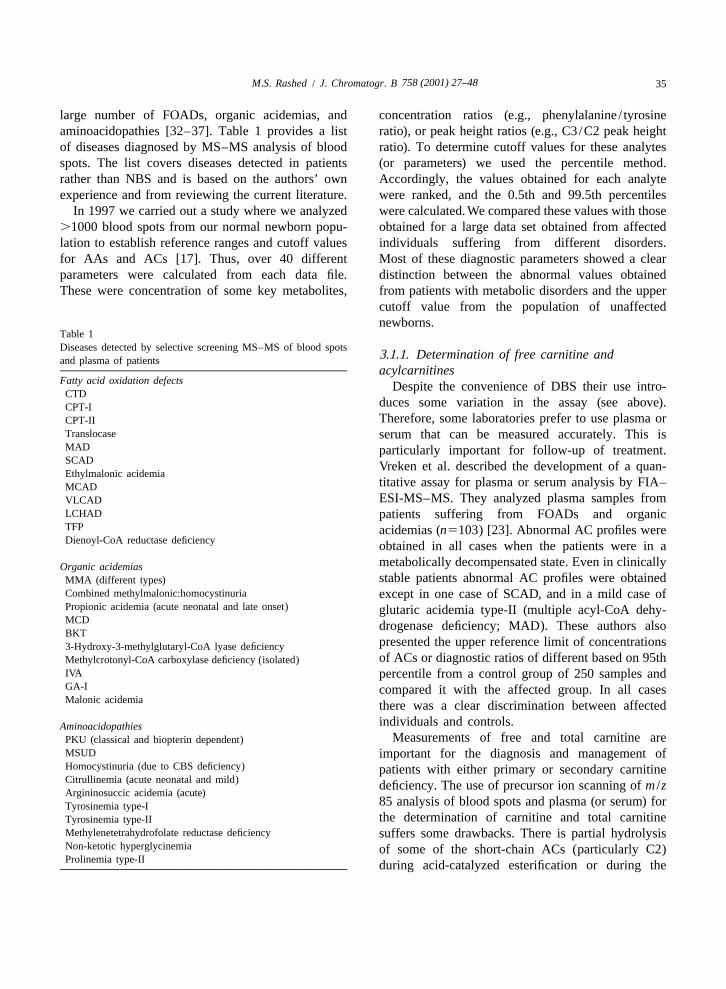
Table 1Diseases detected by selective screening MS–MS of blood spots
3.1.1. Determination of free carnitine andand plasma of patientsacylcarnitines
Fatty acid oxidation defects Despite the convenience of DBS their use intro-CTD
duces some variation in the assay (see above).CPT-ITherefore, some laboratories prefer to use plasma orCPT-II
Translocase serum that can be measured accurately. This isMAD particularly important for follow-up of treatment.SCAD Vreken et al. described the development of a quan-Ethylmalonic acidemia
titative assay for plasma or serum analysis by FIA–MCADESI-MS–MS. They analyzed plasma samples fromVLCAD
LCHAD patients suffering from FOADs and organicTFP acidemias (n5103) [23]. Abnormal AC profiles wereDienoyl-CoA reductase deficiency obtained in all cases when the patients were in a
metabolically decompensated state. Even in clinicallyOrganic acidemiasstable patients abnormal AC profiles were obtainedMMA (different types)
Combined methylmalonic:homocystinuria except in one case of SCAD, and in a mild case ofPropionic acidemia (acute neonatal and late onset) glutaric acidemia type-II (multiple acyl-CoA dehy-MCD drogenase deficiency; MAD). These authors alsoBKT
presented the upper reference limit of concentrations3-Hydroxy-3-methylglutaryl-CoA lyase deficiencyof ACs or diagnostic ratios of different based on 95thMethylcrotonyl-CoA carboxylase deficiency (isolated)
IVA percentile from a control group of 250 samples andGA-I compared it with the affected group. In all casesMalonic acidemia there was a clear discrimination between affected
individuals and controls.AminoacidopathiesMeasurements of free and total carnitine arePKU (classical and biopterin dependent)
MSUD important for the diagnosis and management ofHomocystinuria (due to CBS deficiency) patients with either primary or secondary carnitineCitrullinemia (acute neonatal and mild) deficiency. The use of precursor ion scanning of m /zArgininosuccic acidemia (acute)
85 analysis of blood spots and plasma (or serum) forTyrosinemia type-Ithe determination of carnitine and total carnitineTyrosinemia type-II
Methylenetetrahydrofolate reductase deficiency suffers some drawbacks. There is partial hydrolysisNon-ketotic hyperglycinemia of some of the short-chain ACs (particularly C2)Prolinemia type-II during acid-catalyzed esterification or during the
758 (2001) 27–4836 M.S. Rashed / J. Chromatogr. B
heat-assisted evaporation of sample extracts before tion, and derivatization to the butyl esters (see underanalysis to yield free C0, which causes an overesti- Section 2.1) (1 in.52.54 cm). The samples are thenmation of free C0 [19]. There is also a difference in injected directly into the mass spectrometer in thevalues for ACs between blood and plasma par- FIA mode at a constant flow of 40 ml /min. A 2-minticularly with regards to long-chain ACs leading to MRM scan function is carried out for three transi-differences in the values obtained for total carnitine. tions, m /z 381→192 for homocystine bis-butyl ester
1Furthermore, internal standards for many ACs are (MH 5381), m /z 367→190 for cysteine-homocys-1not commercially available and quantification of teine bis-butyl ester (MH 5367), and m /z
1these species is based on approximation to the 335→190 for cystathionine bis-butyl ester (MH 5
nearest internal standard in the spectrum possibly 335). A dwell time of 0.1 s is used for eachintroducing errors in their estimation. transition with a cone voltage of 28 V and collision
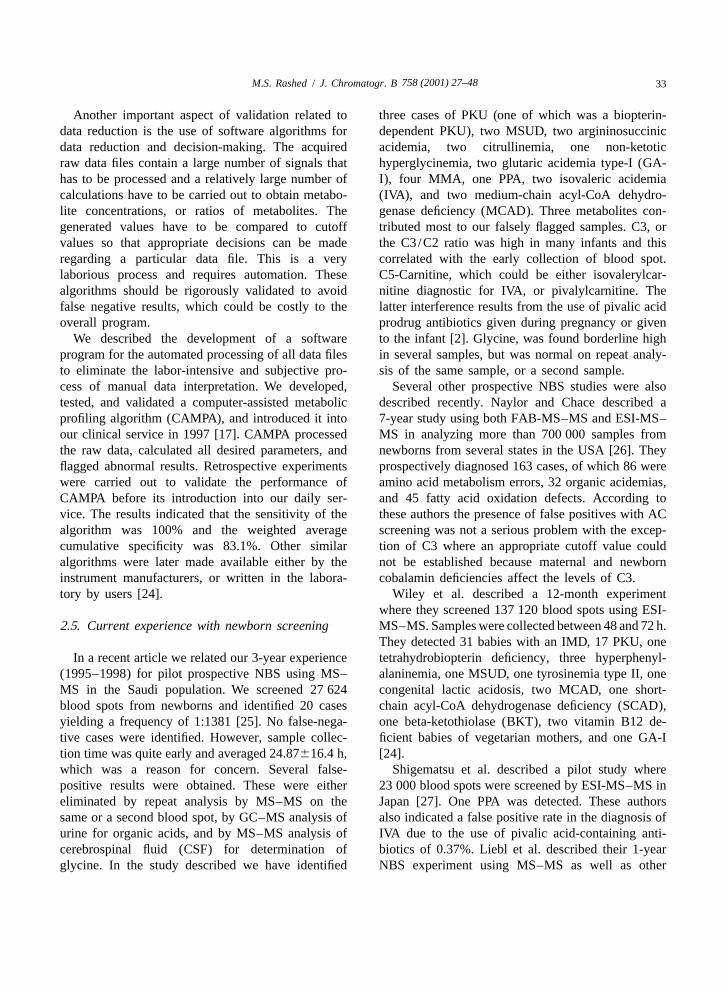
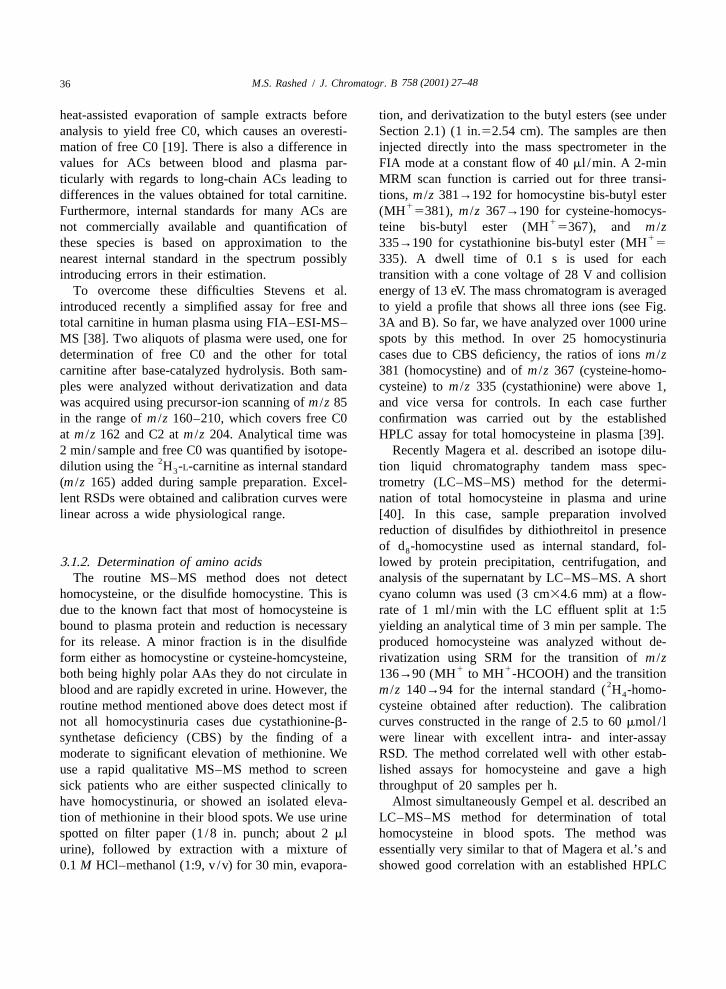
To overcome these difficulties Stevens et al. energy of 13 eV. The mass chromatogram is averagedintroduced recently a simplified assay for free and to yield a profile that shows all three ions (see Fig.total carnitine in human plasma using FIA–ESI-MS– 3A and B). So far, we have analyzed over 1000 urineMS [38]. Two aliquots of plasma were used, one for spots by this method. In over 25 homocystinuriadetermination of free C0 and the other for total cases due to CBS deficiency, the ratios of ions m /zcarnitine after base-catalyzed hydrolysis. Both sam- 381 (homocystine) and of m /z 367 (cysteine-homo-ples were analyzed without derivatization and data cysteine) to m /z 335 (cystathionine) were above 1,was acquired using precursor-ion scanning of m /z 85 and vice versa for controls. In each case furtherin the range of m /z 160–210, which covers free C0 confirmation was carried out by the establishedat m /z 162 and C2 at m /z 204. Analytical time was HPLC assay for total homocysteine in plasma [39].2 min/sample and free C0 was quantified by isotope- Recently Magera et al. described an isotope dilu-
2dilution using the H -L-carnitine as internal standard tion liquid chromatography tandem mass spec-3
(m /z 165) added during sample preparation. Excel- trometry (LC–MS–MS) method for the determi-lent RSDs were obtained and calibration curves were nation of total homocysteine in plasma and urinelinear across a wide physiological range. [40]. In this case, sample preparation involved
reduction of disulfides by dithiothreitol in presenceof d -homocystine used as internal standard, fol-8
3.1.2. Determination of amino acids lowed by protein precipitation, centrifugation, andThe routine MS–MS method does not detect analysis of the supernatant by LC–MS–MS. A short
homocysteine, or the disulfide homocystine. This is cyano column was used (3 cm34.6 mm) at a flow-due to the known fact that most of homocysteine is rate of 1 ml /min with the LC effluent split at 1:5bound to plasma protein and reduction is necessary yielding an analytical time of 3 min per sample. Thefor its release. A minor fraction is in the disulfide produced homocysteine was analyzed without de-form either as homocystine or cysteine-homcysteine, rivatization using SRM for the transition of m /z
1 1both being highly polar AAs they do not circulate in 136→90 (MH to MH -HCOOH) and the transition2blood and are rapidly excreted in urine. However, the m /z 140→94 for the internal standard ( H -homo-4
routine method mentioned above does detect most if cysteine obtained after reduction). The calibrationnot all homocystinuria cases due cystathionine-b- curves constructed in the range of 2.5 to 60 mmol / lsynthetase deficiency (CBS) by the finding of a were linear with excellent intra- and inter-assaymoderate to significant elevation of methionine. We RSD. The method correlated well with other estab-use a rapid qualitative MS–MS method to screen lished assays for homocysteine and gave a highsick patients who are either suspected clinically to throughput of 20 samples per h.have homocystinuria, or showed an isolated eleva- Almost simultaneously Gempel et al. described antion of methionine in their blood spots. We use urine LC–MS–MS method for determination of totalspotted on filter paper (1 /8 in. punch; about 2 ml homocysteine in blood spots. The method wasurine), followed by extraction with a mixture of essentially very similar to that of Magera et al.’s and0.1 M HCl–methanol (1:9, v /v) for 30 min, evapora- showed good correlation with an established HPLC
758 (2001) 27–48 37M.S. Rashed / J. Chromatogr. B
Fig. 3. Spectra obtained by averaging MRM chromatograms. (A) Control urine. (B) Homocystinuria patient. The masses in the profile arethe protonated molecular ions of the butyl esters.
method and had the same throughput as that of glutamate during the acidic esterification, and thusMagera et al. [41]. could not be accurately measured.
Casetta et al. also described an LC–ionspray-MS–MS method for the rapid determination of 18 AAs in 3.1.3. Analysis of acylglycinesplasma and DBSs in less than 4 min [42]. Sample Glycine conjugation is another detoxification path-preparation was quite similar to the largely accepted way for some organic acids in several metabolicmethod of extraction in methanolic solution using diseases. For some acyl-CoA groups this pathway is2 2H -alanine and H -phenylalanine as internal stand- recognized to be quantitatively more important than4 5
ards, evaporation, and butylation. The butyl esters conjugation with carnitine. For example, in IVA thewere injected onto a short cyano column interfaced formation of isovalerylglycine is preferable to thewith the mass spectrometer. The AAs were analyzed formation of isovalerylcarnitine due to the affinity ofin MRM mode using specific transitions for each. the substrate isovaleryl-CoA to conjugating enzyme,The specificity offered by MS–MS analysis allowed glycine-N-acylase [43,44]. Therefore, analysis ofquantification of several AAs in very short time acylglyciness was found diagnostic for several dis-windows despite significant co-elution. The method eases including the all too important and mostexhibited excellent recovery, linearity, and low common FAO disorder, MCAD. Actually, analysisRSDs. It also correlated well with values obtained of acylglycines by chemical ionization GC–MSfrom a standard AA analyzer. Furthermore, the developed by Rinaldo et al. has been recognized formethod allowed for the quantification of the isobaric many years as a key test for the confirmation ofleucine and isoleucine, which is important for moni- MCAD, independent of the clinical status of thetoring MSUD patients undergoing treatment. A patient [45]. In this case hexanoylglycine was foundparticular problem was glutamine, which degraded to to be the most diagnostic metabolite.
758 (2001) 27–4838 M.S. Rashed / J. Chromatogr. B
In one of their groundbreaking articles Millington main metabolites seen. Hexanoylglycine was alwayset al. investigated the use of FAB-MS–MS analysis high irrespective of the clinical status whileof urinary acylglycines as a complementary test to phenylpropionlyglycine and hydroxyoctanoylglycineblood AC profiling [11]. A small volume of urine were elevated during acute crises. In the neonatalwas simply dried in presence of internal standards form of MAD a C4-glycine (butyryl and isobutryl)and treated with methanolic HCl to make the methyl and C5-glycine (methylbutyryl and isovaleryl) wereesters of ACs and acylglycines. Upon CID, the the most prominent acylglycines. In IVA (5 samples),acylglycines gave a common ion at m /z 90 and PPA (47 samples) and 3-methylcrotonyl-CoA car-precursor-ion scanning of this ion gave a diagnostic boxylase deficiency (MMC) (1 sample) the typicalprofile for MCAD. The profile in this case showed glycine conjugates in urine water clearly elevated.elevated signals for the diagnostic metabolites hexa- However, the profiles were either inconsistent or notnoylglycine and suberylglycine. informative in short-chain acyl-CoA dehydrogenase
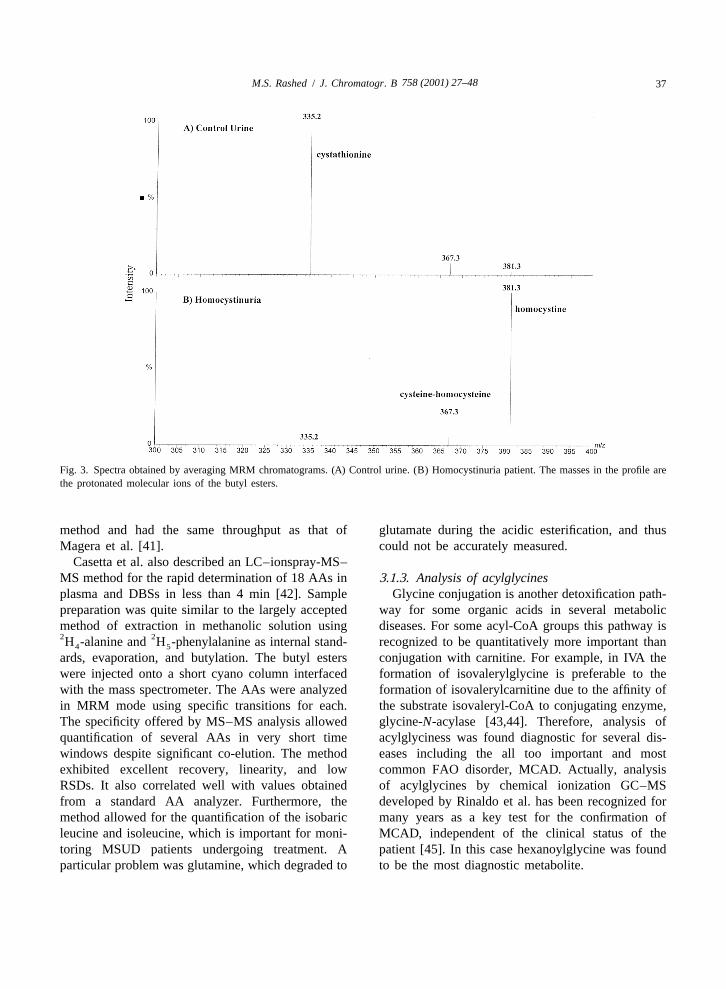
´Recently, Bonafe et al. re-evaluated the analysis of deficiency (SCAD), LCAD, VLCAD, Carnitine pal-urinary acylglycines by ESI-MS–MS while essentially mitoyltransferase deficiency type-II (CPT-II), MMA,using Millington’s method of sample preparation and GAI.and MS–MS conditions [46]. They presented a We used the butyl esters of urinary acylglycinessemiquantitative method for measuring acylglycines and ESI-MS–MS for confirmation of some of ourusing several stable-isotope labeled derivatives. In cases such as MCC and IVA. An example is shownMAD and MCAD acylglycines profiles were in Fig. 4A–C. MCC was suspected in a 4-month-oldalways informative. In MCAD, hexanoylglycine, patient based on the AC profile obtained by MS–MSphenylpropionylglycine, and suberylglycine were the analysis of the patient blood spot shown in Fig. 4A
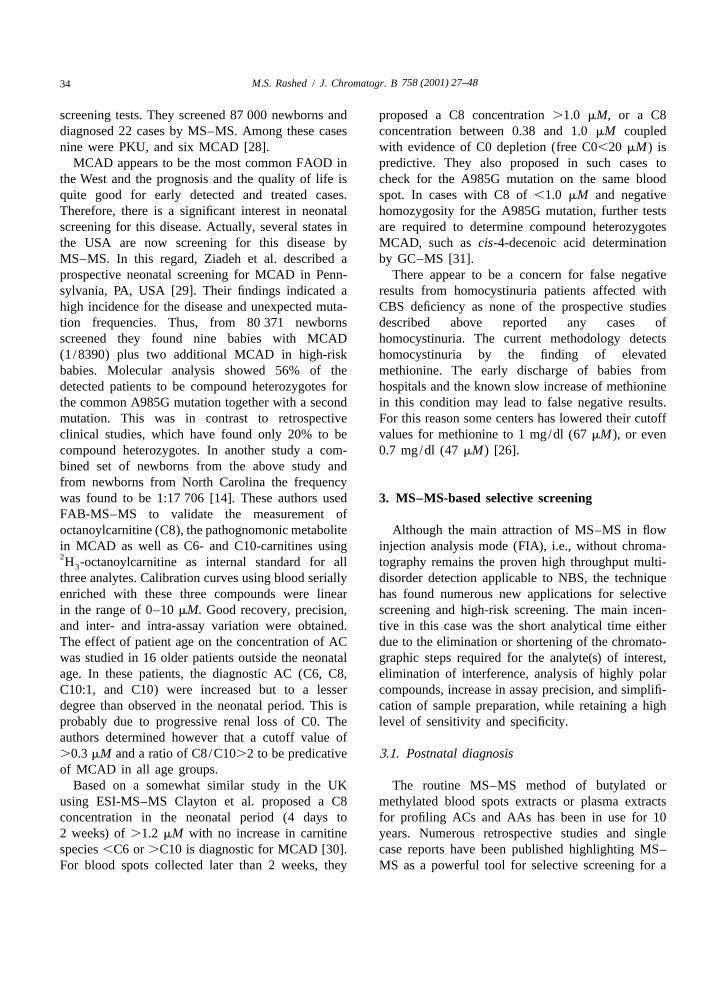
Fig. 4. MS–MS data for a patient with MCC. (A) Abnormal blood spot acylcarnitines profile. (B) Urine product-ion spectrum of m /z 214.(C) Urine MRIM data for four transitions, m /z 214→83, m /z 216→132, 230→132, and 264→132 for C5:1-glycine, C5-glycine, C6-glycine,phenylpropionylglycine, respectively.
758 (2001) 27–48 39M.S. Rashed / J. Chromatogr. B
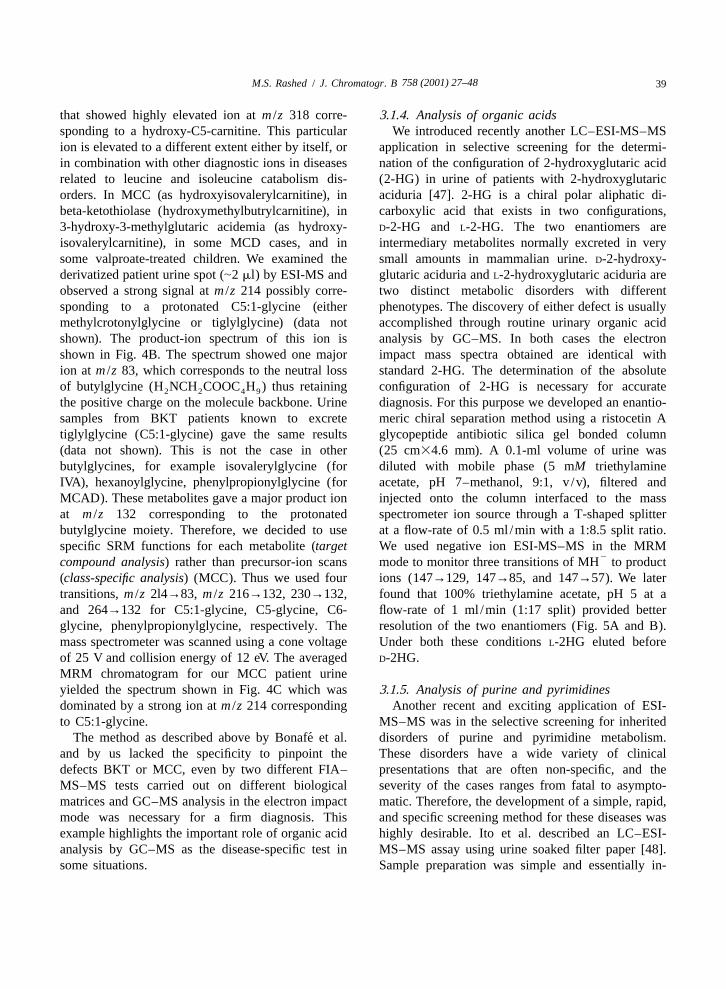
that showed highly elevated ion at m /z 318 corre- 3.1.4. Analysis of organic acidssponding to a hydroxy-C5-carnitine. This particular We introduced recently another LC–ESI-MS–MSion is elevated to a different extent either by itself, or application in selective screening for the determi-in combination with other diagnostic ions in diseases nation of the configuration of 2-hydroxyglutaric acidrelated to leucine and isoleucine catabolism dis- (2-HG) in urine of patients with 2-hydroxyglutaricorders. In MCC (as hydroxyisovalerylcarnitine), in aciduria [47]. 2-HG is a chiral polar aliphatic di-beta-ketothiolase (hydroxymethylbutrylcarnitine), in carboxylic acid that exists in two configurations,3-hydroxy-3-methylglutaric acidemia (as hydroxy- D-2-HG and L-2-HG. The two enantiomers areisovalerylcarnitine), in some MCD cases, and in intermediary metabolites normally excreted in verysome valproate-treated children. We examined the small amounts in mammalian urine. D-2-hydroxy-derivatized patient urine spot (|2 ml) by ESI-MS and glutaric aciduria and L-2-hydroxyglutaric aciduria areobserved a strong signal at m /z 214 possibly corre- two distinct metabolic disorders with differentsponding to a protonated C5:1-glycine (either phenotypes. The discovery of either defect is usuallymethylcrotonylglycine or tiglylglycine) (data not accomplished through routine urinary organic acidshown). The product-ion spectrum of this ion is analysis by GC–MS. In both cases the electronshown in Fig. 4B. The spectrum showed one major impact mass spectra obtained are identical withion at m /z 83, which corresponds to the neutral loss standard 2-HG. The determination of the absoluteof butylglycine (H NCH COOC H ) thus retaining configuration of 2-HG is necessary for accurate2 2 4 9
the positive charge on the molecule backbone. Urine diagnosis. For this purpose we developed an enantio-samples from BKT patients known to excrete meric chiral separation method using a ristocetin Atiglylglycine (C5:1-glycine) gave the same results glycopeptide antibiotic silica gel bonded column(data not shown). This is not the case in other (25 cm34.6 mm). A 0.1-ml volume of urine wasbutylglycines, for example isovalerylglycine (for diluted with mobile phase (5 mM triethylamineIVA), hexanoylglycine, phenylpropionylglycine (for acetate, pH 7–methanol, 9:1, v /v), filtered andMCAD). These metabolites gave a major product ion injected onto the column interfaced to the massat m /z 132 corresponding to the protonated spectrometer ion source through a T-shaped splitterbutylglycine moiety. Therefore, we decided to use at a flow-rate of 0.5 ml /min with a 1:8.5 split ratio.specific SRM functions for each metabolite (target We used negative ion ESI-MS–MS in the MRM
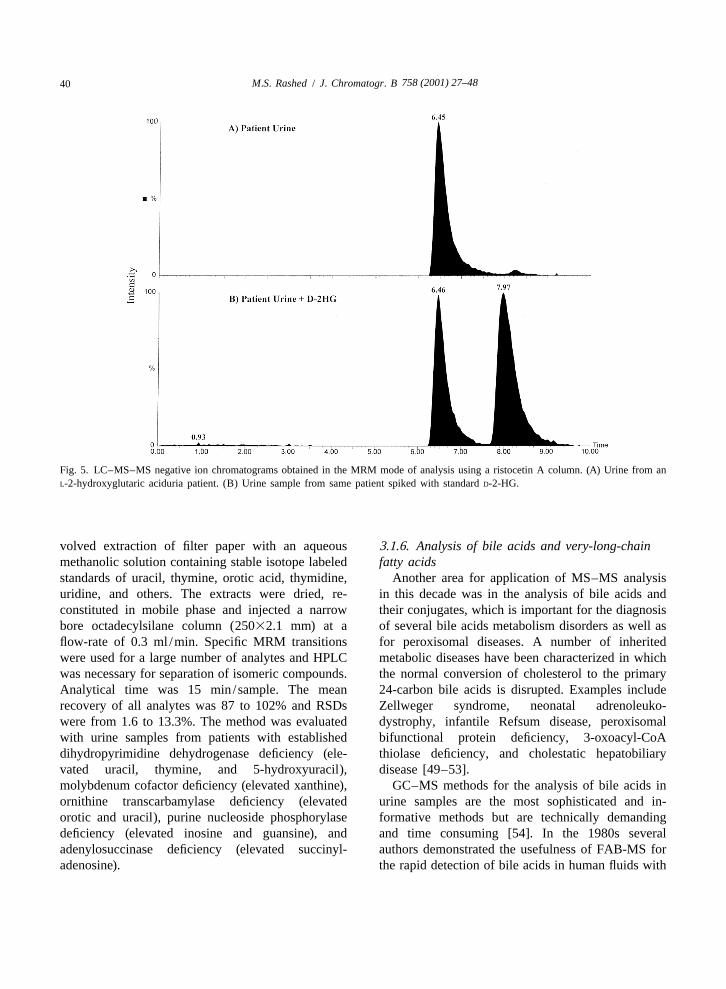
2compound analysis) rather than precursor-ion scans mode to monitor three transitions of MH to product(class-specific analysis) (MCC). Thus we used four ions (147→129, 147→85, and 147→57). We latertransitions, m /z 2l4→83, m /z 216→132, 230→132, found that 100% triethylamine acetate, pH 5 at aand 264→132 for C5:1-glycine, C5-glycine, C6- flow-rate of 1 ml /min (1:17 split) provided betterglycine, phenylpropionylglycine, respectively. The resolution of the two enantiomers (Fig. 5A and B).mass spectrometer was scanned using a cone voltage Under both these conditions L-2HG eluted beforeof 25 V and collision energy of 12 eV. The averaged D-2HG.MRM chromatogram for our MCC patient urineyielded the spectrum shown in Fig. 4C which was 3.1.5. Analysis of purine and pyrimidinesdominated by a strong ion at m /z 214 corresponding Another recent and exciting application of ESI-to C5:1-glycine. MS–MS was in the selective screening for inherited
´The method as described above by Bonafe et al. disorders of purine and pyrimidine metabolism.and by us lacked the specificity to pinpoint the These disorders have a wide variety of clinicaldefects BKT or MCC, even by two different FIA– presentations that are often non-specific, and theMS–MS tests carried out on different biological severity of the cases ranges from fatal to asympto-matrices and GC–MS analysis in the electron impact matic. Therefore, the development of a simple, rapid,mode was necessary for a firm diagnosis. This and specific screening method for these diseases wasexample highlights the important role of organic acid highly desirable. Ito et al. described an LC–ESI-analysis by GC–MS as the disease-specific test in MS–MS assay using urine soaked filter paper [48].some situations. Sample preparation was simple and essentially in-
758 (2001) 27–4840 M.S. Rashed / J. Chromatogr. B
Fig. 5. LC–MS–MS negative ion chromatograms obtained in the MRM mode of analysis using a ristocetin A column. (A) Urine from anL-2-hydroxyglutaric aciduria patient. (B) Urine sample from same patient spiked with standard D-2-HG.
volved extraction of filter paper with an aqueous 3.1.6. Analysis of bile acids and very-long-chainmethanolic solution containing stable isotope labeled fatty acidsstandards of uracil, thymine, orotic acid, thymidine, Another area for application of MS–MS analysisuridine, and others. The extracts were dried, re- in this decade was in the analysis of bile acids andconstituted in mobile phase and injected a narrow their conjugates, which is important for the diagnosisbore octadecylsilane column (25032.1 mm) at a of several bile acids metabolism disorders as well asflow-rate of 0.3 ml /min. Specific MRM transitions for peroxisomal diseases. A number of inheritedwere used for a large number of analytes and HPLC metabolic diseases have been characterized in whichwas necessary for separation of isomeric compounds. the normal conversion of cholesterol to the primaryAnalytical time was 15 min/sample. The mean 24-carbon bile acids is disrupted. Examples includerecovery of all analytes was 87 to 102% and RSDs Zellweger syndrome, neonatal adrenoleuko-were from 1.6 to 13.3%. The method was evaluated dystrophy, infantile Refsum disease, peroxisomalwith urine samples from patients with established bifunctional protein deficiency, 3-oxoacyl-CoAdihydropyrimidine dehydrogenase deficiency (ele- thiolase deficiency, and cholestatic hepatobiliaryvated uracil, thymine, and 5-hydroxyuracil), disease [49–53].molybdenum cofactor deficiency (elevated xanthine), GC–MS methods for the analysis of bile acids inornithine transcarbamylase deficiency (elevated urine samples are the most sophisticated and in-orotic and uracil), purine nucleoside phosphorylase formative methods but are technically demandingdeficiency (elevated inosine and guansine), and and time consuming [54]. In the 1980s severaladenylosuccinase deficiency (elevated succinyl- authors demonstrated the usefulness of FAB-MS foradenosine). the rapid detection of bile acids in human fluids with
758 (2001) 27–48 41M.S. Rashed / J. Chromatogr. B
minimum sample preparation [53–55]. FAB-MS conjugates) to 708 blood spots from normal. Un-operated in the negative ion mode showed intense fortunately, although significant differences in meanions for abnormal bile salts in urine extracts. How- bile acid concentrations were found, a small butever, the information provided was limited to the important overlap existed between the population
2presence of the pseudo molecular ion [M2H] of distributions of unaffected neonates and those withthese compounds, interferences form the matrix, and cholestatic hepatobiliary disease. The separation waslack of adequate sensitivity in some situations. greater between neonates with extrahepatic biliary
Tomer et al. using pure standards were the first to atresia and normal neonates, but even here thestudy the use of negative ion FAB-MS–MS as an overlap was too great to make screening by thisalternative approach for determination of bile salts method alone a feasible option.and their conjugates [56]. Evans et al. studied the use Bootsma et al. presented a method for rapidof negative thermospray-LC–MS and thermospray- selective screening of peroxisomal diseases fromLC–MS–MS of bile acids and their glycine conju- plasma samples [63]. Sample preparation was quitegates and indicated more specificity by MS–MS simple. They used negative ion ESI-MS–MS and the[57]. Libert et al. using negative ion FAB-MS–MS same internal standards used by Mills et al. [61].for the analysis of serum or urine extracts introduced However, in this case LC–MS–MS rather than FIA–the first clinical application of this methodology in MS–MS was utilized with a short narrow borepatients with liver diseases and peroxisomal diseases. column (5 cm32 mm) interfaced to the ESI ionThey reported better specificity by MS–MS and source with a flow-rate of 200 ml /min. Glycineforesaw that the method might become the first line conjugates were detected by MRM using specificof investigation of peroxisomal disorders [58]. transitions with a mass difference of m /z 74 and the
Warrack and DiDonato were the first to introduce transitions with the mass difference of m /z 80 for thethe use of ionspray mass spectrometry (ISP-MS) and taurine conjugates. The C dicarboxylic bile acid29
ISP-LC–MS of bile acids and their conjugates. The was detected using the specific transition m /zmethod demonstrated high sensitivity than those (507→463). The method allowed measuring absolutereported for FAB-MS but no clinical applications concentrations of taurine- and glycine-conjugatedwere shown [59]. Later, Roda et al. used negative cholic acid, and those of chenodeoxycholic acid.ion ESI-LC–MS–MS to separate and detect a large In a related approach, Johnson described a rapidnumber of free bile acids, their glycine and taurine screening procedure for the diagnosis of peroxisomalconjugates at the picogram level in human serum and disorders via the analysis of very-long-chain fattyhamster bile [60]. acids (VLCFAs) in small volumes of plasma and
Mills et al. recently described the use of a negative from blood spots using the dimethylaminoethylion ESI-MS–MS isotope dilution method for the esters and positive ion ESI-MS–MS analysis [64].measurement of taurotrihydroxycholanoates and All the VLCFA-containing lipid species were con-glycodihydroxycholanoates in blood spots with the verted to free VLCFAs by heating plasma at 1008Cpurpose of mass screening for cholestasis [61]. They in 10% HCl in acetonitrile for 45 min. The free acidsused precursor-ion scanning for m /z 74 to detect were then converted into their corresponding acidglycine conjugates and precursor-ion scanning for chlorides using oxalyl chloride followed by coldm /z 80 to detect taurine conjugates. The use of esterification by N,N-dimethylethanolamine. Thedeutrated internal standards allowed the construction derivatized acids yield strong protonated molecularof calibration curves for glycochenodeoxycholic ions in ESI-MS and few fragments upon CIDacid, glycocholic acid, taurochenodeoxycholic acid, analysis. MRM profiles were obtained for the diag-and taurocholic acids. In another study they ex- nostically important acids, C20:0, C22:0, C24:0, andamined the feasibility of using this method for C26:0 using the transitions resulting from the neutralscreening for cholestatic hepatobiliary disease and loss of 45 rel. mass units (loss of HCOOH). Usingextrahepatic biliary atresia [62]. They studied 218 trideutrated internal standards for the four mentionedchildren with cholestatic hepatobiliary disease and metabolites allowed quantification of these species.compared the total bile concentration (four bile acid Calibration curves showed good correlation but there
758 (2001) 27–4842 M.S. Rashed / J. Chromatogr. B
was an overestimation of VLCFAs by this method as 3.3. Prenatal diagnosiscompared to standard GC–MS methods. In plasmathe diagnostic ratios of C26/C22 and C24/C22 had Another important field of application of MS–MSgood precision and adequate separation between was in prenatal diagnosis for branched-chain catabo-normal and affected levels. As for C20 there was lism disorders. Shigematsu et al. described the use ofsignificant interference as the method measured both FAB-MS–MS in the prenatal diagnosis of IVA fromarachidic acid and phytanic acid as one. In blood amniotic fluid in a 32-week-old fetus [67]. Using thespots C24/C22 ratio did not differentiate between methyl ester derivatives and precursor-ion scans ofperoxisomal disease patients and control population. m /z 99 they found elevated C5-carnitine (iso-The author advocated the use of this method for valerylcarnitine) as compared to an age-matchedscreening purposes, and that those positive results control. They also carried out precursor-ion scans ofshould be confirmed by GC or GC–MS. m /z 90 for acylglycines and found significantly
elevated C5-glycine as compared to controls. VanHove et al. described a retrospective prenatal study
3.2. Postmortem diagnosis on three terminated PPA based on methylcitratedetermination by GC–MS. They carried out an
One example of postmortem is our use of FIA– isotope-dilution assay for measuring C3 in theESI-MS–MS in the analysis of bile filter paper spots amniotic fluid using FAB-MS–MS [68]. They foundobtained post-mortem from infants of sudden infant that C3 was elevated by a factor of 5 as compared todeath syndrome (SIDS) [65]. In this case the bile 25 control amniotic fluid samples ranging in gesta-spots extracts were prepared exactly as blood spots. tional age from 12 to 17.5 weeks. They proposed thatQualitative profiles of AC methyl and butyl esters AC analysis is a valid and rapid method for screen-were obtained by ESI-MS–MS analysis by moni- ing pregnancies at risk for PPA.toring precursor-ion scans of the common fragment Shigematsu et al. carried out a larger retrospectiveat m /z 99 (methyl-) or m /z 85 (n-butyl). Two SIDS study using ESI-MS–MS on a larger set of storedcases suspected of FOADs due to appearance of fatty amniotic fluid samples in at risk pregnancies forliver, undetectable glucose in liver tissue, or in- several organic acidemias versus controls, at earlycreased palmitoleic acid gave bile AC profiles gestational age (11–20 weeks). They reported thatstrongly suggestive of long-chain 3-hydroxyacyl- the concentration of single AC marker is not suffi-CoA dehydrogenase deficiency (LCHAD). The pro- cient for a valid discrimination. Instead they usedfiles were similar to those previously described in concentration ratios of C3/C4 (butyryl- and iso-plasma. A third case diagnosed as GA-I by GC–MS butyrylcarnitine) for PPA and MMA, C5/C3 ratio foranalysis of postmortem urine gave a profile domi- IVA, C5-dioylcarnitine (glutarylcarnitine) /C3 rationated by the signal corresponding to glutarylcar- for GA-I, C5/C3 ratio for MAD. The cutoff valuesnitine, a pathognomonic marker for the disease. The for the latter disease seemed not to be reliableuse of both methyl and butyl esters with two enough for diagnosis [69].different CID fragments served to increase our In another exciting application Nada et al. de-confidence in the nature of the diagnostic ions in the scribed a prenatal diagnosis study using cultured
2profile (see later). Boles et al. described recently a amniocytes loaded with (16,16,16- H -palmitic acid3
larger retrospective study where 418 cases of SIDS and L-carnitine [70]). After a 96-h incubation at 378C2were examined. Several investigations were carried the media was separated and H -octanoylcarnitine9
2 2 2out on postmortem liver tissue but bile was available ( H -C8) and H -isovalerylcarnitine ( H -C5) were9 9 9
in only 32 cases. The study detected 14 cases of added as internal standards. The mixture was thenFOADs, two MCAD, four MAD, four cases with prepared for AC analysis by FAB-MS–MS as de-either very-long chain acyl-CoA dehydrogenase scribed before. Concentrations of C8 and longer-deficiency or LCHAD, and four cases predicted with chain ACs were measured relative to the concen-
2carnitine transport defect (CTD) [66]. tration of the internal standard H -C8 and expressed9
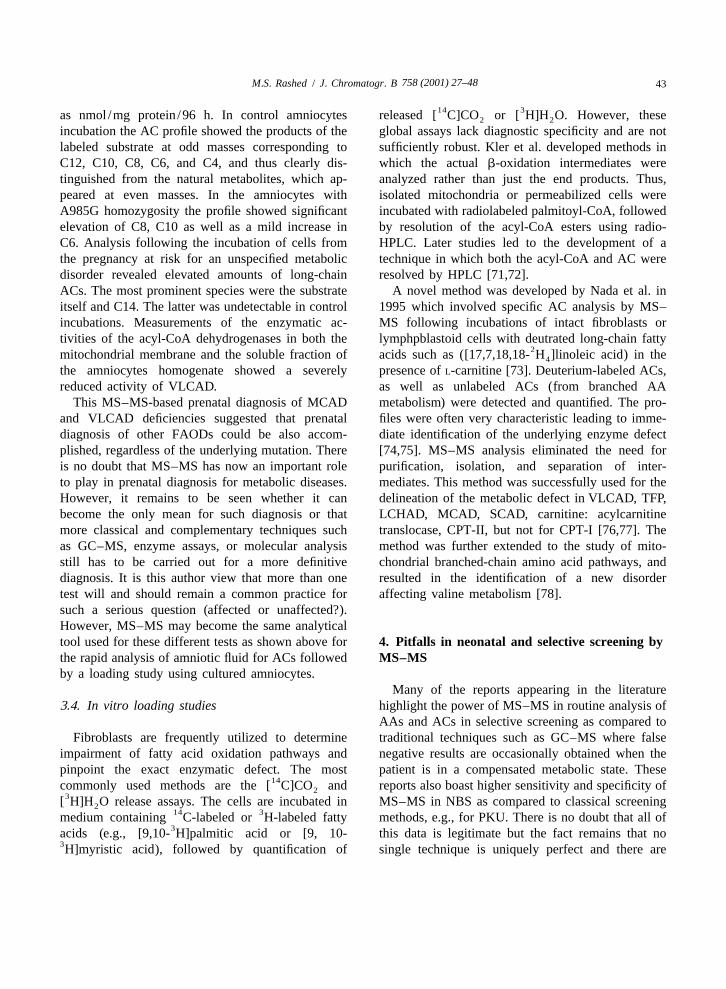
758 (2001) 27–48 43M.S. Rashed / J. Chromatogr. B
14 3as nmol /mg protein /96 h. In control amniocytes released [ C]CO or [ H]H O. However, these2 2
incubation the AC profile showed the products of the global assays lack diagnostic specificity and are notlabeled substrate at odd masses corresponding to sufficiently robust. Kler et al. developed methods inC12, C10, C8, C6, and C4, and thus clearly dis- which the actual b-oxidation intermediates weretinguished from the natural metabolites, which ap- analyzed rather than just the end products. Thus,peared at even masses. In the amniocytes with isolated mitochondria or permeabilized cells wereA985G homozygosity the profile showed significant incubated with radiolabeled palmitoyl-CoA, followedelevation of C8, C10 as well as a mild increase in by resolution of the acyl-CoA esters using radio-C6. Analysis following the incubation of cells from HPLC. Later studies led to the development of athe pregnancy at risk for an unspecified metabolic technique in which both the acyl-CoA and AC weredisorder revealed elevated amounts of long-chain resolved by HPLC [71,72].ACs. The most prominent species were the substrate A novel method was developed by Nada et al. initself and C14. The latter was undetectable in control 1995 which involved specific AC analysis by MS–incubations. Measurements of the enzymatic ac- MS following incubations of intact fibroblasts ortivities of the acyl-CoA dehydrogenases in both the lymphpblastoid cells with deutrated long-chain fatty
2mitochondrial membrane and the soluble fraction of acids such as ([17,7,18,18- H ]linoleic acid) in the4
the amniocytes homogenate showed a severely presence of L-carnitine [73]. Deuterium-labeled ACs,reduced activity of VLCAD. as well as unlabeled ACs (from branched AA
This MS–MS-based prenatal diagnosis of MCAD metabolism) were detected and quantified. The pro-and VLCAD deficiencies suggested that prenatal files were often very characteristic leading to imme-diagnosis of other FAODs could be also accom- diate identification of the underlying enzyme defectplished, regardless of the underlying mutation. There [74,75]. MS–MS analysis eliminated the need foris no doubt that MS–MS has now an important role purification, isolation, and separation of inter-to play in prenatal diagnosis for metabolic diseases. mediates. This method was successfully used for theHowever, it remains to be seen whether it can delineation of the metabolic defect in VLCAD, TFP,become the only mean for such diagnosis or that LCHAD, MCAD, SCAD, carnitine: acylcarnitinemore classical and complementary techniques such translocase, CPT-II, but not for CPT-I [76,77]. Theas GC–MS, enzyme assays, or molecular analysis method was further extended to the study of mito-still has to be carried out for a more definitive chondrial branched-chain amino acid pathways, anddiagnosis. It is this author view that more than one resulted in the identification of a new disordertest will and should remain a common practice for affecting valine metabolism [78].such a serious question (affected or unaffected?).However, MS–MS may become the same analyticaltool used for these different tests as shown above for 4. Pitfalls in neonatal and selective screening bythe rapid analysis of amniotic fluid for ACs followed MS–MSby a loading study using cultured amniocytes.
Many of the reports appearing in the literature3.4. In vitro loading studies highlight the power of MS–MS in routine analysis of
AAs and ACs in selective screening as compared toFibroblasts are frequently utilized to determine traditional techniques such as GC–MS where false
impairment of fatty acid oxidation pathways and negative results are occasionally obtained when thepinpoint the exact enzymatic defect. The most patient is in a compensated metabolic state. These
14commonly used methods are the [ C]CO and reports also boast higher sensitivity and specificity of23[ H]H O release assays. The cells are incubated in MS–MS in NBS as compared to classical screening2
14 3medium containing C-labeled or H-labeled fatty methods, e.g., for PKU. There is no doubt that all of3acids (e.g., [9,10- H]palmitic acid or [9, 10- this data is legitimate but the fact remains that no
3H]myristic acid), followed by quantification of single technique is uniquely perfect and there are
758 (2001) 27–4844 M.S. Rashed / J. Chromatogr. B
always trade-off between sensitivity and specificity leucine (1isoleucine). In one case, these AAsof the test. remained normal for 4 days, and in the other case the
From an analytical point of view our current values were normal for 10 days. Both cases wereMS–MS approach aims at detecting a large number discharged from the hospital on regular diet to crashof diseases in a single test through measuring a large at home few hours later. An alternative approachnumber of metabolites (or parameters). Small ana- adopted by some physicians in our institution is tolytical errors for each parameter may lead to a large place the child on regular diet, collect a 24 h DBScumulative error, and thus to a relatively large for MS–MS analysis and then place the child onnumber of falsely flagged data files. This may lead to special formula until the results are available.the use of wider cutoff ranges in order to decrease Another interesting case we encountered recentlythe recall rate and thus to false negative results. was a normal blood AC profile with normal free C0,There is also the problem of using cutoff values normal free to total carnitine ratio. However, GC–obtained from normal newborns to selectively screen MS analysis of urine showed an abnormal organicfor older patients due to the difficulty in acquiring acids profile with highly elevated glutaric andage-matched controls. Furthermore, in selective 3-hydroxyglutaric acids indicating GA-I. This goesscreening there often is a lack of information on in the face of a large number of cases of GA-I (.30)drugs given to patient that may interfere with the diagnosed by the finding of elevated glutarylcarnitineassay. by MS–MS analysis of DBS in our patient popula-
From a clinical point of view, the situation is tion. The reverse of this situation was also found asfurther complicated by the fact that not all biochemi- we encountered numerous cases in renal patientscal abnormalities reflect a disease state, e.g., asymp- where the blood AC profile was flagged abnormaltomatic MCAD patients and hyperphenylalaninemia due to elevation of the signal at m /z 388 thatcases, and there exists cases where a symptomatic corresponds to glutarylcarnitine while the urinepatient may be not be excreting the pathognomonic organic acid profile was normal. We observed inmetabolites as is the case in a small number of GA-I most of these that there are other signals at m /z 342,patients. The impressive record achieved by the MS– m /z 358, m /z 402, some of these ions are commonlyMS method in both selective screening and NBS and found in urine AC profiles, the exact nature of whichthe occasional lack of adequate communications remains to be determined.between the laboratory and the clinic has increased We encountered another problem when we in-the tendency of some physicians to regard MS–MS creased our upper cutoff value for the ratio of C3/C2analysis as the ultimate test, and to use it to rule out from 0.4 (99.5 percentile) to 0.51 (99.9 percentile).an inherited metabolic disease in their patient disre- This resulted in missing several cases ofgarding important tests such as the routine organic methylmalonic acidemias as determined by GC–MSacid analysis by GC–MS, or more specific GC–MS analysis of urine. Even the 99.5% percentile valuetests. was not sensitive enough in two other cases. De-
Various examples relating our experience with creasing this cutoff value to 0.3 resulted in findingpitfalls in selective screening are presented here. In two more cases but caused a considerable number oftwo patients from two different families with falsely flagged data files. This C3/C2 parameter ortyrosinemia type-I the diagnosis was delayed due to the absolute concentration of C3 appears to be thea repeated finding of normal tyrosine level by MS– most problematic in AC profiling as also expressedMS. Later, consultation with the laboratory has led to by other workers in the field [26].succinylacetone analysis by selected ion monitoring As mentioned above Vreken et al. reported on theGC–MS, which confirmed the diagnosis. A different finding of a normal plasma AC profile in a case ofproblem was encountered in the high-risk screening SCAD, and in a mild form of MAD [23]. We, on thefor MSUD due to placing the newborn on special other hand encountered several liver disease patientsdiet immediately after birth. Two cases from two where their AC profiles showed mild to moderatedifferent families were presumed normal based on elevation of metabolites diagnostic for MAD, butdaily MS–MS analysis of DBS for valine and with normal organic acid profiles.
758 (2001) 27–48 45M.S. Rashed / J. Chromatogr. B
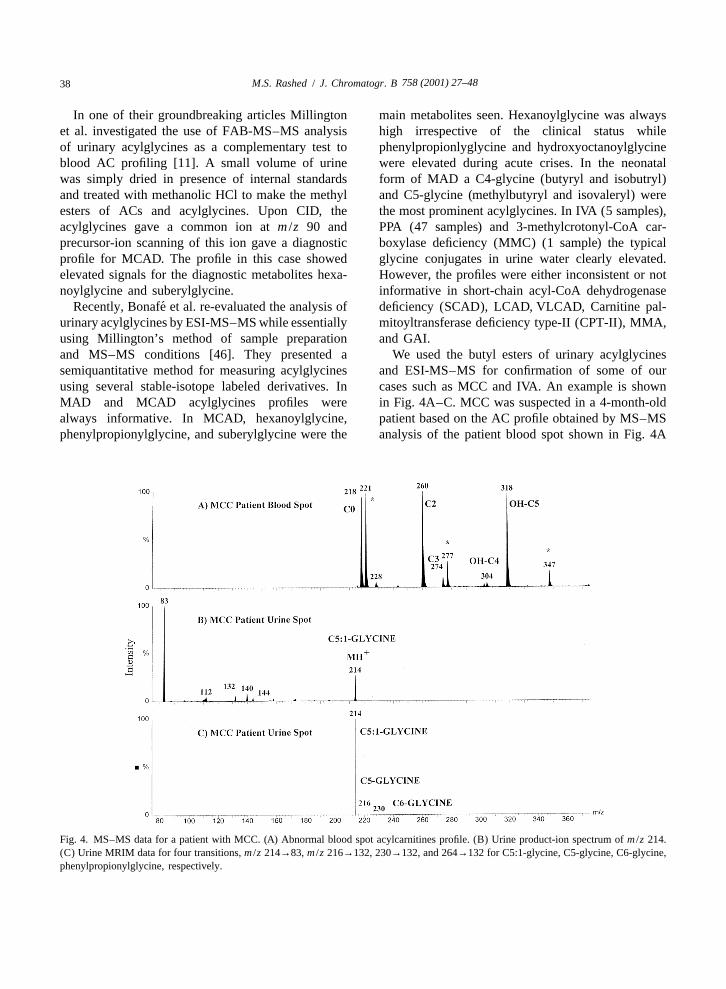
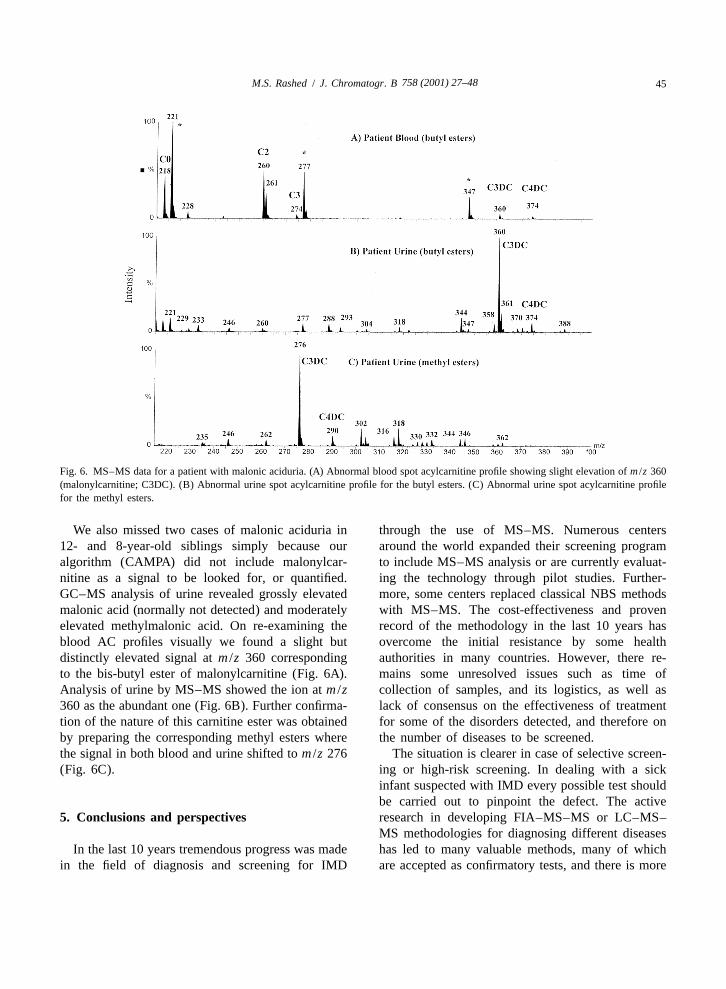
Fig. 6. MS–MS data for a patient with malonic aciduria. (A) Abnormal blood spot acylcarnitine profile showing slight elevation of m /z 360(malonylcarnitine; C3DC). (B) Abnormal urine spot acylcarnitine profile for the butyl esters. (C) Abnormal urine spot acylcarnitine profilefor the methyl esters.
We also missed two cases of malonic aciduria in through the use of MS–MS. Numerous centers12- and 8-year-old siblings simply because our around the world expanded their screening programalgorithm (CAMPA) did not include malonylcar- to include MS–MS analysis or are currently evaluat-nitine as a signal to be looked for, or quantified. ing the technology through pilot studies. Further-GC–MS analysis of urine revealed grossly elevated more, some centers replaced classical NBS methodsmalonic acid (normally not detected) and moderately with MS–MS. The cost-effectiveness and provenelevated methylmalonic acid. On re-examining the record of the methodology in the last 10 years hasblood AC profiles visually we found a slight but overcome the initial resistance by some healthdistinctly elevated signal at m /z 360 corresponding authorities in many countries. However, there re-to the bis-butyl ester of malonylcarnitine (Fig. 6A). mains some unresolved issues such as time ofAnalysis of urine by MS–MS showed the ion at m /z collection of samples, and its logistics, as well as360 as the abundant one (Fig. 6B). Further confirma- lack of consensus on the effectiveness of treatmenttion of the nature of this carnitine ester was obtained for some of the disorders detected, and therefore onby preparing the corresponding methyl esters where the number of diseases to be screened.the signal in both blood and urine shifted to m /z 276 The situation is clearer in case of selective screen-(Fig. 6C). ing or high-risk screening. In dealing with a sick
infant suspected with IMD every possible test shouldbe carried out to pinpoint the defect. The active
5. Conclusions and perspectives research in developing FIA–MS–MS or LC–MS–MS methodologies for diagnosing different diseases
In the last 10 years tremendous progress was made has led to many valuable methods, many of whichin the field of diagnosis and screening for IMD are accepted as confirmatory tests, and there is more
758 (2001) 27–4846 M.S. Rashed / J. Chromatogr. B
to come. However, the workers in the field should MAD Glutaric acidemia type-IIMCAD Medium-chain acyl-CoA dehydro-not neglect ‘‘older’’ tests such as GC–MS and they
genase deficiencyshould strive to correlate their MS–MS findings fromMCC 3-Methylcrotonyl-CoA carboxylasedifferent biological matrices with other biochemical
deficiencyfindings, with enzyme data and molecular data, andMCD Multiple carboxylase deficiencymost certainly with clinical data.MMA Methylmalonic acidemiaMRM Multiple reaction monitoringMS–MS Tandem mass spectrometry6. NomenclatureMSUD Maple syrup urine diseaseNBS Newborn screening2-HG 2-Hydroxyglutaric acidPKU PhenylketonuriaAA Amino acidPPA Propionic acidemiaAC AcylcarnitineRSD Relative standard deviationBKT Beta-ketothiolase deficiencySCAD Short-chain acyl-CoA dehydrogen-C0 L-Carnitine
ase deficiencyC10 DecanoylcarnitineSIDS Sudden infant death syndromeC10:1 DecenoylcarnitineSRM Selected reaction monitoringC2 AcetylcarnitineTFP Trifunctional protein deficiencyC3 PropionylcarnitineTLC Thin-layer chromatographyC5 C5-CarnitineVLCAD Very-long-chain acyl-CoA dehydro-C6 Hexanoylcarnitine
genase deficiencyC8 OctanoylcarnitineVLCFA Very-long-chain fatty acidCAMPA Computer-assisted metabolic profil-
ing algorithmCBS Cystathionine-b-synthetase
AcknowledgementsCID Collision-induced dissociationCPT-I Carnitine palmitoyltransferase de-
The author expresses his deepest gratitude toficiency type-IDr. Sultan Al Sedairy, Executive Director, andCPT-II Carnitine palmitoyltransferase de-Dr. Futwan Al-Muhanna, Deputy Executive Directorficiency type-IIof the Research Centre of King Faisal SpecialistCSF Cerebrospinal fluidHospital and Research Centre, Riyadh, for theirCTD Carnitine transport defectcontinuous support of the metabolic screening lab-DBS Dried blood spotoratory. The author is very grateful for Mr.ESI Electrospray ionizationMohamed Al-Amoudi, Mrs. Minnie Jacob, Mr. AminFAB Fast atom bombardmentAwad, and Ms. Lujane AlAhaidib for their excellentFIA Flow injection analysistechnical assistance. The author also wishes to thankFOAD Fatty acid oxidation defectDr. Zuhair Rahbeeni and Dr. Moeen AlSayed of ourGA-I Glutaric acidemia type-Iinstitution for their valuable clinical advice over theGC–MS Gas chromatography–mass spec-years.trometry
HPLC High-performance liquid chromatog-raphy
ReferencesIMD Inherited metabolic diseaseISP-MS Ionspray mass spectrometry
[1] J. Bremer, Physiol. Rev. 63 (1983) 1420.LCHAD Long-chain 3-hydroxyacyl-CoA de-[2] C.A. Stanley, Adv. Pediatr. 42 (1995) 209.
hydrogenase deficiency [3] A.K.M.J. Bhuiyan, S. Jackson, D.M. Turnbull, A. Aynsley-LC–MS–MS Liquid chromatography–tandem Green, J.V. Leonard, K. Barlett, Clin. Chim. Acta 207 (1992)
mass spectrometry 185.
758 (2001) 27–48 47M.S. Rashed / J. Chromatogr. B
[4] P.E. Minkler, C.L. Hoppel, Anal. Biochem. 212 (1993) 510. [31] S.J. Heales, J.V. Leonard, Clin. Chim. Acta 209 (1992) 61.[5] E. Schmidt-Sommerfeld, D. Penn, M. Duran, M.J. Bennett, [32] K.H. Carpenter, B. Wilcken, J. Inherit. Metab. Dis. 22 (1999)
R. Santer, C.A. Stanley, J. Pediatr. 122 (1993) 708. 840.[6] N. Kodo, D.S. Millington, D.L. Norwood, C.R. Roe, Clin. [33] A.I. AlAqeel, M.S. Rashed, R.J.A. Wanders, J. Inherit.
Chem. 38 (1992) 2215. Metab. Dis. 22 (1999) 271.[7] J.F. Van Bocxlaer, A.P. Leenheer, Clin. Chem. 39 (1993) [34] K. Gempel, M. Kottlors, M. Jaksch, K.-D. Gerbitz, M.F.
1911. Bauer, J. Inherit. Metab. Dis. 22 (1999) 941.[8] S. Lowes, M.E. Rose, G.A. Mills, R.J. Pollitt, J. Chromatogr. [35] C.R. Roe, H.E. Wiltse, L. Sweetman, L.L. Alvarado, J.
577 (1992) 205. Pediatr. 136 (2000) 397.[9] P.E. Minkler, C.L. Hoppel, J. Chromatogr. 613 (1993) 203. [36] D.H. Chace, J.E. Sherwin, S.L. Hillman, F. Leroy, G.C.
[10] D.S. Millington, N. Kodo, D.L. Norwood, C.R. Roe, J. Cunningham, Clin. Chem. 44 (1998) 2405.Inherit. Metab. Dis. 13 (1990) 321. [37] A. Schulze, D. Kohlmueller, E. Mayatepek, Clin. Chim. Acta
[11] D.S. Millington, N. Kodo, N. Terada, C.R. Roe, D.H. Chace, 283 (1999) 15.Int. J. Mass Spectrom. Ion Processes 111 (1991) 211. [38] R.D. Stevens, S.L. Hillman, S. Worthy, D. Sanders, D.S.
[12] D.H. Chace, D.S. Millington, N. Terada, S.G. Kahier, C.R. Millington, Clin. Chem. 46 (2000) 727.Roe, L.F. Hofman, Clin. Chem. 39 (1993) 66. [39] I. Daskalakis, M.D. Lucock, A. Anderson, J. Wild, C.J.
[13] D.H. Chace, S.L. Hillman, D.S. Millington, S.G. Kahler, Schorah, M.I. Levene, Biomed. Chromatogr. 10 (1996) 205.C.R. Roe, E.W. Naylor, Clin. Chem. 41 (1995) 62. [40] M.J. Magera, J.M. Lacet, B. Casetta, P. Rinaldo, Clin. Chem.
[14] D.H. Chace, S.L. Hillman, J.L.K. Van Hove, E.W. Naylor, 45 (1999) 1517.Clin. Chem. 43 (1997) 2106. [41] K. Gempel, K.-D. Gerbitz, B. Casetta, M.F. Bauer, Clin.
[15] M.S. Rashed, P.T. Ozand, M.E. Harrison, Rapid Commun. Chem. 46 (2000) 122.Mass Spectrom. 8 (1994) 129. [42] B. Casetta, D. Tagliacozzi, B. Sushan, G. Federici, Clin.
[16] M.S. Rashed, P.T. Ozand, M.P. Bucknall, D. Little, Pediatr. Chem. Lab. Med. 38 (2000) 391.Res. 38 (1995) 324. [43] B.J. Wilcox, K.J. Ritenour-Rodgers, A.S. Asser, L.E. Baum-
[17] M.S. Rashed, M.P. Bucknall, D. Little, A. Awad, M. Jacob, gart, M.A. Baumgart, D.L. Boger, J.L. DeBlassio, M.A.M. AlAmoudi, M. AlWattr, P.T. Ozand, Clin. Chem. 43 deLong, A. Glufke, M.E. Henz, L. King, K.A. Merkler, J.E.(1997) 1129. Patterson, J.J. Robleski, J.C.Vederas, D.J. Merkler, Biochem-
[18] B. Norgaard-Pederesen, H. Simonsen, Acta Paediatr. Suppl. istry 38 (1999) 3235.432 (1999) 106. [44] K. Bartlett, D. Gompertz, Biochem. Med. 10 (1974) 15.
[19] D.W. Johnson, J. Inherit. Metab. Dis. 22 (1999) 201. [45] P. Rinaldo, J.J. O’Shea, R.D. Welch, K. Tanaka, Biomed.[20] D.H. Chace, J.C. Dipema, E.W. Naylor, Acta Paediatr. Suppl. Environ. Mass Spectrom. 18 (1989).
´432 (1999) 45. [46] L. Bonafe, H. Troxler, T. Kuster, C.H. Heizmann, N.A.[21] D.H. Chace, B.W. Adam, S.J. Smith, J.R. Alexander, S.L. Chaoles, A.B. Burlina, N. Blau, Mol. Genet. Metab. 69
Hillman, W.H. Hannon, Clin. Chem. 45 (1999) 1269. (2000) 302.[22] A.W. Johnson, K. Mills, P.T. Clayton, Biochem. Soc. Trans. [47] M.S. Rashed, M. AlAmoudi, H.Y. Aboul-Enein, Biomed.
24 (1996) 932. Chromatogr. 14 (2000) 317.[23] P. Vreken, E.M. van Lint, A.H. Bootsma, H. Overmars, [48] T. Ito, A.B. van Kuilenburg, A.H. Bootsma, A.J. Haasnoot,
R.J.A. Wanders, A.H. van Gennip, in: P.A. Quant and S. A. van Cruchten, Y. Wada, A.H. van Gennip, J. Inherit.Eaton (Editors), Current Views of Fatty Acid Oxidation and Metab. Dis. 23 (2000) 434.Ketogenesis: From Organelles to Point Mutations, Kluwar– [49] I. Bjorkhem, Scand. J. Gastroenterol. 204 (1994) 68.Plenum Press, New York, 1999, Chapter 38, p. 327. [50] P.T. Clayton, B.D. Lake, N.A. Hall, D.B. Shortland, R.A.
[24] V. Wiley, K. Carpenter, B. Wilcken, Acta Paediatr. Suppl. Carathers, A.M. Lawson, Eur. J. Pediatr. 146 (1987) 166.432 (1999) 48. [51] K.D.R. Setchell, J.M. Street, Semin. Liver Dis. 7 (1987) 85.
[25] M.S. Rashed, Z. Rahbeeni, P.T. Ozand, Semin. Perinatol. 23 [52] P.T. Clayton, J. Inherit. Metab. Dis. 14 (1991) 478.(1999) 183. [53] A.M. Lawson, K.D.R. Setchell, in: K.D.R. Setchell, D.
[26] E.W. Naylor, D.H. Chace, J. Child Neurol. Suppl. 14 (1999) Kritchevsky, P.P. Nair (Eds.), The Bile Acids, Vol. 4, Plenum54. Press, New York, 1988, p. 167.
[27] Y. Shigematsu, I. Hata, Y. Kikawa, M. Mayumi, Y. Tanaka, [54] K.D.R. Setchell, A. Matsui, Clin. Chim. Acta 127 (1983) 1.M. Sudo, N. Kado, J. Chromatogr. B 731 (1999) 97. [55] A.M. Lawson, M.J. Madigan, D. Shortland, P.T. Clayton,
[28] B. Liebl, R. Fingerhut, W. Roschinger, A. Muntau, I. Knerr, Clin. Chim. Acta 16 (1986) 221.B. Olgemoller, A. Zapf, A.A. Roscher, Gesundheitswesen 62 [56] K.B. Tomer, N.J. Jensen, M.L. Gross, Biomed. Mass Spec-(2000) 189. trom. 13 (1986) 265.
[29] R. Ziadeh, E.P. Hoffman, D.N. Finegold, R.C. Hoop, J.C. [57] J.E. Evans, A. Ghosh, B.A. Evans, M.R. Natowicz, Biol.Brackett, A.W. Strauss, E.W. Naylor, Pediatr. Res. 37 (1995) Mass Spectrom. 22 (1993) 331.675. [58] R. Libert, D. Hermans, J.-P. Drsye, F. Van Hoof, E. Sokal, E.
[30] P.T. Clayton, M. Doig, S. Ghafari, C. Meaney, C. Taylor, J.V. de Hoffmann, Clin. Chem. 37 (1991) 2102.Leonard, M. Morris, A.W. Johnson, Arch. Dis. Child. 79 [59] B.M. Warrack, G.C. DiDonato, Biol. Mass Spectrom. 22(1998) 109. (1993) 101.
758 (2001) 27–4848 M.S. Rashed / J. Chromatogr. B
´[60] A. Roda, A.M. Gioacchini, C. Cerre, M. Baraldini, J. [70] M.A. Nada, C. Vianey-Saban, C.R. Roe, J.-H. Ding, M.Chromatogr. B 665 (1995) 281. Mathieu, R.S. Wappner, M.G. Bialers, J.A. McGlynn, G.
[61] K.M. Mills, I. Mustaq, A.W. Jonhnson, P.D. Whitfield, P.T. Mandon, Prenat. Diagn. 16 (1996) 117.Clayton, Pediatr. Res. 43 (1998) 361. [71] N. Watmough, D.M. Turnbull, H.S.A. Sherratt, K. Bartlett,
[62] I. Mushtaq, S. Logan, M. Morris, A.W. Johnson, M.W. Angie, Biochem. J. 262 (1989) 261.D. Kelly, P.T. Clayton, Br. Med. J. 319 (1999) 471. [72] R.S. Kler, S. Jackson, K. Bartlett, L.A. Bindhoff, S. Eaton,
[63] A.H. Bootsma, H. Overmars, A. van Rooij, A.E.M. van Lint, M. Pourfarzam, F.E. Frerman, S.I. Goodman, N. Watmough,R.J.A. Wanders, A.H. van Gennip, P. Vreken, J. Inherit. D.M. Turnbull, J. Biol. Chem. 266 (1991) 22932.Metab. Dis. 22 (1999) 307. [73] M.A. Nada, D.H. Chace, H. Sprecher, C.R. Roe, Biochem.
[64] D.W. Johnson, J. Inherit. Metab. Dis. 23 (2000) 475. Mol. Med. 54 (1995) 59.[65] M.S. Rashed, P.T. Ozand, M.J. Bennett, J.L. Barnard, D.R. [74] M.A. Nada, W.J. Read, H. Sprecher, H. Schulz, C.R. Roe, J.
Govindaraju, P. Rinaldo, Clin. Chem. 41 (1995) 1109. Biol. Chem. 270 (1995) 530.[66] R.G. Boles, E.A. Buck, M.G. Blitzer, M.S. Platt, T.M. [75] C. Vianey-Saban, G.F. Delome, F. Guibaud, M. Mathieu, P.
Cowan, S.K. Martin, H. Yoon, J.A. Madsen, M. Reyes- Dirvy, J. Inherit. Metab. Dis. 20 (1997) 411.Mugica, P. Rinaldo, J. Pediatr. 132 (1998) 924. [76] C.R. Roe, D.S. Roe, Mol. Genet. Metab. 68 (1999) 243.
[67] Y. Shigematsu, Y. Kikawa, M. Sudo, H. Kanaoka, M. [77] J.J. Shien, D. Matern, D.S. Millington, S. Hillman, M.D.Fujioka, M. Dan, Clin. Chim. Acta 203 (1991) 369. Feezor, M.J. Bennett, M. Qumsiyeh, S.G. Kahler, Y.-T.
[68] J.L.K. Van Hove, D.H. Chace, S.G. Kahler, D.S. Millington, Chen, J.L.K. Van Hove, J. Inherit. Metab. Dis. 23 (2000) 27.J. Inherit. Metab. Dis. 16 (1993) 361. [78] C.R. Roe, S.D. Cederbaum, D.S. Roe, R. Mardach, A.
[69] Y. Shigematsu, I. Hata, A. Nakai, Y. Kikawa, M. Sudo, Y. Galindo, L. Sweetman, Mol. Genet. Metab. 65 (1998) 264.Tanaka, S. Yamaguchi, C. Jakobs, Pediatr. Res. 39 (1996)680.