revised strategic plan - dws
TRANSCRIPT


Revised stRategic Planfor the fiscal years
2020/21 to 2024/25


Foreword by the MinisterThe South African Constitution, with its roots fi rmly embedded in the Freedom Charter and the Bill of Rights, proclaims that “South Africa belongs to all who live in it” and that all citizens have a right to an environment that is not harmful. This is meant to result in an inclusive and non-racial society.
South Africa is a country brimming with potential and a resilient and fast growing economy is at the heart of our envisaged economic transformation agenda, directed by the National Development Plan, our South African Vision 2030.
The country’s Vision 2030 is well supported by the National Water and Sanitation Master Plan that we launched in November 2019, which Plan will direct all our eff orts towards 2030 and beyond, the African Union’s Vision 2063, as well as the United Nations’ Sustainable Development Goals, Goal Number 6 (SDG-6) impacting on the delivery of water and sanitation.
Our economy has been facing diffi culties since the fi nancial crisis in 2008. As a country we embarked on an aggressive infrastructure development programme to stimulate growth, led by the Presidential Infrastructure Coordinating Commission. Global growth still remains muted and fi nancial markets have become volatile. Currencies of emerging markets have become weak and they fl uctuate widely, and the reality of other input factors cannot be ignored.
Our economy is also aff ected by domestic factors most notably electricity constraints and industrial relations both which are at times unstable.
The mandate of the Department of Water and Sanitation (DWS) is derived from the country’s Constitution and carries the responsibility to deliver basic yet crucial services to the populace. The service delivery tools for the DWS are embodied in the National Water Act (NWA), Water Services Act (WSA) and the Water Research Act (WRA) including all policy mandates and strategies which form a solid basis upon which to build our plans for the next fi nancial year and beyond.
Our political guidance and directions are premised on the government’s Programme of Action which drives all our eff orts to respond to and carry out the needs and desires of South Africans.
The planning terrain for the 2020/21 – 2024/25.strategic plan has been intensifi ed and includes the Department’s entities. The department sets the agenda and identifi es key projects for the State Owned Companies and entities to implement over a defi ned period. These interventions are essential for growth and sustained service delivery to a growing populace and demand.
It is important to recall that due to the fact that the Department had accruals in the last few years, it is necessary to review the strategic plan in order to align the Annual Performance Plan (APP) targets with the available budget.
At the same time, the Department will continue to fi nd cost eff ective ways of realising its mandate within the allocated budget.
We all have a lot to do to turn the economy around and to reduce wastage. This belt-tightening exercise will require us to go through a diffi cult period until the economy recovers.
We need to also adhere to:
Scaling-up private-sector investment for water infrastructure. • Growing the Ocean Economy; • Identifying Cross-cutting Areas to Reform, • Boost and Diversify the Economy through Science;
technology and innovation Reliable Water and Sanitation provision.
reliable Water and sanitation provisionThe maintenance and building of water infrastructure remains crucial to expanding access to South Africans wherever they live and work. In the same vein it is imperative to improve delivery of decent sanitation and while doing so explore the use of innovative technologies.
This Strategic Plan sets out the Department’s transformative programme that is certain to yield positive outcomes
l n sisulu (MP)MINISTER OF HUMAN SETTLEMENTS, WATER AND SANITATION
eXecUtiVe aUthority stateMent
ii
Since the advent of our democratic dispensation a number of variables have impacted on the network industries. The ANC had to expand access to services to many South Africans who were deliberately excluded, the population has grown substantially, increased levels of migration, urbanization and economic growth in terms of GDP compared to 1994. In addition consideration has to be placed in adapting to climate change imperatives and taking advantage of the technological advances in line with 4th industrial revolution.
South Africa remains a water scarce country and is facing a challenge in the delivery of water and sanitation services caused by among other factors, insuffi cient water infrastructure maintenance and investment, recurrent droughts driven by climatic variation, inequities in access to water and sanitation, deteriorating water quality, and a lack of skilled water engineers, scientists, hydrologists, geo-hydrologists and resource economist, etc. This crisis is already having signifi cant impacts on economic growth and on the well-being of everyone in South Africa. This is exacerbated by climate change related impacts and the Covid-19 pandemic.
The spatial availability of water has serious impact on development, access to infrastructure and services. This legacy is still visible wherein most urban and industrial development took place far from water source mainly due to occurrence of mineral wealth or deposits and deliberate political decisions taken by the apartheid regime. The focus on spatial transformation by the ANC led government is an important intervention to reverse this legacy of uneven development.
One country continues to have skewed water allocation with respect to certain water use sectors. The biggest proportion of water sources were mainly directed to irrigation sector estimated at 60%, domestic use about 30% and the remainder to industries, mines and aff orestation. This trend is unsustainable in a country that has to cater for the reserve and international obligations in the midst of scarcity of the resource. In other water management areas the water allocated has been far exceeded and to mitigate against this reality a large scale transfer of water across the catchments has been implemented.
Due to population growth, migration, urbanization and lack of infrastructure maintenance, we have experienced
negative impact on the quality of the water resources. Water quality continues to deteriorate at an alarming rate. Results indicate that the source of pollution emanates from the lack of or inadequate sanitation, return affl uent from industries, mines, rural settlements, agricultural run off s, ground water, pollution human settlement activities, and mining.
Our world-class water resource planning has been neglected over the past few years as we concentrated on providing basic water supply to our people. Our infrastructure planning and implementation has experienced poor planning, inadequate budgeting, delays in execution, poor maintenance of infrastructure, corruption in procurement, and lack of technical engineering capacity We will re-invigorate our long range planning capabilities. To do this, we will build on the technical skills still available within the sector.
An implementation model of Khawuleza has been adopted to speed up infrastructure planning and delivery. We are harnessing our capacity in TCTA, Water Boards and DWS Construction Unit to implement certain infrastructure projects with a clear focus to create jobs and promote SMMEs, with 30% of procurement spend targeting women and youth owned enterprises.
Inadequate or lack of waste water treatment and management of effl uent discharges including agricultural and urban runoff s has impacted negatively to the health, environment and economic risks. This is due to lack of technical capacity for operations and maintenance of Waste Water Treatment Plants and lack of enforcement capability by regulators.
Over the last 26 years strides have been made. Around 95% of South African households live in areas where infrastructure to supply at least a basic level of water service is reported to have been provided (the remaining 5% are mainly in informal urban settlements or relatively remote scattered rural locations). Despite extensive infrastructure provision, the reliability of domestic water supply is declining and many services have failed. We are full armed with very progressive and transformative water legislation leading to water resource technologies, well developed infrastructure, sound track record, and strong institutions/utilities.
MessaGe froM the DePUty Minister
iii
For water resource infrastructure we need to promote collaborations to identify and scale up public private investments to accelerate implementation projects aimed in achieving sustainable development goal (SDG 6) on water and sanitation. Water is essential to life. We need to work hard to bring safe and sanitation to all. Let’s provide families with hope, health and the opportunity to break the cycle of poverty, unemployment and reducing inequality.
We will work closely with MISA and COGTA on all the Municipal Water Grants related projects. In our infrastructure designs we shall ensure fi t for purpose whilst ensuring maximum use of locally produced components and equipment. Water Infrastructure grants cannot and should not be diverted!
This 6th administration led by President Cyril Ramaphosa has a political commitment and institutions with requisite capacity that can be improved to deliver on our mandate.
Whilst our economic prospects have been diminished by two major developments namely the downgrade of our country to below investment grade levels and the global pandemic of serious acute respiratory syndrome coronary virus, known as COVID-19 we have to adopt a fl exible and responsive approach to water resources infrastructure where we have experienced unprecedented increased pressures on water demand, consumption and infl ows.
The water security question in South Africa is invariably linked to food and energy security and as evident in the COVID response strategy, to the health and infection control in the era of the pandemic. This discussion document has quantifi ed the present funding needs of the sector from a bulk raw perspective and the innovations that should be adopted for the investment to have a high impact in terms of direct job creation and future water security. It has also explored the multiplier eff ect of investment in major water projects into mining, agriculture and a catalyst post disasters historically.
The public vaccination of President Ramaphosa on 16 February 2021 has undoubtedly enhanced optimism to our people of our Government plan and strategy to fi ght the spread of the Corona Virus and we are very grateful of the commitment of our frontline workers who are still holding the fort, saving lives under diffi cult conditions where their lives are threatened.
Mr Md MahloboDEPUTY MINISTER WATER AND SANITATION
iv
The Department of Water and Sanitation (DWS) developed a National Water and Sanitation Master Plan (the Master Plan) in partnership with all relevant organs of state and water sector stakeholders, to give eff ect to local, national, regional, continental and international water and sanitation delivery targets and commitments. It points out the priority actions required until 2030 and beyond to ensure the water security and equitable access to water and sanitation services for all in South Africa.
The Master Plan is a vital tool for the entire South African water sector in that it strives to improve integrated planning and development across the value chain as well as addressing issues relating to the water and sanitation needs of the country as envisioned in the National Development Plan (NDP), the Sustainable Development Goals (SDGs) and in particular goal six “Ensure Water and Sanitation for All” as well as the African Union Agenda 2063.
The Master Plan is driven by a sense of urgency and therefore articulates the prioritised actions and investments the country must implement between now and 2030 to overcome challenges and ensure a water secure future supporting inclusive development across the country. This action is also necessary to ensure that universal sanitation coverage protects the health of our people.
The Department’s strategic priorities have been reconfi gured to align with the Master Plan’s key elements. These departmental strategic priorities also fall within two (2) priorities of the revised 2019-2024 Medium Term Strategic Framework (namely Economic Transformation and Job Creation and Spatial integration, Human Settlements and Local Government).
Through the implementation of the infrastructure programme, the Department also plans to support the President’s Economic Reconstruction and Recovery Plan’s (ERRP) priority intervention of Aggressive Infrastructure Investment. In addition, through targeted procurement, plans are underway to support women, youth and persons with disabilities to ensure their economic empowerment is realised.
The President’s 2021 State of the Nation Address (SONA) and Operation Vulindlela also identifi ed priority structural reforms that need to be implemented to fast-track economic recovery. These have been included in the Department’s planning documents.
Mr t i BalzerACTING DIRECTOR-GENERAL
accoUntinG officer STATEMENT
v
Offi cial sign-Off It is hereby certifi ed that this Strategic Plan:
• Was developed by the management of the Department of Water and Sanitation under the guidance of L N Sisulu (MP);
• Takes into account all the relevant policies, legislation and other mandates for which the Department of Water and Sanitation is responsible.
• Accurately refl ects the impact, outcomes and outputs which the Department of Water and Sanitation will endeavor to achieve over the period 2020/21 – 2024/25.
Mr C GreeveDDG (Acting) : Corporate Support Services
Ms F L. N W Lusenga DDG: International Water Support
Ms D MochotlhiDDG: Water Planning and Information Management
Mr L Manus DDG (Acting): Water Infrastructure Development
Ms T SigwazaDDG (Acting) Water Sector Regulation
Ms O N V FundakubiChief Operation Offi cer
Mr F Moatshe Acting Chief Financial Offi cer: Main Account and Water Trading
Mr T I Balzer(Acting) Director-General
M D Mahlobo (MP)Deputy Minister of Human Settlements, Water and Sanitation
L N Sisulu (MP)Minister of Human Settlements, Water and Sanitation

vi
Executive Authority Statement ................................................................................................................................................................. i
Foreword by the Minister ............................................................................................................................................................................ i
Message from the Deputy Minister ........................................................................................................................................................ ii
Accounting Officer Statement .................................................................................................................................................................iv
Official Sign-Off ..............................................................................................................................................................................................v
PaRt a: MANDATE .........................................................................................................................................................................................................1
1 Constitutional mandate ............................................................................................................................................................11.1 Chapter 2 on the Bill of Rights ....................................................................................................................................11.2 Chapter 6 on Provinces .................................................................................................................................................11.3 Chapter 7 on Local Government ...............................................................................................................................11.4 Schedule 4 on Functional Areas of Concurrent National and Provincial Legislative
Competence .....................................................................................................................................................................12 Legislative and policy mandates ...........................................................................................................................................2
2.1 Legislative mandate ........................................................................................................................................................22.1.1 The National Water Act, 1998 (Act No 36 of 1998) as amended .......................................................22.1.2 The Water Services Act, 1997 (Act No 108 of 1997) ...............................................................................22.1.3 The Water Research Act, 1971 (Act No 34 of 1971) ................................................................................2
2.2 Policy framework .............................................................................................................................................................32.2.1 National Water Policy Review (2013) ..........................................................................................................32.2.2 National Sanitation Policy . .............................................................................................................................32.2.3 Other water and sanitation policies and strategies...............................................................................4
2.3 Legislative and policy mandates for cross cutting priorities ............................................................................42.3.1 Employment Equity Act 55 of 1998 .............................................................................................................42.3.3 The Broad-Based Black Economic Empowerment Act 53 of 2003: .................................................42.3.4 National Youth Policy 2015-2019 .................................................................................................................42.3.5 Youth Accord Pillars: (Youth Employment Accord April 2013) ..........................................................42.3.6 South African National Policy Framework for Women Empowerment and Gender
Equality (NPFWEGE), 2000 ..............................................................................................................................4
t a B l econtents

vii
2.3.7 Job Access Strategic framework for recruitment, employment and retention of people with disabilities (2006 – 2010) .......................................................................................................................4
2.3.8 White Paper on the Rights of People with Disabilities in South Africa 2016 ................................43 Institutional policies and strategies over the five year planning period ................................................................44 Relevant court rulings ...............................................................................................................................................................5
Pa R t B : STRATEGIC FOCUS .........................................................................................................................................................................................6
5 Vision ...............................................................................................................................................................................................66 Mission ............................................................................................................................................................................................67 Values ..............................................................................................................................................................................................68 Situational analysis .....................................................................................................................................................................6
8.1 External environment .....................................................................................................................................................68.2 Internal environment .................................................................................................................................................. 138.3 National priorities ......................................................................................................................................................... 15
PaRt c: MEASURING PERFORMANCE .................................................................................................................................................................. 16
9 Performance information ...................................................................................................................................................... 169.1 Measuring the impact ................................................................................................................................................. 169.2 Measuring outcomes ................................................................................................................................................... 169.3 Explanation of planned performance over the five year planning period .............................................. 19
9.3.1 Programme 1: Administration .................................................................................................................... 199.3.2 Programme 2: Water Resource Management ....................................................................................... 199.3.3 Programme 3: Water Services Management ......................................................................................... 20
10 Key risks ....................................................................................................................................................................................... 2211 Public entities ............................................................................................................................................................................ 24
PaRt d: TECHNICAL INDICATOR DESCRIPTION (TID) ..................................................................................................................................... 26
Compliance with corporate governance regulatory prescripts .............................................................................. 26 Percentage implementation of the 2024/2025 Annual Communications, Stakeholder Management
and Partnership Programme ............................................................................................................................................... 27 Targeted procurement supporting SMMEs .................................................................................................................... 29 Percentage implementation of the financial recovery and turnaround plan .................................................... 30
viii
Percentage implementation of 2024/25 annual International Relations Programme ................................... 31 Number of river systems with water resource classes and determined resource quality objectives ........ 32 Number of rivers in which the River Eco-status Monitoring Programme is implemented ........................... 32 Number of river systems monitored for the implementation of resource directed measures .................... 33 Number of catchment strategies and plans developed for mine water and wastewater treatment
works ........................................................................................................................................................................................... 33 Waste Discharge Charge System (WDCS) Implemented country wide ............................................................... 34 Number of water conservation and water demand management strategies updated ................................. 34 Water resource mix diversified ............................................................................................................................................ 35 Number of water resource gauging stations/weirs constructed ............................................................................ 36 Number of water resource gauging stations/weirs refurbished ............................................................................. 37 Number of water resources monitoring programmes reviewed and maintained ........................................... 38 Number of Water and Sanitation information systems maintained ...................................................................... 39 Annual MuSSA reports on water services authorities’ performance in providing water and sanitation
services ........................................................................................................................................................................................ 40 Green Drop report on wastewater systems’ compliance with regulatory requirements ............................... 41 Blue Drop report on water supply systems’ compliance with regulatory requirements ............................... 42 Timeframe for processing water use license applications reduced to 90 days ................................................ 43 Average number of water users in various sectors monitored for compliance with water use license
per year ........................................................................................................................................................................................ 44 Performance of water resource institutions evaluated against their performance plans ............................. 45 Number of regional water utilities gazetted for establishment .............................................................................. 45 Number of irrigation boards transformed into Water User Associations ............................................................ 46 Regulation for advancement of water allocation reform finalised ........................................................................ 47
PaRt e: DISTRICT DEVELOPMENT MODEL ......................................................................................................................................................... 48
OR Tambo DM ................................................................................................................................................................................... 48Alfred Nzo DM ................................................................................................................................................................................... 50Waterberg ............................................................................................................................................................................................ 51Ethekwini ............................................................................................................................................................................................. 52
1
1 constitutional mandate
1.1 chapter 2 on the Bill of Rights makes the following provisions: • Section 10 - “everyone has inherent dignity and the right to have their dignity respected and protected.”
The same provision also applies to sanitation.• Section 24(a) - “everyone has a right to an environment that is not harmful to their health or well-being”• Section 27(1)(b) - “everyone has the right to have access to sufficient water”• Section 27(2) - obliges the state to “take reasonable legislative and other measures, within its available
resources, to achieve the progressive realisation” of everyone’s right of access to sufficient water.
1.2 chapter 6 on Provinces makes the following provisions
• s139 Provincial intervention in local government- (1) When a municipality cannot or does not fulfill an executive obligation in terms of the Constitution or legislation, the relevant
provincial executive may intervene by taking any appropriate steps to ensure fulfillment of that obligation.
1.3 chapter 7 on Local Government makes the following provisions
• s154 Municipalities in co-operative government- (1) The national government and provincial governments, by legislative and other measures, must support and strengthen the
capacity of municipalities to manage their own affairs, to exercise their powers and to perform their functions.
1.4 schedule 4 on Functional Areas of Concurrent National and Provincial Legislative Competence makes the following provisions: • Water and sanitation services limited to potable water supply systems and domestic waste-water and
sewage disposal systems
P a R t a : ManDate
Revised | stRategic Plan foR the fiscal yeaRs 2020/21 to 2024/25
2
2 legislative and policy mandatesThe legislative mandate of the water and sanitation sector seeks to ensure that the country’s water resources are protected, used, developed, conserved, managed and controlled through regulating and supporting the delivery of effective water supply and sanitation.
2.1 legislative mandateThe Department and the sector draw their primary mandate from the following legislation:
2.1.1 the national Water act, 1998 (act no 36 of 1998) as amendedThe National Water Act seeks to ensure that the country’s water resources are protected, used, developed, conserved, managed and controlled in a sustainable and equitable manner for the benefit of all people.
The Act assigns the national government as the public trustee of the water resources. Acting through the Minister, it has the power to regulate the allocation, use, flow and control of all water in the Republic. It also identifies the need to establish suitable institutions in order to achieve its purpose. In addition, it provides for the development of the National Water Resources Strategy (NWRS) which must be regularly reviewed and the requirement of each Catchment Management Agency (CMA) to develop a catchment management strategy for the water resources within its jurisdiction.
2.1.2 the Water services act, 1997 (act no 108 of 1997)The Water Services Act prescribes the legislative duty of municipalities as water service authorities to supply water and sanitation according to national norms and standards. In addition, it regulates Water Boards as important water service providers.
The Act compels the Minister to maintain a National Water Services Information System and to monitor the performance of all water services institutions, as well as providing for the monitoring of water services and intervention by the Minister or the relevant Province when necessitated.
With reference to a “right to basic sanitation”, this is the primary legislation relating to sanitation in South Africa. It further defines basic sanitation as: ‘The prescribed minimum standard of services necessary for the safe, hygienic and adequate collection, removal, disposal or purification of human excreta, domestic waste water and sewerage from households, including informal households’. Further regulations, norms and standards pertaining to sanitation can be found in the Housing Act (No.107 of 1997).
It acknowledges that although municipalities have authority to administer water supply services and sanitation services, all government spheres are required to works towards this object, within the limits of physical and financial feasibility.
2.1.3 the Water research act, 1971 (act no 34 of 1971)The Water Research Act establishes the Water Research Commission and the Water Research Fund, and thus promotes water related research and the use of water for agricultural purposes, industrial purposes or urban purposes. The Minister appoints members of the Water Research Commission (the Commission), and thus exercises executive oversight over the Commission.
3
REVISED | STRATEGIC PLAN FOR THE FISCAL YEARS 2020/21 TO 2024/25
2.2 Policy framework2.2.1 national Water Policy Review (2013): the policy review determined unintended oversight and gaps in
the existing water policies to provide amendment to address the following:
(a) Use-it or lose-it: Any authorised water use (including existing lawful use) unutilised for a specifi ed period should be reallocated to the public trust. This water will be reallocated to address social and economic equity
(b) no water trading: No form of temporary or permanent trading between authorised water users. The obligation for any holder of an entitlement to use water; if it is no longer utilised, is to surrender such use to the public trust.
(c) Prioritising social and economic equity: The decision making will have equity as the primary consideration. Priority will be accorded to water use authorisation applications that meet the equity requirement, as provided in the regulatory instruments.
(d) Multiple water use approach in planning: A multiple water use approach incorporating all water uses in an area including water supply, must be adopted in planning of bulk water infrastructure. This approach will also have equity and transformation as a priority
(e) access to basic water supply: A water service authority (WSA) should work progressively or incrementally towards providing higher levels of a sustainable water supply to all households and public institutions, including rural areas. When planning, a WSA must consider a basic water supply which addresses current domestic and productive use requirements, as well as future growth in these requirements
(f) Free basic water supply to indigent households: Free basic water supply will be provided to indigent households only.
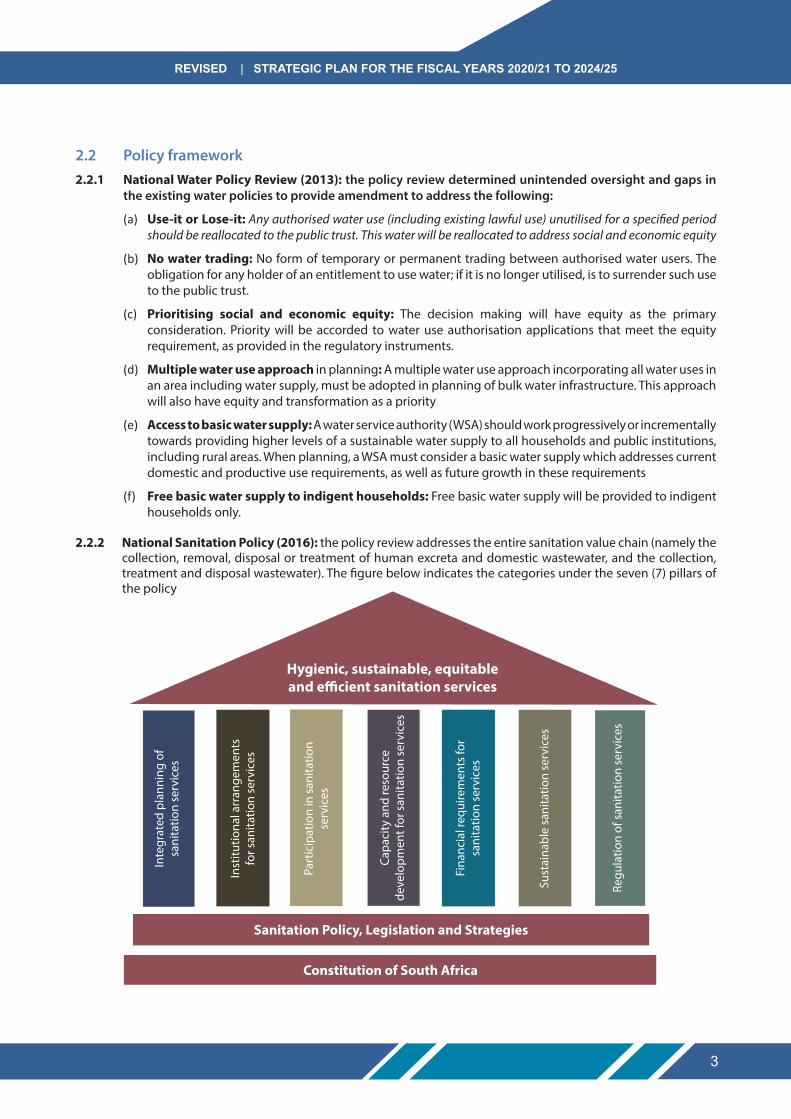
2.2.2 national sanitation Policy (2016): the policy review addresses the entire sanitation value chain (namely the collection, removal, disposal or treatment of human excreta and domestic wastewater, and the collection, treatment and disposal wastewater). The fi gure below indicates the categories under the seven (7) pillars of the policy
Hygienic, sustainable, equitable and e�cient sanitation services
Inte
grat
ed p
lann
ing
of
sani
tatio
n se
rvic
es
Inst
itutio
nal a
rran
gem
ents
fo
r san
itatio
n se
rvic
es
Part
icip
atio
n in
san
itatio
n se
rvic
es
Capa
city
and
reso
urce
de
velo
pmen
t for
san
itatio
n se
rvic
es
Fina
ncia
l req
uire
men
ts fo
r sa
nita
tion
serv
ices
Sust
aina
ble
sani
tatio
n se
rvic
es
Regu
latio
n of
san
itatio
n se
rvic
es
Sanitation Policy, Legislation and Strategies
Constitution of South Africa

Revised | stRategic Plan foR the fiscal yeaRs 2020/21 to 2024/25
4
2.2.3 other water and sanitation policies and strategies include the following:
(a) White Paper on Water Supply and Sanitation (1994)
(b) White Paper on National Water Policy for South Africa (1997)
(c) White Paper on Basic Household Sanitation (2001)
(d) Strategic Framework for Water Services (2003)
(e) National Water Resources Strategy, Second Edition (2013)
(f) Water and Sanitation Climate Change Policy (2017)
2.3 legislative and policy mandates for cross cutting priorities
2.3.1 employment equity act 55 of 1998: section 20(1) requires the development of an employment equity plan that will achieve reasonable progress towards employment equity in the workforce
2.3.2 Preferential Procurement Policy Framework act 5 of 2000: the 2017 regulations indicate the requirements for local production and content; subcontracting conditions
2.3.3 the Broad-Based Black economic empowerment act 53 of 2003:
2.3.4 national youth Policy 2015-2019
2.3.5 Youth Accord Pillars: (youth employment accord april 2013)
2.3.6 south african national Policy framework for Women empowerment and Gender equality (nPfWeGe), 2000
2.3.7 Job access strategic framework for recruitment, employment and retention of people with disabilities (2006 – 2010)
2.3.8 White Paper on the rights of People with Disabilities in south africa 2016
3 institutional policies and strategies over the five year planning periodThe National Development Plan (NDP) predicts that before 2030, all South Africans will have affordable, reliable access to sufficient safe water and hygienic sanitation1. The Industrial Policy Action Plan (IPAP) also sets out the intentions of South Africa in terms of expanding the manufacturing sector, which will increase water demand. To balance requirements and supply, South Africa will therefore need to reduce water demand, as well as increase supply for a growing population and economy in order to ensure water security.
In support of the NDP, the Medium Term Strategic Framework (MTSF) for 2019 to 2024 seeks to address unemployment, inequality and poverty. The MTSF indicates that significant work still needs to occur in order to transform the status quo onto a new development trajectory. To achieve this, it identifies seven priorities namely economic transformation and job creation; education, skills and health; consolidating the social wage through reliable and quality basic services; spatial integration, human settlements and local government; social cohesion and safe communities; a capable, ethical and developmental state; and a better Africa and world. In addition, it requires government to put a concerted effort in prioritising initiatives that support women, youth and people with disabilities.
3.1 Mine Water Management policy: the policy seeks to balance the mining sector’s economic development with the protection and ensuring sustainable use of water resources in a manner that is beneficial to all. It will provide a coherent and integrated South African approach for sustainable mine water management by building on existing strengths; addressing gaps/weaknesses and seizing identified opportunities relating to mine water management (including acid mine drainage).
1 Source: National Development Plan 2030, National Planning Commission (2012: 178)

5
Revised | stRategic Plan foR the fiscal yeaRs 2020/21 to 2024/25
3.2 sustainable Hydropower generation policy: the policy aims to support the long term energy master plan that pursues hydropower as part of the energy mix. In addition, it would provide policy positions on the establishment and development of hydropower from infrastructure owned by the DWS as part of long term interventions that support and contribute towards sustainable power supply in South Africa.
3.3 integrated Water Quality Management policy: the policy seeks to develop an intergovernmental water quality management approach which would facilitate an integrated response to address water quality management challenges in the country. The policy would strengthen the existing integrated water quality management strategy that identified priority programmes to be implemented country-wide.
3.4 national Water and sanitation Bill: this is a consolidation of the National Water Act, 1998 (NWA) and the Water Services Act, 1997 (WSA) to a single legislation. It will clarify the legislative framework regarding water management across the water and sanitation value chain. It will further obviate the need for cross reading between the NWA and the WSA.
3.5 national Water Resource strategy third edition (nWRs-3): (NWRS) provide the framework for the protection, use, development, conservation, management and control of water resources for the country as a whole.: the NWA requires the review of the NWRS at intervals of not more than five (5) years and this is the third edition of National Water Resources Strategy (NWRS-3).
3.6 Review of the water pricing strategy: The strategy review seeks to improve the financial viability of government’s bulk raw water business to ensure that this scarce resource is valued by all citizens. The major change of the review is to move from the Return on Asset method of infrastructure costing to a method of pricing based on Future Infrastructure Built over 10 years per province.
3.7 national Water and sanitation Master Plan: sets out the critical priorities to be addressed by the water sector in the period from 2018 – 2030. It also identifies actions and interventions to ensure the realisations of the priorities.
4 Relevant court rulingsConstitutional Court Case: Mazibuko and others v City of Johannesburg and Others (CCT 39/09) (2009) ZACC. In this case the Constitutional Court recognised that water is life and that everyone has the right to sufficient water.

6
5 visionEquitable and sustainable water and sanitation that support socio-economic growth and development of the well-being of current and future generations.
6 Mission• To ensure the universal access of all South Africans to equitable water resources and sustainable water and
sanitation services, by: • Protecting, developing, conserving, managing and regulating water resources; • Managing, regulating and providing efficient and effective water and sanitation services; • Providing strategic leadership and evidence based policy direction to a coordinated water and sanitation
sector for improved sector performance and service delivery; • Building the skills and capabilities of the sector and enhancing information management to inform
decision making; and • Enhancing communication and stakeholder partnerships with communities and sector constituencies to
advance the national development agenda.
7 values• Providing services impartially, fairly, equitably and without bias;• Utilising resources efficiently and effectively;• Promoting and maintaining high standards of professional ethics;• Responding to people’s needs; citizens are encouraged to participate in policy-making;• Rendering an accountable, transparent, and development -oriented public administration.
8 situational analysisA number external and internal environment matters affect the department’s ability to deliver on its mandate. Some of these present various challenges and opportunities impacting on its operations influencing planning decisions and the required trade-offs. This results in the prioritisation of certain interventions and programmes over others taking into consideration the required resourcing and associated risks.
8.1 external environmentWater crises are identified as one of the global risks in terms of societal impact. These are defined as a significant decline in the available quality and quantity of fresh water, resulting in harmful effects on human health and/or
Pa R t B : strateGic focUs
7
economic activity2. There is a probability of the water crises in South Africa due to insufficient investment in water infrastructure; poor maintenance in existing water infrastructure; recurrent droughts driven by climatic variation; inequities in access to water and sanitation; deteriorating water quality, and a lack of skilled water engineers. These water crises are exacerbated by climate change which continues to present changes in temperature, precipitation and extreme weather events having a detrimental effect on both local and international confidence. The persistent challenges related to water security in South Africa are summarised below:
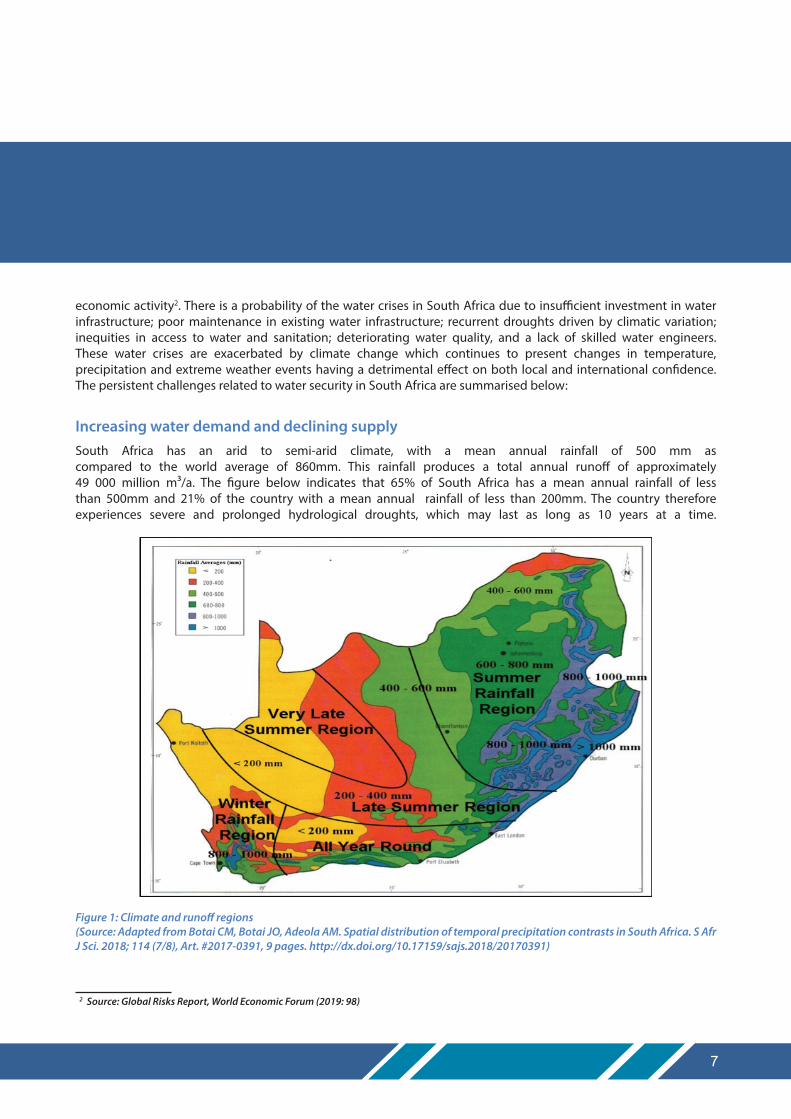
increasing water demand and declining supplySouth Africa has an arid to semi-arid climate, with a mean annual rainfall of 500 mm as compared to the world average of 860mm. This rainfall produces a total annual runoff of approximately 49 000 million m³/a. The figure below indicates that 65% of South Africa has a mean annual rainfall of less than 500mm and 21% of the country with a mean annual rainfall of less than 200mm. The country therefore experiences severe and prolonged hydrological droughts, which may last as long as 10 years at a time.
Figure 1: Climate and runoff regions (Source: Adapted from Botai CM, Botai JO, Adeola AM. Spatial distribution of temporal precipitation contrasts in South Africa. S Afr J Sci. 2018; 114 (7/8), Art. #2017-0391, 9 pages. http://dx.doi.org/10.17159/sajs.2018/20170391)
2 Source: Global Risks Report, World Economic Forum (2019: 98)

Revised | stRategic Plan foR the fiscal yeaRs 2020/21 to 2024/25
8
The country’s water security is mainly reliant on fresh surface water, with ground water and return flows underutilised. There are currently 5 551 registered dams with a total gross storage capacity of 33 2913 million m³. Of these registered dams, 4 294 are small (i.e. less than 12m) serving farms and municipalities. These smaller dams play a critical role in local water security and climate resilience. The total national potential for accessible groundwater, on the other hand, is approximately 4 500 million m³/a; of which between 2 000 and 3 000 million m³/a, is being utilised.
The 2019 national demand for water requirements is 10 233 million m³/a; with the current reliable national yield of surface water at an acceptable assurance of supply at approximately 10 137 million m³/a. This means there is a nation deficit of 96 million m³/a; in other words, the demand is exceeding supply. Although there is a national deficit, there are certain areas with surpluses; water is transferred through the transfer schemes to service the demand areas. Due to the skewed nature of the strategic water source areas, large transfer schemes have been developed to service various demand centres. Water is therefore managed through catchment areas rather than political boundaries.
Agriculture is the largest water use at 61%, followed by municipal use at 27% (including industrial and commercial users provided from municipal systems), with power generation, mining and bulk industrial use, livestock and conservation and afforestation jointly making up the remaining 12%. The assurance level at which agricultural water is supplied is lower than for other sectors at 90%. Water for power generation is seen as strategically important and is provided with the highest assurance of supply at 99.5%; which translates to 1: 200-year risk of failure.
Agricultural consumption is largely unmetered, and there are concerns about unauthorised abstraction and water wastage in the sector. In addition, agricultural users pay a much lower tariff than other users of untreated water and the relatively cheap water has not incentivised the adoption of water efficient irrigation practices. However, the agricultural sector is important in terms of jobs and contribution to the GDP. The value of primary agricultural production in South Africa was R263, 2 billion in 2016.
The domestic sector has high water use partly due to municipal non-revenue water which is currently at 41%. Non-revenue water includes all water supplied that is not paid for, including physical water losses through leaks in the distribution system, illegal connections, unbilled consumption and billed, but unpaid for water use. While figures vary greatly between municipalities and services providers, average physical losses in municipal systems are estimated to be around 35%, against a global best practice in the order of 15%.
The Industrial Policy Action Plan (IPAP) sets out the intentions of South Africa in terms of expanding the manufacturing sector, which will increase water demand in this sector, and which has the potential to increase water pollution if not appropriately regulated.
To balance requirements and supply, South Africa will need to reduce water demand, as well as increase supply for a growing population and economy in order to ensure water security by 2030. Without demand management, currently planned infrastructure development and the broadening of the water mix will not be sufficient to balance supply and demand. However, if the targets of reducing physical losses in municipal systems are reached, as well as a reduction in the per capita consumption to the global average, in addition to the surface and groundwater supplies, and desalination, re-use and treated AMD, there will be a slight surplus available in 2030.
3 Note: The total gross storage capacity is not an indication of the dam’s current level but the design storage capacity when the dam is full (i.e. 100% storage).
9
Revised | stRategic Plan foR the fiscal yeaRs 2020/21 to 2024/25
Deteriorating water ecosystemsSouth Africa’s aquatic ecosystems include seven of the world’s freshwater ecoregions, and are characterised by a wide range of river, wetland and estuarine ecosystem types. Many of these aquatic ecosystems make up the country’s ecological infrastructure (i.e. nature’s equivalent of built infrastructure) that generates and delivers benefits in the water value chain. Ecological infrastructure is currently an under-realised asset that can play a significant role in enhancing returns-on-investment in built infrastructure (e.g. dams), especially if its maintenance is explicitly incorporated into the planning and construction of built infrastructure.
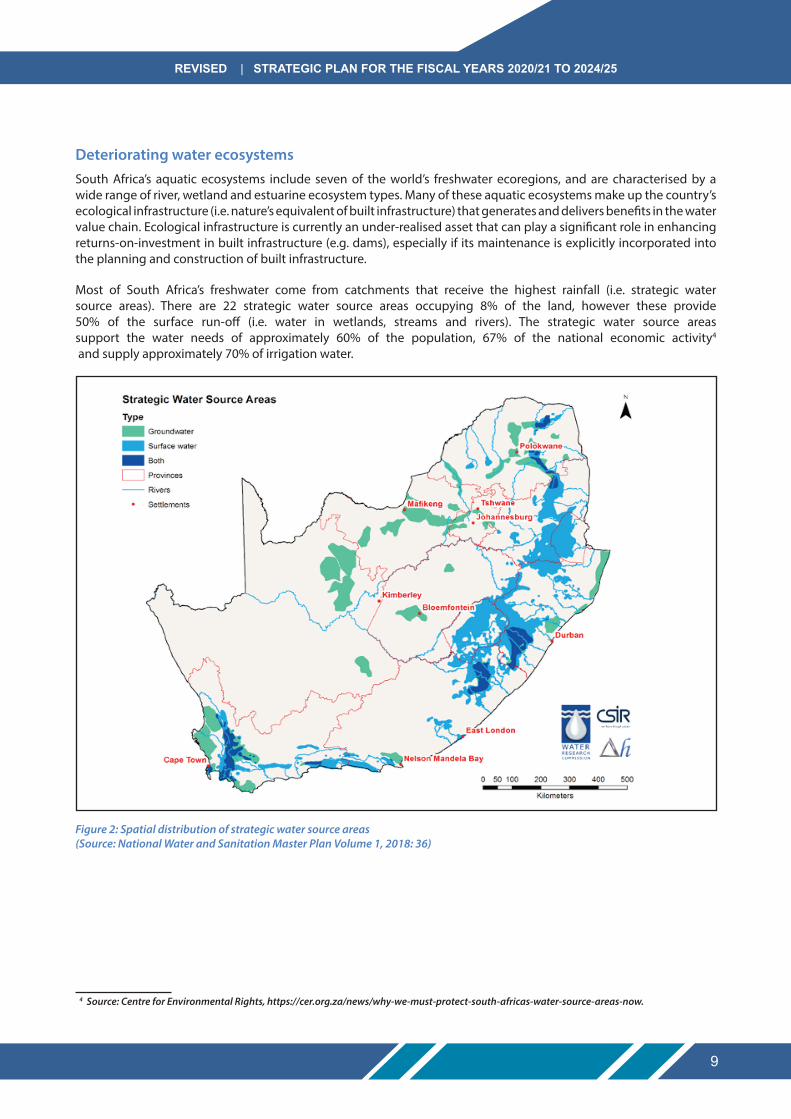
Most of South Africa’s freshwater come from catchments that receive the highest rainfall (i.e. strategic water source areas). There are 22 strategic water source areas occupying 8% of the land, however these provide 50% of the surface run-off (i.e. water in wetlands, streams and rivers). The strategic water source areas support the water needs of approximately 60% of the population, 67% of the national economic activity4
and supply approximately 70% of irrigation water.
Figure 2: Spatial distribution of strategic water source areas(Source: National Water and Sanitation Master Plan Volume 1, 2018: 36)
4 Source: Centre for Environmental Rights, https://cer.org.za/news/why-we-must-protect-south-africas-water-source-areas-now.
Revised | stRategic Plan foR the fiscal yeaRs 2020/21 to 2024/25
10
Many of the high value aquatic ecological infrastructure assets are poorly protected, and in some areas of the country are under severe pressure, from intensive agriculture, mining and urban sprawl that results in loss or degradation of ecosystems. Like built infrastructure, ecological infrastructure needs to be maintained, and in some cases restored, in order for its socio-economic benefits to be realised.
It is estimated that South Africa has lost over 50% of its wetlands, and of the remaining 3.2 million ha (less than 5% of SA’s land cover) a third are already in a poor condition limiting their ability to inter alia regulate water flow and purify water. The loss and degradation of ecological infrastructure negatively affects system yield and increases water-related risks. Degraded wetlands, for example, lose their ability to release water in times of drought, or to recharge groundwater supplies. Degraded ecological infrastructure increases the vulnerability of people and built infrastructure to floods and increases maintenance and repair costs on built infrastructure. It is often more cost effective to rehabilitate ecological infrastructure than to be faced with an ongoing need to repair or replace built infrastructure.
Unreliable water and sanitation servicesSection 27(1) (b) of the Constitution indicates that “everyone has the right to have access to sufficient water” with section 10 indicating “everyone has inherent dignity and the right to have their dignity respected and protected”; which also applicable to sanitation.
In 1994, 15.2 million people were estimated to have no access to basic water supply and an estimated 20.5 million lacked basic sanitations. Twenty-five years later there is significant progress with 95% of the population provided with access to a basic water supply and basic sanitation service is provided to 79% of the population.
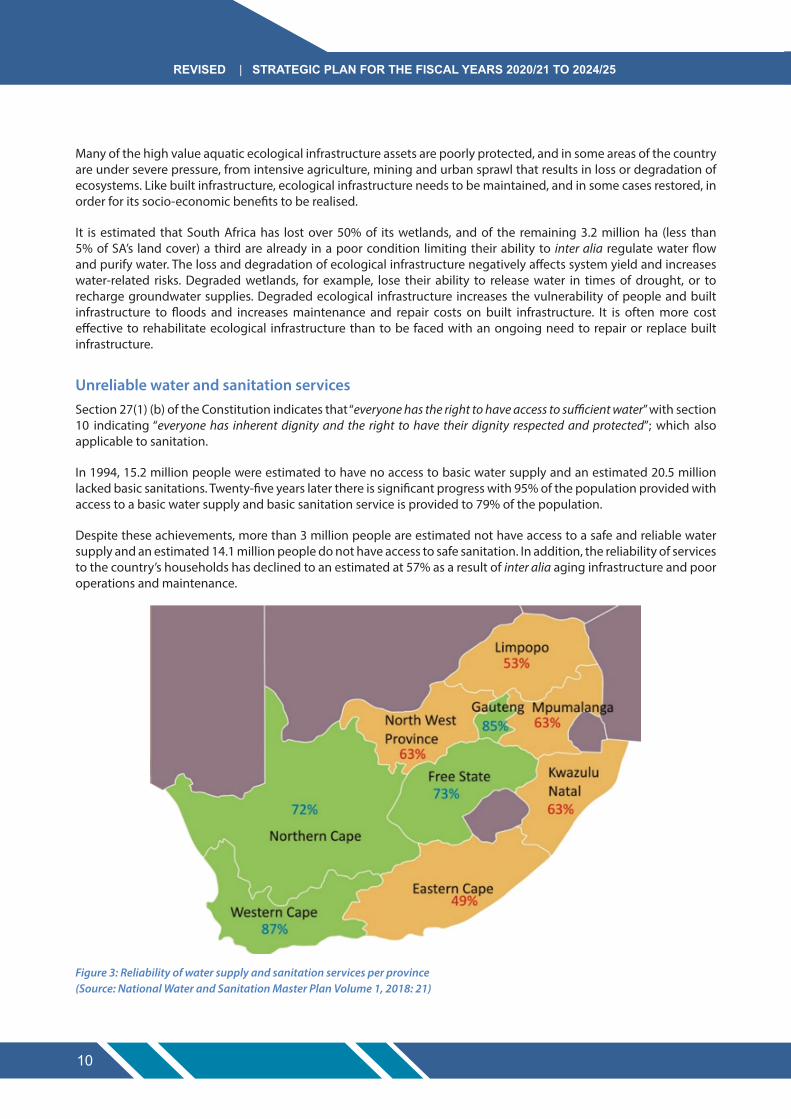
Despite these achievements, more than 3 million people are estimated not have access to a safe and reliable water supply and an estimated 14.1 million people do not have access to safe sanitation. In addition, the reliability of services to the country’s households has declined to an estimated at 57% as a result of inter alia aging infrastructure and poor operations and maintenance.
Figure 3: Reliability of water supply and sanitation services per province (Source: National Water and Sanitation Master Plan Volume 1, 2018: 21)
11
Revised | stRategic Plan foR the fiscal yeaRs 2020/21 to 2024/25
The failure of some water service authorities (municipalities) to provide reliable water and sanitation services is largely due to the lack of technical skills; institutional capacity and funding to operate, maintain and manage water and waste water infrastructure assets properly. Furthermore, is the limited budget allocated by some municipalities for operations and maintenance relative to new capital works; poor revenue management; and the failure to employ suitably qualified technical staff members. In addition, the national infrastructure grant funding mechanisms incentivise the building of new infrastructure, rather than the maintenance of existing infrastructure.
A case in point is the operations and maintenance of the country’s water treatment works (WTW) and wastewater treatment works (WWTW). Approximately 56% of the over 963 WWTW and approximately 44% of the 1 010 WTWs are in poor or critical condition and in need of urgent rehabilitation. The poor state of water and wastewater treatment has significant implications for public health. In 2017, there were 2.8 million households in South Africa that utilised unimproved sanitation including 280,791 households which practised open defaecation (STATS SA, 2018).
The constitutional water supply and sanitation services responsibility lies with 144 municipalities that are water services authorities (WSA). At least 33% of these municipalities are regarded as dysfunctional and more than 50% have no or very limited technical staff. The 27 priority district municipalities have been identified as being particularly dysfunctional and requiring specific intervention.
In addition, many of the smaller and/or rural municipalities are faced with financial challenges. The socio-economic profile of South Africa is highly variable with 63% of households earning less than R38 000 per year (and therefore classified as indigent). Municipalities with high levels of indigent households are dependent on national grants to provide reliable and affordable water and sanitation services. In rural and/or smaller municipalities, the proportion of indigent household’s averages 77%. It is consequently difficult for municipalities with a low revenue base to address their backlogs and to allocate sufficient funds for maintaining and operating existing works. In some areas, major water infrastructure runs through rural areas without supplying them (such as the Tugela-Vaal scheme).
Statistics South Africa estimates the mid-year population for South Africa in 2019 at 58,78 million; of which 51.2% (approximately 30 million) is female and 28.8% is younger than 15 years5 which reinforces the importance of investing in women and youth. In addition, high rates of urbanisation have a major impact on the demand for water supply and sanitation services.
inequitable water allocationThe national water and sanitation policies and legislation mandate the water sector to provide universal and equitable access to reliable water supply and sanitation service. The sector is also mandated to protect, manage and develop the nation’s water resources in a manner that supports justifiable and ecologically sustainable economic and social development and to transform access to water to redress racial imbalances.
Transformation is critical in ensuring that water for productive used for purposes is equitable; governance of water is representative; there is access to decent water and sanitation services for all. Despite both policy and legislative tools intended to enable the transformation of water allocation to redress the historical racial discrimination in access to water, little has been achieved since the National Water Act (NWA) was promulgated in 1998. This is particularly true in the agricultural sector, where around 95% of the water is estimated to be used by white commercial farmers.
The Existing Lawful Use (ELU) was intended as a transitional arrangement. However, 20 years after the NWA was promulgated, ELUs authorise the biggest volume of water used in the country.
5 Source: Mid-year population estimates, Statistics South Africa (2019: 5)
Revised | stRategic Plan foR the fiscal yeaRs 2020/21 to 2024/25
12
While the restitution of agricultural land has been slower than intended, the reallocation of water has not always even kept pace with the transfer of that land. In some instances, the previous owners traded away their existing lawful water use rights, so that the water allocation was not transferred to land reform beneficiaries. According to The Institute for Poverty, Land and Agrarian Studies, more than 70% of commercial farms in the country are estimated to be owned by white farmers with about 39 000 white commercial farmers and 5 300 black farmers, according to the African Farmers Association of South Africa. Most of the black commercial farmers have relatively smaller farms.
The demand for land reform is high on the political agenda and will remain so until adequately addressed. Within the land reform programme, the transfer of some irrigable land without a water allocation has limited the ability of recipients to make productive use of the land. In addition, there are black farmers and entrepreneurs who have expressed their concerns about lack of access to water, and the challenges in getting water allocated for farming and enterprise development. The pressure to reallocate water to achieve more equitable water use thus remains high.
Weak regulation of the water and sanitation sectorStrong regulation is critical to achieve water security in South Africa, in terms of water quality (in rivers and taps), balancing demand and supply, ensuring the safety of dams, and being resilient to climate change impacts. Authorisation for water abstraction, waste discharge, and dam safety, and setting the charges for the use of raw water and the discharge of effluent are some of the tools used by the Department to regulate the water and sanitation sector.
Standards for water and sanitation services provision and associated tariffs are also governed by the Municipal Systems Act and the Municipal Finance Management Act. There are significant challenges in ensuring that WSA set appropriate tariffs that cover costs, including operation and maintenance costs, and that promote water use efficiency.
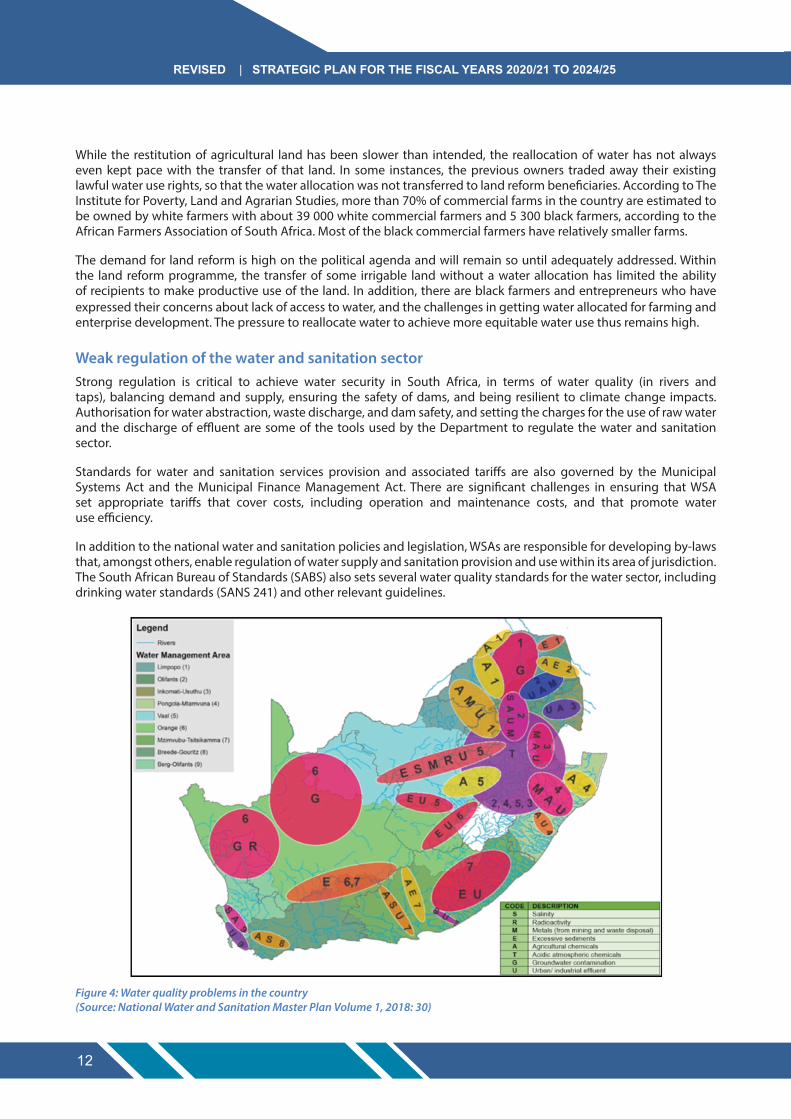
In addition to the national water and sanitation policies and legislation, WSAs are responsible for developing by-laws that, amongst others, enable regulation of water supply and sanitation provision and use within its area of jurisdiction. The South African Bureau of Standards (SABS) also sets several water quality standards for the water sector, including drinking water standards (SANS 241) and other relevant guidelines.
Figure 4: Water quality problems in the country (Source: National Water and Sanitation Master Plan Volume 1, 2018: 30)

13
Revised | stRategic Plan foR the fiscal yeaRs 2020/21 to 2024/25
Despite strong regulatory tools in the legislation, the quality of raw water continues to deteriorate across the country in many parameters as depicted in figure 4 below. This deterioration poses a threat to economic growth, social development, health and hygiene and aquatic ecological functioning. Poor raw water quality increases the costs of treatment for domestic and industrial use. It also negatively impacts agricultural production.
A case in point is the failure of some WSAs to deliver the requisite level of water supply and sanitation. This failure to meet drinking water quality standards is exacerbated by the cessation of the Blue, Green and No Drop assessments. In the 2014 Blue Drop assessment, 86% of WSAs achieved good or excellent status for microbiological water quality compliance, but only 70% achieved good or excellent status for water quality operational compliance.
The dam safety regulation is also severely strained owing to limited qualified personnel in the country. The National Water and Sanitation Master plan indicates that there are less than 100 dam safety approved professional persons (APPs) in South Africa (approximately 1 qualified person for every 50 dams on the dam safety register), and more than 66% of these APPs are older than 60 years of age.
The need to use the courts to impose sanctions on contraventions of water legislation hampers the ability to get speedy resolution on such matters. This is exacerbated by the overly complex water sector institutional landscape that is not sufficiently transformed and thus impacting the water value chain.
8.2 internal environment
The assessment of the Department’s resources and capabilities is essential in the realisation of this strategy. The assessment is summarised below:
organisational alignment
The organizational structure of the Department that was approved in September 2014, after consultation with the Minister of Public Service and Administration (MPSA) and National Treasury to secure budget allocations, was outmoded and is not supportive or aligned to achieving efficiency and effectiveness in the delivery of services throughout the water sector business. The current organizational structure does not comprehensively support line management in the implementation of the mandated water resource and water supply and sanitation services functions in the country.
A Ministerial initiative introduced in July 2019, directed that the organizational structure needs to be re-examined, with special emphasis on the alignment of functional outputs of each Branch, Provincial and Cluster Operations to the mandate and strategic direction of the Department.
Whilst adhering to the above Ministerial initiative, the process of re-designing the functional organizational structure, also resulted in the review and development of the service delivery model, the mapping of business processes, standard operating procedures, service standards, a concise service delivery charter and the service delivery improvement plan. The design of the Departmental structure was guided by the five strategic pillars of the Department in line with government priorities. The review and its objectives are driven, amongst others, by government targets set out in the NDP Vision 2030, Medium Term Strategic Framework, the National Water Resource Strategy, the National Water Act, the National Water Services Act, Presidential Directives and State of the Nations Address. The Department’s review of its services, capabilities and institutional configuration was informed by the following strategic pillars:
(i) National Water Resources Management;
(ii) Water Services Management;
(iii) Water Resources Infrastructure Management;Regulations, compliance and enforcement; and
(iv) Local service delivery (Provincial level support in the delivery of services).
Revised | stRategic Plan foR the fiscal yeaRs 2020/21 to 2024/25
14
The aforementioned initiative has provided the Department with an opportunity to align its Budget Structure with the Organisational structure as well as ensuring that the complete organisational structure is funded in line with the Medium Term Expenditure Framework. As part of the implementation plan, the Department is in process of matching and placing employees against the structure and prioritising the filling of vacant posts. Implementation of the new structure is planned for 1 April 2021.
Managing data and information
The use of Information and Communication Technology (ICT) has increasingly become fundamental in aiding the department to meet its strategic objectives. Employees have become more technology savvy, therefore demand better technology and faster networks at their respective work places in order to execute their functions. The department`s intentions is to continue with the modernisation of the ICT environment. To meet these requirements there is a need to partner with line of business so as to digitise their business processes. These will include water resource monitoring value chain to use data in order to provide insight which supports evidence based decision making.
The department’s objectives of modernization are to migrate the critical infrastructure to modern technologies such as cloud, while ensuring adherence to information security requirements. The benefit to be derived from this migration is that the department will be able to eliminate the legacy applications and redundant and non-value adding infrastructure while also reducing the cost of ownership for IT. This will be achieved while ensuring the high availability of the current systems to support the business operations of the Department
financial resources
Funding of the water sector comprises capital for infrastructure development, operation and maintenance (O&M) along the water supply chain, as well as funding for governance (plan, organize, lead and control) and effective management of water and sanitation services provisioning.
The financial health of the water and sanitation sector, however, is challenged by a number of factors including but not limited to a funding gap; high non-revenue water; degradation of existing asset value; tariffs not cost reflective.
The Department funds and implements new bulk water resource infrastructure from the fiscus or through the Trans Caledon Tunnel Authority (TCTA) and collects revenue from its raw water provisioning.
Raw water billing is substantial, but revenue collection is failing. Water pricing is based on the “user-pays” principle and tariffs from users provide a significant cash inflow to the sector with billing of raw water of about R 16 billion per annum to more than 85,000 users. Billing and collection is a major administrative and operating challenge with such a large user base
Revenue management within the Department is not optimal and not properly structured/geared to address the billing and collection challenges that exist.
Bulk raw water supply to domestic and industrial users (including mines and power stations) is often metered by the bulk user and the Department is not always directly involved, making meter reading problematic and erratic, impacting on billing and revenue collection.
Municipal accounts represent about 50% of the accumulated raw water debt at DWS, while water boards add another R1,7 billion, which is mostly also due to non-payment by local municipalities.

15
Revised | stRategic Plan foR the fiscal yeaRs 2020/21 to 2024/25
Irrigation water revenue is at 46% of billable amount. Irrigation water is poorly metered, and billing is at best described as “ad-hoc”. The large irrigation schemes have established water user associations (WUAs) and irrigation boards (IRBs), who assist the Department with operation and maintenance of water distribution to irrigable farm areas and selected towns and industries located along the canals. Currently, 47 of the 240 WUAs are also assisting the Department with revenue collection through signed “billing agent agreements”.
8.3 national prioritiesThe following are the water and sanitation sector priorities identified in the National Water and Sanitation Sector Master Plan.
Figure 5: Water and sanitation sector priorities(Source: National Water and Sanitation Master Plan Volume 1, 2018: 6)

16
9 Performance information
9.1 Measuring the impact
Impact statement Water resources that are protected, used, developed, conserved, managed and controlled in a manner that supports ecologically sustainable economic and social development that transforms access to water to redress racial imbalances
9.2 Measuring outcomes
outcome outcome indicator Baseline 2024/25 five year target
1 Efficient, effective and development orientated department
1.1 Percentage compliance with corporate governance regulatory prescripts
New indicator 100%
1.2 Annual Communications, Stakeholder Management and Partnership Programme implemented
133% 98%
1.3 Targeted procurement supporting SMMEs 82% 30%
1.3.1 Women New indicator 40%
1.3.2 Youth New indicator 30%
1.3.3 People with disabilities New indicator 7%
1.4 Percentage implementation of the financial recovery and turnaround plan
New indicator 100%
1.5 Percentage implementation of Annual International Relations Programme
Annual analysis on the implementation of the approved international relations programme
75%
2 Ecological infrastructure protected and restored
2.1 Number of river systems with water resources classes and determined resource quality objectives
11 4
P a R t c : MeasUrinG PerforMance

17
outcome outcome indicator Baseline 2024/25 five year target
2.2 Number of rivers in which the River Eco-status Monitoring Programme is implemented
71 83
2.3 Number of main stem rivers monitored for implementation of Resource Directed Measures (i.e. classification, resource quality objectives and the reserve) by 2025
New indicator 10
2.4 Waste water management plans developed and implemented
See details below See details below
2.4.1 Develop catchment strategies and plans
1 9
2.4.2 Implement catchment plans 0 9
2.4.3 Implement Waste Discharge Charge System (WDCS) country wide
Review of existing gap analysis on WDCS
9
3 Water demand reduced and water supply increased
3.1 Water conservation and water demand management strategies developed for water use sectors
New indicator 4
3.2 Water resource mix diversified See details below See details below
3.2.1 Reliance on surface water reduced 77% 70%
3.2.2 Groundwater use increased 9% 10%
3.2.3 Use of return flows increased 14% 16%
3.2.4 Desalination use increased 0.5% 3%
3.2.5 Use of acid mine drainage increased 0.1% 1%
3.3 Gauging stations developed, maintained and refurbished to improve management decisions on water quantity and quality
See details below See details below
3.3.1 Number of new water resource gauging stations/weirs constructed
0 existing gauging stations constructed
2
3.3.2 Number of existing water resource gauging stations/weirs refurbished
1 existing gauging station refurbished
1
3.4 National Digitised Integrated Water and Sanitation Monitoring System
See details below See details below
3.4.1 Number of water resources monitoring programmes reviewed and maintained
3 7
Revised | stRategic Plan foR the fiscal yeaRs 2020/21 to 2024/25
18
outcome outcome indicator Baseline 2024/25 five year target
3.4.2 Number of water and sanitation information systems maintained
6 6
4 Water and sanitation services managed effectively
4.1 Annual Municipal Strategic Self-Assessment (MuSSA) reports on water service authorities’ performance in providing water and sanitation services
Revised indicator6 5
5 Enhanced regulation of the water and sanitation sector
5.1 Green Drop report on wastewater systems’ compliance with regulatory requirements
2013 Green Drop report on wastewater systems ‘compliance with regulatory requirements
3
5.2 Blue Drop report on water supply systems’ compliance with regulatory requirements
2014 Blue Drop report on water supply systems’ compliance with regulatory requirements
2
5.3 Timeframe for processing water use license application reduced
3-12 months depending on complexity
90 days
5.4 Average number of water users in various sectors monitored for compliance with water use license per year
Revised indicator 396
6 Water redistributed for transformation
6.1 Effective and efficient institutions established
See details below See details below
6.1.1 Catchment management agencies established
2 Total of 6
6.1.2 Regional water utilities established 0 3
6.1.3 Water user associations established 85 41
6.2 Regulation for advancement of water allocation reform finalised
Validation and Verification of existing lawful use in 2 water management areas (WMAs)
Validation and Verification of existing lawful use in 5 water management areas (WMAs)
6
6 The previous unit of measurement has been revised from number of water service authorities to finalisation of the annual MuSSA reports
19
Revised | stRategic Plan foR the fiscal yeaRs 2020/21 to 2024/25
9.3 explanation of planned performance over the five year planning period
9.3.1 Programme 1: administrationProvide strategic leadership, management and support services to the Department. Develop and promote international relations on water resources with neighbouring countries.
The NDP prioritises the significant role of women, of the youth and of disabled persons and requires their mainstreaming in government’s planning. To contribute to these are cross-cutting priorities the Department plans to implement targeted procurement that supports Small Medium and Micro Enterprises (SMMEs) owned and/or controlled by women, youth and people with disabilities.
9.3.2 Programme 2: Water resource ManagementThe purpose of the programme is to ensure the protection, use, development, conservation, management and control of water resources in a sustainable manner for the benefit of all people and the environment. It provides for the development of a knowledge base for proper planning and informed decision making. It also provides for the development of effective policies and procedures as well as oversight of all water resource management institutions.
South Africa as a water scarce country is faced with the challenge of protecting water resources (i.e. quantity and quality) and the need to utilise water for social and economic development. Some of the country’s water resources are overused (e.g. polluted, the available water is already allocated and/or the surrounding environment is in a poor state). Other water resources are hardly used and the dependent environment is still in a natural state. However, South Africa has very few water resources that are still in a natural state and hence the requirement for different levels of protection.
The NWA provides decision-making tools to achieve a balance between protecting and utilising water resources to ensure that water is available for current and future human use. The classification system and the determination of the resource quality objectives are two mechanisms that are used to balance protection and development. The classification system states the acceptable impacts on the water resource and the unacceptable impacts in order to protect the resource. The class also states the amount of water that can be used from the water resource. The classes therefore allow for a grouping of water resources of those that are in a very good state and those that are in a very poor state. The resource quality objectives are an indication of the required level of protection for each water resource. The objectives therefore state the desired water quantity and quality, condition of the instream and riparian (river bank) habitat, as well as the condition of the aquatic animal and plant life.
The National Water and Sanitation Master Plan (NWSMP) indicates that by 2040, treated acid mine drainage and desalinated seawater will make a significant contribution to South Africa’s water mix, ground water usage will increase, and the over-reliance on surface water will reduce. Although some large surface water schemes are currently planned and developed, South Africa is approaching full utilisation of available surface water yields and is running out of suitable sites for developing large dams. The water re-use could guarantee availability of water supply (particularly for non-potable water uses); substantially lower water bill; supplement industry’s profitability by harvesting valuable resources contained in wastewater; and practice more environmentally sound water usage operations. Although the NWSMP indicates a planned reduction in the reliance of surface water, there will be a development of strategic water resources infrastructure projects (e.g. Lesotho Highlands Water Project phase 2, uMkhomazi Water Project, Mokolo Crocodile (West) Water Augmentation project etc.).
The recent water-related disasters (e.g. drought) have shown that water security is significantly impacted owing to the delays in implementing certain infrastructure projects as well as water demand management. Although many scholars suggest the diversification of the water mix as a way to respond to water insecurity; this would not be sufficient to balance supply and demand if water demand management is not implemented. Climate change is projected to increase the variability of rainfall throughout the country, and to reduce average rainfall. However, the total water supply requirements in the country will increase due to population and associated economic growth.
Revised | stRategic Plan foR the fiscal yeaRs 2020/21 to 2024/25
20
There is a need to optimise the water mix which is currently strongly dominated by surface water, with some groundwater and return flows. The delayed reaction of groundwater to climate change impacts and other stresses such as land-use change is one of the motivating factors for its increased use. In the face of climate change, groundwater, which will not experience the increased evaporation that will impact on surface water as temperatures increase, will become increasingly important. Artificial recharge of aquifers will be an important element of water management.
The NWA requires the establishment of national monitoring and information systems, for all aspects of water resources. There is a well-established network of monitoring points that provide for the collection of data and information to assess among other things water quantity and quality as well as water use. It further includes information on the ecological properties of water resources, both surface and groundwater. The development, maintenance and refurbishment of gauging weirs seeks to improve the coverage of rainfall and runoff gauging that has deteriorated and in some instances no longer functional.
Strong regulation is critical to achieve water security in South Africa, in terms of water quality (in rivers and taps). An incentive based regulation initiative pursuing excellence in wastewater service management was introduced to create a paradigm shift from minimum requirement compliance towards continued risk management. The Green Drop report reviews the WSAs compliance with the requirements for wastewater service management.
One of the main mechanisms of ensuring access to sufficient water, protection of the environment, and reallocation of water to advance the previously disadvantaged communities is to control water use. Water use registration regulates the manner in which water can be used. The 2017 regulations indicate that process of water use applications is undertaken within a period of 300 days of submitting such application. However, the Framework Agreement for the Jobs Summit requires a review of the turnaround time for considering water use license applications. This is essential in the effective implementation of the various projects particularly emerging farming enterprises in the agricultural sector.
The aim of setting of waste discharge standards is to ensure that the aquatic ecosystem will not be compromised. It also seeks to ensure that the quality will always comply with the requirements for basic human needs and other economic uses, bearing in mind that at least some basic treatment process will be applied before the water is used. It therefore supports the pricing strategy in differentiating between different types of water uses and water users as it affects the charges for different uses and users. It is one mechanism that the pricing strategy achieves equity.
Compliance, monitoring and enforcement (CME) is one of the priority focus areas identified in the second edition of the national Water Resources Strategy. CME is essential to support water allocation and water allocation reform (WAR) to ensure that water is used according to authorisation conditions, and by legally authorised water users.
The NWA provides for the establishment and transformation of institutions to assist in giving effect to the Department’s mandate. The enactment of the NWA provided for the establishment of the institutional framework for water resource management. To manage water resources at the catchment level, the NWA provides for the establishment of catchment management agencies (CMAs) that must ensure that all interested and affected stakeholders (including poor communities that have been disadvantaged and marginalised) participate in the decisions of the CMA. It also provides for the transformation of existing irrigation boards into Water User Associations that include emerging farmers.
9.3.3 Programme 3: Water services ManagementThe programme addresses the water and sanitation services provision across water and sanitation value chain in support to water service authorities. The integration of bulk and retail water services to improve the coherence of the sector and to realise economies of scale and efficient use of water. It also provides for the development of effective policies, strategies, guidelines and procedures and plans as well as oversight and regulation of all water service management institutions.
21
Revised | stRategic Plan foR the fiscal yeaRs 2020/21 to 2024/25
The Municipal Strategic Self-Assessment (MuSSA) is an annual review on the effectiveness of water services management within WSAs. The WSAs which may be a district, local, or metropolitan municipality undertake a structured self-evaluation of their current and expected future performance in providing water and sanitation services. The review is based on five “essence questions” for 18 “business health attributes” related to service delivery in general and water and sanitation services in particular. The MuSSA reports for each WSA provide an insight particularly on the strengths and vulnerabilities in terms of water and sanitation service delivery.
Water conservation and water demand management targets will be set for all water use sectors (namely agriculture, industries, mining, power generation, municipal and domestic water supply) to reduce total the water requirements from existing infrastructure. In addition, through the existing grant mechanisms, water conservation and water demand strategies would be implemented by supporting projects that will directly impact on bulk infrastructure requirements.
Domestic rainwater harvesting should be encouraged as a way of improving household food security, income savings and improved reliability of water supply, especially in rural areas. Although mostly only suitable as augmentation, it has been proven that, with good management, rainwater harvesting can yield more economical water than formal municipal water supply.
An incentive based regulation initiative pursuing excellence in drinking water quality was introduced to create a paradigm shift from minimum requirement compliance towards continued risk management. The Blue Drop report reviews the WSAs compliance with the requirements for drinking water quality management.
The Municipal Strategic Self-Assessment (MuSSA) is an annual review on the effectiveness of water services management within WSAs. The WSAs which may be a district, local, or metropolitan municipality undertake a structured self-evaluation of their current and expected future performance in providing water and sanitation services. The review is based on five “essence questions” for 18 “business health attributes” related to service delivery in general and water and sanitation services in particular. The MuSSA reports for each WSA provide an insight particularly on the strengths and vulnerabilities in terms of water and sanitation service delivery.
The NWA provides for the establishment and transformation of institutions to assist in giving effect to the Department’s mandate. The enactment of the Water Services Act, provided for the establishment of the institutional framework for water services.
The enactment of the Water Services Act, provided for the establishment of the institutional framework for water resource management and water services. The NDP indicates that “while local government will retain responsibility for ensuring adequate service provision in its areas, regional water utilities will provide services where municipalities have inadequate technical and financial capacities”7.
7 Source: National Development Plan 2030, National Planning Commission (2012: 178)

Revised | stRategic Plan foR the fiscal yeaRs 2020/21 to 2024/25
22
10 Key Risks
no outcome Key risk risk Mitigation
1 Efficient, effective and development orientated department
ICT may not be in a position to enable the department to effectively achieve its strategies
• MSP to be developed in line with the reviewed departmental 5-year strategic plan
• Ensure the provision of funding for the implementation of the MSP
Non-payment of debts by Water Boards/ Municipalities and other users
• Implementation of the Revenue Enhance Strategy• Water cuts to be implemented on defaulting
Municipalities • Participate in the Inter-Ministerial Sub-committee that
deals with water• Litigation against debtors
Leadership instability • Filling of critical posts e.g. CFO, CRO, DG posts. • Vetting of senior managers. • Finalisation of disciplinary action against identified
employees.• Implementation of the Fraud Policy and Response Plan• Ensure functioning of the Ethics Committee.• Review of the governance structures• Capacitation of RM, Internal Audit and Control (i.e.
vacancies and the adequate skills).
2 Ecological infrastructure protected and restored
Pollution of water resources
Non-compliance with drinking water quality standards
• Monitor non-compliant wastewater treatment systems.• Monitor non-compliant water supply systems.• Develop a strategy per Catchment Management Areas• Implement the polluter pay principles
3 Water demand reduced and water supply increased
Gaps in quality and quantity monitoring data and information
• Upgrade all supporting elements to restore Water Conservation and Water Demand Management, water use and resource monitoring to its required levels
Inability to guarantee sustainable maintenance of bulk raw water infrastructure
• Develop and implement the Resource Management Plans (RMP), Asset Management Strategy (AMS), Operations and Maintenance Plans (O & M P), Rehabilitation and Refurbishment Plans (R & R) and EPPs.
• Ensure there is a dedicated budget for Operations and Maintenance.
• Term contracts for operation and maintenance.• Replenish the Pumping Reserve
• Continuous monitoring of project expenditure through monthly reporting.
• Continuous monitoring of the payment of invoices on a continuous basis.
• Management committee meetings.• Full Implementation of the FIDPM.• Management and monitoring of VO’s and the National
Treasury Instruction note on variation orders-submission to National Treasury for approval in line with the threshold.
• Establishment of the Project Management Unit

23
Revised | stRategic Plan foR the fiscal yeaRs 2020/21 to 2024/25
no outcome Key risk risk Mitigation
• Alignment of APP, DMP and budget • Project Steering Committee to perform oversight role
over projects• Develop and implement a costing methodology• Centralisation of the processing of invoices
4 Water and Sanitation services managed effectively
Projects not completed on time and within budget
• Development of completed 5 year reliable water and sanitation service delivery implementation plans.
5 Enhanced regulation of the water and sanitation sector
Inadequate planning and project implementation resulting in unreliable water and sanitation services delivery
• Re-establish routine monitoring of resource water quality.
• Re-establish and maintain the Water Management System (WMS) for resource water quality management.
• Assess and report on resource water quality information.• Implement the Integrated Water Quality Management
Strategy (DWS Report 000/00/21715/5) with action plans to mitigate pollution from all water use sectors.
• Implement the Waste Discharge Charge System (WDCS) in all catchments.
• Develop, implement and maintain integrated water quality management plans for priority catchments.
• Increase the staff capacity
6 Water redistributed for transformation
Declining water quality in the water resources
• Further review of the delegation of authority for the approval of the water use license.
• Increase the staff establishment for the licensing component at head office.
• Establishment of a dedicated unit in the regions and to fill vacant positions.
• Review the licensing process • Review Regulations on Water authorisations
6 Water redistributed for transformation
• Delays in finalising water use authorisation applications within regulated times frames
• Further review of the delegation of authority for the approval of the water use license.
• Increase the staff establishment for the licensing component at head office.
• Establishment of a dedicated unit in the regions and to fill vacant positions.
• Review the licensing process • Review Regulations on Water authorisations
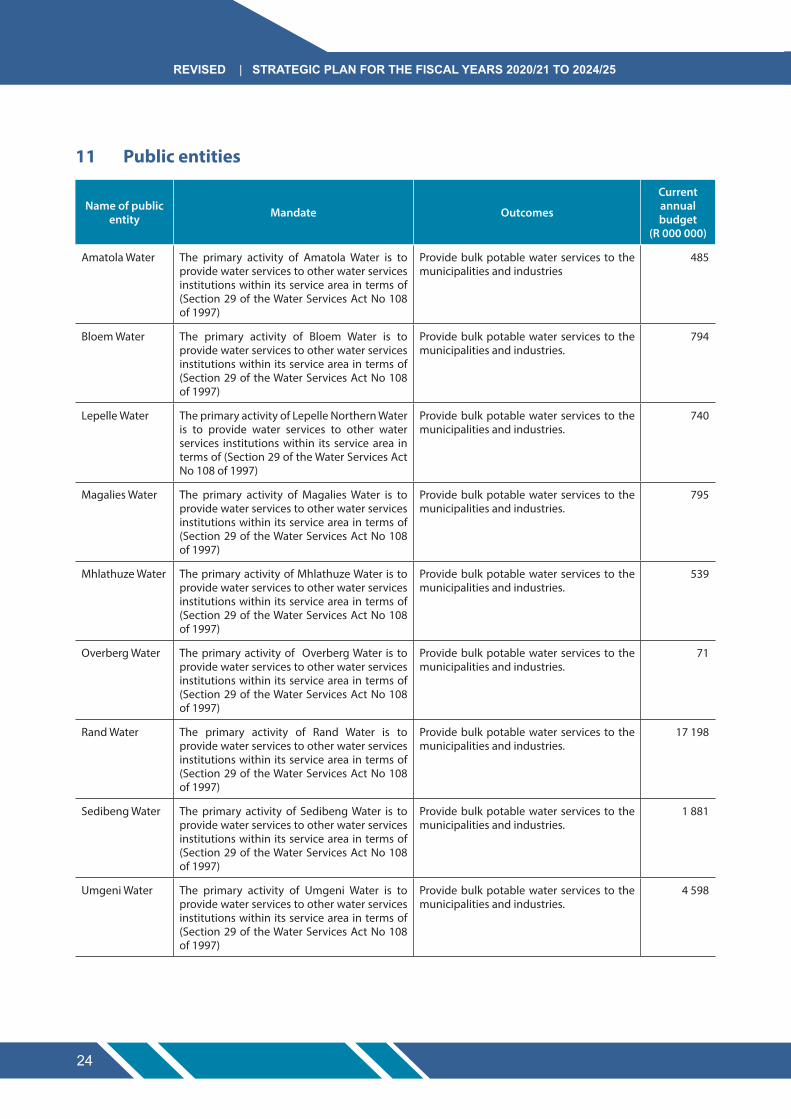
Revised | stRategic Plan foR the fiscal yeaRs 2020/21 to 2024/25
24
11 Public entities
name of public entity Mandate outcomes
current annual budget
(r 000 000)
Amatola Water The primary activity of Amatola Water is to provide water services to other water services institutions within its service area in terms of (Section 29 of the Water Services Act No 108 of 1997)
Provide bulk potable water services to the municipalities and industries
485
Bloem Water The primary activity of Bloem Water is to provide water services to other water services institutions within its service area in terms of (Section 29 of the Water Services Act No 108 of 1997)
Provide bulk potable water services to the municipalities and industries.
794
Lepelle Water The primary activity of Lepelle Northern Water is to provide water services to other water services institutions within its service area in terms of (Section 29 of the Water Services Act No 108 of 1997)
Provide bulk potable water services to the municipalities and industries.
740
Magalies Water The primary activity of Magalies Water is to provide water services to other water services institutions within its service area in terms of (Section 29 of the Water Services Act No 108 of 1997)
Provide bulk potable water services to the municipalities and industries.
795
Mhlathuze Water The primary activity of Mhlathuze Water is to provide water services to other water services institutions within its service area in terms of (Section 29 of the Water Services Act No 108 of 1997)
Provide bulk potable water services to the municipalities and industries.
539
Overberg Water The primary activity of Overberg Water is to provide water services to other water services institutions within its service area in terms of (Section 29 of the Water Services Act No 108 of 1997)
Provide bulk potable water services to the municipalities and industries.
71
Rand Water The primary activity of Rand Water is to provide water services to other water services institutions within its service area in terms of (Section 29 of the Water Services Act No 108 of 1997)
Provide bulk potable water services to the municipalities and industries.
17 198
Sedibeng Water The primary activity of Sedibeng Water is to provide water services to other water services institutions within its service area in terms of (Section 29 of the Water Services Act No 108 of 1997)
Provide bulk potable water services to the municipalities and industries.
1 881
Umgeni Water The primary activity of Umgeni Water is to provide water services to other water services institutions within its service area in terms of (Section 29 of the Water Services Act No 108 of 1997)
Provide bulk potable water services to the municipalities and industries.
4 598

25
Revised | stRategic Plan foR the fiscal yeaRs 2020/21 to 2024/25
name of public entity Mandate outcomes
current annual budget
(r 000 000)
TCTA It was established in 1986 as a state-owned entity specialising in project financing, implementation and liability management.
Development of bulk raw water infrastructure for the expanded supply of water to stimulate South Africa’s economic growth, and to simultaneously deal with the historical imbalances relating to access to water.
1 442
Water Research Commission (WRC)
WRC was established in 1971 to generate new knowledge and to promote the country’s water research.
The WRC aims to empower communities, inform policy and decision making, develop innovative products and services for economic growth, enhance human capital development and the water and science sectors, promote transformation and redress and to drive sustainable development solutions.
320
Inkomati-Usuthu CMA
Is a water management institution that was established in terms of section 78 of the National Water Act 36 of 1998 and is operational in the Inkomati- Usuthu Water Management Area
Investigate and advise interested persons on water resource management, co-ordinate related activities of water users and WMIs, promote co-ordination of implementation of any applicable development plan, promote community participation in water resource management
139
Breede-Gouritz CMA
Is a water management institution that was established in terms of section 78 of the National Water Act 36 of 1998 and is operational in the Breede-Gouritz Water Management Area
Investigate and advise interested persons on water resource management, co-ordinate related activities of water users and WMIs, promote co-ordination of implementation of any applicable development plan, promote community participation in water resource management
76

26
compliance with corporate governance regulatory prescripts
indicator title compliance with corporate governance regulatory prescripts
Definition This assesses the extent in which the department adhere to HR policies by maintaining the minimum vacancy rate, managing coaching and mentorship programmes and availability of information technology network system and assessing the effectiveness of safety and security of departmental facilities; for internal controls and operations to enhance good governance and effectives of the organisation.
Source of data Reports of human resource management and safety and security assessments; and information technology plan, risk management implementation plan and internal audit implementation plan.
Method of Calculation/ Assessment Produced reports
Assumptions Budget allocation; availability of electrical power, agility of SCM process, responsiveness and agility of outside role-players (i.e. SITA)
Disaggregation of Beneficiaries (where applicable)
• Target for women: N/A• Target for youth: N/A• Target for people with disabilities: N/A
Spatial Transformation (where applicable)
• Reflect on contribution to spatial transformation priorities: N/A• Reflect on the spatial impact area: N/A
Reporting cycle Annually
Desired performance Enhanced good governance, effective internal control and operations
Indicator responsibility Administration
P a R t d : technical inDicator DescriPtion ( tiD)

27
Percentage implementation of the 2024/2025 annual communications, stakeholder Management and Partnership Programme
indicator title Percentage implementation of the 2024/2025 annual communications, stakeholder Management and Partnership Programme
Definition This measures the extent in which the department assesses the implementation of its approved Annual Communications, Stakeholder Management and Partnership programme.
Source of data An annual Communications, Stakeholder Management and Partnership programme will be developed with reports on its implementation.
The document verification includes:
• The approved Annual Communications, Stakeholder Management and Partnership programme
• Reports on the implementation of the Annual Communications, Stakeholder Management and Partnership Programme
Method of Calculation/Assessment If the number of implemented Communications, Stakeholder Management and Partnership activities (i.e. media relations, content development, public relations, branding, awareness campaigns, events and conferencing, stakeholder management engagements and partnership activities) is given the value “x” and the total number of Communications, Stakeholder Management and Partnership activities in the approved communications programme (i.e. media relations, content development, public relations, branding, awareness campaigns, events and conferencing, stakeholder management engagements and partnership activities) is given the value “y” the formula is as follows:
γ%=x⁄y×100
Assumptions • The assumption is that Public Participation Programmes will contribute to changing the communities’ perception about service delivery by the department.
• The assumption is that Public Education Programmes will encourage behavioural change with regard to water conservation and water demand management as well as proper practices on health and hygiene.
• The assumption is that stakeholder engagement will improve the relationship between government/the department and stakeholders (communities, business, other government departments)
• The assumption is that social facilitation will ensure that communities at grassroots levels are well informed and empowered to participate in government departmental programmes and projects.
• The assumption is that when engaging affected councillors and local government around departmental projects, they have the best interest of the community at heart.
• The assumption is that internal activations will bring a change in staff perception and understanding of Government Programme of Action as well as achieving a buy in and their transformation into Departmental ambassadors. Adoption and willingness to implement departmental policies by staff.

Revised | stRategic Plan foR the fiscal yeaRs 2020/21 to 2024/25
28
indicator title Percentage implementation of the 2024/2025 annual communications, stakeholder Management and Partnership Programme
• A clear understanding of Departmental Corporate ID and programmes by members of the public through branding and marketing.
• The assumption of media briefings and media products is that communities will be empowered and in turn change their views about government which is often perceived as corrupt and not delivering services to the public.
• The assumption is that partnerships will be sustained to the benefit of our communities and all stakeholders.
Disaggregation of Beneficiaries (where applicable)
• Target for women: N/A• Target for youth: N/A• Target for people with disabilities: N/A
Spatial Transformation (where applicable)
• Reflect on contribution to spatial transformation priorities: N/A• Reflect on the spatial impact area: N/A
Reporting cycle Annually
Desired performance 98% implementation of the Annual Communications, Stakeholder Management and Partnership programme
Indicator responsibility Administration
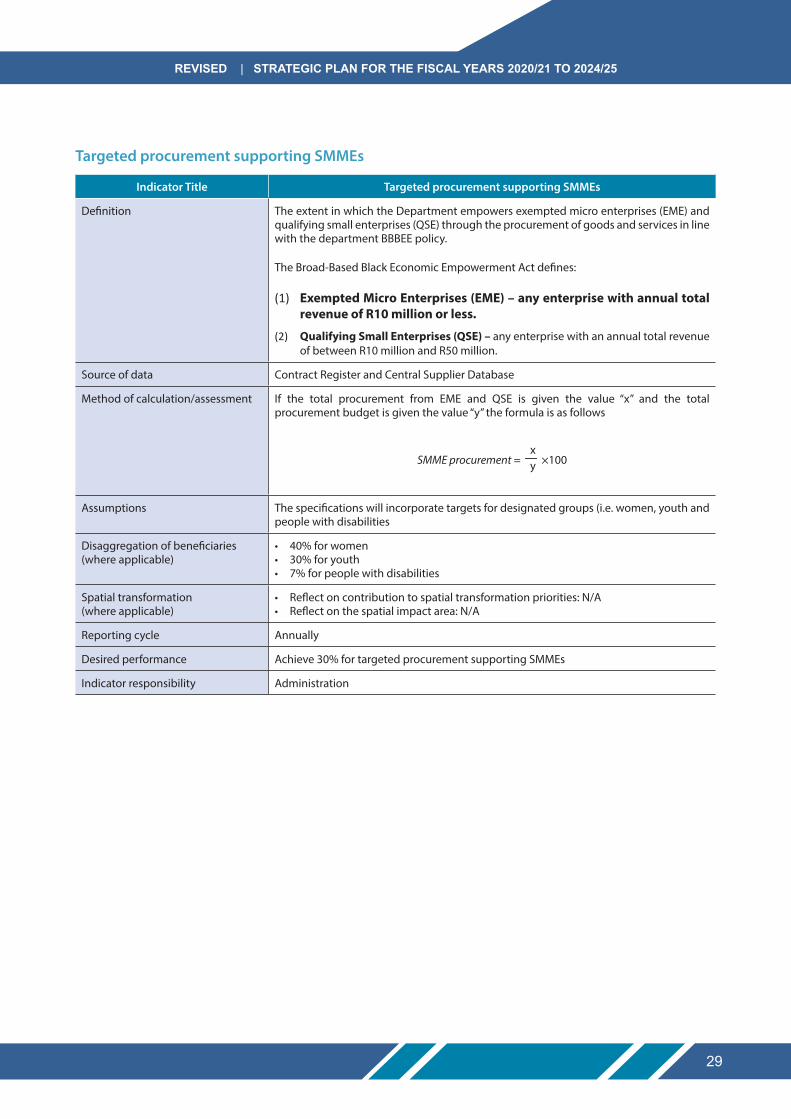
29
Revised | stRategic Plan foR the fiscal yeaRs 2020/21 to 2024/25
targeted procurement supporting sMMes
indicator title targeted procurement supporting sMMes
Definition The extent in which the Department empowers exempted micro enterprises (EME) and qualifying small enterprises (QSE) through the procurement of goods and services in line with the department BBBEE policy.
The Broad-Based Black Economic Empowerment Act defines:
(1) exempted Micro enterprises (eMe) – any enterprise with annual total revenue of R10 million or less.
(2) Qualifying small enterprises (Qse) – any enterprise with an annual total revenue of between R10 million and R50 million.
Source of data Contract Register and Central Supplier Database
Method of calculation/assessment If the total procurement from EME and QSE is given the value “x” and the total procurement budget is given the value “y” the formula is as follows
SMME procurement = x
—y
×100
Assumptions The specifications will incorporate targets for designated groups (i.e. women, youth and people with disabilities
Disaggregation of beneficiaries (where applicable)
• 40% for women• 30% for youth• 7% for people with disabilities
Spatial transformation (where applicable)
• Reflect on contribution to spatial transformation priorities: N/A• Reflect on the spatial impact area: N/A
Reporting cycle Annually
Desired performance Achieve 30% for targeted procurement supporting SMMEs
Indicator responsibility Administration
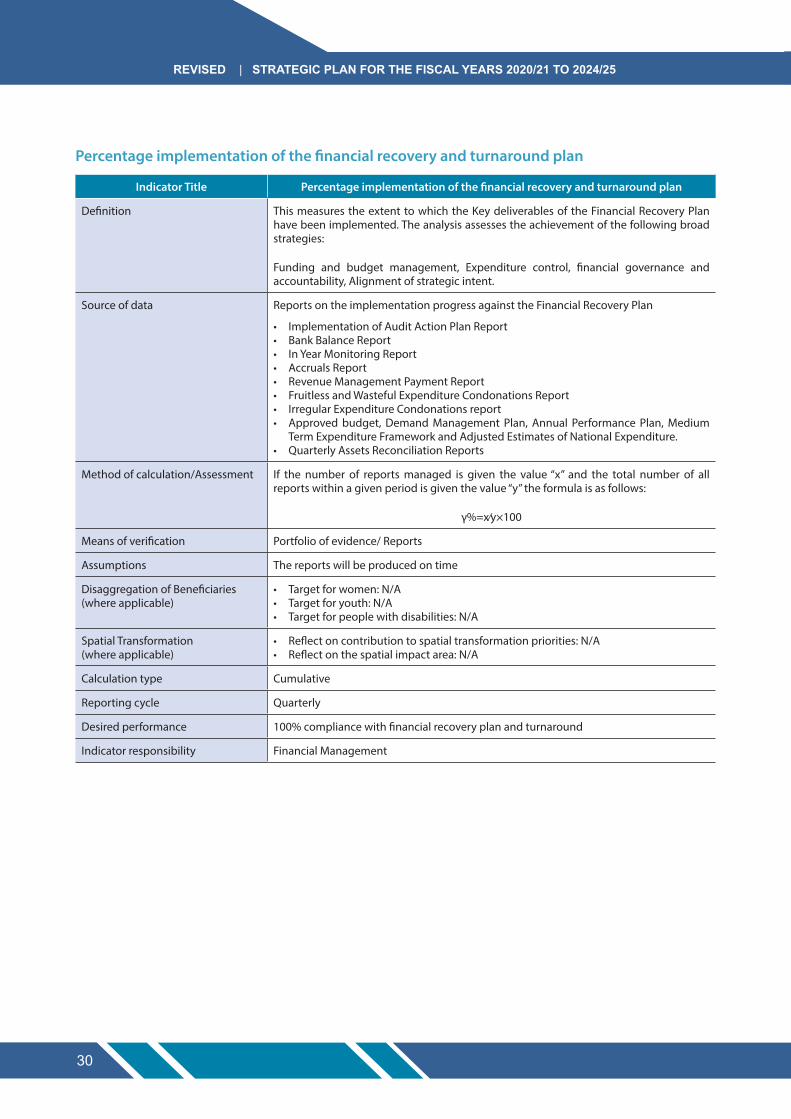
Revised | stRategic Plan foR the fiscal yeaRs 2020/21 to 2024/25
30
Percentage implementation of the financial recovery and turnaround plan
indicator title Percentage implementation of the financial recovery and turnaround plan
Definition This measures the extent to which the Key deliverables of the Financial Recovery Plan have been implemented. The analysis assesses the achievement of the following broad strategies:
Funding and budget management, Expenditure control, financial governance and accountability, Alignment of strategic intent.
Source of data Reports on the implementation progress against the Financial Recovery Plan
• Implementation of Audit Action Plan Report• Bank Balance Report• In Year Monitoring Report• Accruals Report• Revenue Management Payment Report• Fruitless and Wasteful Expenditure Condonations Report• Irregular Expenditure Condonations report• Approved budget, Demand Management Plan, Annual Performance Plan, Medium
Term Expenditure Framework and Adjusted Estimates of National Expenditure.• Quarterly Assets Reconciliation Reports
Method of calculation/Assessment If the number of reports managed is given the value “x” and the total number of all reports within a given period is given the value “y” the formula is as follows:
γ%=x⁄y×100
Means of verification Portfolio of evidence/ Reports
Assumptions The reports will be produced on time
Disaggregation of Beneficiaries (where applicable)
• Target for women: N/A• Target for youth: N/A• Target for people with disabilities: N/A
Spatial Transformation (where applicable)
• Reflect on contribution to spatial transformation priorities: N/A• Reflect on the spatial impact area: N/A
Calculation type Cumulative
Reporting cycle Quarterly
Desired performance 100% compliance with financial recovery plan and turnaround
Indicator responsibility Financial Management
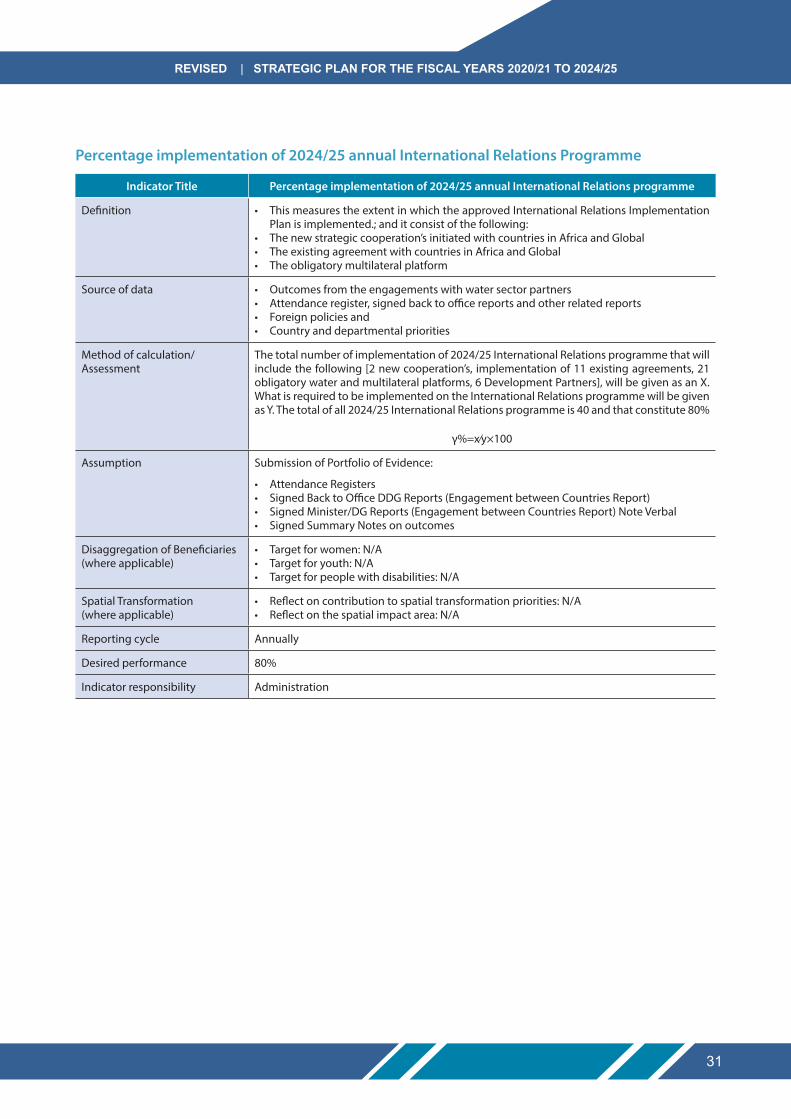
31
Revised | stRategic Plan foR the fiscal yeaRs 2020/21 to 2024/25
Percentage implementation of 2024/25 annual international relations Programme
indicator title Percentage implementation of 2024/25 annual international relations programme
Definition • This measures the extent in which the approved International Relations Implementation Plan is implemented.; and it consist of the following:
• The new strategic cooperation’s initiated with countries in Africa and Global• The existing agreement with countries in Africa and Global • The obligatory multilateral platform
Source of data • Outcomes from the engagements with water sector partners• Attendance register, signed back to office reports and other related reports • Foreign policies and• Country and departmental priorities
Method of calculation/Assessment
The total number of implementation of 2024/25 International Relations programme that will include the following [2 new cooperation’s, implementation of 11 existing agreements, 21 obligatory water and multilateral platforms, 6 Development Partners], will be given as an X. What is required to be implemented on the International Relations programme will be given as Y. The total of all 2024/25 International Relations programme is 40 and that constitute 80%
γ%=x⁄y×100
Assumption Submission of Portfolio of Evidence:
• Attendance Registers• Signed Back to Office DDG Reports (Engagement between Countries Report)• Signed Minister/DG Reports (Engagement between Countries Report) Note Verbal • Signed Summary Notes on outcomes
Disaggregation of Beneficiaries (where applicable)
• Target for women: N/A• Target for youth: N/A• Target for people with disabilities: N/A
Spatial Transformation (where applicable)
• Reflect on contribution to spatial transformation priorities: N/A• Reflect on the spatial impact area: N/A
Reporting cycle Annually
Desired performance 80%
Indicator responsibility Administration

Revised | stRategic Plan foR the fiscal yeaRs 2020/21 to 2024/25
32
number of river systems with water resource classes and determined resource quality objectives
indicator title number of river systems with water resource classes and determined resource quality objectives
Definition This measures the number of river systems with water resource classes and determined resource quality objectives that provide the status of water quality and quantity, the habitat and biota characteristics of the river.
Source of data Water resource databases supported by water resource classes gazettes and published resource quality objectives
Method of Calculation/ Assessment This will be the gazetted water resource classes and resource quality objectives for the following river system:
Assumptions Addressing concerns from stakeholder during the study may delay the finalisation of the study
Disaggregation of Beneficiaries (where applicable)
• Target for women: N/A• Target for youth: N/A• Target for people with disabilities: N/A
Spatial Transformation (where applicable
• Reflect on contribution to spatial transformation priorities: N/A• Reflect on the spatial impact area: N/A
Reporting cycle Annually
Desired performance 4
Indicator responsibility Water Resources Management
number of rivers in which the river eco-status Monitoring Programme is implemented
indicator title number of rivers in which the river eco-status Monitoring Programme is implemented
Definition This monitors the number of river systems in which the system’s ecological health is measured through the implementation of the River Eco-status Monitoring Programme
Source of data A database of river eco-status indicators is maintained.
Method of Calculation/ Assessment This will be the number of river systems as specified
Assumptions Head office and regional budgets as allocated will remain stable, manageable staff turnover, stable climatic conditions
Disaggregation of Beneficiaries (where applicable)
• Target for women: N/A• Target for youth: N/A• Target for people with disabilities: N/A
Spatial Transformation (where applicable)
• Reflect on contribution to spatial transformation priorities: N/A• Reflect on the spatial impact area: N/A
Reporting cycle Annually
Desired performance 81 river systems in which the River Eco-status Monitoring Programme is implemented
Indicator responsibility Water Resources Management

33
Revised | stRategic Plan foR the fiscal yeaRs 2020/21 to 2024/25
number of river systems monitored for the implementation of resource directed measures
indicator title number of river systems monitored for the implementation of resource directed measures
Definition This monitors the river systems in which resource directed measures have been implemented
Source of data Data will be obtained from the various monitoring systems in place of which the water management system will be the main source
Method of Calculation/ Assessment The river systems in which RDMs are implemented will be monitored and assessed against the desired water quality outcomes of the individual systems
Assumptions The budget from Head and Regional Offices as allocated will remain stable; manageable staff turn-over and stable climate conditions
Disaggregation of Beneficiaries (where applicable)
• Target for women: N/A• Target for youth: N/A• Target for people with disabilities: N/A
Spatial Transformation (where applicable)
• Reflect on contribution to spatial transformation priorities: N/A• Reflect on the spatial impact area: N/A
Reporting cycle Annually
Desired performance 10
Indicator responsibility Water Resources Management
number of catchment strategies and plans developed for mine water and wastewater treatment works
indicator title number of catchment strategies and plans developed for mine water and wastewater treatment works
Definition This will be the formulation of strategies to respond to mine water and/ or waste water (sewage) impacts in priority catchments
Source of data GIS; catchment assessments and Green Drop reports/ water quality assessments
Method of calculation / Assessment Mitigation strategies
Assumption Reliable mine data and water quality monitoring in place
Disaggregation of beneficiaries (where applicable
• Target for women: N/A• Target for youth: N/A• Target for people with disabilities: N/A
Spatial Transformation (where applicable)
• Reflect on contribution to spatial transformation priorities: N/A• Reflect on the spatial impact area: N/A
Reporting cycle Annually
Desired performance 9 catchment strategies and plans developed for mine water and wastewater treatment works
Indicator responsibility Water Resources Management
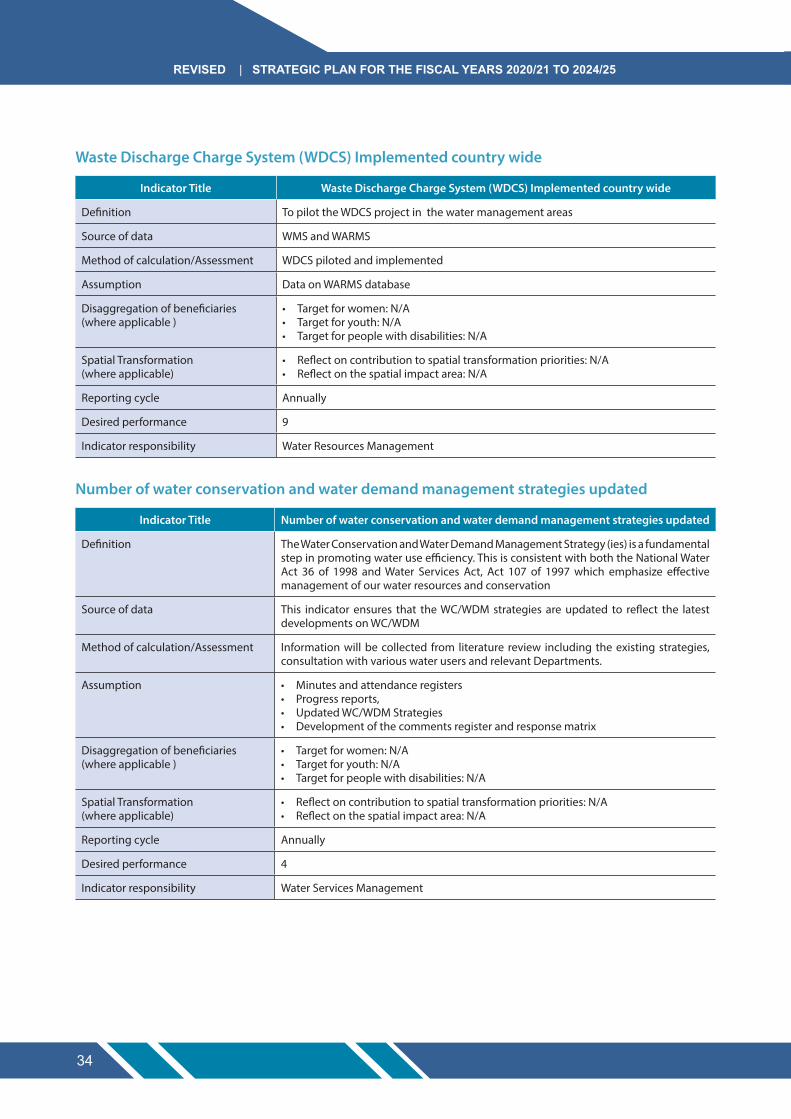
Revised | stRategic Plan foR the fiscal yeaRs 2020/21 to 2024/25
34
Waste Discharge charge system (WDcs) implemented country wide
indicator title Waste Discharge charge system (WDcs) implemented country wide
Definition To pilot the WDCS project in the water management areas
Source of data WMS and WARMS
Method of calculation/Assessment WDCS piloted and implemented
Assumption Data on WARMS database
Disaggregation of beneficiaries (where applicable )
• Target for women: N/A• Target for youth: N/A• Target for people with disabilities: N/A
Spatial Transformation (where applicable)
• Reflect on contribution to spatial transformation priorities: N/A• Reflect on the spatial impact area: N/A
Reporting cycle Annually
Desired performance 9
Indicator responsibility Water Resources Management
number of water conservation and water demand management strategies updated
indicator title number of water conservation and water demand management strategies updated
Definition The Water Conservation and Water Demand Management Strategy (ies) is a fundamental step in promoting water use efficiency. This is consistent with both the National Water Act 36 of 1998 and Water Services Act, Act 107 of 1997 which emphasize effective management of our water resources and conservation
Source of data This indicator ensures that the WC/WDM strategies are updated to reflect the latest developments on WC/WDM
Method of calculation/Assessment Information will be collected from literature review including the existing strategies, consultation with various water users and relevant Departments.
Assumption • Minutes and attendance registers• Progress reports, • Updated WC/WDM Strategies• Development of the comments register and response matrix
Disaggregation of beneficiaries (where applicable )
• Target for women: N/A• Target for youth: N/A• Target for people with disabilities: N/A
Spatial Transformation (where applicable)
• Reflect on contribution to spatial transformation priorities: N/A• Reflect on the spatial impact area: N/A
Reporting cycle Annually
Desired performance 4
Indicator responsibility Water Services Management
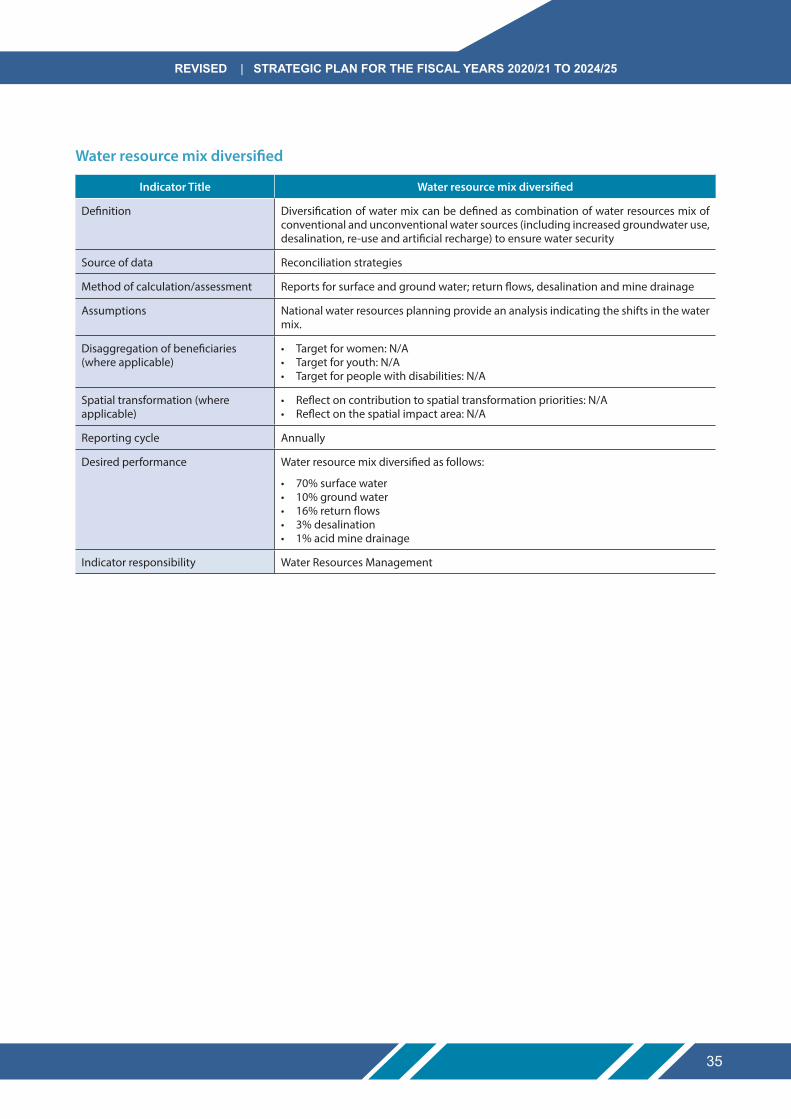
35
Revised | stRategic Plan foR the fiscal yeaRs 2020/21 to 2024/25
Water resource mix diversified
indicator title Water resource mix diversified
Definition Diversification of water mix can be defined as combination of water resources mix of conventional and unconventional water sources (including increased groundwater use, desalination, re-use and artificial recharge) to ensure water security
Source of data Reconciliation strategies
Method of calculation/assessment Reports for surface and ground water; return flows, desalination and mine drainage
Assumptions National water resources planning provide an analysis indicating the shifts in the water mix.
Disaggregation of beneficiaries (where applicable)
• Target for women: N/A• Target for youth: N/A• Target for people with disabilities: N/A
Spatial transformation (where applicable)
• Reflect on contribution to spatial transformation priorities: N/A• Reflect on the spatial impact area: N/A
Reporting cycle Annually
Desired performance Water resource mix diversified as follows:
• 70% surface water• 10% ground water• 16% return flows• 3% desalination• 1% acid mine drainage
Indicator responsibility Water Resources Management
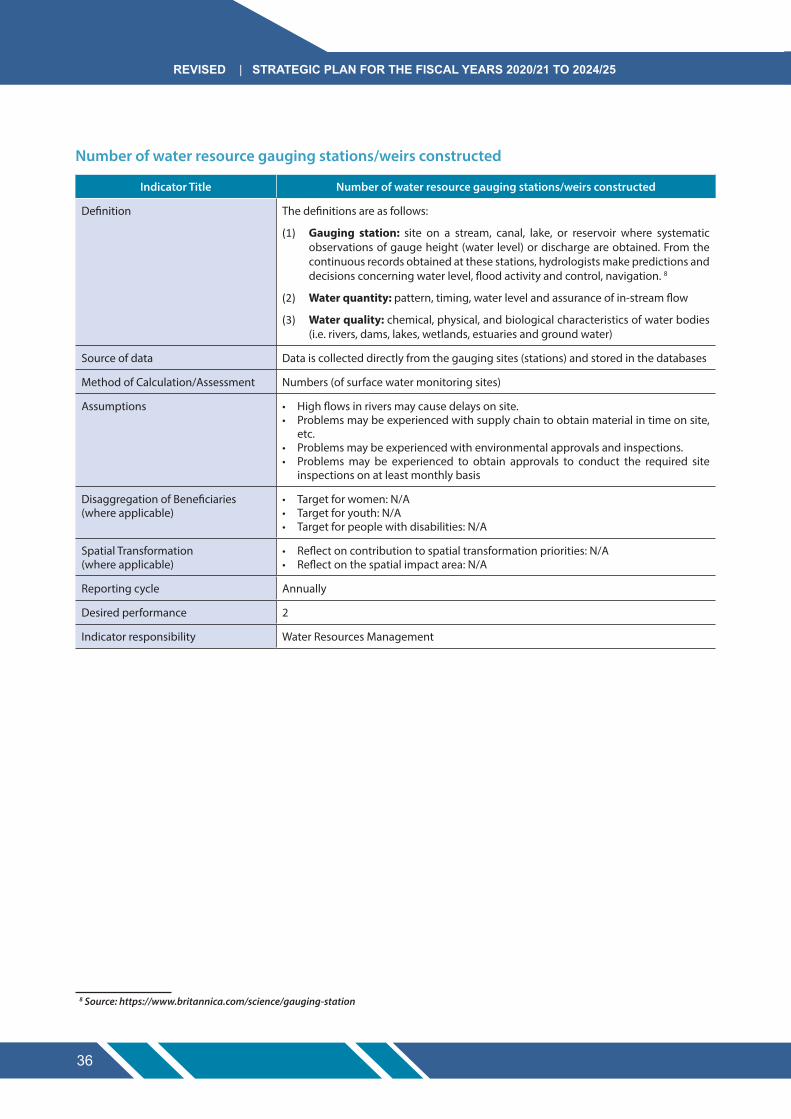
Revised | stRategic Plan foR the fiscal yeaRs 2020/21 to 2024/25
36
number of water resource gauging stations/weirs constructed
indicator title number of water resource gauging stations/weirs constructed
Definition The definitions are as follows:
(1) gauging station: site on a stream, canal, lake, or reservoir where systematic observations of gauge height (water level) or discharge are obtained. From the continuous records obtained at these stations, hydrologists make predictions and decisions concerning water level, flood activity and control, navigation. 8
(2) Water quantity: pattern, timing, water level and assurance of in-stream flow
(3) Water quality: chemical, physical, and biological characteristics of water bodies (i.e. rivers, dams, lakes, wetlands, estuaries and ground water)
Source of data Data is collected directly from the gauging sites (stations) and stored in the databases
Method of Calculation/Assessment Numbers (of surface water monitoring sites)
Assumptions • High flows in rivers may cause delays on site.• Problems may be experienced with supply chain to obtain material in time on site,
etc.• Problems may be experienced with environmental approvals and inspections.• Problems may be experienced to obtain approvals to conduct the required site
inspections on at least monthly basis
Disaggregation of Beneficiaries (where applicable)
• Target for women: N/A• Target for youth: N/A• Target for people with disabilities: N/A
Spatial Transformation (where applicable)
• Reflect on contribution to spatial transformation priorities: N/A• Reflect on the spatial impact area: N/A
Reporting cycle Annually
Desired performance 2
Indicator responsibility Water Resources Management
8 Source: https://www.britannica.com/science/gauging-station

37
Revised | stRategic Plan foR the fiscal yeaRs 2020/21 to 2024/25
number of water resource gauging stations/weirs refurbished
indicator title number of water resource gauging stations/weirs refurbished
Definition The definitions are as follows:
(1) gauging station: site on a stream, canal, lake, or reservoir where systematic observations of gauge height (water level) or discharge are obtained. From the continuous records obtained at these stations, hydrologists make predictions and decisions concerning water level, flood activity and control, navigation.
(2) Water quantity: pattern, timing, water level and assurance of instream flow
(3) Water quality: chemical, physical, and biological characteristics of water bodies (i.e. rivers, dams, lakes, wetlands, estuaries and ground water)
Source of data Data is collected directly from the gauging sites (stations) and stored in the databases
Method of Calculation/Assessment Numbers (of surface water monitoring sites)
Assumptions • High flows in rivers may cause delays on site.• Problems may be experienced with supply chain to obtain material in time on site, etc.• Problems may be experienced with environmental approvals and inspections.• Problems may be experienced to obtain approvals to conduct the required site
inspections on at least monthly basis
Disaggregation of Beneficiaries (where applicable)
• Target for women: N/A• Target for youth: N/A• Target for people with disabilities: N/A
Spatial Transformation (where applicable)
• Reflect on contribution to spatial transformation priorities: N/A• Reflect on the spatial impact area: N/A
Reporting cycle Annually
Desired performance 0
Indicator responsibility Water Resources Management
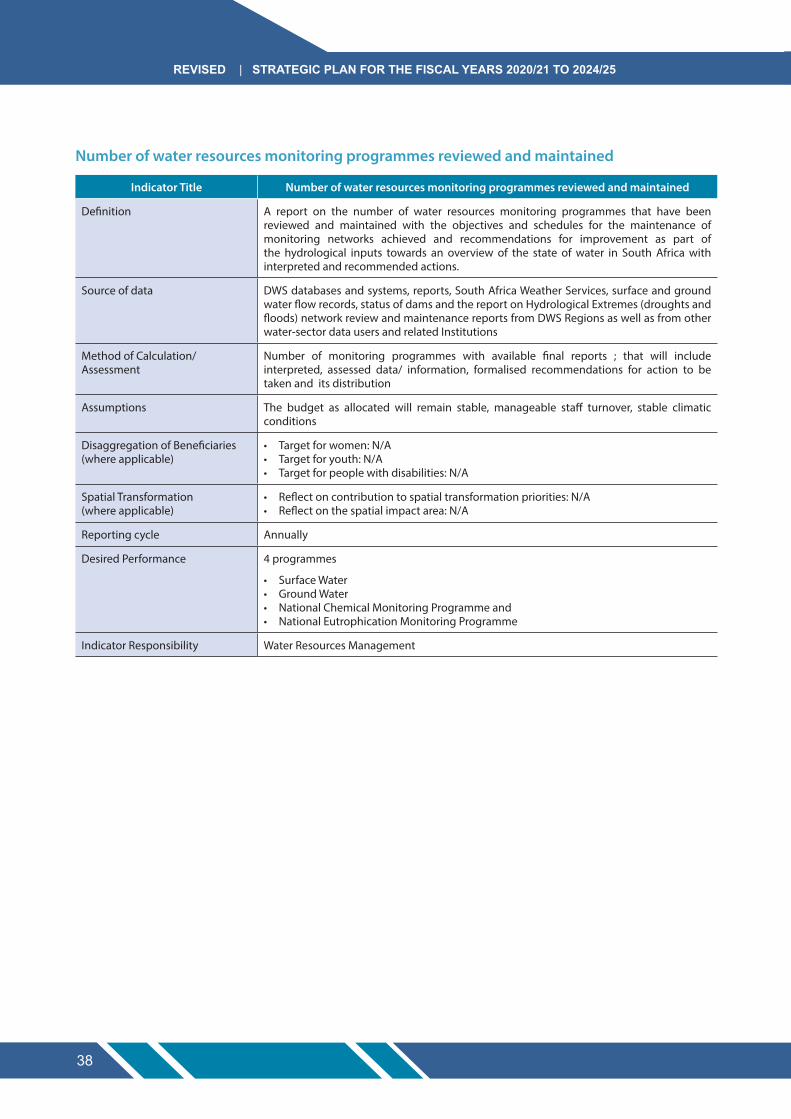
Revised | stRategic Plan foR the fiscal yeaRs 2020/21 to 2024/25
38
number of water resources monitoring programmes reviewed and maintained
indicator title number of water resources monitoring programmes reviewed and maintained
Definition A report on the number of water resources monitoring programmes that have been reviewed and maintained with the objectives and schedules for the maintenance of monitoring networks achieved and recommendations for improvement as part of the hydrological inputs towards an overview of the state of water in South Africa with interpreted and recommended actions.
Source of data DWS databases and systems, reports, South Africa Weather Services, surface and ground water flow records, status of dams and the report on Hydrological Extremes (droughts and floods) network review and maintenance reports from DWS Regions as well as from other water-sector data users and related Institutions
Method of Calculation/Assessment
Number of monitoring programmes with available final reports ; that will include interpreted, assessed data/ information, formalised recommendations for action to be taken and its distribution
Assumptions The budget as allocated will remain stable, manageable staff turnover, stable climatic conditions
Disaggregation of Beneficiaries (where applicable)
• Target for women: N/A• Target for youth: N/A• Target for people with disabilities: N/A
Spatial Transformation (where applicable)
• Reflect on contribution to spatial transformation priorities: N/A• Reflect on the spatial impact area: N/A
Reporting cycle Annually
Desired Performance 4 programmes
• Surface Water • Ground Water • National Chemical Monitoring Programme and • National Eutrophication Monitoring Programme
Indicator Responsibility Water Resources Management
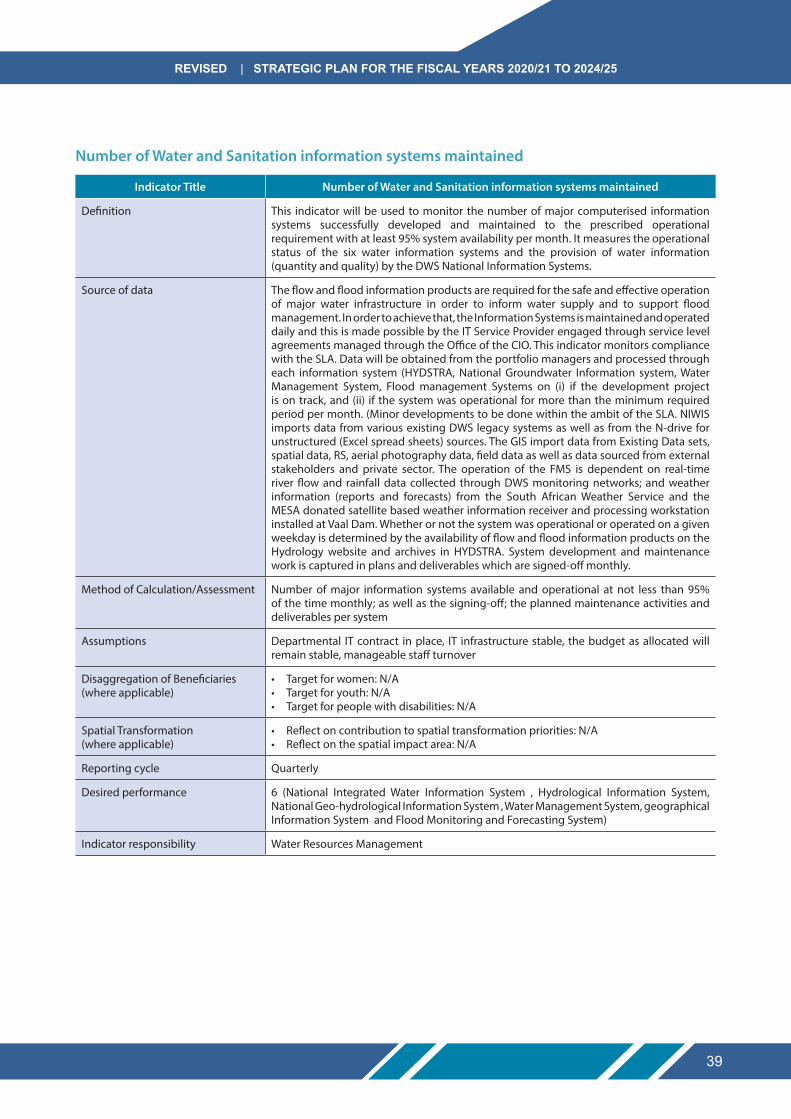
39
Revised | stRategic Plan foR the fiscal yeaRs 2020/21 to 2024/25
number of Water and sanitation information systems maintained
indicator title number of Water and sanitation information systems maintained
Definition This indicator will be used to monitor the number of major computerised information systems successfully developed and maintained to the prescribed operational requirement with at least 95% system availability per month. It measures the operational status of the six water information systems and the provision of water information (quantity and quality) by the DWS National Information Systems.
Source of data The flow and flood information products are required for the safe and effective operation of major water infrastructure in order to inform water supply and to support flood management. In order to achieve that, the Information Systems is maintained and operated daily and this is made possible by the IT Service Provider engaged through service level agreements managed through the Office of the CIO. This indicator monitors compliance with the SLA. Data will be obtained from the portfolio managers and processed through each information system (HYDSTRA, National Groundwater Information system, Water Management System, Flood management Systems on (i) if the development project is on track, and (ii) if the system was operational for more than the minimum required period per month. (Minor developments to be done within the ambit of the SLA. NIWIS imports data from various existing DWS legacy systems as well as from the N-drive for unstructured (Excel spread sheets) sources. The GIS import data from Existing Data sets, spatial data, RS, aerial photography data, field data as well as data sourced from external stakeholders and private sector. The operation of the FMS is dependent on real-time river flow and rainfall data collected through DWS monitoring networks; and weather information (reports and forecasts) from the South African Weather Service and the MESA donated satellite based weather information receiver and processing workstation installed at Vaal Dam. Whether or not the system was operational or operated on a given weekday is determined by the availability of flow and flood information products on the Hydrology website and archives in HYDSTRA. System development and maintenance work is captured in plans and deliverables which are signed-off monthly.
Method of Calculation/Assessment Number of major information systems available and operational at not less than 95% of the time monthly; as well as the signing-off; the planned maintenance activities and deliverables per system
Assumptions Departmental IT contract in place, IT infrastructure stable, the budget as allocated will remain stable, manageable staff turnover
Disaggregation of Beneficiaries (where applicable)
• Target for women: N/A• Target for youth: N/A• Target for people with disabilities: N/A
Spatial Transformation (where applicable)
• Reflect on contribution to spatial transformation priorities: N/A• Reflect on the spatial impact area: N/A
Reporting cycle Quarterly
Desired performance 6 (National Integrated Water Information System , Hydrological Information System, National Geo-hydrological Information System , Water Management System, geographical Information System and Flood Monitoring and Forecasting System)
Indicator responsibility Water Resources Management
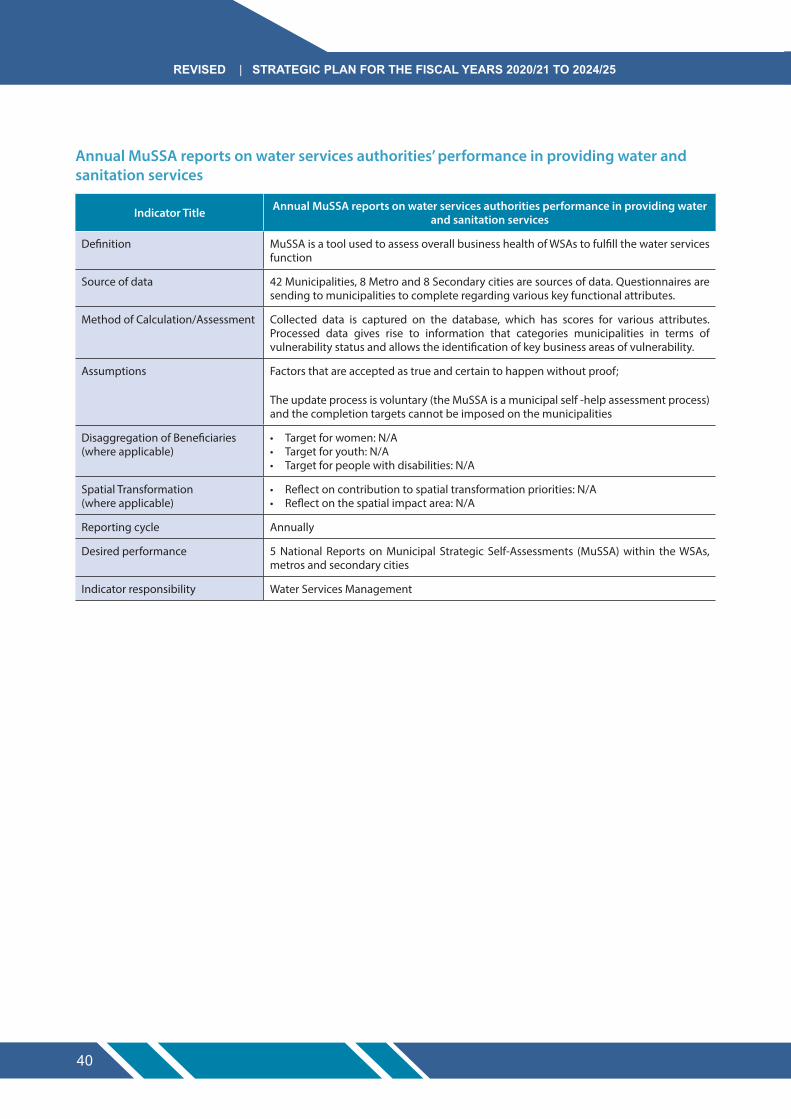
Revised | stRategic Plan foR the fiscal yeaRs 2020/21 to 2024/25
40
annual Mussa reports on water services authorities’ performance in providing water and sanitation services
indicator title annual Mussa reports on water services authorities performance in providing water and sanitation services
Definition MuSSA is a tool used to assess overall business health of WSAs to fulfill the water services function
Source of data 42 Municipalities, 8 Metro and 8 Secondary cities are sources of data. Questionnaires are sending to municipalities to complete regarding various key functional attributes.
Method of Calculation/Assessment Collected data is captured on the database, which has scores for various attributes. Processed data gives rise to information that categories municipalities in terms of vulnerability status and allows the identification of key business areas of vulnerability.
Assumptions Factors that are accepted as true and certain to happen without proof;
The update process is voluntary (the MuSSA is a municipal self -help assessment process) and the completion targets cannot be imposed on the municipalities
Disaggregation of Beneficiaries (where applicable)
• Target for women: N/A• Target for youth: N/A• Target for people with disabilities: N/A
Spatial Transformation (where applicable)
• Reflect on contribution to spatial transformation priorities: N/A• Reflect on the spatial impact area: N/A
Reporting cycle Annually
Desired performance 5 National Reports on Municipal Strategic Self-Assessments (MuSSA) within the WSAs, metros and secondary cities
Indicator responsibility Water Services Management

41
Revised | stRategic Plan foR the fiscal yeaRs 2020/21 to 2024/25
Green Drop report on wastewater systems’ compliance with regulatory requirements
indicator title Green Drop report on wastewater systems’ compliance with regulatory requirements
Definition The definitions are as follows:
(1) green drop: a certification incentive based regulation that seeks to identify and develop the required core competencies that if strengthened will gradually and sustainably improve the level of wastewater management in South Africa.
(2) Wastewater system: A system composed of gravity pipes, manholes, tanks, lift stations, control structures, and force mains that gather used water from residential and non-residential customers and convey the flow to the wastewater treatment plant.
Source of data Water services databases, water service authorities databases, accredited laboratories
Method of calculation/assessment A report containing the results of participating wastewater treatment systems
Assumptions Individual Green Drop reports for participating wastewater treatment systems would be accessible on the Department’s website.
Disaggregation of beneficiaries (where applicable)
• Target for women: N/A• Target for youth: N/A• Target for people with disabilities: N/A
Spatial transformation (where applicable)
• Reflect on contribution to spatial transformation priorities: N/A• Reflect on the spatial impact area: N/A
Reporting cycle Annually
Desired performance 3 Green Drop reports
Indicator responsibility Water Resources Management

Revised | stRategic Plan foR the fiscal yeaRs 2020/21 to 2024/25
42
Blue Drop report on water supply systems’ compliance with regulatory requirements
indicator title Blue Drop report on water supply systems’ compliance with regulatory requirements
Definition The definitions are as follows:
(1) Blue drop: a certification incentive-based regulation that seeks to safeguard the tap water quality management in South Africa.
(2) Water supply system: infrastructure for the collection, transmission, treatment, storage, and distribution of water for homes, commercial establishments, industry, and irrigation, as well as for such public needs.
Source of data Water services databases, water service authorities databases, accredited laboratories
Method of calculation/assessment A report containing the results of participating water supply systems
Assumptions Individual Blue Drop reports for participating water supply systems would be accessible on the Department’s website.
Disaggregation of beneficiaries (where applicable)
• Target for women: N/A• Target for youth: N/A• Target for people with disabilities: N/A
Spatial transformation (where applicable)
• Reflect on contribution to spatial transformation priorities: N/A• Reflect on the spatial impact area: N/A
Reporting cycle Annually
Desired performance 2 Blue Drop reports
Indicator responsibility Water Services Management
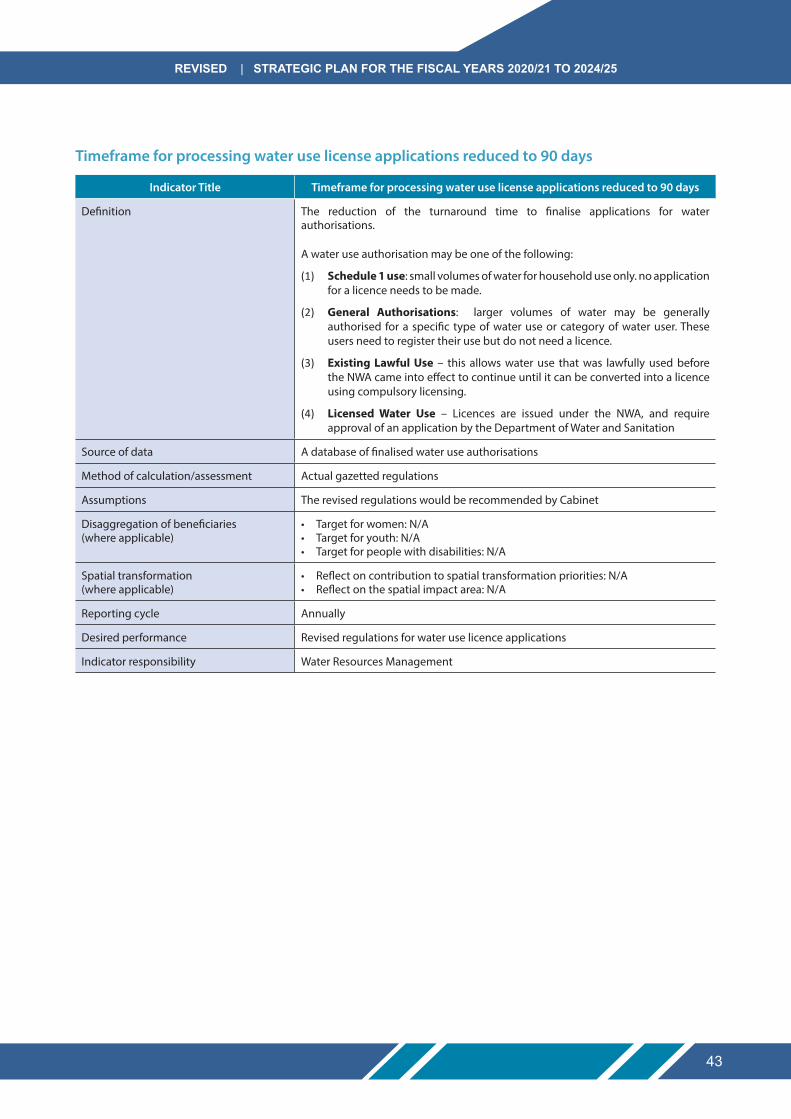
43
Revised | stRategic Plan foR the fiscal yeaRs 2020/21 to 2024/25
timeframe for processing water use license applications reduced to 90 days
indicator title timeframe for processing water use license applications reduced to 90 days
Definition The reduction of the turnaround time to finalise applications for water authorisations.
A water use authorisation may be one of the following:
(1) schedule 1 use: small volumes of water for household use only. no application for a licence needs to be made.
(2) general authorisations: larger volumes of water may be generally authorised for a specific type of water use or category of water user. These users need to register their use but do not need a licence.
(3) existing lawful Use – this allows water use that was lawfully used before the NWA came into effect to continue until it can be converted into a licence using compulsory licensing.
(4) licensed Water Use – Licences are issued under the NWA, and require approval of an application by the Department of Water and Sanitation
Source of data A database of finalised water use authorisations
Method of calculation/assessment Actual gazetted regulations
Assumptions The revised regulations would be recommended by Cabinet
Disaggregation of beneficiaries (where applicable)
• Target for women: N/A• Target for youth: N/A• Target for people with disabilities: N/A
Spatial transformation (where applicable)
• Reflect on contribution to spatial transformation priorities: N/A• Reflect on the spatial impact area: N/A
Reporting cycle Annually
Desired performance Revised regulations for water use licence applications
Indicator responsibility Water Resources Management

Revised | stRategic Plan foR the fiscal yeaRs 2020/21 to 2024/25
44
average number of water users in various sectors monitored for compliance with water use license per year
indicator title average number of water users in various sectors monitored for compliance with water use license per year
Definition The definitions are as follows:
(1) Water user: agriculture, bulk storage, forestry, industry, mining, power generation, recreation, water services
(2) various sector: public, mining, industrial, agricultural and forestry sectors
Source of data Water use entitlements and compliance inspection reports with score card completed and uploaded on NCIMS (National Compliance Information Management System).
Method of calculation/assessment This is the actual number of water users compliance evaluations conducted within the financial year.
Assumptions Though specific water users are targeted, operational needs may see deviations from water users selected for inspection (i.e. substitutions)
Disaggregation of beneficiaries (where applicable)
• Target for women: N/A• Target for youth: N/A• Target for people with disabilities: N/A
Spatial transformation (where applicable)
• Reflect on contribution to spatial transformation priorities: N/A• Reflect on the spatial impact area: N/A
Reporting cycle Annually
Desired performance Average of 396 water users in various sectors monitored for compliance with water use license per year
Indicator responsibility Water Resources Management
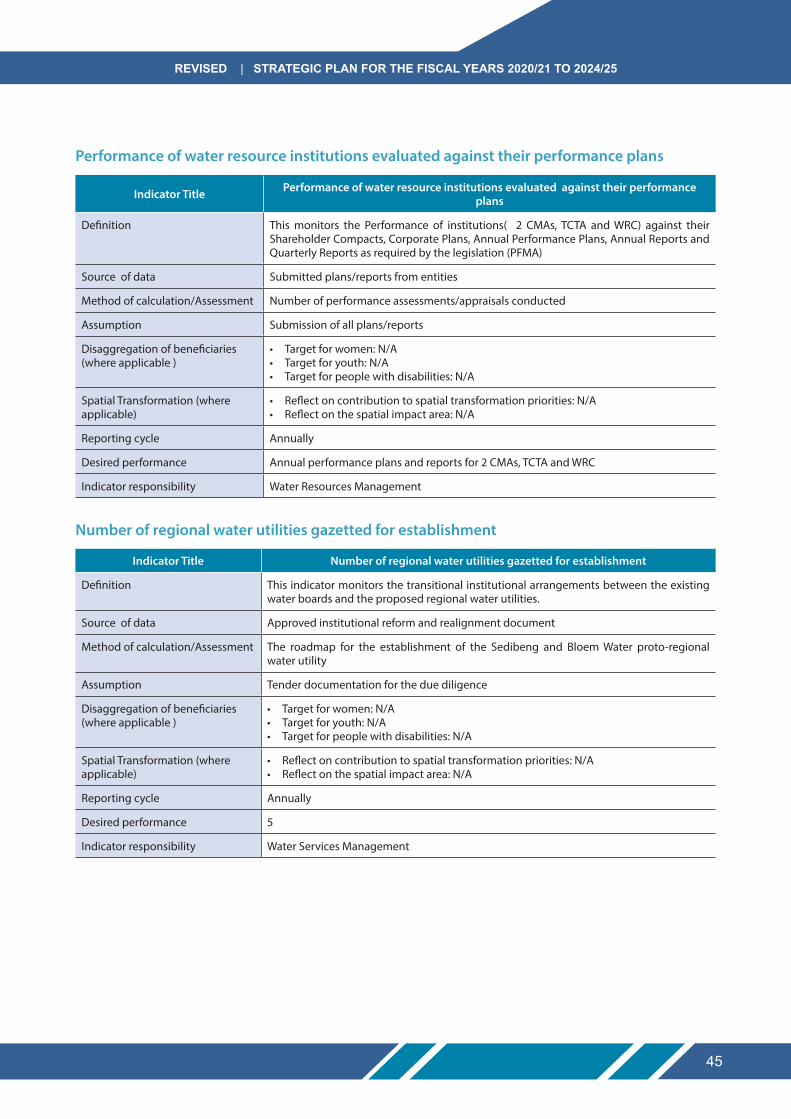
45
Revised | stRategic Plan foR the fiscal yeaRs 2020/21 to 2024/25
Performance of water resource institutions evaluated against their performance plans
indicator title Performance of water resource institutions evaluated against their performance plans
Definition This monitors the Performance of institutions( 2 CMAs, TCTA and WRC) against their Shareholder Compacts, Corporate Plans, Annual Performance Plans, Annual Reports and Quarterly Reports as required by the legislation (PFMA)
Source of data Submitted plans/reports from entities
Method of calculation/Assessment Number of performance assessments/appraisals conducted
Assumption Submission of all plans/reports
Disaggregation of beneficiaries (where applicable )
• Target for women: N/A• Target for youth: N/A• Target for people with disabilities: N/A
Spatial Transformation (where applicable)
• Reflect on contribution to spatial transformation priorities: N/A• Reflect on the spatial impact area: N/A
Reporting cycle Annually
Desired performance Annual performance plans and reports for 2 CMAs, TCTA and WRC
Indicator responsibility Water Resources Management
number of regional water utilities gazetted for establishment
indicator title number of regional water utilities gazetted for establishment
Definition This indicator monitors the transitional institutional arrangements between the existing water boards and the proposed regional water utilities.
Source of data Approved institutional reform and realignment document
Method of calculation/Assessment The roadmap for the establishment of the Sedibeng and Bloem Water proto-regional water utility
Assumption Tender documentation for the due diligence
Disaggregation of beneficiaries (where applicable )
• Target for women: N/A• Target for youth: N/A• Target for people with disabilities: N/A
Spatial Transformation (where applicable)
• Reflect on contribution to spatial transformation priorities: N/A• Reflect on the spatial impact area: N/A
Reporting cycle Annually
Desired performance 5
Indicator responsibility Water Services Management
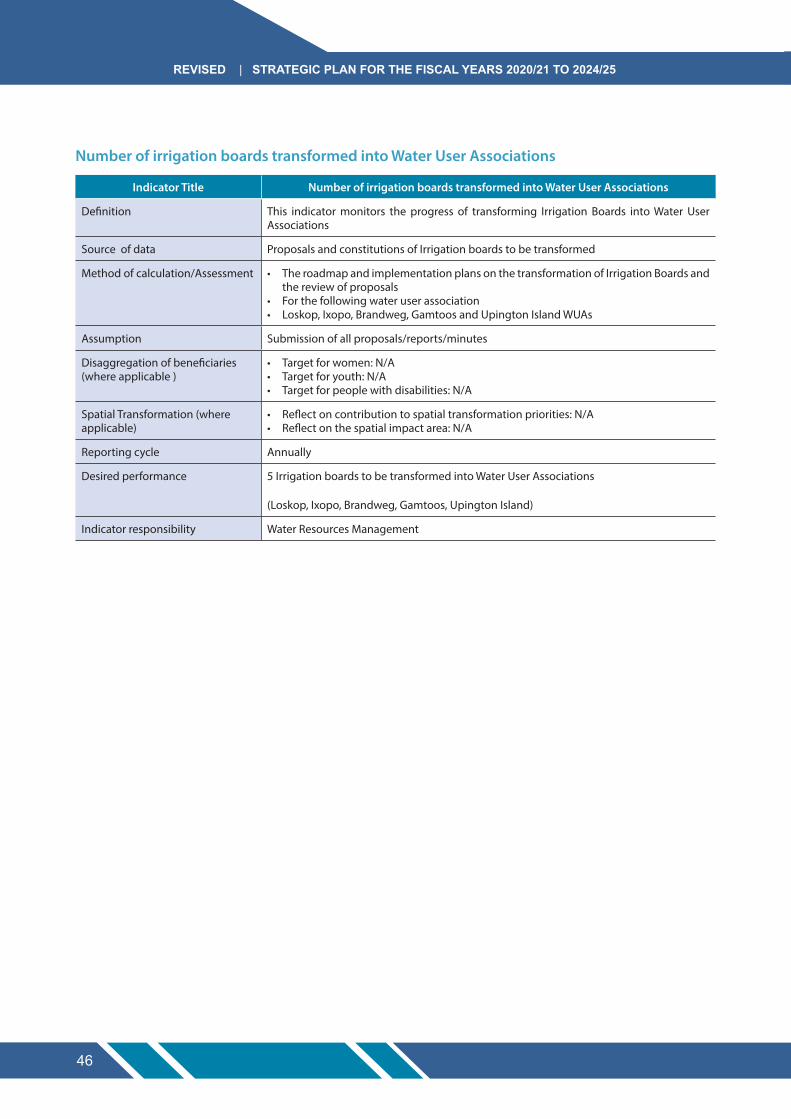
Revised | stRategic Plan foR the fiscal yeaRs 2020/21 to 2024/25
46
number of irrigation boards transformed into Water User associations
indicator title number of irrigation boards transformed into Water User associations
Definition This indicator monitors the progress of transforming Irrigation Boards into Water User Associations
Source of data Proposals and constitutions of Irrigation boards to be transformed
Method of calculation/Assessment • The roadmap and implementation plans on the transformation of Irrigation Boards and the review of proposals
• For the following water user association• Loskop, Ixopo, Brandweg, Gamtoos and Upington Island WUAs
Assumption Submission of all proposals/reports/minutes
Disaggregation of beneficiaries (where applicable )
• Target for women: N/A• Target for youth: N/A• Target for people with disabilities: N/A
Spatial Transformation (where applicable)
• Reflect on contribution to spatial transformation priorities: N/A• Reflect on the spatial impact area: N/A
Reporting cycle Annually
Desired performance 5 Irrigation boards to be transformed into Water User Associations
(Loskop, Ixopo, Brandweg, Gamtoos, Upington Island)
Indicator responsibility Water Resources Management

47
Revised | stRategic Plan foR the fiscal yeaRs 2020/21 to 2024/25
regulation for advancement of water allocation reform finalised
indicator title regulation for advancement of water allocation reform finalized
Definition This indicator monitors the process of developing the Regulations for the Water Allocation Reform.
Source of data National Water Act and National Water Resources Strategy II
Method of calculation/Assessment First Draft Regulations Approved for Internal Consultation; Internal Consultation Schedule and Minutes of Regional Consultations, Second Draft Regulations Approved for Public Comments and Government Gazette of the Draft Regulations for Public Comments.
Assumption National Water Act 36 of 1998 Reviewed/amended to enable the development of the Regulations
Disaggregation of beneficiaries (where applicable )
• Target for women: N/A• Target for youth: N/A• Target for people with disabilities: N/A
Spatial Transformation (where applicable)
• Reflect on contribution to spatial transformation priorities: N/A• Reflect on the spatial impact area: N/A
Reporting cycle Annually
Desired performance Validation and verification of existing lawful use in 7 WMAs
Indicator responsibility Water Resources Management
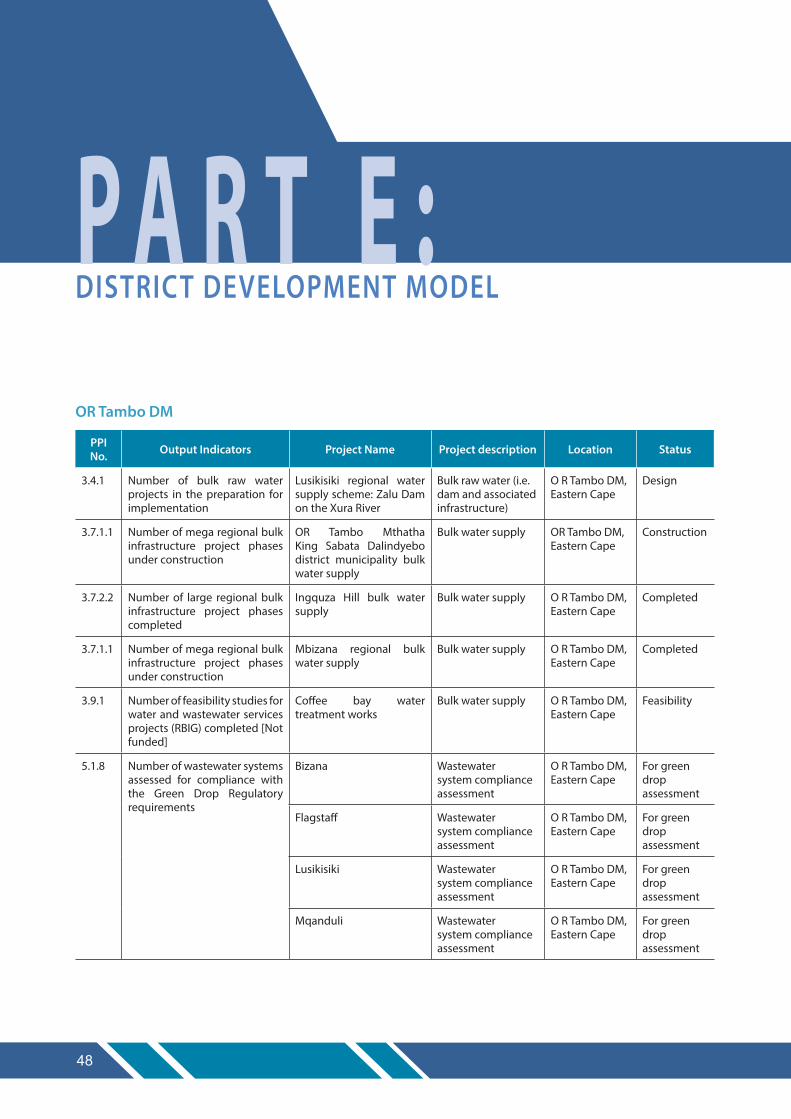
48
or tambo DM
PPi no. output indicators Project name Project description location status
3.4.1 Number of bulk raw water projects in the preparation for implementation
Lusikisiki regional water supply scheme: Zalu Dam on the Xura River
Bulk raw water (i.e. dam and associated infrastructure)
O R Tambo DM, Eastern Cape
Design
3.7.1.1 Number of mega regional bulk infrastructure project phases under construction
OR Tambo Mthatha King Sabata Dalindyebo district municipality bulk water supply
Bulk water supply OR Tambo DM, Eastern Cape
Construction
3.7.2.2 Number of large regional bulk infrastructure project phases completed
Ingquza Hill bulk water supply
Bulk water supply O R Tambo DM, Eastern Cape
Completed
3.7.1.1 Number of mega regional bulk infrastructure project phases under construction
Mbizana regional bulk water supply
Bulk water supply O R Tambo DM, Eastern Cape
Completed
3.9.1 Number of feasibility studies for water and wastewater services projects (RBIG) completed [Not funded]
Coffee bay water treatment works
Bulk water supply O R Tambo DM, Eastern Cape
Feasibility
5.1.8 Number of wastewater systems assessed for compliance with the Green Drop Regulatory requirements
Bizana Wastewater system compliance assessment
O R Tambo DM, Eastern Cape
For green drop assessment
Flagstaff Wastewater system compliance assessment
O R Tambo DM, Eastern Cape
For green drop assessment
Lusikisiki Wastewater system compliance assessment
O R Tambo DM, Eastern Cape
For green drop assessment
Mqanduli Wastewater system compliance assessment
O R Tambo DM, Eastern Cape
For green drop assessment
P a R t e : District DeVeloPMent MoDel

49
PPi no. output indicators Project name Project description location status
Mthatha Wastewater system compliance assessment
O R Tambo DM, Eastern Cape
For green drop assessment
Ngqeleni Wastewater system compliance assessment
O R Tambo DM, Eastern Cape
For green drop assessment
Ntabankulu Wastewater system compliance assessment
O R Tambo DM, Eastern Cape
For green drop assessment
Port St Johns Wastewater system compliance assessment
O R Tambo DM, Eastern Cape
For green drop assessment
Qumbu Wastewater system compliance assessment
O R Tambo DM, Eastern Cape
For green drop assessment
Tsolo Wastewater system compliance assessment
O R Tambo DM, Eastern Cape
For green drop assessment

Revised | stRategic Plan foR the fiscal yeaRs 2020/21 to 2024/25
50
alfred nzo DM
PPi no. output indicators Project name Project description location status
3.7.1.3 Number of small regional bulk infrastructure project phases under construction
Matatiela Bulk Water Supply
Bulk water supply Alfred Nzo DM, Eastern Cape
Construction
3.7.1.1 Number of mega regional bulk infrastructure project phases under construction
Greater Bizana Water Supply
Bulk water supply Alfred Nzo DM, Eastern Cape
Construction
3.9.1 Number of feasibility studies for water and wastewater services projects (RBIG)
Ntabankulu bulk water supply
Bulk water supply Alfred Nzo DM, Eastern Cape
Construction
3.7.2.2 Number of large regional bulk infrastructure project phases completed
Mount Ayliff bulk peri-urban water supply
Bulk water supply Alfred Nzo DM, Eastern Cape
Construction
3.4.2 Number of bulk raw water projects under construction
Mzimvubu Water Supply Bulk raw water (i.e. dam and associated infrastructure)
Alfred Nzo DM, Eastern Cape
Construction
5.1.8 Number of wastewater systems assessed for compliance with the Green Drop Regulatory requirements
Bizana Wastewater system compliance assessment
Alfred Nzo DM, Eastern Cape
For green drop assessment
Cedarville Wastewater system compliance assessment
Alfred Nzo DM, Eastern Cape
For green drop assessment
Matatiele Wastewater system compliance assessment
Alfred Nzo DM, Eastern Cape
For green drop assessment
Mount Ayliff Wastewater system compliance assessment
Alfred Nzo DM, Eastern Cape
For green drop assessment
Mount Frere Wastewater system compliance assessment
Alfred Nzo DM, Eastern Cape
For green drop assessment
Ntabankulu Wastewater system compliance assessment
Alfred Nzo DM, Eastern Cape
For green drop assessment
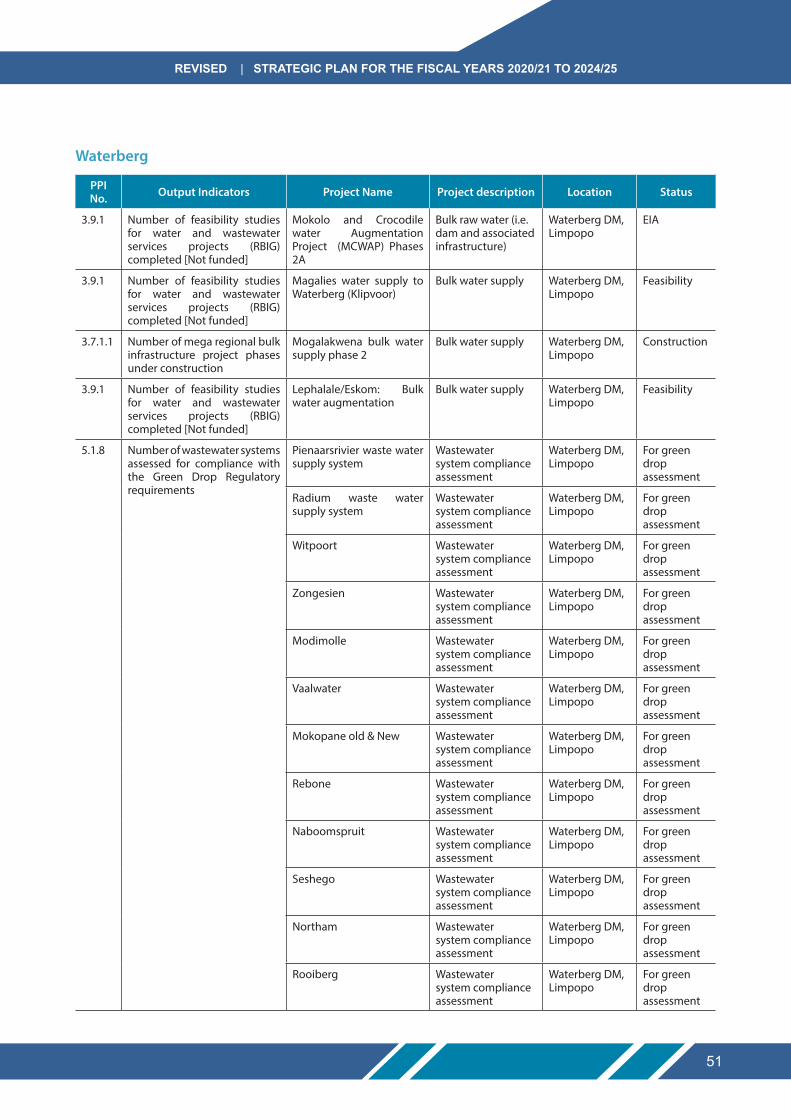
51
Revised | stRategic Plan foR the fiscal yeaRs 2020/21 to 2024/25
Waterberg
PPi no. output indicators Project name Project description location status
3.9.1 Number of feasibility studies for water and wastewater services projects (RBIG) completed [Not funded]
Mokolo and Crocodile water Augmentation Project (MCWAP) Phases 2A
Bulk raw water (i.e. dam and associated infrastructure)
Waterberg DM, Limpopo
EIA
3.9.1 Number of feasibility studies for water and wastewater services projects (RBIG) completed [Not funded]
Magalies water supply to Waterberg (Klipvoor)
Bulk water supply Waterberg DM, Limpopo
Feasibility
3.7.1.1 Number of mega regional bulk infrastructure project phases under construction
Mogalakwena bulk water supply phase 2
Bulk water supply Waterberg DM, Limpopo
Construction
3.9.1 Number of feasibility studies for water and wastewater services projects (RBIG) completed [Not funded]
Lephalale/Eskom: Bulk water augmentation
Bulk water supply Waterberg DM, Limpopo
Feasibility
5.1.8 Number of wastewater systems assessed for compliance with the Green Drop Regulatory requirements
Pienaarsrivier waste water supply system
Wastewater system compliance assessment
Waterberg DM, Limpopo
For green drop assessment
Radium waste water supply system
Wastewater system compliance assessment
Waterberg DM, Limpopo
For green drop assessment
Witpoort Wastewater system compliance assessment
Waterberg DM, Limpopo
For green drop assessment
Zongesien Wastewater system compliance assessment
Waterberg DM, Limpopo
For green drop assessment
Modimolle Wastewater system compliance assessment
Waterberg DM, Limpopo
For green drop assessment
Vaalwater Wastewater system compliance assessment
Waterberg DM, Limpopo
For green drop assessment
Mokopane old & New Wastewater system compliance assessment
Waterberg DM, Limpopo
For green drop assessment
Rebone Wastewater system compliance assessment
Waterberg DM, Limpopo
For green drop assessment
Naboomspruit Wastewater system compliance assessment
Waterberg DM, Limpopo
For green drop assessment
Seshego Wastewater system compliance assessment
Waterberg DM, Limpopo
For green drop assessment
Northam Wastewater system compliance assessment
Waterberg DM, Limpopo
For green drop assessment
Rooiberg Wastewater system compliance assessment
Waterberg DM, Limpopo
For green drop assessment

Revised | stRategic Plan foR the fiscal yeaRs 2020/21 to 2024/25
52
ethekwini
PPi no. output indicators Project name Project description location status
3.7.1.2 Number of large regional bulk infrastructure project phases under construction
Mdloti River development project: Raising of Hazel- mere Dam
Bulk raw water (i.e. dam and associated infrastructure)
iLembe DM, KwaZulu-Natal
Construction
5.1.8 Number of wastewater systems assessed for compliance with the Green Drop Regulatory requirements
Amanzimtoti Wastewater system compliance assessment
eThekwini Metropolitan Municipality
For green drop assessment
Cato Ridge Wastewater system compliance assessment
eThekwini Metropolitan Municipality
For green drop assessment
Central Wastewater system compliance assessment
eThekwini Metropolitan Municipality
For green drop assessment
Craigieburn Wastewater system compliance assessment
eThekwini Metropolitan Municipality
For green drop assessment
Dassenhoek Wastewater system compliance assessment
eThekwini Metropolitan Municipality
For green drop assessment
Fredville Wastewater system compliance assessment
eThekwini Metropolitan Municipality
For green drop assessment
Fredville Wastewater system compliance assessment
eThekwini Metropolitan Municipality
For green drop assessment
Genazzano Wastewater system compliance assessment
eThekwini Metropolitan Municipality
For green drop assessment
Glenwood Road Wastewater system compliance assessment
eThekwini Metropolitan Municipality
For green drop assessment
Hammarsdale Wastewater system compliance assessment
eThekwini Metropolitan Municipality
For green drop assessment
Hillcrest Wastewater system compliance assessment
eThekwini Metropolitan Municipality
For green drop assessment
Isipingo Wastewater system compliance assessment
eThekwini Metropolitan Municipality
For green drop assessment
Kingsburgh Wastewater system compliance assessment
eThekwini Metropolitan Municipality
For green drop assessment
KwaMashu Wastewater system compliance assessment
eThekwini Metropolitan Municipality
For green drop assessment

53
Revised | stRategic Plan foR the fiscal yeaRs 2020/21 to 2024/25
PPi no. output indicators Project name Project description location status
KwaNdengezi Wastewater system compliance assessment
eThekwini Metropolitan Municipality
For green drop assessment
Magabeni Wastewater system compliance assessment
eThekwini Metropolitan Municipality
For green drop assessment
Mpumalanga Wastewater system compliance assessment
eThekwini Metropolitan Municipality
For green drop assessment
New Germany Wastewater system compliance assessment
eThekwini Metropolitan Municipality
For green drop assessment
Northern Works Wastewater system compliance assessment
eThekwini Metropolitan Municipality
For green drop assessment
Phoenix Wastewater system compliance assessment
eThekwini Metropolitan Municipality
For green drop assessment
Southern Wastewater system compliance assessment
eThekwini Metropolitan Municipality
For green drop assessment
Tongaat Central Wastewater system compliance assessment
eThekwini Metropolitan Municipality
For green drop assessment
Umbilo Wastewater system compliance assessment
eThekwini Metropolitan Municipality
For green drop assessment
Umdloti Wastewater system compliance assessment
eThekwini Metropolitan Municipality
For green drop assessment
Umhlanga Wastewater system compliance assessment
eThekwini Metropolitan Municipality
For green drop assessment
Umhlatuzana Wastewater system compliance assessment
eThekwini Metropolitan Municipality
For green drop assessment
Umkomaas Wastewater system compliance assessment
eThekwini Metropolitan Municipality
For green drop assessment
Verulam Wastewater system compliance assessment
eThekwini Metropolitan Municipality
For green drop assessment

dePaRtMent OF WateR and sanitatiOn185 Francis Baard Street, PRETORIA, 0001, South Africa
Tel:+21123367500•www.dws.gov.za
RP83/2021
ISBN: 978-0-621-49255-2
Layout and design by the Department of Water and Sanitation: Communication Services