revised technical report - metro vancouver parking study revised technical report ... emerging...
TRANSCRIPT

The Metro Vancouver
Apartment Parking Study Revised Technical Report
Metro Vancouver
Metropolitan Planning, Environment, and Parks
September 2012

The Metro Vancouver Apartment Parking Study, Technical Report
September 2012 Page ii
Executive Summary Encouraging compact communities, sustainable transportation choices, and housing affordability are
well‐established objectives in Metro Vancouver’s Regional Growth Strategy and Regional Affordable
Housing Strategy. Parking is at the nexus of these objectives. Given that apartments represent over
one‐half of new housing starts in the region today and will remain so over the next three decades as the
population grows by one million people, having current and efficient parking requirements are critical to
the achievement of a sustainable region and livable neighbourhoods.
In metropolitan Vancouver, the cost of constructing on‐site structured parking can range from $20,000
to $45,000 per stall, plus maintenance costs. Ensuring the parking requirements match actual demand
can help reduce unnecessary housing development costs.
The Metro Vancouver Apartment Parking Study is one of the most comprehensive examinations of
apartment parking supply and demand conducted on a metropolitan area. Through the exploration of
emerging trends, review of past studies, discussions with municipal planners, engineers, and developers,
and completion of two regional surveys, a robust evidence base was established.
Current and Emerging Trends The amount of parking required in new apartment developments should reflect current and emerging
trends. Transit ridership continues to increase year after year, in part from improved transit service
levels and the expansion of TransLink’s Frequent Transit Network. Since 2008, the region has seen a
steady decline in the rate that additional cars and light trucks have been added to the region. High fuel
prices have become the norm. Carshare programs have exploded in popularity in recent years such that
the region has one of the most competitive markets in all of North America. Whether or not these
patterns will continue on to become long‐term trends, the evidence does point minimally to the need to
revisit basic assumptions about the supply and demand for apartment parking in the region.
Lessons from Studies in Other Cities Previous studies from other cities have consistently showed that parking supply in apartments close to
transit exceeds parking demand by a wide margin. A common limitation of some of these studies was
their singular focus on proximity to rail transit and a lack of comparative data on apartments located
further away from transit. The Metro Vancouver Apartment Parking Study addresses this significant
research gap by surveying apartment sites close to frequent bus corridors, SkyTrain stations, SeaBus
stations, and sites further away from the Frequent Transit Network.
Lessons from Current Practices Dialogues with apartment developers and municipal planners yielded insights about current practices in
the region. Most municipalities stipulate minimum parking requirements of at least 1.0 stall per
apartment unit. A few municipalities stipulate reduced residential parking requirements based on
proximity to transit. Most allow for reduced requirements for non‐market housing or seniors housing
sites. Minimum visitor parking requirements are typically set at 0.2 stall per apartment unit.

The Metro Vancouver Apartment Parking Study, Technical Report
September 2012 Page iii
Due to the diverse urban and transportation contexts of the region, there was no consensus from
apartment developers on whether current municipal minimum parking requirements are too high or too
low. Developers expressed reluctance to push for parking reduction variances for fear of risking the
viability or approval of a project. An increasing number of municipalities are interested in updating their
parking bylaws for new apartment developments close to existing and new SkyTrain stations.
Parking practices in the region were also compared to progressive practices in Calgary, Toronto,
Montreal, Seattle, Bellevue, Portland, and Denver. These jurisdictions offer interesting lessons for
metropolitan Vancouver:
Features Metropolitan Vancouver Other Cities: Calgary, Toronto, Montreal, Seattle,
Bellevue, Portland, Denver
Minimum parking requirements
Most municipalities stipulate minimum parking requirements of at least 1.0 stall per apartment unit.
All of the cities reviewed have minimum parking requirements of less than 1.0 for their urban cores. Seattle and Portland have 0 minimums in specific geographic areas.
Maximum parking requirements
Only City of Vancouver and UBC Point Grey Campus stipulate maximum parking requirements.
Calgary, Toronto, Montreal, Portland, Bellevue have parking maximums.
Geographic‐specific parking requirements
Most municipalities do not stipulate reduced parking requirements based on proximity to transit.
Calgary, Toronto, Montreal, Denver, Seattle, Bellevue, and Portland vary their parking requirements for specific geographic areas.
Consideration of frequent bus corridors
Planners and developers in the region typically recognize SkyTrain stations, but not frequent bus corridors, for marketing and potential parking reductions.
Toronto, Seattle, Portland, and Denver vary their parking requirements based on transit frequency, not technology.
Key Findings from the Parking Facility Survey and Household Survey The only reliable way to evaluate whether current parking requirements are providing a good match between supply and demand is through surveys of recently built and fully occupied apartment buildings in the region. In the Fall of 2011, Metro Vancouver carried out two regional surveys. In the Parking Facility Survey, the number of parking stalls and parked vehicles in 80 participating apartment sites were counted on weeknights. In the Household Survey, Metro Vancouver distributed surveys to apartment households to obtain more information about parking habits and preferences. Over 1,500 apartment households responded. The key findings were:
Residential parking supply in strata apartments generally exceed parking demand in the range of 18‐35 percent across the region.

The Metro Vancouver Apartment Parking Study, Technical Report
September 2012 Page iv
Residential parking demand is lower near TransLink’s Frequent Transit Network. For apartments near the Frequent Transit Network, the parking demand range is 0.89 – 1.06 vehicles per apartment unit; whereas for apartments further away from the Frequent Transit Network, the parking demand range is 1.10 – 1.25 vehicles per apartment unit.
Residential parking demand near Frequent Transit Network bus stops are similar to demand near SkyTrain/SeaBus stations, but the parking supply is higher.
Vehicle holdings and parking demand for apartment renters are much lower than for owners. This is
consistent with prior research. In purpose‐built market rental sites, the parking demand range is 0.58
‐ 0.72 vehicles per apartment unit.
Visitor parking supply may be over supplied. Observed parking demand rates were below 0.1 stall per apartment unit, compared to the typical municipal requirement of 0.2 visitor stall per apartment unit.
Participation in carshare programs was highest in Vancouver (16% of surveyed households) and UBC (15% of surveyed households), where carshare programs predominantly operate. Households with carshare memberships have fewer vehicles than do non‐members.
Proximity to transit was consistently cited by over half of the households surveyed as one of the top
three factors when choosing their current home.
Apartment Parking Near the Frequent Transit Network Updating parking requirements for apartments is not something that is regularly completed for various
reasons. What the study provides is objective evidence that communities and developers can use when
determining the appropriate amount of parking in new apartment developments.
The greatest opportunities for change are new apartment sites near the Frequent Transit Network
(generally within 400 metres of a frequent bus stop and/or within 800 metres of a SkyTrain station).
High density communities with a robust network of frequent transit services offer the best opportunities
to put these findings into practice. For suburban communities lacking the coverage of frequent transit
services, these opportunities may be treated as long‐term goals.
In the long‐run, the benefits of taking action will be more efficient and livable neighbourhoods in Urban
Centres and Frequent Transit Development Areas, improvements to housing affordability and housing
choice, and greater use of sustainable transportation choices.
1. Treat On‐Site and Street Parking as a System: A more holistic approach toward parking supply and
parking demand management for new apartment projects is warranted. Attention should be paid to the
availability, type, and relative permanence of street parking (e.g., free, paid, permit‐only, and/or time‐
limited) and surrounded land uses, in association with any reductions in on‐site parking requirements.
2. Encourage Parking Supply to Match Demand Near the Frequent Transit Network: Parking
requirements should be set based on actual or expected demands with further reductions based on
transportation demand management measures or other site‐specific conditions.

The Metro Vancouver Apartment Parking Study, Technical Report
September 2012 Page v
3. Encourage Parking Unbundling/Opt‐Out: Selling parking stalls separate from apartments or allowing
consumers to opt out of a parking stall will increase choice, and provide the opportunity for consumers
without cars to realize some modest improvement in affordability.
4. Encourage Rental Apartments Near the Frequent Transit Network: Apartment renters generally
have lower parking demands than do owners, and living close to the Frequent Transit Network provides
an opportunity to be less reliant on a private vehicle. For these reasons, it makes sense to encourage
development of more rental apartment units close to the Frequent Transit Network.
5. Encourage Expansion of Carshare Programs where Feasible: Municipalities and developers should
encourage carshare providers to expand beyond current operating boundaries to such places as
emerging Urban Centres and Frequent Transit Development Areas in suburban areas where practical
and feasible.
6. Consider Allowing Amendments to Parking Supply after Pre‐Sales: It is often only after apartment
pre‐sales that developers will have better data to support modifications to residential parking supply.
By adapting municipal processes to accommodate amendments before construction, the parking
efficiency of new apartment developments can be improved.
7. Conduct Regular Post‐Occupancy Surveys: Regular and frequent post‐occupancy surveys of
apartment projects should be conducted to provide timely information on parking demand in recently‐
built and fully‐occupied apartment developments. Industry groups, such as the Urban Development
Institute and the Urban Land Institutes, should contribute resources to these research efforts and
support widespread dissemination of the findings.
8. Coordinating Frequent Transit Network Expansion: Uncertainties in the future stop or station
locations of the Frequent Transit Network, and the staging of expansion, can be addressed effectively
through enhanced collaboration and information sharing between TransLink and municipal partners.
Next Steps Metro Vancouver’s role is largely leadership through research, outreach, collaboration, and advocacy.
Metro Vancouver is committed to working with stakeholders to advance the study findings. A summary
booklet accompanies this technical report to be shared with a wider audience. Metro Vancouver will
continue to cooperate with partners to further the implementation of the Regional Growth Strategy and
Regional Affordable Housing Strategy, including matters related to parking, through timely research of
best practices and empirical data collection and analysis.
The Metro Vancouver Apartment Parking Study, Technical Report
September 2012 Page vi
Acknowledgements Metro Vancouver would like to thank all individuals and parties who provided their expert opinions and
feedback. They include the development community who provided insight about the apartment
development design, approval and marketing process; and, municipal planners and engineers who
provided information about current parking practices, challenges, and opportunities. The study could
not have been completed without the cooperation of apartment property managers who provided
building contact information, the condominium strata organizations that granted access to their
parkades, and the individuals who took time to complete the household surveys.
Acuere Consulting Ltd., led by Clark Lim (principal) and Ken Tseng (survey manager) provided solid and
dependable technical assistance in the design and implementation of the surveys. Special thanks go to
the Insurance Corporation of British Columbia for providing timely data on vehicle licensing, BC Hydro
and the City of New Westminster for providing electricity consumption data, and to municipal and
TransLink staff for their feedback.
All analyses presented in this technical report were prepared by Metro Vancouver staff.
Metro Vancouver Project Staff
Raymond Kan (Project Manager/Senior Regional Planner)
Eric Aderneck (Senior Regional Planner)
Janet Kreda (Senior Housing Planner)
Meredith Seeton (2011 summer technical assistant)
Rosa Shih (2012 summer technical assistant)
The Metro Vancouver Apartment Parking Study, Technical Report
September 2012 Page vii
Table of Contents
EXECUTIVE SUMMARY ......................................................................................................................... II
1 INTRODUCTION AND STUDY SCOPE ................................................................................................ 1
2 DEFINING THE PROBLEM AND OPPORTUNITIES .............................................................................. 3
2.1 Regional Planning and Policy Context ......................................................................................... 3
2.2 The Costs of Constructing Parking .............................................................................................. 5
2.3 Current and Emerging Trends ..................................................................................................... 6
2.3.1 Emergence of TransLink’s Frequent Transit Network ................................................... 6
2.3.2 Emerging Patterns in Actively Licensed Vehicles .......................................................... 8
2.3.3 Emergence of Carsharing Programs .............................................................................. 9
3 REVIEW OF PARKING STUDIES FROM OTHER JURISDICTIONS ........................................................ 11
3.1 City of Vancouver ...................................................................................................................... 11
3.2 City of Toronto .......................................................................................................................... 12
3.3 East Bay (San Francisco Bay Area) and Metro Portland ............................................................ 13
3.4 Santa Clara County (San Francisco Bay Area) ........................................................................... 14
3.5 Evidence from Europe ............................................................................................................... 15
3.6 Key Lessons Learned ................................................................................................................. 16
4 REVIEW OF CURRENT MUNICIPAL PRACTICES ............................................................................... 17
4.1 Apartment Parking Requirements in Metropolitan Vancouver ................................................ 17
4.1.1 Minimum Parking Requirements ................................................................................ 17
4.1.2 Allowable Parking Reductions ..................................................................................... 19
4.2 Apartment Parking Requirements in Other Cities .................................................................... 21
4.2.1 Residential Parking Requirements .............................................................................. 21
4.2.2 Visitor Parking Requirements ..................................................................................... 22
4.2.3 Key Lessons Learned ................................................................................................... 22
5 KEY INFORMANT INTERVIEWS ...................................................................................................... 24
5.1 Apartment Developers .............................................................................................................. 24
5.1.1 Reasonableness of Municipal Residential Parking Requirements .............................. 24
5.1.2 Lowering Minimum Parking Requirements ................................................................ 25
5.1.3 Visitor Parking ............................................................................................................. 25
5.1.4 Proximity to Transit ..................................................................................................... 26
5.1.5 Construction Cost per Parking Stall ............................................................................. 26
5.1.6 Determining Market Acceptability .............................................................................. 26
5.1.7 Transportation Demand Management Measures ...................................................... 27
5.1.8 Financing Considerations ............................................................................................ 28

The Metro Vancouver Apartment Parking Study, Technical Report
September 2012 Page viii
5.2 Municipal Planners in Metropolitan Vancouver ....................................................................... 28
5.3 Interview with City of Seattle Planning Staff ............................................................................ 29
5.4 City of Toronto Interviews ........................................................................................................ 30
5.5 Key Lessons Learned ................................................................................................................. 31
6 PARKING FACILITY SURVEY AND HOUSEHOLD SURVEY METHODOLOGY ....................................... 32
6.1 Site Selection ............................................................................................................................. 32
6.2 Parking Facility Survey Design and Conduct ............................................................................. 37
6.3 Adjustments for Survey Time and Building Occupancy ............................................................ 37
6.4 Household Survey Design and Conduct .................................................................................... 38
6.5 Survey Returns .......................................................................................................................... 39
7 PARKING FACILITY SURVEY AND HOUSEHOLD SURVEY DATA ANALYSIS ........................................ 44
7.1 Residential Parking Supply and Demand by Building Tenure ................................................... 44
7.2 Residential Parking Supply and Demand by the Frequent Transit Network............................. 46
7.3 Residential Parking Supply and Demand by Strata and Number of Bedrooms ........................ 47
7.4 Residential Parking Supply and Demand by Strata, Number of Bedrooms, and the Frequent
Transit Network .................................................................................................................................. 47
7.5 Market Rental Sites ................................................................................................................... 49
7.6 Visitor Parking Supply and Demand .......................................................................................... 50
7.7 Carshare Participation ............................................................................................................... 52
7.8 Location Preferences ................................................................................................................ 54
7.9 Willingness to Forego Parking Stalls ......................................................................................... 55
7.10 Key Lessons Learned ................................................................................................................. 55
8 APARTMENT PARKING NEAR THE FREQUENT TRANSIT NETWORK ................................................ 57
8.1.1 Treat On‐Site and Street Parking as a System ............................................................. 57
8.1.2 Encourage Parking Supply to Match Demand Near the Frequent Transit Network ... 57
8.1.3 Encourage Parking Unbundling/Opt‐Out .................................................................... 58
8.1.4 Encourage Rental Apartments Near the Frequent Transit Network .......................... 58
8.1.5 Encourage Expansion of Carshare Programs where Feasible ..................................... 58
8.1.6 Consider Allowing Amendments to Parking Supply after Pre‐Sales ........................... 59
8.1.7 Conduct Regular Post‐Occupancy Parking Surveys ..................................................... 59
8.1.8 Coordinate Frequent Transit Network Expansion ...................................................... 59
8.2 Other Opportunities to Improve the Efficiency and Livability of Neighbourhoods .................. 60
8.2.1 Provision of Shared Parking ........................................................................................ 60
8.2.2 Provision of Unassigned Parking Stalls ........................................................................ 60
8.2.3 Provision of Good Access and Design for Visitor Parking ........................................... 60
8.2.4 Provision of Appropriate Parking Stall Sizes ............................................................... 61
8.2.5 Provision of Secured and Appropriately‐Sized Bicycle Parking Facilities .................... 61

The Metro Vancouver Apartment Parking Study, Technical Report
September 2012 Page ix
8.2.6 Balancing Affordability and Payments‐in‐Lieu‐of‐Parking .......................................... 61
9 FUTURE STUDIES .......................................................................................................................... 62
9.1 Extensions to the Metro Vancouver Apartment Parking Study ................................................ 62
9.2 New Areas for Investigation ...................................................................................................... 63
10 CONCLUSIONS AND NEXT STEPS ................................................................................................... 64
APPENDIX 1: BIBLIOGRAPHY ............................................................................................................. 65
APPENDIX 2: LIST OF DEVELOPERS INTERVIEWED .............................................................................. 67
APPENDIX 3: INTERVIEW QUESTIONS WITH DEVELOPERS .................................................................. 68
APPENDIX 4: MUNICIPAL QUESTIONNAIRE ........................................................................................ 69
APPENDIX 5: CITY OF SEATTLE MULTIFAMILY PARKING CODE............................................................ 70
APPENDIX 6: SURVEY SITES ............................................................................................................... 71
APPENDIX 7: HOUSEHOLD SURVEY INSTRUMENT .............................................................................. 76
APPENDIX 8: PARKING DEMAND IN URBAN CENTRES (HOUSEHOLD SURVEY RESPONSES) ................. 78
APPENDIX 9: REGULAR TRANSIT USAGE AND PARKING DEMAND (HOUSEHOLD SURVEY RESPONSES)79
APPENDIX 10: BICYCLE OWNERSHIP AND STORAGE (HOUSEHOLD SURVEY RESPONSES) .................... 80
APPENDIX 11: APARTMENT FLOORSPACE V. VEHICLES PER HOUSEHOLD (HOUSEHOLD SURVEY
RESPONSES) ....................................................................................................................................... 82
APPENDIX 12: DEMOGRAPHICS AND PARKING DEMAND (HOUSEHOLD SURVEY RESPONSES) ............ 84
APPENDIX 13: STREET PARKING (HOUSEHOLD SURVEY RESPONSES) .................................................. 85
APPENDIX 14: FREQUENCY OF FACTORS CITED AS MOST IMPORTANT FOR CHOOSING CURRENT HOME
(HOUSEHOLD SURVEY RESPONSES) .................................................................................................... 86

The Metro Vancouver Apartment Parking Study, Technical Report
September 2012 Page 1
1 Introduction and Study Scope Apartment parking is an issue at the intersection of sustainable urban development,
transportation planning, and housing affordability. In metropolitan Vancouver, there is a
growing interest by municipalities to refine the amount of parking required in new apartment
developments, in particular near transit, and to require facilities or other measures that support
other modes of travel, such as bicycle storage facilities and carshare vehicles and stalls.
Residential developers also have a financial stake in providing the appropriate amount of
parking to meet the expectations of potential customers. Excessive parking can result in the
inefficient use of land or resources, and unnecessarily add to the cost of housing and reduce
affordability. Conversely, insufficient parking can lead to developer concerns about
unmarketable units and neighbourhood dissatisfaction over vehicles spilling onto surrounding
streets.
Getting parking “right” will have long lasting benefits for municipalities, developers, and
residents. The region has been and will continue to move towards compact communities served
by transit. Therefore, the issue of parking is only going to become more critical to the
transportation efficiency and livability of neighbourhoods and communities, and to the overall
sustainability of the region.
The challenge of addressing apartment parking has been the lack of evidence to support or
refute existing regulations and practices. Hence, in consultation with the Metro Vancouver
Regional Planning Advisory Committee (RPAC), Major Roads and Transportation Advisory
Committee (MRTAC), and the RPAC Housing Subcommittee, Metro Vancouver undertook a
region‐wide apartment parking study in 2011. The objectives were to:
1. Establish a reliable evidence base on apartment parking supply and demand;
2. Provide guidance that municipalities and other stakeholders can use when determining
parking supply in new apartment developments and other related apartment parking
management strategies, with an emphasis on sites close to TransLink’s Frequent Transit
Network.
The study comprised the following:
A review of the literature, including comparable apartment parking studies conducted
recently;
A review of current practices by municipalities in metropolitan Vancouver;
A review of current practices in other cities in Canada, the United States, and Europe;
Key informant interviews with residential developers and municipal planners;
Two surveys conducted in the region:
o Parking Facility Survey of parking occupancy rates in 80 apartment sites
o Household Survey of 1,500 households residing in 90 apartment sites
Identification of opportunities for apartment parking near the Frequent Transit Network

The Metro Vancouver Apartment Parking Study, Technical Report
September 2012 Page 2
The interviews with developers were completed in March‐May 2011. During this same period,
feedback was received from municipal planners and engineers via e‐mail. The review of current
parking requirements based on bylaws from municipalities was completed in early 2012. The
two surveys were conducted in September ‐ November 2011 with the assistance of Acuere
Consulting Ltd.

The Metro Vancouver Apartment Parking Study, Technical Report
September 2012 Page 3
2 Defining the Problem and Opportunities This section outlines the policy context for studying apartment parking, the cost of constructing
parking, current and emerging trends, including the emergence of TransLink’s Frequent Transit
Network.
2.1 Regional Planning and Policy Context Encouraging compact communities, sustainable modes of travel, whether by transit, walking,
cycling, or carpooling, and increasing affordable housing choices for all segments of the
population are keys to enhancing the economic, environmental, and social sustainability of
metropolitan Vancouver. These values are well‐established in regional plans. Efficient parking
requirements will help contribute to the achievement of these objectives.
Regional Growth Strategy
The Regional Growth Strategy envisions a transit‐oriented region arranged in an interconnected
network of Urban Centres and Frequent Transit Development Areas, complemented by viable
industrial and agricultural lands, and protected conservation/recreational areas. The majority of
the residential growth – an additional one million new residents – over the next 30 years will be
accommodated in the form of redevelopment within the Urban Centres and Frequent Transit
Development Areas.
The region has been moving in the right direction. The majority of new residential development
in the region is in the form of apartments and townhouses. Of the average 16,300 housing
starts per year between 2007 and 2011 in the region, 59 percent have been apartments, 18
percent townhouse/rowhouse/semi‐detached, and 23 percent single‐detached homes.
In terms of specific actions, the Regional Growth Strategy requests that municipalities set out
policies in their Regional Context Statements that establish or maintain reduced residential and
commercial parking requirements in Urban Centres and Frequent Transit Development Areas, in
coordination with the provision of transit, where appropriate.
The Regional Growth Strategy also strives for a sustainable region where transit, walking,
cycling, and carpooling are popular alternatives to the single‐occupant vehicle. TransLink’s
Transport 2040 also envisions a region where the majority of jobs and housing are located along
the Frequent Transit Network, and where most trips are made by transit, walking, and cycling.
Nearly three out of four trips made in the region today are in a private car or truck. The
availability and cost of parking is one aspect of development that could have an effect on
evolving travel behaviour.

The Metro Vancouver Apartment Parking Study, Technical Report
September 2012 Page 4
Regional Affordable Housing Strategy
One of the greatest challenges facing metropolitan Vancouver is housing affordability. Metro
Vancouver’s Regional Affordable Housing Strategy recognizes that a broader range of housing
choices near transit will contribute to more complete communities and expand opportunities for
more people to benefit from regional transit investments. A well‐housed population is also
fundamental to the functioning of the region’s economy.
Metro Vancouver estimates that new residential growth will increase the demand for affordable
housing to at least 6,500 new rental units each year in the next decade, of which close to 5,000
units should be targeted to low‐to‐moderate income households. Well located, affordable
rental and ownership housing is vital to the social and economic well‐being of the region.
The Regional Affordable Housing Strategy includes “reducing parking requirements for all
housing located in areas with good access to transit” as one of many actions that municipalities
can take to increase the diversity and affordability of housing.
Of particular concern is increasing the supply of rental housing, but the economics of building
rental housing in the region are challenging. Affordable housing providers and developers alike
often raise parking as an area of cost savings that could increase housing affordability. While
reducing or eliminating parking will not solve housing affordability on its own, parking
reductions can contribute to lowering construction costs. In combination with other incentives,
this can increase the affordability and viability of rental housing. Parking reductions are already
a commonly sought variance for affordable rental housing developments. Expanding the
conditions where parking reductions are used could help expand opportunities for rental
housing, particularly near transit.
Implications for Renters and Low‐to‐Moderate Income Households
The implications of excessive parking for creating compact communities, promoting sustainable
transportation choices, and reducing housing construction costs are clear. But what is
underappreciated is the impact of excessive parking on lower‐income renters. Renters tend to
have lower incomes than owners and tend to own fewer cars than owner‐occupied households.
They are, not surprisingly, also more likely to depend on alternative modes of transportation
including transit.
According to the 2006 Census, in metropolitan Vancouver, renters made up the majority of
private apartment dwellers (59 percent). Average rents and house prices in the region have
been growing at a faster rate than inflation over the past decade. Rents in purpose built
apartments now average over $1,000 per month,1 and vacancy rates have been persistently low.
Rents in condo apartments are typically higher than the average rent in purpose built rental.
The cost of parking is often embedded into housing prices and rents, whether or not the parking
1 Canada Mortgage and Housing Corporation, Rental Market Report, Fall 2011. Data shown for October 2011.

The Metro Vancouver Apartment Parking Study, Technical Report
September 2012 Page 5
is needed or not. This means that those least able to pay and least apt to use parking are often
paying for the cost of parking anyway because it is included in their rent.
For low to moderate income households seeking entry level ownership housing, living in an area
that does not require a vehicle for mobility, such as near transit, could lower household costs by
eliminating the need to own and operate a vehicle. Being able to purchase a unit that does not
include the cost of parking could provide further savings that make ownership more affordable.
While affordability gains due to reduced parking costs may be quite modest, it is one tool – a
low‐hanging fruit – municipalities have that, in combination with other incentives can contribute
to more affordable housing choices.
2.2 The Costs of Constructing Parking In metropolitan Vancouver, the cost of constructing on‐site structured parking on average
ranges from $20,000 to $45,000 per stall. For underground parking facilities, the main cost
driver is excavation. As underground parking facilities get built deeper down, the cost
(especially after the second level) increases substantially. In these cases the marginal cost can
be significantly higher than the average cost per parking stall. In addition to the capital cost,
there are costs associated with maintaining the parking facility. With a reduced parking supply
these costs could be reduced commensurately.
According to industry sources, the average cost to provide a parking stall can be in the range of
approximately 10 percent of the apartment building construction cost. This depends on the type
of apartment building structure and parking facilities as well as building specific design
considerations. It should be noted that after other project costs are included ‐‐ municipal
charges, infrastructure, sales and marketing – parking costs can end up being a relatively smaller
component of the total project cost.2 But from the customers’ perspective, by providing too
much parking, or including parking in the cost of apartment units, they have no choice but to
accept an apartment with a higher cost.
Both municipalities and developers have every incentive to get parking “right.” People want to
be able to choose a well located, appropriately priced place to live. Municipalities want to
create vibrant, harmonious, and complete communities with housing options for all income
levels, and residential developers want to produce housing that meets consumer demand and
fits with the community while still being able to make a profit.
But parking is something that is not always done right. It is frequently heard that the parkades
in many apartment sites in the region are underutilized. Anecdotally, there have been
suggestions that some parkades are half‐occupied on most nights. In other instances,
developers complain that municipalities are getting too far out in front of the market by
requiring too few parking stalls. The contrast in perspectives is troubling. These cost variables,
2 Source: Butterfield Development Consultants, Altus Group, and Urban Development Institute (telephone and e-mail correspondence, March 2012).

The Metro Vancouver Apartment Parking Study, Technical Report
September 2012 Page 6
if not managed rigorously, leads to unnecessary project costs, which are either passed on to
consumers or absorbed by the developer.
Prior to the Metro Vancouver study, there was limited evidence to validate or refute current
apartment parking requirements in the region, particularly in locations near transit. In a past
study surveying planning directors in the United States on how they set parking requirements,
the two most frequently cited methods were to “survey nearby cities” and to “consult Institute
of Transportation Engineers (ITE) handbooks.” Both of these strategies can lead to repeating
mistakes by others and not incorporating local context to set appropriate requirements.3,4 This
approach can also fail to advance policies that reflect or anticipate changing patterns in the
region.
2.3 Current and Emerging Trends Infrastructure, attitude, behaviour, and technology are constantly evolving. This section
provides some indicators of current and emerging trends. Whether these patterns point to
long‐term trends or simply a symptomatic reflection of short‐term regional, provincial, and
global economic conditions, the overall body of evidence lends support to reviewing the match
between parking supply and demand.
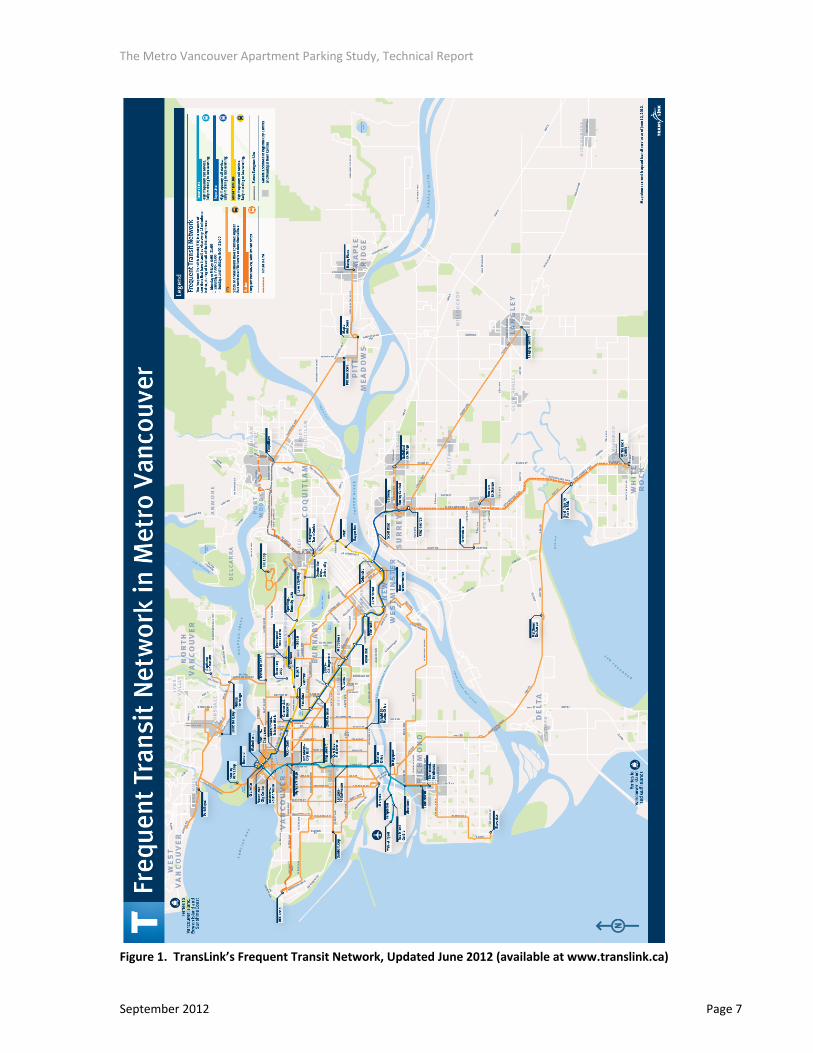
2.3.1 Emergence of TransLink’s Frequent Transit Network
Transit service has improved markedly in the region over the past 10 years. In places like
Vancouver, Burnaby, New Westminster, and now Richmond, transit is a viable alternative to
driving a car, or even owning one. Over the past five years, TransLink has built the Frequent
Transit Network into a functional and identifiable brand.
The Frequent Transit Network is a network of corridors along which transit service is provided at
least every 15 minutes in both directions throughout the day and into the evening, seven days a
week. The Frequent Transit Network does not refer to specific routes, technologies, or vehicle
types. It provides the travelling public the certainty of consistent service levels throughout the
region, and the relative permanence of established travel corridors. Another strategic intent is
to influence land use decisions, so that there is a high degree of coordination between land
development and transit service provision.
The Frequent Transit Network will evolve over time, as it should, in terms of improved
frequencies, hours of service, and geographic extent as the region continues to densify in
strategic locations in accordance to the Regional Growth Strategy and local plans. Looking
ahead, any opportunities to provide guidance on parking requirements must take into account
proximity to TransLink’s Frequent Transit Network.
3 The Trouble With Minimum Parking Requirements, Donald C. Shoup, 1999. 4 See for example the differences between the amount of parking required in the City of Vancouver parking bylaw, the amount actually requested by the City for this project specifically, and the amount of parking recommended by the ITE Parking General Manual in the transportation assessment and management study commissioned by the proponent of the original Marine Gateway proposal in 2009 (Last retrieved from http://www.marinegateway.ca/documents/trafficStudy.pdf).
The Metro Vancouver Apartment Parking Study, Technical Report
September 2012 Page 7
Figure 1. TransLink’s Frequent Transit Network, Updated June 2012 (available at www.translink.ca)
The Metro Vancouver Apartment Parking Study, Technical Report
September 2012 Page 8
2.3.2 Emerging Patterns in Actively Licensed Vehicles
Owning a car, or having access to one, has been one of the quintessential symbols of the North
American lifestyle for decades. But this may be changing now as historically high gas prices (in
current terms) remain unabated; the younger generation of adults are choosing to live in higher‐
density areas close to transit, shops, and other amenities; the older generation of adults are
downsizing and shedding the second or third family car; and, transit service has improved
throughout the region. These are some of the anecdotes that are often mentioned, whether to
reinforce urban densification and compact community policies, or to shed light on the evolving
cultural mores of car ownership in light of peak oil, climate change, a volatile economy, and
demographic changes.
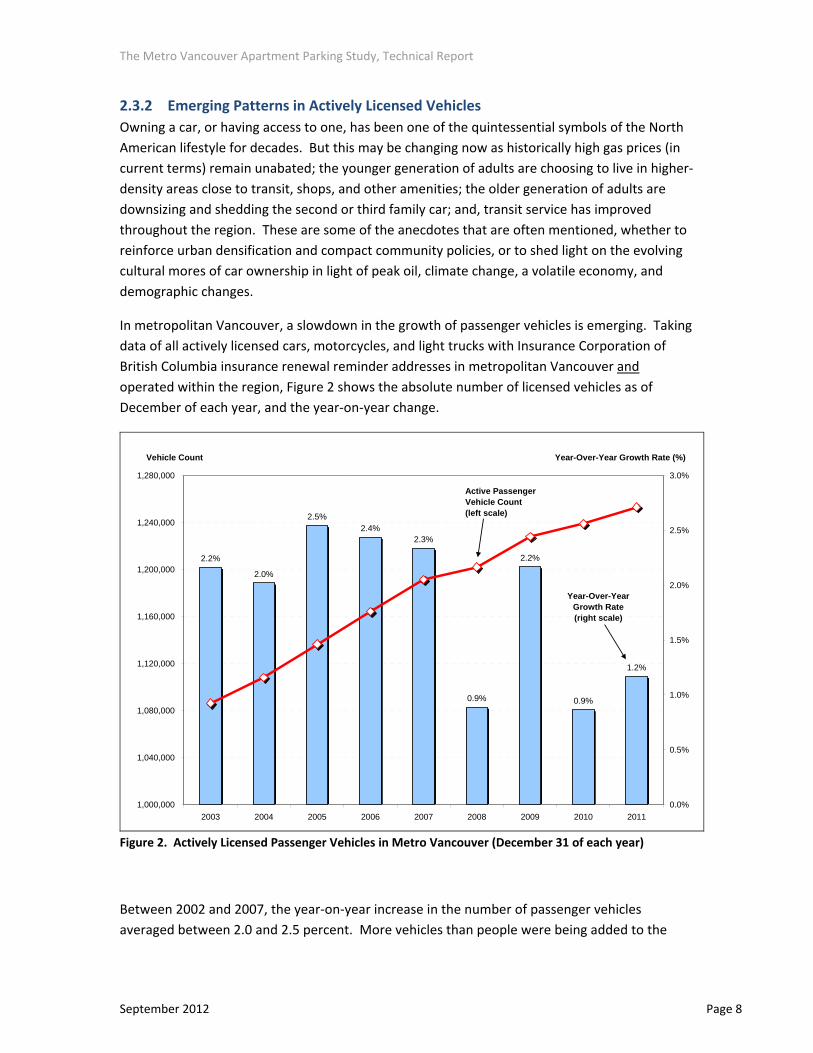
In metropolitan Vancouver, a slowdown in the growth of passenger vehicles is emerging. Taking
data of all actively licensed cars, motorcycles, and light trucks with Insurance Corporation of
British Columbia insurance renewal reminder addresses in metropolitan Vancouver and
operated within the region, Figure 2 shows the absolute number of licensed vehicles as of
December of each year, and the year‐on‐year change.
2.2%
2.0%
2.5%2.4%
2.3%
0.9%
2.2%
0.9%
1.2%
1,000,000
1,040,000
1,080,000
1,120,000
1,160,000
1,200,000
1,240,000
1,280,000
2003 2004 2005 2006 2007 2008 2009 2010 2011
0.0%
0.5%
1.0%
1.5%
2.0%
2.5%
3.0%
Vehicle Count Year-Over-Year Growth Rate (%)
Active Passenger Vehicle Count(left scale)
Year-Over-YearGrowth Rate(right scale)
Figure 2. Actively Licensed Passenger Vehicles in Metro Vancouver (December 31 of each year)
Between 2002 and 2007, the year‐on‐year increase in the number of passenger vehicles
averaged between 2.0 and 2.5 percent. More vehicles than people were being added to the

The Metro Vancouver Apartment Parking Study, Technical Report
September 2012 Page 9
region every year.5 In late 2008, at the peak of the global recession, the year‐on‐year growth in
vehicles fell below 1.0 percent. Growth in passenger vehicles rebounded by the end of 2009,
but retracted to around 1.0 percent in 2010 and 2011.
Figure 3 shows the pattern on a monthly basis between 2007 and 2012. During this period, the
average annual growth rate was tracking just below the regional population growth rate of 1.8
percent – a reversal of the prior five‐year period when vehicles were growing faster than
population.6
0.0%
0.5%
1.0%
1.5%
2.0%
2.5%
3.0%
Jan-
07
Apr-0
7
Jul-0
7
Oct-0
7
Jan-
08
Apr-0
8
Jul-0
8
Oct-0
8
Jan-
09
Apr-0
9
Jul-0
9
Oct-0
9
Jan-
10
Apr-1
0
Jul-1
0
Oct-1
0
Jan-
11
Apr-1
1
Jul-1
1
Oct-1
1
Jan-
12
Year-Over-Year Growth Rate (%)
Average Annual Population Growth Rate, 2006-2011
Figure 3. Actively Licensed Passenger Vehicles in Metro Vancouver (year‐on‐year change by month)
2.3.3 Emergence of Carsharing Programs
Carsharing programs are increasingly popular in North American cities and particularly in dense
urban areas. These programs provide consumers with a cost‐effective alternative to owning a
car when they only need a car infrequently. Individuals and households join these carshare
programs for different reasons, such as wanting to save on owning and operating a car or
reducing environmental impacts. Regardless of the specific personal reasons, carshare
programs can have profound impacts on car ownership by allowing a household to shed one or
more vehicles, or delay the purchase of an additional vehicle. One of the local carshare
providers in the region reported in 2008 that 15.5 percent of members were able to give up
5 Between 2001 and 2006, the annual average population growth rate in Metro Vancouver was 1.3 percent. Between 2006 and 2011, the population growth rate was 1.8 percent. 6 At the subregional level, actively licensed vehicle growth rates vary. Pitt Meadows, Maple Ridge, and communities south of the Fraser River are experiencing growth rates generally higher than the regional average. The Northeast Sector, Burnaby, and New Westminster are essentially tracking the regional average. The North Shore, Vancouver, Richmond, and Delta are experiencing much lower growth rates.

The Metro Vancouver Apartment Parking Study, Technical Report
September 2012 Page 10
their only vehicle after becoming a member, while an additional 3.7 percent were able to give
up a second car. Also, close to 7 out of 10 members reported that their mobility has improved
since joining the carshare program7. These effects have been validated in research elsewhere8,9.
One Toronto study reviewed car sharing impacts elsewhere in North America. Generally, each
carshare vehicle was found to replace approximately four private vehicles, and six to eight
residents avoided having to purchase a vehicle in the first place. Based on the evidence, the
study recommended that in Toronto, the minimum parking requirement for apartments should
be reduced by up to four stalls for each carshare stall, and that the carshare stalls should not be
counted towards the maximum allowable parking provision, if applicable. The implications for
parking requirements in new apartment developments are immense, especially in increasingly
denser areas of metropolitan Vancouver.
The metropolitan Vancouver market is served by three carshare providers: Modo, Zip Car, and
the latest entrant, car2go. These programs operate primarily in the higher density parts of the
region where car ownership rates are lower and access to transit and other amenities by
walking is more convenient. These carshare providers are constantly looking for new members
as well as new locations to expand their market and station their fleet. Hence, the providers are
very interested in securing carshare program parking in new residential developments, in
addition to other locations.
To encourage this, some municipalities are allowing developers to provide fewer resident
parking stalls in exchange for providing one or more carshare parking stalls and funding for a
carshare vehicle. The carshare vehicle could then be purchased and managed by a carshare
provider. Access to the vehicle may or may not be restricted to residents of the building only. A
study recommended reducing residential minimum parking requirements by 5‐10% when a
carsharing program is located nearby, or reducing 4‐8 parking spaces for each carshare vehicle
parked in the building10.
It would appear that the increasing acceptance of carshare programs by consumers and the
competitive marketplace in metropolitan Vancouver could yield beneficial results for a broad
range of stakeholders. Developers can save on the development costs of providing the full
amount of parking in exchange for providing carshare stalls and vehicles; building‐specific or
area residents can have additional mobility options and reduce expenditures on transportation;
and surrounding neighbourhoods could potentially experience less congestion from resident
and visitor vehicles. Reduced parking requirements and carshare programs appear to be two
mutually reinforcing strategies.
7 The Car Co-op Social and Environmental Report 2008. The Co-operative Auto Network. 8 Carsharing’s Impact on Household Vehicle Holdings: Results from a North American Shared-Use Vehicle Survey, Elliot Martin, Susan Shaheen, Jeffrey Lidicker, University of California, Berkeley, March 15, 2010 9 Parking Standards Review: Examination of Potential Options and Impacts of Car Share Programs on Parking Standards, Submitted to the City of Toronto by IBI Group, 2009. 10 Parking Standards Review: Examination of Potential Options and Impacts of Car Share Programs on Parking Standards, Submitted to the City of Toronto, by IBI Group, March 2009, Final Report.

The Metro Vancouver Apartment Parking Study, Technical Report
September 2012 Page 11
3 Review of Parking Studies from Other Jurisdictions Residential parking in apartment developments is an under‐studied aspect of urban and regional
planning. In metropolitan Vancouver, municipalities undertake sporadic surveys of specific
sites. To inform the approach for the Metro Vancouver study, a high‐level scan of recent
apartment parking studies and surveys was completed, in addition to the literature cited in
Section 2. The following is a summary of the review.
3.1 City of Vancouver The City of Vancouver has made progressive amendments to its parking bylaw since it was first
introduced in 1986 based on periodic data collection, including a major study in 1996.
In 1996, Greystone Properties, the developer of Collingwood Village in the Joyce‐Collingwood
SkyTrain precinct, in association with the Cities of Vancouver and Burnaby, commissioned a
household survey of parking demand in select SkyTrain precincts (Nanaimo, 29th Avenue, Joyce‐
Collingwood, Patterson, Metrotown, and Royal Oak) and surrounding neighbourhoods in
Vancouver and Burnaby. The surveys were conducted by phone, hand‐outs at existing
Greystone projects, and mail‐back surveys. Surveys were administered in about 60 sites
comprising 4,000 households. A total of 555 surveys were completed (response rate of 14
percent).
Some of the key survey findings were11:
The average vehicle ownership rate for households within 300 metres of a SkyTrain
station was 0.96, compared to 1.05 for comparable‐sized units beyond 1,000 metres of
a station.
Household income was the primary differentiator between vehicle ownership rates:
households earning more than $70,000 per year owned 1.51 vehicles, while households
earning less than $30,000 had 0.73 vehicles.
There was no clear gradient in vehicle ownership between sites located 50 metres, 100
metres, or 300 metres from a SkyTrain station.
The actual amount of parking being built exceeded the bylaw requirements of the time.
Ultimately, the findings helped inform the City of Vancouver to reduce on‐site parking
requirements by 25 percent below the then‐current level in Collingwood Village.
More recently in 2004, households living in 10 recently‐built condominium sites in the Marpole
neighbourhood were surveyed. 12 The results showed that for those sites close to frequent bus
stops, the vehicle ownership rate was comparable to that found in the 1996 study of sites near
the Joyce‐Collingwood SkyTrain station. Subsequently, in 2005, the City amended its parking
bylaw to reduce parking requirements in Marpole, along Kingsway, Central Broadway, and other
nodes throughout the city (usually at the intersection of frequent bus corridors).
11 A précis of the study can be found here: http://www.citebc.ca/Feb98_Ownership.html 12 City of Vancouver report to Council: http://vancouver.ca/ctyclerk/cclerk/20050426/tt3.pdf

The Metro Vancouver Apartment Parking Study, Technical Report
September 2012 Page 12
3.2 City of Toronto In 2006, the City of Toronto retained Cansult Limited to conduct a parking study of apartments
(strata, market rental, and non‐market rental) and condominium townhouses to inform
potential new parking requirements under a new unified zoning bylaw.13
The Toronto study employed a mail‐out survey to gauge the level of vehicle ownership and
parking demand14. The household survey was conducted on residents of apartments and
townhouses built since 1975. Prior to this study, the last major parking study was conducted in
1977 focusing on downtown Toronto.
The household survey obtained 4,698 household responses from rental and condominium
apartment sites (50.4 percent response rate) and 784 household responses from condominium
townhouse developments (23 percent response rate). The study was able to obtain a high
response rate because a systematic method of follow‐up was employed. After the first wave of
survey packages was mailed to over 9,000 households, reminder/thank you postcards were
mailed out in the following week. Two weeks later, a second wave of survey packages was
mailed out to the remaining 7,000 households who had not responded.
A rich dataset was assembled that allowed for exploration of the relationships between parking
demand and the following factors:
Tenant tenure (rent versus own)
Building tenure (purpose‐built rental, non‐market rental, condominium)
Unit type (bachelor suite, one, two and three plus bedrooms)
Unit size (square feet)
Building size (number of units)
Geographic group o Downtown core o Downtown Toronto and central waterfront o Centres and avenues on the subway o Avenues well‐served by surface transit o The rest of the city
The study found that vehicle ownership varies by location, but the variance was not consistent
between condominium and market rental apartments:
Average auto ownership in market rental apartments in the sample was 0.73. The rates
in the downtown core and downtown and central waterfront areas were substantially
lower than in suburban locations.
13 City of Toronto, Parking Standards Review – Phase Two Apartment Building / Multi-Use Block Developments Component, New Zoning Bylaw Project, Cansult Ltd, 2007. 14 The assessment of visitor parking demand was supplemented by a survey of several condominium visitor lots and data from the parking manager of market rental buildings.

The Metro Vancouver Apartment Parking Study, Technical Report
September 2012 Page 13
Average auto ownership rates in condominium apartments in the downtown core and
downtown and central waterfront areas were at around 1.0 vehicle per household. In
suburban locations not served by rapid transit, the rate was only slightly higher at 1.08
vehicles per household.
Average auto ownership in condominium apartments in designated centres and avenues
on the subway had the highest reported vehicle ownership of 1.15 vehicles per
household. The study suggested that this may be due in part to the higher income
characteristics of the specific buildings surveyed.
The study also confirmed the following relationships:
Auto ownership increases with the number of bedrooms
Controlling for the number of bedrooms, condominium units have the highest vehicle
ownership, followed by market rental apartments, then non‐market rental apartments
Market rental apartments in more suburban locations have higher vehicle ownership
rates and are nearly the same levels as condominium units in the same locations.
Owner‐occupied households own more vehicles than do renter‐households, even
controlling for unit type.
The relationship between vehicle ownership for 2‐bedroom condominium units and
subway access was relatively weak.
The relationship between vehicle ownership and building size (total units) was weak.
Based on the empirical evidence, the study team proposed aggressive minimum and maximum
residential and visitor parking requirements for condominium apartments and rental
apartments in each of the five geographic groups. Subsequently, the City of Toronto adopted
new parking regulations which reflect these recommendations (see Section 5 for details).
3.3 East Bay (San Francisco Bay Area) and Metro Portland In 2008, researchers from the University of California, Berkeley directly surveyed the parking
demand in 31 apartment sites within 1,000 metres of suburban rail stations in the East Bay of
the San Francisco Bay Area and in Metro Portland.15 The research team surveyed each site
during the “peak” period of 12AM to 5AM, and the off‐peak period of 10AM to 2PM.
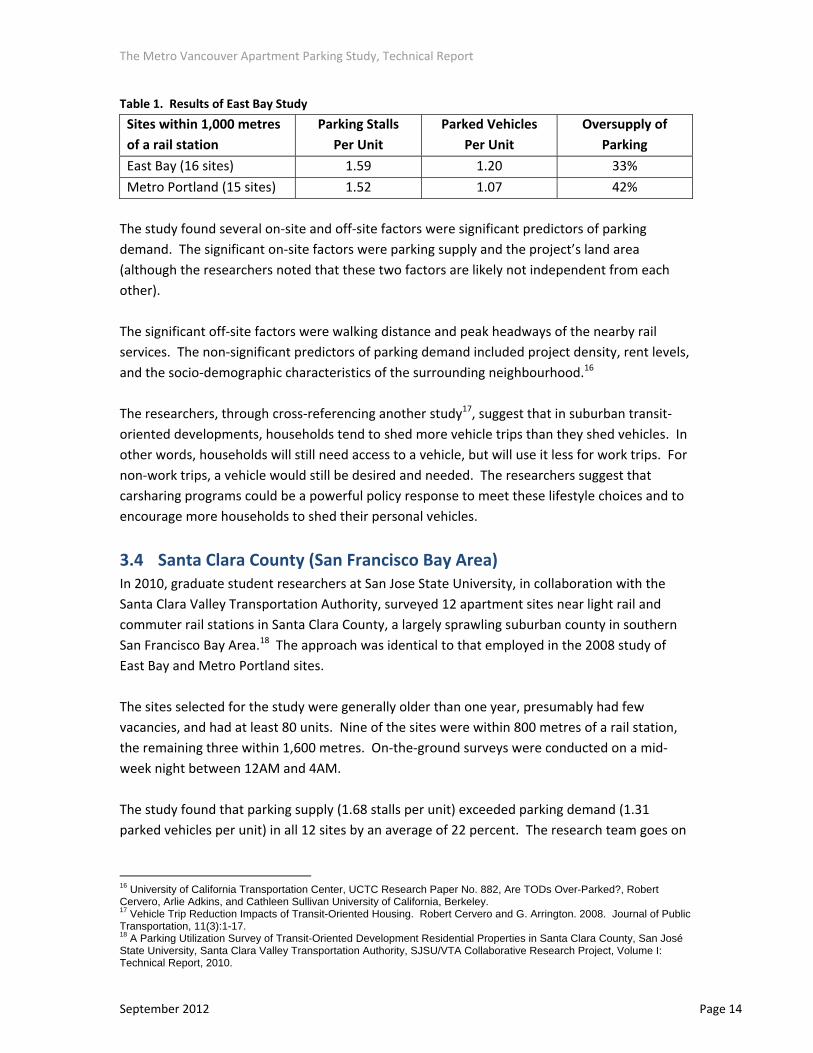
The study found that parking supply exceeded peak parking demand (number of parked vehicles
per unit) by 33 percent in the East Bay and 42 percent in Metro Portland. The observed demand
was similar to the guideline of 1.2 stalls per unit issued in the ITE Parking Generation Manual.
15 University of California Transportation Center, UCTC Research Paper No. 882, Are TODs Over-Parked? Robert Cervero, Arlie Adkins, and Cathleen Sullivan University of California, Berkeley.
The Metro Vancouver Apartment Parking Study, Technical Report
September 2012 Page 14
Table 1. Results of East Bay Study
Sites within 1,000 metres
of a rail station
Parking Stalls
Per Unit
Parked Vehicles
Per Unit
Oversupply of
Parking
East Bay (16 sites) 1.59 1.20 33%
Metro Portland (15 sites) 1.52 1.07 42%
The study found several on‐site and off‐site factors were significant predictors of parking
demand. The significant on‐site factors were parking supply and the project’s land area
(although the researchers noted that these two factors are likely not independent from each
other).
The significant off‐site factors were walking distance and peak headways of the nearby rail
services. The non‐significant predictors of parking demand included project density, rent levels,
and the socio‐demographic characteristics of the surrounding neighbourhood.16
The researchers, through cross‐referencing another study17, suggest that in suburban transit‐
oriented developments, households tend to shed more vehicle trips than they shed vehicles. In
other words, households will still need access to a vehicle, but will use it less for work trips. For
non‐work trips, a vehicle would still be desired and needed. The researchers suggest that
carsharing programs could be a powerful policy response to meet these lifestyle choices and to
encourage more households to shed their personal vehicles.
3.4 Santa Clara County (San Francisco Bay Area) In 2010, graduate student researchers at San Jose State University, in collaboration with the
Santa Clara Valley Transportation Authority, surveyed 12 apartment sites near light rail and
commuter rail stations in Santa Clara County, a largely sprawling suburban county in southern
San Francisco Bay Area.18 The approach was identical to that employed in the 2008 study of
East Bay and Metro Portland sites.
The sites selected for the study were generally older than one year, presumably had few
vacancies, and had at least 80 units. Nine of the sites were within 800 metres of a rail station,
the remaining three within 1,600 metres. On‐the‐ground surveys were conducted on a mid‐
week night between 12AM and 4AM.
The study found that parking supply (1.68 stalls per unit) exceeded parking demand (1.31
parked vehicles per unit) in all 12 sites by an average of 22 percent. The research team goes on
16 University of California Transportation Center, UCTC Research Paper No. 882, Are TODs Over-Parked?, Robert Cervero, Arlie Adkins, and Cathleen Sullivan University of California, Berkeley. 17 Vehicle Trip Reduction Impacts of Transit-Oriented Housing. Robert Cervero and G. Arrington. 2008. Journal of Public Transportation, 11(3):1-17. 18 A Parking Utilization Survey of Transit-Oriented Development Residential Properties in Santa Clara County, San José State University, Santa Clara Valley Transportation Authority, SJSU/VTA Collaborative Research Project, Volume I: Technical Report, 2010.

The Metro Vancouver Apartment Parking Study, Technical Report
September 2012 Page 15
to recommend that parking demand in transit‐oriented sites in Santa Clara County could support
a parking requirement of 1.3 stalls per unit.
3.5 Evidence from Europe In the report “Europe’s Parking U‐turn: From Accommodation to Regulation”, the Institute for
Transportation & Development Policy19 presents case studies from 10 European cities that have
implemented aggressive parking management strategies that make residential and commercial
parking generally less accessible and more expensive, as well as other steps to make
neighbourhoods more pedestrian friendly.
Some of the results include: significant reductions in private car trips; less congestion;
reductions in air pollution; revitalized and thriving town centers and generally improved quality
of life. While the specific policies and outcomes vary, the main lesson is clear: municipal
decisions on where and how much parking to provide have a significant impact on the number
of trips that are taken by car versus other modes.
For residential parking, European cities are reducing or eliminating minimum parking
requirements, particularly in town centres and areas with frequent transit, and in some cases
imposing maximum parking provisions. This is coordinated with other parking strategies
including street parking regulations, to reduce the overall demand for vehicles and use of
parking. Novel ideas include allowing owners of parking spaces in garages to lend them
temporarily to visitors by way of controlled reservations, and allowing residential vehicles to
park overnight in loading zones.20
The European case studies provide evidence that systematic management of residential and
non‐residential parking supply and pricing can have beneficial reductions in vehicle usage,
improved modal shares for transit, and improved urban landscapes. This transportation supply
management feature may encourage people to consider other modes of transportation, such as
walking, cycling, transit, and car sharing.
19Kodransky, Michael and Gabrielle Hermann. Europe’s Parking U-Turn: From Accommodation to Regulation. Institute for Transportation & Development Policy. 2011 20 Ibid.

The Metro Vancouver Apartment Parking Study, Technical Report
September 2012 Page 16
3.6 Key Lessons Learned Several key lessons emerged from the review of the five parking studies both on the
methodologies employed and on the substance of the findings:
On‐the‐ground surveys provide direct evidence of parking usage; household surveys provide
evidence of vehicle ownership, plus, depending on the survey questions, other attributes of
households and units. A combination of these approaches would appear to provide a richer
set of data than either one alone.
The Toronto and Vancouver examples provide evidence that there is a measurable
difference in vehicle ownership (and therefore ultimate parking demand) between sites
close to (primarily rail) transit and sites further away from transit.
In Toronto and Vancouver, municipal councils were convinced of the evidence and amended
their parking bylaws accordingly.
The two American studies provide evidence that parking demand is measurably lower than
parking supply in sites close to rail transit, even in suburban settings.
A large focus of the studies was on the relationship between parking demand and proximity
to rail stations. There remains a gap in understanding how parking demand may be
different for sites close to frequent bus corridors.
Evidence from Europe has demonstrated that systematic management of residential and
non‐residential parking supply and pricing can have beneficial reductions in vehicle usage,
improved modal shares for transit, and improved urban landscapes. This transportation
supply management feature may encourage people to consider other modes of
transportation, such as walking, cycling, transit, and car sharing.

The Metro Vancouver Apartment Parking Study, Technical Report
September 2012 Page 17
4 Review of Current Municipal Practices
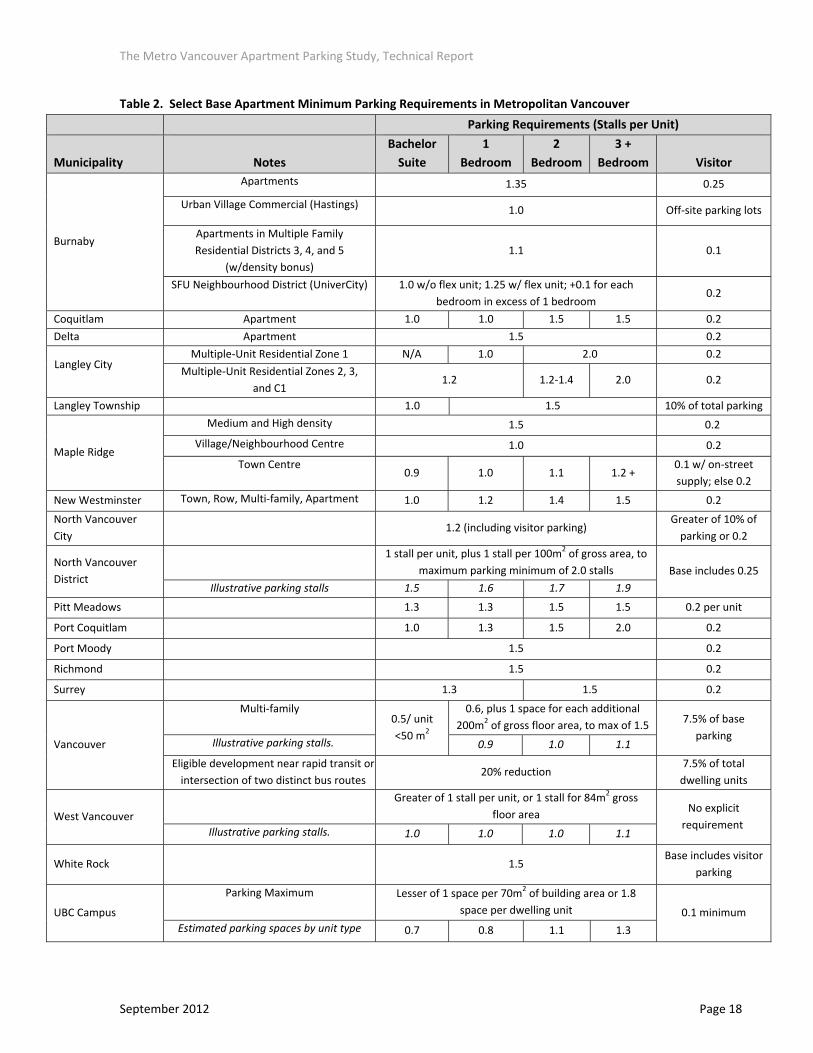
4.1 Apartment Parking Requirements in Metropolitan Vancouver Metro Vancouver staff reviewed current practice for on‐site parking for apartment
developments in 17 of the larger municipalities in the region, plus the University of British
Columbia Point Grey Campus (Table 2)21. Minimum requirements were documented as well as
whether the municipality made allowances for parking reductions in urban centres, near transit,
for seniors and affordable housing. Some interesting patterns were found on what these
jurisdictions currently require and provisions for variances.
4.1.1 Minimum Parking Requirements
Most municipalities stipulate minimum parking requirements of at least 1.0 stall per unit for
apartments. Ten jurisdictions have some degree of variation of minimum parking requirements
according to the number of bedrooms or floor area in an apartment unit, whereas the remaining
municipalities require the same minimum number of stalls for all unit types.
The City of Vancouver and UBC Point Grey Campus are the only jurisdictions that have minimum
parking requirements less than 1.0 stall per unit. They also stipulate maximum parking
requirements.
The City of Vancouver, North Vancouver District, West Vancouver District, and UBC Point Grey
Campus are unique in their use of the residential floor space, rather than the number of
bedrooms, as the basis for deriving minimum parking requirements.
The parking bylaws are silent on the allocation of specific parking stalls to individual apartment
units. Municipalities allow developers to allocate parking stalls to individual apartment units as
they determine best during their sales process.
Most municipalities stipulate minimum parking requirements for visitors in addition to the
residential requirement. The most common rate is 0.2 stalls per unit. In Burnaby, North
Vancouver District, and White Rock, visitor parking requirements are subsumed within the
residential parking requirements for apartments.22
Finally, Maple Ridge is the only municipality that varies its visitor parking requirement within its
town centre based on the availability of on‐street parking supply. The minimum requirement is
0.1 per unit if on‐street parking is available, and 0.2 per unit if on‐street parking is not available.
21 To estimate, for illustrative purposes only, the number of parking stalls required per apartment based on regulations specifying floorspace ratios, the following apartment floorspace were assumed: 500 sqft for a bachelor suite; 600 sqft for a one-bedroom unit; 800 sqft for a two-bedroom unit; and, 1,000 sqft for a three-bedroom unit. 22 By the request of Burnaby planners, the minimum residential and visitor parking requirements have been split out in Table 3.
The Metro Vancouver Apartment Parking Study, Technical Report
September 2012 Page 18
Table 2. Select Base Apartment Minimum Parking Requirements in Metropolitan Vancouver
Parking Requirements (Stalls per Unit)
Municipality
Notes
Bachelor
Suite
1
Bedroom
2
Bedroom
3 +
Bedroom Visitor
Burnaby
Apartments 1.35 0.25
Urban Village Commercial (Hastings) 1.0 Off‐site parking lots
Apartments in Multiple Family
Residential Districts 3, 4, and 5
(w/density bonus)
1.1 0.1
SFU Neighbourhood District (UniverCity) 1.0 w/o flex unit; 1.25 w/ flex unit; +0.1 for each
bedroom in excess of 1 bedroom 0.2
Coquitlam Apartment 1.0 1.0 1.5 1.5 0.2
Delta Apartment 1.5 0.2
Langley City Multiple‐Unit Residential Zone 1 N/A 1.0 2.0 0.2
Multiple‐Unit Residential Zones 2, 3,
and C1 1.2 1.2‐1.4 2.0 0.2
Langley Township 1.0 1.5 10% of total parking
Maple Ridge
Medium and High density 1.5 0.2
Village/Neighbourhood Centre 1.0 0.2
Town Centre 0.9 1.0 1.1 1.2 +
0.1 w/ on‐street
supply; else 0.2
New Westminster Town, Row, Multi‐family, Apartment 1.0 1.2 1.4 1.5 0.2
North Vancouver
City
1.2 (including visitor parking)
Greater of 10% of
parking or 0.2
North Vancouver
District
1 stall per unit, plus 1 stall per 100m2 of gross area, to
maximum parking minimum of 2.0 stalls Base includes 0.25
Illustrative parking stalls 1.5 1.6 1.7 1.9
Pitt Meadows 1.3 1.3 1.5 1.5 0.2 per unit
Port Coquitlam 1.0 1.3 1.5 2.0 0.2
Port Moody 1.5 0.2
Richmond 1.5 0.2
Surrey 1.3 1.5 0.2
Vancouver
Multi‐family 0.5/ unit
<50 m2
0.6, plus 1 space for each additional
200m2 of gross floor area, to max of 1.5 7.5% of base
parking Illustrative parking stalls. 0.9 1.0 1.1
Eligible development near rapid transit or
intersection of two distinct bus routes 20% reduction
7.5% of total
dwelling units
West Vancouver
Greater of 1 stall per unit, or 1 stall for 84m2 gross
floor area No explicit
requirement Illustrative parking stalls. 1.0 1.0 1.0 1.1
White Rock
1.5 Base includes visitor
parking
UBC Campus
Parking Maximum Lesser of 1 space per 70m2 of building area or 1.8
space per dwelling unit 0.1 minimum
Estimated parking spaces by unit type 0.7 0.8 1.1 1.3
The Metro Vancouver Apartment Parking Study, Technical Report
September 2012 Page 19
4.1.2 Allowable Parking Reductions
The municipal parking bylaws generally allow for reductions in parking from the base minimum
requirement under certain scenarios. If the bylaw does not allow for reductions in minimum
parking required, a variance application may be submitted by the applicant for consideration
and approval by the municipal council. Table 3 summarizes the areas where municipalities
allow parking reductions.
Some of the key observations are:
Metro Vancouver municipalities generally do not stipulate reduced parking requirements
near transit. An exception is the City of Vancouver with specific parking reductions near
transit (i.e., within two blocks of a rapid transit station or the intersection of two distinct bus
routes running north/south and east/west).
Nine municipalities provide for parking reductions in Urban Centres or higher density areas.
Seven municipalities allow for parking reductions in mixed‐use projects with shared parking
arrangements, subject to conditions (e.g., transportation impact analysis). In three
municipalities, the total parking reductions can be as high as 25 percent.
Four municipalities allow for reduced parking if transportation demand management (TDM)
measures are provided. These TDM measures include carshare vehicles and stalls or bicycle
spaces.
Most municipalities allow for reduced parking requirements for non‐market housing or
seniors housing sites, reflecting the expected reduced vehicle ownership rates and parking
demand for these households.
Seven municipalities include provisions allowing developers to reduce the on‐site parking
provided subject to providing cash in lieu payments to the municipality, which may be used
for off‐site municipal parking facilities. This cash‐in‐lieu ranges from $8,000 to $35,000 per
parking stall.

The Metro Vancouver Apartment Parking Study, Technical Report
September 2012 Page 20
Table 3. Bylaw Provisions for Parking Reductions in Select Municipalities in Metropolitan Vancouver
Bylaw
Provisions for
Parking
Reductions Burnaby
Coquitlam
Delta
Langley City
Langley Township
Maple Ridge
New
Westm
inster
North Vancouver City
North Vancouver District
Pitt Meadows
Port Coquitlam
Port M
oody
Richmond
Surrey
Vancouver
West Vancouver
White Rock
UBC Point Grey Cam
pus
Near Transit Urban
Centres/Higher
Density Areas
Shared Parking
in Mixed‐Use
Developments
(subject to
conditions)
TDM
Requirements
Cash‐in‐Lieu Non‐Market or
Market Rental
Housing
Seniors
Housing

The Metro Vancouver Apartment Parking Study, Technical Report
September 2012 Page 21
4.2 Apartment Parking Requirements in Other Cities Metro Vancouver staff reviewed parking requirements from a number of jurisdictions in Canada
and the United States. Staff chose peer jurisdictions that share similar urban, suburban, or
transit contexts as those in various subregions of metropolitan Vancouver. Toronto and
Montreal both have a strong downtown core and extensive heavy rail transit systems
complemented by a comprehensive network of surface transit services. Calgary and Denver are
both sprawling but rapidly urbanizing city‐regions served by a network of bus and light rail
transit services. The Puget Sound cities of Seattle and Bellevue are served primarily by a
comprehensive network of buses, although light rail transit service is emerging in Seattle, and
will soon be expanded 18 km east to the suburb of Bellevue. Portland has the most
comprehensive bus and light rail transit system of any medium‐sized city in North America.
4.2.1 Residential Parking Requirements
All of the jurisdictions offer useful lessons, including zero minimum parking requirements.
Seattle has a zero minimum parking requirement for all apartment developments in urban
centres and transit station areas. The zero minimum parking requirement also applies to sites
that are in urban villages and within 400 metres of frequent transit service, which is defined as
15‐minute headway or better for at least 12 hours per day, 6 days per week, and 30‐minute
headway or better for at least 18 hours per day. In all other areas, the minimum requirement is
only 1 stall per unit, but may be reduced 20 percent if the site is within 400 metres of frequent
transit service. Bellevue has a zero minimum parking requirement and a 2 stall per unit
maximum in its downtown (Table 4).
Toronto, as discussed in Section 3.2, has both minimum and maximum parking requirements
that vary by geography and proximity to transit. The minimum requirement for 0 to 2‐bedroom
apartment units is under 1.0 stall per unit. Of note, Toronto City Council went even further
recently by approving a 315‐unit apartment building (primarily bachelor suites and one‐
bedroom units) in downtown without any parking supplied, other than several carshare vehicles
and a bicycle stall for each unit. The site is located close to a subway station and other
amenities. It is expected that very few of the occupants will own cars, and those that do have
cars can find parking on nearby streets and available private parkades (see Section 5.4 for an
interview with a Toronto‐based transportation consultant involved in this development).
Montreal has very low minimum and maximum parking requirements in Ville Marie Borough, its
central core. Montreal has a reduction of 50 percent for sites within 150 metres of a subway
station.
Calgary has an across‐the‐board minimum requirement of 0.9 stall per unit for its downtown.
Outside of the downtown (in Area 2), minimum and maximum parking requirements are
stipulated. In contrast to the large range between the minimum and maximum parking
requirements in Bellevue, for example, Calgary’s Area 2 requirements are tightly bounded
between 1.0 and 1.25 stalls per unit.

The Metro Vancouver Apartment Parking Study, Technical Report
September 2012 Page 22
Portland has one of the more innovative suites of apartment parking requirements. The city has
a zero minimum parking requirement for sites within 150 metres of a 20‐minute or better peak
hour transit service. For sites in the high density zoning designation, the minimum parking
requirement is 0.5, which is further reduced by 50 percent if the site is also located within 150
metres of a light rail alignment. The city also allows required vehicle parking to be substituted
by bicycle parking (up to 25 percent), transit‐supportive plazas (up to 10 percent), and
motorcycle parking (up to 5 percent).
Portland also imposes parking maximums in specific districts within the downtown, ranging from
1.35, 1.5, or 1.7 stalls per unit.
Denver’s parking code is unique because it is based on an urban form typology. Minimum
parking requirements are lower in the more urban environs or areas within 400 metres of
transit. A parking maximum of 110% of the minimum requirement is applied to surface parking
only.
4.2.2 Visitor Parking Requirements
Calgary and Toronto generally require a minimum 0.1 stall per unit for visitor parking. There
was limited reference to visitor parking in urban centres and near transit in the zoning bylaws of
other jurisdictions, particularly where there were “0” minimum parking requirements or parking
maximums.
4.2.3 Key Lessons Learned
Several key lessons emerged from the scan of peer cities in Canada and the United States:
The suburban cities (i.e., Calgary, Denver, Bellevue) generally have somewhat lower parking
requirements than do comparable suburban municipalities in metropolitan Vancouver.
All of the cities explicitly differentiate parking requirements for specific geographic areas,
whether the downtown or areas close to transit.
All of the cities studied have minimum parking requirements of less than 1.0 for its urban
cores.
Calgary, Toronto, and Montreal have reduced parking requirements for sites close to
different types of transit technology, primarily rail‐based. Seattle, Portland, and Denver
have reduced parking requirements for sites close to rapid or frequent transit service,
without explicit reference to technology.
Calgary, Toronto, Montreal, Portland, Bellevue are using parking maximums, with Calgary
and Toronto having the most extensive application.
Other than Toronto, the cities do not vary parking requirements by the number of
bedrooms.
In Seattle, selling units without including parking in the unit price appears to be the norm
(especially with purpose‐built rental sites) and in Toronto for both condominium and rental
sites.

The Metro Vancouver Apartment Parking Study, Technical Report
September 2012 Page 23
Table 4. Select Apartment Parking Requirements in Other Jurisdictions
Parking Requirements (Stalls per Unit)
Municipality
(population)
Designated Geography Bachelor
Suite
1
Bedroom
2
Bedroom
3+
Bedroom
Visitor
Parking
Calgary
(1.1 million
in 2011)
Downtown 0.9 0.1
Area 2 MIN 1.0 0.15
Area 2 ‐within 600 m of LRT (MAX) 1.25 NA
Area 1 ‐ Rest of City (MIN) 1.0 / unit <60 sq m 1.25 / unit >60 sq m NA
Area 1 ‐within 600 m of LRT (MAX) 1.5 NA
Toronto
(2.6 million
in 2011)
PA 1 – Downtown Core (MIN) 0.3 0.5 0.8 1.0 0.1
PA 1 ‐‐ Downtown Core (MAX) 0.4 0.7 1.2 1.5 ‐‐
PA 2 and 3 ‐‐ Condo on Subway and Central
Waterfront (MIN)
0.6 0.7 0.9 1.0 0.1
PA 2 and 3 ‐‐ Condo on Subway and Central
Waterfront (MAX)
0.9 1.0 1.3 1.5 ‐‐
PA 4 ‐‐ Surface Transit (MIN) 0.7 0.8 0.9 1.1 0.15
PA 4 ‐‐ Surface Transit (MAX) 1.0 1.2 1.3 1.6 ‐‐
All other areas (MIN) 0.8 0.9 1.0 1.2 0.2
Montreal
(1.7 million)
Ville Marie Borough (MIN) 0.25 / unit <50 sq. m 0.5 / unit >50 sq m ‐‐
Ville Marie Borough (MAX) 1.0 / unit <50 sq m 1.5 / unit >50 sq m ‐‐
Within150 metres of metro station ‐ 50% reduction (MIN)
0.125 /unit <50 sq. m 0.25 / unit >50 sq. m ‐‐
For development with 6 or less units meeting
specific conditions 0
‐‐
Seattle
(617,000 in
2009)
Urban Centre and station area;
In Urban Villages and within 400 m of frequent
transit service
0
‐‐
Other areas within 400 m of frequent transit 20% reduction ‐‐
Other areas 1.0 ‐‐
Bellevue
(127,000 in
2009)
Downtown Res. Zones (MIN) 1.0 ‐‐
Downtown Res. Zones (MAX) 2.0 ‐‐
Downtown Transit District (MIN) 0.75 – 1.0 ‐‐
Downtown Transit District (MAX) 2.0 ‐‐
Portland
(567,000 in
2009)
Select Downtown Districts (MAX) 1.35 or 1.5 or 1.7 ‐‐
Highest Density Zone (MIN) 0 ‐‐
Zones within 150 metres of 20‐min peak hour transit service (MIN)
0 ‐‐
Other zones (MIN) 0.5 ‐‐
Denver
(611,000 in
2009)
Urban Centre 0.75 ‐‐
Urban Edge/General Urban neighbourhood 1.0
‐‐
Suburban 1.25 ‐‐
Main Street Zones 1.0 ‐‐
Within 400 m of transit Up to 25% reduction (outside urban centre) ‐‐
Surface parking (MAX) 110% of minimum parking requirement ‐‐

The Metro Vancouver Apartment Parking Study, Technical Report
September 2012 Page 24
5 Key Informant Interviews Metro Vancouver staff conducted interviews with developers and municipal planners both in
the region and elsewhere23.
5.1 Apartment Developers In the spring of 2011, Metro Vancouver staff interviewed eight major apartment developers in
the region and one townhouse developer. The interviewees were executives or senior staff
directly involved in project design and approval processes. (See Appendix 2 for the list of
participants and Appendix 3 for the interview questions).
Participants were asked a number of questions about their recent experiences with municipal
parking bylaw requirements, receptiveness to lower parking requirements, and other aspects of
parking in the residential design, approval, construction, marketing, and sales process.
The following is a summary of the developer responses without attributing specific comments to
individual interviewees. The findings of these interviews informed the subsequent parking
surveys and analyses.
5.1.1 Reasonableness of Municipal Residential Parking Requirements
There was no consensus on the question of whether current municipal residential parking
requirements are reasonable and appropriate. One developer noted anecdotally a region‐wide
change in municipal council attitudes towards parking from five years ago, observing that more
municipalities are appropriately asking for much less parking. Another developer noted a
municipality informally applying its minimum parking requirement as a maximum instead.
Many developers expressed limited appetite for variances in parking requirements, even if they
felt a lower parking requirement was appropriate. Even if it is discovered during the apartment
pre‐sale period (but before construction commences) that there is less demand for parking than
expected, developers tend not to request a variance to the approved plans to allow for a
reduction in parking construction due to the associated potential risk of approval delay. A few
developers noted that some municipalities offer limited support for parking variances and that
requests for parking reductions can expose developers to additional approval time and risk if the
variance is not approved. An exception was in cases where the cost to build underground
parking is very high (e.g., involving extensive excavation). Moreover, during the development
application process, there can be significant concerns about traffic and parking from nearby
residents and merchants.
The variety of development conditions throughout the region from highly urban, transit centred
locations to suburban settings with limited transit options also contributed to the lack of
consensus on whether current municipal parking requirements are reasonable. There was a
23 Some of the developers also build townhouses; one developer specialized in townhouse development only.

The Metro Vancouver Apartment Parking Study, Technical Report
September 2012 Page 25
general agreement that parking requirements should vary for smaller, lower‐priced apartment
units, in particular in higher‐density and transit‐rich areas such as downtown Vancouver.
Parking stall size and tandem parking were raised as issues. One developer stated that several
municipalities require excessively large parking stall dimensions. Another developer stated that
tandem stalls24 are gaining market acceptance, especially in new townhouse designs but current
parking requirements sometimes restrict them from bringing more efficient housing designs
such as stacked townhouses with tandem parking to the market.
Other comments regarding municipal bylaw requirements:
Municipalities can encourage more shared parking between commercial tenants, visitors,
and residents in mixed use projects.
In some municipalities, exclusive stalls must be provided for carwashes, which add to
project costs and space consumed.
Municipalities are increasingly asking for more disabled user stalls; however it is difficult to
match these stalls with appropriate unit owners.
HandiDART (a door‐to‐door shared‐ride service with people with disabilities) is very
restrictive in their loading locations, which can sometimes necessitate construction of an
extra loading stall, which can be a problem in a smaller complex.
5.1.2 Lowering Minimum Parking Requirements
There was general agreement that targeted amendments to minimum parking requirements
may be appropriate. But there was a mix of opinions on whether across‐the‐board
modifications to minimum parking requirements or even maximum parking requirements are
justifiable. One developer suggested that there is an opportunity to modify minimum parking
requirements, but proposing maximum parking requirements may be too challenging, especially
in mixed‐use projects. Conversely, another developer stated that parking maximums would be
welcomed so that developers can work within this parameter during the design process,
suggesting a maximum of 1.3 stalls per unit inclusive of visitor parking independent of unit types
(number of bedrooms).
5.1.3 Visitor Parking
A number of developers stated that the commonly‐used minimum visitor parking requirement
of 0.2 stall per apartment unit is excessive. In some instances, surplus visitor spaces were sold
to tenants as privately assigned parking stalls rather than retained as designated visitor parking
stalls. One developer noted that secured gates make visitor parking less accessible and
therefore underused.
24 Tandem parking stalls are two stalls arranged so that two vehicles are parked nose-to-end, rather than side-by-side.
The Metro Vancouver Apartment Parking Study, Technical Report
September 2012 Page 26
5.1.4 Proximity to Transit
Developers expressed a common viewpoint that proximity to high quality transit matters when
selecting sites, designing the amount of parking to be built, and marketing a project. Some
offered the perception that SkyTrain service is a much more reliable, faster, and less crowded
service compared to frequent buses and noted that they market projects as being close to a
SkyTrain station, but not bus corridors. Others recognized that in parts of the region, such as in
Vancouver, bus service can be as or more important than SkyTrain in terms of both service and
marketability. Frequency was cited by a developer as a key attribute, whether bus or SkyTrain
(staff did not ask about SeaBus or West Coast Express).
None of the developers systematically used distance‐based guidelines for gauging proximity to
transit. One developer suggested 400 metres to a frequent bus or SkyTrain station is an asset
for marketing. Another developer suggested a 10‐minute walking distance was marketable, but
noted that a parking variance was not granted for two recent projects that were well within a
10‐minute walking distance of two SkyTrain stations.
5.1.5 Construction Cost per Parking Stall
The average construction cost per parking stall in a structure was noted to be in the range of
$20,000‐$45,000, depending on site conditions and whether the parkade is above grade or
below grade. The marginal cost typically increases significantly with the depth of excavation,
particularly in areas with challenging geo‐technical conditions, such as downtown Vancouver. All
developers recognize that while it may be attractive to reduce the number of unnecessary
parking stalls, the situation is much more nuanced and challenging in practice. One developer
typically sells surplus unassigned parking stalls at cost. Another developer caps the selling price
to $15,000 and absorbs the loss.
The developers described the lumpiness of parking. A floor of parking (or in some cases half
floor depending on the design of the parking structure and ramps) is either built or not built – a
partial floor is not possible. If the parking regulations allow for a reduction in parking per
apartment unit but the total supply still requires a certain number of floorplates, the developer
would likely build the full floorplate. Building and parking facility design issues are very site
specific, thus greatly influencing the potential impact of parking regulation changes on the
number of parking floorplates provides.
5.1.6 Determining Market Acceptability
Developers build what they believe they can sell, and felt strongly that they know how to deliver
the right amount of parking. However, none of the developers interviewed conduct formal
post‐occupancy parking surveys of their projects to supplement future design decisions. One
developer does have a program to sell surplus parking and this provides some quantitative
evidence. Otherwise, it would appear many decisions related to parking are governed primarily
by municipal parking requirements, general expectations about customer preferences, generally

The Metro Vancouver Apartment Parking Study, Technical Report
September 2012 Page 27
accepted practices and assumptions from past projects, and, in some instances, by traffic impact
studies.
Another consideration expressed by a developer is that investor buyers tend to want parking
associated with an apartment unit to meet the perceived parking needs of renters and/or to
protect future resale values. A greater requirement for parking is also prevalent in the luxury
apartment segment where vehicle ownership rates are higher than average.
There was some recognition by the developers that it is possible to market apartments with no
parking stalls, but the perception is that this market is limited to small bachelor suites located
close to transit, and amenities such as downtown Vancouver. One developer who specializes in
townhouse projects cited that for projects South of Fraser, two stalls per household are usually
assumed.
When asked about options such as unbundled parking – where the cost of the parking stall is
sold separately from the apartment unit – developers indicated that it is not a common practice.
Most developers bundle and assign one parking stall as part of the apartment base price, with
some offering the opportunity to purchase a second stall if surplus stalls remain. The sale price
for the surplus parking stall is often at cost or sometimes even below cost, and sold on a first
come / first serve availability basis. One developer stated they are more likely to unbundle
parking for lower‐priced apartment units.
5.1.7 Transportation Demand Management Measures
Most of the developers have experience supporting alternatives to driving through the provision
of on‐site bicycle storage facilities, car share programs, and providing transit passes. Many
municipalities are increasingly interested in requiring them. Providing on‐site bicycle storage
facilities for both residents and visitors is common, although usually not in lieu of parking stalls.
One issue cited was that bicycle storage facilities are usually required on the floor closest to the
parkade entrance, which is the most valuable space for vehicle access.
An emerging TDM measure is the car share program. In some cases, the developer and
municipality negotiate a voluntary reduction such as five parking stalls for the provision of one
car share car and stall. Most of the noted challenges were related to the administration and
management of the 3rd party car share vehicle, including having the vehicle and parking facility
accessible to all car share program members rather than limiting access to building residents.
Another emerging TDM measure is the provision of transit passes to residents. A developer
cited a couple of municipalities requesting one transit pass per housing unit for up to two years
as part of some recent projects. The developer noted that one municipality asked for transit
passes, car share stalls, and enhanced pedestrian facilities in lieu of parking.

The Metro Vancouver Apartment Parking Study, Technical Report
September 2012 Page 28
What was inferred from the responses was that there was no monitoring, whether by
municipalities or developers, of actual resident behaviour after occupancy to validate whether
these TDM measures are well‐used or effective in shedding vehicle trips or shedding cars. This is
a significant gap.
5.1.8 Financing Considerations
Generally for apartment projects, project financiers do not examine project details such as
whether sufficient parking has been supplied. There is an implicit trust by lenders that
developers are best positioned to make these detail project decisions. Although not posed to
the interviewees, it may be the case that for apartment/commercial mixed‐use projects, the
commercial parking component may indeed be influenced by corporate standard development
formulae and project financiers. As large‐scale mixed‐use projects become increasingly popular,
in particular near transit, the criteria and formulae for parking requirements will be an
important area for further investigation.
5.2 Municipal Planners in Metropolitan Vancouver In the spring of 2011, a questionnaire was sent to all municipalities in the region. The
questionnaire asked about current parking regulations and process to review regulations,
provisions for reductions in certain circumstances, and possible transportation incentives in lieu
of parking (see Appendix 4 for the questionnaire).
Responses were received from 11 municipalities. Based on the limited responses received, the
following general comments about municipal parking regulations from the perspective of the
municipality were concluded:
Most respondents receive regular requests for variances from developers. Variance is
granted on a case‐by‐case basis. Municipalities usually require a traffic impact study
completed by the applicant’s consultant in order to make an informed decision about
granting a parking variance. The municipality may also request appropriate transportation
demand management measures by the developer if reduced parking is granted.
Few municipalities consider on‐street parking availability when determining on‐site parking
requirements. One obvious concern is that currently free street parking spaces could
potentially be eliminated (or become regulated) in the future and are for the general public
and not designated for any specific development.
Most municipalities require the developer to provide on‐site bicycling parking for residents
and encourage further amenities that offer alternatives to driving.
Municipal parking requirements are not regularly reviewed or amended, although there is
emerging recognition that sites near rapid transit and in Urban Centres should have lower
minimum parking requirements.

The Metro Vancouver Apartment Parking Study, Technical Report
September 2012 Page 29
5.3 Interview with City of Seattle Planning Staff In March 2011, Metro Vancouver staff met with planning staff at the City of Seattle.25 This
meeting covered discussions about the allowable reductions in parking in Seattle, including its
zero parking for apartments and townhouses in locations with frequent transit. Staff also visited
several recently‐built townhouse sites.
Seattle has revised its zoning code, including the parking element, several times over the past
decade. Prior to 2010, the city had a zero minimum parking requirement in effect for multi‐
residential developments in urban centres or designated transit station areas. The most recent
code revision in 2010 had the net effect of expanding the zero minimum parking requirement to
include multi‐residential developments within the smaller‐scale urban villages and within 400
metres of a frequent transit stop (the previous code affected developments within urban
centres and designated transit station areas only). In addition, parking minimum requirements
were lowered for multi‐residential development serving low‐income elderly and disabled
residents.26 No maximum parking allowances are stipulated.
Interestingly, some of the key drivers behind the 2010 amendments were to improve the design
of townhouses, increase housing affordability by encouraging other forms of low‐density multi‐
residential development beyond townhouses, and to better accommodate parking in
neighbourhoods.27
As part of the process to adopt these codes with reduced parking, Seattle staff identified key
factors that helped the passage of these progressive regulations:
The timing was good insofar public awareness of global climate change became more common and the recognition that automobile use should be discouraged in favour of transit, cycling, and walking became more entrenched.
The Seattle City Council was generally supportive, but staff noted a generational split among Seattle stakeholders in support for parking reductions, with the younger and more urban generation tending to be more supportive and the older generation more resistant.
Residential developers were generally supportive of the parking revisions because it allowed for a market‐based approach to providing parking based on experience and perceived market demand.
25 Mary Catherine Snyder, Parking Strategist, Seattle Department of Transportation; Mike Podowski, Supervisor, Seattle Department of Planning and Development; Dennis Meier, Senior Urban Designer, Seattle Department of Planning and Development. 26 In multi-residential and commercial zones, the minimum parking requirement for all uses was reduced by 20 percent if the use is located with 1,320 feet of a street with frequent transit service. In industrial zones, the minimum parking requirement for a non-resident use is reduced by 15 percent if the use is within 1,320 feet of a street with frequent transit service. 27 Townhouse development is the predominant form of new multi-residential development in Seattle outside of downtown.

The Metro Vancouver Apartment Parking Study, Technical Report
September 2012 Page 30
Seattle staff emphasized that to build confidence in the implementation of these regulatory changes, generally strong data/evidence along with parking requirements and on‐street parking management are required.
According to Seattle planners, the past experience with the zero minimum parking requirement
was that developments in downtown and in the Pike‐Pine neighbourhood just east of downtown
were built with 0.75 stall per unit, ranging from 0.6 for rental buildings to 1 for condominium
buildings. Also, parking tends to be unbundled from rental units, with tenants paying separately
for parking in their building.
It should be noted that there is no formal agreement between the City and the two major
transit operators, King County Metro and Sound Transit, to ensure existing frequent service will
remain at current levels or expectations that certain routes will be upgraded to frequent service
levels in the future.
5.4 City of Toronto Interviews Metro Vancouver staff interviewed a Toronto‐based transportation consultant with expertise in
Toronto’s multi‐residential development market28. The consultant noted that in Toronto most
new apartment units are sold with unbundled parking, with each stall sold separately for
$40,000‐50,000. Unlike current practices in metropolitan Vancouver, developers in Toronto
may request a parking reduction variance to construct less parking if after the pre‐sale period
fewer parking stalls are required than originally assumed. Apparently, there is no risk of
significant delay for the applicant.
The consultant was also involved in the design of the 315‐unit zero parking project at the former
Royal Canadian Military Institute site near a subway station in downtown Toronto. The project
is on an unusually small property which would have caused design challenges if a parkade were
to be constructed. The average apartment size is 500 sqft. Council approved the project with
no parking against the recommendation of city staff who were concerned about potential
parking spillover impacts and precedence29. Ultimately, Council was convinced that the
occupants will be those who live and work in downtown, and therefore will have little to no
need to own a vehicle. The building will have eight carshare spaces and one bicycle stall for
each unit. The project will be completed by 2013.
An interview with the city’s zoning manager was also conducted on several topics, including
parking variances, and trends in car ownership and carsharing.30 City staff have been somewhat
resistant to accommodating requests from developers to vary parking requirements based on
pre‐sales data. It is believed that in some instances developers set the price of a parking stall
above cost, which then deters some consumers from purchasing a stall even though they may
require parking now or in the future.
28 Ralph Bond, Senior Vice-President, BA Group Transportation Consultants. 29 The original staff report can be found here: http://www.toronto.ca/legdocs/mmis/2009/te/bgrd/backgroundfile-21943.pdf 30 Klaus Lehmann, Manager of Zoning Bylaw, City of Toronto.

The Metro Vancouver Apartment Parking Study, Technical Report
September 2012 Page 31
It was also noted by city staff that reduced parking requirements may be quite suitable for
younger households, but for older households downsizing from a suburban house, they may be
bringing along their vehicles and therefore require parking stalls.
Regarding carshare programs, the city’s zoning bylaw does not have provisions for requiring
carshare vehicles or stalls. These features can be negotiated. City staff prefers carshare vehicles
be parked on adjacent streets or public parkades where members can easily access them. City
staff is less supportive of carshare vehicles that are parked within the building for the exclusive
use of the building’s residents because the membership within the building may not be
sufficiently large to sustain the financial sustainability of the vehicle for the long term.
5.5 Key Lessons Learned Based on the key informant interviews, there appears to be opportunities to explore parking reductions in apartments in the region, particularly in urban centres and areas well served by transit. 1. Amongst developers, there was no consensus on whether current parking requirements in
the region are reasonable; some developers saw room for reductions, others saw risks.
2. Current visitor parking requirements are generally seen by developers as too high.
3. Parking costs are usually included in the apartment purchase price, while in Seattle and
Toronto, unbundled parking is the accepted norm.
4. Frequent bus service is typically not a consideration in parking supply decisions (Seattle and
Portland being the exception).
5. Municipal parking bylaws are not regularly reviewed and amended.
6. Municipalities allow for negotiations with developers and variances from bylaw
requirements, but developers expressed their reluctance to push the envelope on
requesting variances due to the spectre of approval delays.
7. In Toronto, the market demand for parking is established through the pre‐sales period, after
which the developer can request parking reduction variances from the city.
8. Municipalities will have to be the impetus for change through updates to parking bylaws and
development approval processes.

The Metro Vancouver Apartment Parking Study, Technical Report
September 2012 Page 32
6 Parking Facility Survey and Household Survey Methodology
The primary objective of the Metro Vancouver Apartment Parking Study was to establish an
evidence base of residential parking supply and peak residential parking demand based on data
collected in this region. To facilitate this objective, two surveys were conducted in the Fall of
2011. The surveys yielded a rich dataset for analysis.
The Parking Facility Survey recorded direct observations of residential parking demand
in select apartment parkades across the region.
The Household Survey collected responses to a survey distributed to households
residing in the same buildings to capture additional data, such as household vehicle
access (ownership or lease) and visitor parking experiences.
6.1 Site Selection The survey sites were selected based on several criteria: representation from across the region;
building age; building tenure; and, proximity to TransLink’s Frequent Transit Network. The same
buildings were sought for both surveys. Several sites were dropped from the Parking Facility
Survey either because the strata council changed its mind about participating in the study late in
the process, or logistical reasons arose which prevented the surveyors from accessing the sites.
Similarly, several sites were included in the Parking Facility Survey, but not in the Household
Survey due to the inability to obtain a complete mailing list of all the dwelling units. Ultimately,
80 sites were confirmed for the Parking Facility Survey, and 90 for the Household Survey (see
Appendix 6).
Criterion 1: Representation from across the region
Having a broad‐based representation of sites from across the region was important because the
applicability of any lessons learned or patterns revealed would be limited to how confident one
could make broader conclusions given the diversity between subregions. For example, lessons
learned in downtown Vancouver may or may not have immediate applicability for communities
in other subregions.
In early 2011, an initial long list of over 300 properties was identified through Internet searches,
property management companies, and referrals by several of the developers and municipal
planners whom staff interviewed. Through a combination of communicating directly with
property managers and strata councils, a short list of sites was confirmed in August 2011.

The Metro Vancouver Apartment Parking Study, Technical Report
September 2012 Page 33
Table 5. Distribution of Survey Sites by Subregion
Subregion
Number of Sites in
Parking Facility
Survey
Number of Sites in
Household
Survey
Burnaby/NW 18 19
North Shore 6 6
Northeast Sector (incl. Pitt Meadows/Maple Ridge) 10 14
Richmond 9 11
Surrey/Delta/White Rock/Langley 10 10
Vancouver/UBC (excluding Metro Core Peninsula) 19 23
Metro Core Peninsula 8 7
Total 80 90
Criterion 2: Proximity to the Frequent Transit Network (FTN)
A central hypothesis of the study was that proximity to transit (and various levels of transit
service) will have a measurable relationship with vehicle access (ownership or lease) and parking
demand. In order to facilitate this line of inquiry, sites were selected based on their proximity to
TransLink’s Frequent Transit Network31.
Note that in some of the analysis, the “FTN Station Only” and “FTN Bus and Station” are lumped
together as “FTN Station”. Sites in the “FTN Station Only” group are located in Burnaby and
Surrey.
Table 6. Distribution of Survey Sites by Proximity to the Frequent Transit Network
Proximity to the 2011 Frequent Transit Network Number of Sites in
Parking Facility
Survey
Number of Sites in
Household Survey
FTN Bus Only
(within 400 metres of a Frequent Bus stop)
24 30
FTN Station Only
(within 800 metres of a SkyTrain or SeaBus station)
11 11
FTN Bus and Station
(close to both a Frequent Bus stop and
SkyTrain/SeaBus station)
29 31
Beyond FTN 16 18
Total 80 90
31 The FTN is a network of corridors along which transit service is provided at least every 15 minutes in both directions throughout the day and into the evening, every day of the week. This 15 minute or better service is provided at least from 6am-9pm on weekdays, 7am-9pm on Saturdays and 8am-9pm on Sundays. The FTN does not refer to specific routes or technologies or vehicle types; rather it refers to a high frequency and span of transit service within a corridor. This level of service may be provided by a single route or by a combination of multiple routes and/or technologies within the same corridor.

The Metro Vancouver Apartment Parking Study, Technical Report
September 2012 Page 34
Figure 4. Household Survey Sites relative to 2011 Frequent Transit Network
Me
tro
Co
re
Me
tro
tow
n
Ed
mo
nd
s M
TC
Su
r re
y M
etr
o C
en
tre
Ric
hm
on
d R
egio
na
l Cit
y C
entr
e
Co
qu
itla
m R
eg
ion
al C
ity
Ce
ntr
e
Gu
ild
ford
MT
C
Lan
gle
y R
eg
i on
al
City
Ce
ntr
e
Ne
wto
n M
TC
Bre
n tw
oo
d M
TC
Oa
kri
dg
e M
TC
Lo
ns
da
le R
eg
ion
al C
ity
Ce
ntr
e
Pit
t M
ead
ow
s M
TC
Inle
t C
en
tre
MT
C
Lad
ner
MT
C
Ma
ple
Rid
ge
Reg
ion
al C
ity
Cen
tre
Po
rt C
oq
uit
lam
MT
C
Flee
two
od
MTC
Clo
verd
ale
MT
C
Wil
lou
gh
by
MT
C
Ne
w W
estm
inst
er
Do
wn
tow
n
Sem
iah
mo
o M
TC
Am
ble
sid
e M
TC
Lou
gh
eed
MT
C
Lyn
n V
alle
y M
TC
Pro
per
ties
FT
N P
rox
imit
y
FT
N B
us
On
ly
FT
N S
tatio
n O
nly
FT
N B
us
an
d S
tatio
n
Be
yon
d F
TN
Fre
qu
en
t Tra
nsi
t Ne
two
rk

The Metro Vancouver Apartment Parking Study, Technical Report
September 2012 Page 35
Figure 5. Parking Facility Survey Sites relative to 2011 Frequent Transit Network
Me
tro
Co
re
Me
tro
tow
n
Ed
mo
nd
s M
TC
Su
rre
y M
e tro
Ce
ntr
e
Ric
hm
on
d R
egio
nal
Ci t
y C
entr
e
Co
qu
itla
m R
eg
ion
al
Cit
y C
en
tre
Gu
ildf o
rd M
TC
Lan
gle
y R
eg
ion
al
Cit
y C
en
tre
Ne
wto
n M
TC
Bre
ntw
oo
d M
TC
Oa
kri
dg
e M
TC
Lo
ns
da
le R
egi
on
al C
ity
Ce
ntre
Pit
t M
ead
ow
s M
TC
Inle
t C
en
tre
MT
C
La
dne
r M
TC
Ma
ple
Rid
ge
Reg
ion
al C
ity
Cen
tre
Po
rt C
oq
uit
lam
MT
C
Flee
two
od
MTC
Clo
verd
ale
MT
C
Wil
lou
gh
by
MT
C
Ne
w W
estm
inst
er
Do
wn
tow
n
Sem
iah
mo
o M
TC
Am
ble
sid
e M
TC
Lou
gh
eed
MT
C
Lyn
n V
alle
y M
TC
Pro
per
ties
FT
N P
rox
imit
y
FT
N B
us
On
ly
FT
N S
tatio
n O
nly
FT
N B
us
an
d S
tatio
n
Be
yon
d F
TN
Fre
qu
en
t Tra
nsi
t Ne
two
rk

The Metro Vancouver Apartment Parking Study, Technical Report
September 2012 Page 36
Criterion 3: Building Age
Most of the survey sites were built recently to best represent current municipal parking bylaws
and development approval practices. Over 80 percent of the sites selected were built within the
past 12 years. The pre‐2000 sites were mainly purpose‐built market and non‐market rental
sites.
Table 7. Distribution of Survey Sites by Building Age
Building Age Number of Sites in Parking
Facility Survey
Number of Sites in Household
Survey
Pre‐2000 (1982‐1999) 15 14
2000‐2006 19 22
2007‐2010 46 53
Total 80 90
Criterion 4: Building Tenure
The vast majority of surveyed sites were strata. This composition was intentional because strata
buildings make up nearly all the multi‐residential starts in the region and represent the main
source of new rental housing in the region. The non‐market sites included two Metro
Vancouver Housing Corporation sites and two housing co‐ops.
Table 8. Distribution of Survey Sites by Building Tenure
Building Tenure Number of Sites in Parking
Facility Survey
Number of Sites in Household
Survey
Strata 67 76
Market Rental 9 8
Non‐Market Rental 4 6
Total 80 90

The Metro Vancouver Apartment Parking Study, Technical Report
September 2012 Page 37
6.2 Parking Facility Survey Design and Conduct The Parking Facility Survey was conducted between September 19 and November 3, 2011 by
Acuere Consulting Ltd. Generally, the surveyors initiated access to the parkades after 10PM on
a weeknight, Monday through Thursday. Seventy‐two sites were observed once only. Eight
sites were observed twice to assess the variability of residential parking demand on two
different nights. Three sites were observed on a single Saturday in November at four different
time periods to assess the magnitude and variability of visitor parking demand.
Metro Vancouver staff provided Acuere Consulting with the appropriate contact person at each
site, whether a strata council member, property manager, or on‐site caretaker. The scheduling
and conduct of the surveys were executed by Acuere Consulting. The data was transmitted to
Metro Vancouver in December 2011.
6.3 Adjustments for Survey Time and Building Occupancy All surveys contain varying degrees of measurement error. While the intent of the Parking
Facility Survey was to capture the peak residential parking demand rate (the number of parked
vehicles divided by the number of dwelling units in the building), two adjustments to the raw
data were deemed necessary in order to not artificially undercount parking demand.
The first adjustment factor affects the numerator in the parking demand rate formula. On any
given night, it can be expected that some residents return home very late at night or in the next
morning or have driven out of town for business or vacation. As shown in Table 9, the raw
observations of parking occupancy (percent of stalls occupied by a car or truck) increased later
in the night. Based on this pattern, conservative adjustment factors were applied to the number
of occupied parking stalls for each site.
Table 9. Parking Facility Survey Start Time
Survey Start Time Number of Sites Average Parking
Occupancy (Raw)
Parking Occupancy
Adjustment Factor
9PM‐9:59PM 6 61% +10%
10PM‐10:29PM 54 58% +10%
10:30PM‐10:59PM 10 65% +5%
11PM and Later 10 67% +3%
The second adjustment affects the denominator in the parking demand rate formula. It is
expected that there will exist a small proportion of units in each site that are unoccupied for
various reasons. Some units may have been vacant because the owners are part‐time residents
or that the units were on the market for sale or rent with no one living in them. In order to
minimize this error, electricity consumption data was obtained from BC Hydro on the sites, but
aggregated at the subregional level. Units that consumed 100 kWh or less of electricity per
month was deemed in this study to be vacant (BC Hydro staff originally recommended using a
threshold of 75 kWh, but Metro Vancouver staff decided to err on the side of having more

The Metro Vancouver Apartment Parking Study, Technical Report
September 2012 Page 38
vacant stalls by using the “lower” threshold of 100 kWh). Using data from September and
October 2011, adjustments were made to the strata sites. For market and non‐market sites,
actual or estimates of occupancy rates were obtained directly from the property managers.
Table 10. Estimated Percent of Vacant Strata Units During Survey Period
Subregion September and
October 2011
Average
Parking Vacancy
Adjustment
Factor
Burnaby 5.3% +6%
New Westminster32 6.6% +7%
North Shore 7.2% +8%
Northeast Sector+ 4.7% +5%
Richmond/Delta33 7.7% +8%
Surrey/White Rock/Langleys 6.5% +7%
Vancouver/UBC 5.8% +6%
Metro Core Peninsula 7.0% +8%
6.4 Household Survey Design and Conduct The Household Survey was conducted between October 13 and November 22, 2011. Metro
Vancouver staff and Acuere Consulting developed the survey questionnaire. An invitation letter,
unique code, and survey questionnaire were distributed to all dwelling units in the study via
First Class lettermail (no return postage was included). Residents were provided an opportunity
to respond either by mail or through a web‐based form designed by Acuere Consulting.34
The survey questionnaire comprised 14 questions asking residents about the number of vehicles
and parking stalls they have, their parking habits, visitor parking experiences, participation in
carshare programs, use of on‐site bicycle storage facilities, locational preferences, willingness to
forego parking stalls, the number of bedrooms in their unit, the square footage of their units,
and the demographics of their household members. Respondents were also given an
opportunity to provide additional comments. The web‐based form contained logic checks to
maximize the number of completed surveys and minimize the amount of manual data validation
required. The data, with all personal information removed, was transmitted to Metro
Vancouver in mid‐December.
32 Electricity data was obtained directly from the City of New Westminster, which distributes and administers electricity for its residents and commercial/business customers. 33 In the original list of sites provided to BC Hydro, the lone survey site in Delta was categorized within the “Richmond/Delta” group. 34 Respondents were eligible to be entered into a draw for one of three prize bundles, each worth approximately $250. Acuere Consulting was successful in securing one monthly transit pass from TransLink and one giftcard from Vancity Credit Union for inclusion in the gift bundles. The remaining costs were covered under the consultant contract.

The Metro Vancouver Apartment Parking Study, Technical Report
September 2012 Page 39
6.5 Survey Returns Over 1,500 households responded to the Household Survey. While the overall response rate of
13 percent was modest, the large number of responses allow for comprehensive and
disaggregated data analysis. Tables 11 and 12 show the total and returned surveys.
Higher response rates could have been achieved by mailing reminder postcards, sending out a
second wave of invitation letters and survey questionnaires, and perhaps providing
opportunities to respond in other languages given the known ethnic composition in specific
subareas of the region. As an alternative, Metro Vancouver staff requested property managers,
on‐site caretakers, or strata council members to post‐up a notice in the common areas to
remind residents to complete the survey or to contact Metro Vancouver staff if they had
misplaced the survey questionnaire. Approximately 60 sites agreed to post a reminder notice.
Table 11. Household Survey Responses
Household Survey Number
Surveys Distributed 12,221
Web‐based Form Responses 1,382
Mail‐back Responses 175
Total Responses (response rate) 1,557 (12.7%)
Table 12. Household Survey Responses by Subregion
Subregion
Completed
Surveys
Partially
Completed
Surveys35
Surveys
Distributed Response
Rate
Burnaby/NW 382 4 2,600 14.8%
North Shore 101 0 636 15.9%
Northeast Sector+ 189 2 1,509 12.7%
Richmond 215 4 2,111 10.4%
Surrey/Delta/White Rock/Langley 122 1 1,336 9.2%
Vancouver/UBC 533 1 4,029 13.3%
Total 1,542 15 12,221 12.7%
35 Includes three partially completed mail-back surveys but no information on municipality.
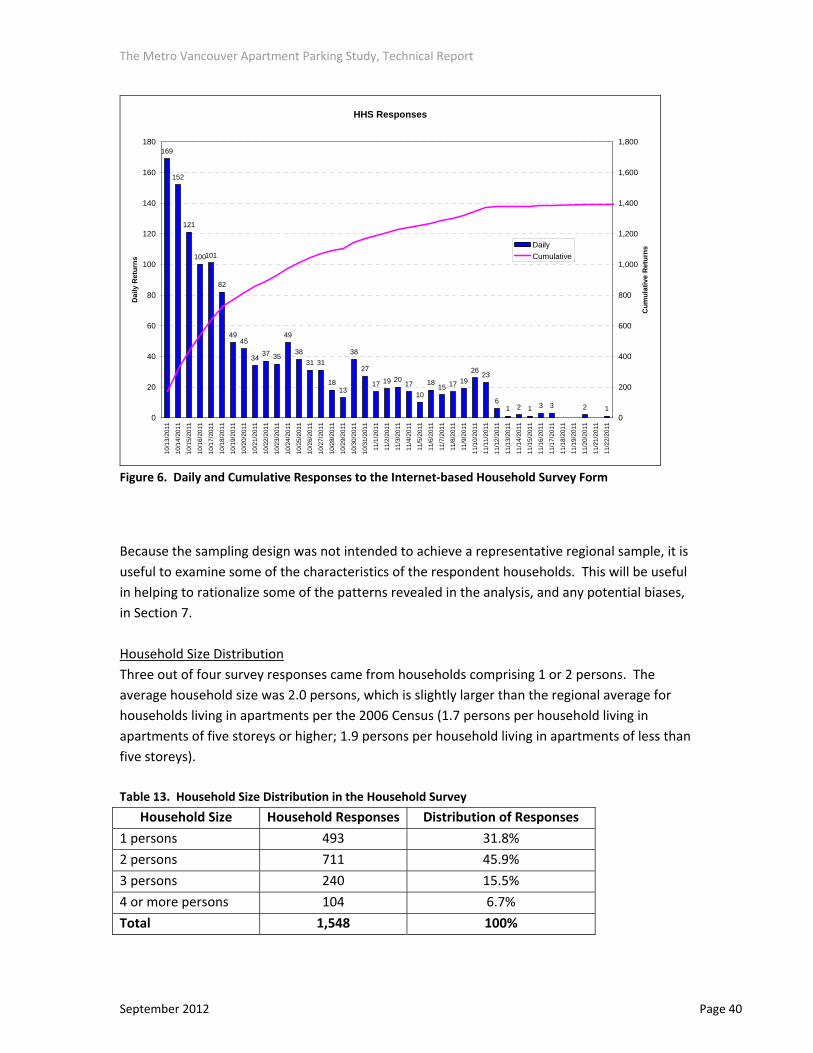
The Metro Vancouver Apartment Parking Study, Technical Report
September 2012 Page 40
HHS Responses
169
152
121
100101
82
4945
3437 35
49
38
31 31
1813
38
27
17 19 2017
10
1815 17 19
2623
61 2 1 3 3 2 1
0
20
40
60
80
100
120
140
160
180
10/1
3/20
11
10/1
4/20
11
10/1
5/20
11
10/1
6/20
11
10/1
7/20
11
10/1
8/20
11
10/1
9/20
11
10/2
0/20
11
10/2
1/20
11
10/2
2/20
11
10/2
3/20
11
10/2
4/20
11
10/2
5/20
11
10/2
6/20
11
10/2
7/20
11
10/2
8/20
11
10/2
9/20
11
10/3
0/20
11
10/3
1/20
11
11/1
/201
1
11/2
/201
1
11/3
/201
1
11/4
/201
1
11/5
/201
1
11/6
/201
1
11/7
/201
1
11/8
/201
1
11/9
/201
1
11/1
0/20
11
11/1
1/20
11
11/1
2/20
11
11/1
3/20
11
11/1
4/20
11
11/1
5/20
11
11/1
6/20
11
11/1
7/20
11
11/1
8/20
11
11/1
9/20
11
11/2
0/20
11
11/2
1/20
11
11/2
2/20
11
Da
ily
Re
turn
s
0
200
400
600
800
1,000
1,200
1,400
1,600
1,800
Cu
mu
lati
ve
Re
turn
sDaily
Cumulative
Figure 6. Daily and Cumulative Responses to the Internet‐based Household Survey Form
Because the sampling design was not intended to achieve a representative regional sample, it is
useful to examine some of the characteristics of the respondent households. This will be useful
in helping to rationalize some of the patterns revealed in the analysis, and any potential biases,
in Section 7.
Household Size Distribution
Three out of four survey responses came from households comprising 1 or 2 persons. The
average household size was 2.0 persons, which is slightly larger than the regional average for
households living in apartments per the 2006 Census (1.7 persons per household living in
apartments of five storeys or higher; 1.9 persons per household living in apartments of less than
five storeys).
Table 13. Household Size Distribution in the Household Survey
Household Size Household Responses Distribution of Responses
1 persons 493 31.8%
2 persons 711 45.9%
3 persons 240 15.5%
4 or more persons 104 6.7%
Total 1,548 100%
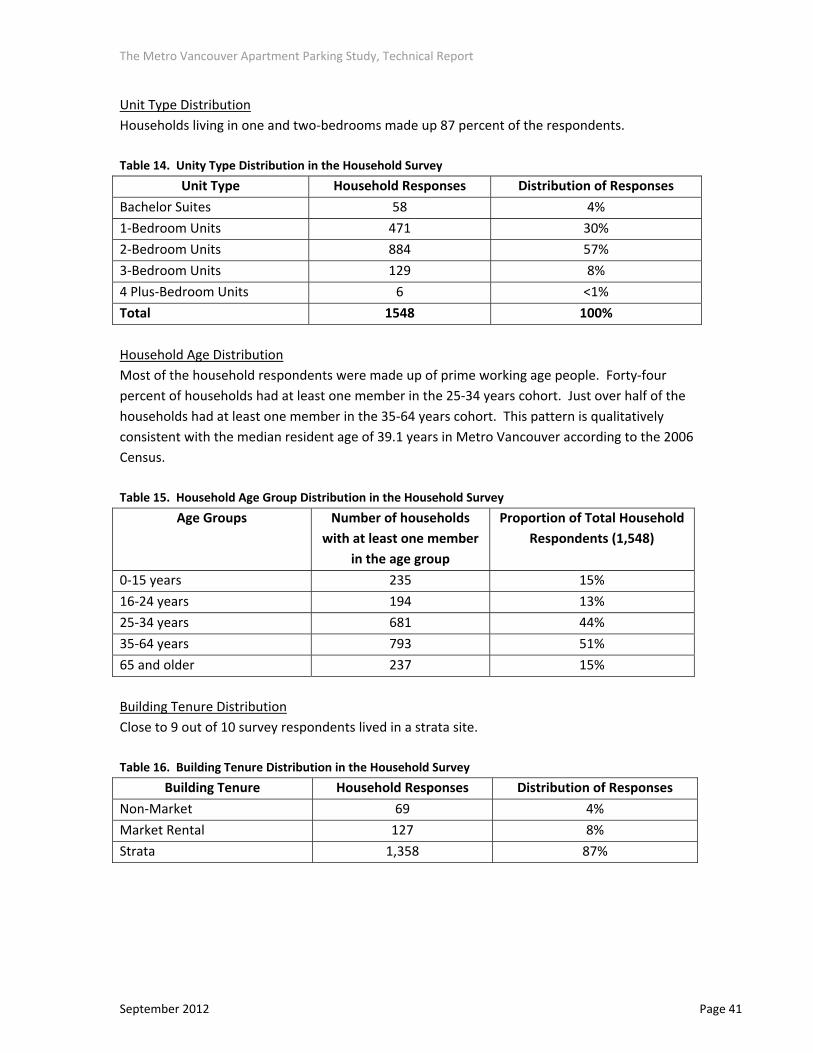
The Metro Vancouver Apartment Parking Study, Technical Report
September 2012 Page 41
Unit Type Distribution
Households living in one and two‐bedrooms made up 87 percent of the respondents.
Table 14. Unity Type Distribution in the Household Survey
Unit Type Household Responses Distribution of Responses
Bachelor Suites 58 4%
1‐Bedroom Units 471 30%
2‐Bedroom Units 884 57%
3‐Bedroom Units 129 8%
4 Plus‐Bedroom Units 6 <1%
Total 1548 100%
Household Age Distribution
Most of the household respondents were made up of prime working age people. Forty‐four
percent of households had at least one member in the 25‐34 years cohort. Just over half of the
households had at least one member in the 35‐64 years cohort. This pattern is qualitatively
consistent with the median resident age of 39.1 years in Metro Vancouver according to the 2006
Census.
Table 15. Household Age Group Distribution in the Household Survey
Age Groups Number of households
with at least one member
in the age group
Proportion of Total Household
Respondents (1,548)
0‐15 years 235 15%
16‐24 years 194 13%
25‐34 years 681 44%
35‐64 years 793 51%
65 and older 237 15%
Building Tenure Distribution
Close to 9 out of 10 survey respondents lived in a strata site.
Table 16. Building Tenure Distribution in the Household Survey
Building Tenure Household Responses Distribution of Responses
Non‐Market 69 4%
Market Rental 127 8%
Strata 1,358 87%

The Metro Vancouver Apartment Parking Study, Technical Report
September 2012 Page 42
Resident Tenure Distribution
Two out of three survey responses came from households who owned and occupied their
dwellings. This is consistent with the fact that the vast majority of sites in the study were
condominiums. In contrast, the 2006 Census counted 41 percent of apartment dwellers – strata
or rental – as owner‐occupiers versus 59 percent renters. Also, of the apartments built between
2001 and 2006, 58 percent are occupied by owners and 42 percent are occupied by renters
(2006 Census). Altogether, the evidence suggests a degree of over‐representation in the survey
by owner‐occupied households.
Table 17. Resident Tenure Distribution in the Household Survey
Resident Tenure Household Responses Distribution of Responses
Owner‐Occupied 1,049 68%
Renter‐Occupied 505 32%
When controlling for strata sites only in the Household Survey, the distribution of household
responses is even more tilted towards owner‐occupiers.
Table 18. Resident Tenure Distribution of Strata Sites in the Household Survey
Tenure for Household Survey
Respondents in Strata Sites
Only
Households Responses Distribution of Responses
Owner‐Occupied 1,047 77%
Renter‐Occupied 308 23%
Vehicles Per Household
In strata sites, owner‐occupied households have more vehicles on average than do renter
households.
Table 19. Comparison of Vehicles Per Household by Resident Tenure in Strata Sites
Owner‐Occupied Unit in
Strata Site
Renter‐Occupied Unit in
Strata Site
Households Responding 1,047 308
Vehicles Per Household 1.30 1.19
Parked Vehicles Per DU 1.17 1.07

The Metro Vancouver Apartment Parking Study, Technical Report
September 2012 Page 43
Frequent Transit Network Distribution
A broad representation of households residing close to or far away from the Frequent Transit
Network was attained.
Table 20. Distribution of Responses by Proximity to the Frequent Transit Network
Proximity to FTN Household Responses Distribution of Responses
Beyond FTN 309 20%
FTN Bus Only 463 30%
FTN Station Only 197 13%
FTN Bus and Station 585 38%

The Metro Vancouver Apartment Parking Study, Technical Report
September 2012 Page 44
7 Parking Facility Survey and Household Survey Data Analysis
The value of the Parking Facility Survey and Household Survey is the ability to bracket the range
of parking demand and to explore various relationships between household vehicle access,
parking demand, parking supply, and other factors.
7.1 Residential Parking Supply and Demand by Building Tenure The following tables present parking supply and demand results from the two surveys. There is
a high degree of consistency between the sets of parking supply numbers. In contrast, there is a
greater degree of variance between the two sets of parking demand numbers. One possible
reason, as alluded to previously, is the potential bias in the Household Survey from an over‐
representation of owner‐occupied households who tend to have more vehicles than do renter
households. Another possible reason is that the Parking Facility Survey, even after making the
adjustments, may be capturing residents who bought one or two extra parking stalls for
personal visitor parking or for other reasons, including future use. Therefore, in the first two
tables below, the parking oversupply is presented as a range.
In general, parking supply, parking demand, and the number of vehicles per household all tend
to increase with the tenure ladder. Residents of the surveyed purpose‐built market or non‐
market rental sites tend to have on average less than one vehicle per household. These results
are consistent with the patterns observed in the Toronto study (see Section 3.2).
Table 21. Residential Parking Supply and Demand by Building Tenure (HHS=Household Survey;
PFS=Parking Facility Survey)
Building Tenure
Type
Stalls
Per DU
(HHS)
Stalls
Per DU
(PFS)
Vehicles per
Household
(HHS)
Parked
Vehicles per
DU (HHS)
Parked
Vehicles per
DU (PFS)
Parking
Oversupply
Range
Non‐Market 0.90 0.94 0.81 0.67 0.73 29‐34%
Market Rental 0.82 0.99 0.83 0.72 0.58 14‐71%
Strata 1.35 1.32 1.27 1.14 0.98 18‐35%
All Sites 1.28 1.27 1.21 1.09 0.92 17‐38%

The Metro Vancouver Apartment Parking Study, Technical Report
September 2012 Page 45
A similar pattern emerges when controlling for strata sites only. The variance between parking
supply and demand is consistently high across the region. Household respondents in the City of
Vancouver and UBC have on average the fewest number of vehicles per household.
Table 22. Residential Parking Supply and Demand in Strata Sites by Subregion
Surveyed
Strata Sites by
Subregion
Stalls
Per DU
(HHS)
Stalls
Per DU
(PFS)
Vehicles per
Household
(HHS)
Parked
Vehicles per
DU (HHS)
Parked
Vehicles Per
DU (PFS)
Parking
Oversupply
Range
Burnaby/NW 1.35 1.33 1.34 1.19 0.98 13‐36%
North Shore 1.38 1.28 1.33 1.19 1.04 16‐23%
Northeast Sector+ 1.55 1.50 1.40 1.24 1.17 25‐28%
Richmond 1.43 1.34 1.36 1.24 1.02 15‐31%
South of Fraser 1.28 1.35 1.27 1.12 0.98 14‐38%
Vancouver/UBC 1.24 1.29 1.09 1.02 0.94 22‐37%
Metro Core Peninsula 1.19 1.14 0.97 0.88 0.78 35‐46%
Total 1.35 1.32 1.27 1.14 0.98 18‐35%
Across the region, close to two out of three household respondents have one vehicle only.
Outside of Vancouver and UBC, up to one in three household respondents have two vehicles.
The City of Vancouver and UBC have the highest proportion of 0‐vehicle households. These
patterns are consistent with expectation.
Table 23. Distribution of 0, 1, 2, 3+ Vehicle Households by Subregion
Surveyed
Strata Sites by
Subregion
0‐Vehicle
Household
1‐Vehicle
Household
2‐Vehicle
Household
3‐Vehicle Plus
Household
Burnaby/NW (n=386) 3% 64% 30% 4%
North Shore (n=101) 3% 63% 32% 2%
Northeast Sector+ (n=191) 3% 57% 37% 3%
Richmond (n=219) 5% 58% 35% 3%
South of Fraser (n=123) 3% 68% 27% 2%
Vancouver/UBC (n=364) 20% 63% 16% 1%
Metro Core Peninsula (n=170) 26% 58% 13% 3%
Total 10% 62% 26% 2%

The Metro Vancouver Apartment Parking Study, Technical Report
September 2012 Page 46
7.2 Residential Parking Supply and Demand by the Frequent Transit
Network For the surveyed strata sites, parking demand and the number of vehicles per household tend to
be the lowest if a site is close to both a frequent bus stop and SkyTrain/SeaBus station. The
“ultimate” parking demand (i.e., number of vehicles per household) close to the Frequent
Transit Network generally does not exceed 1.3 vehicles per unit.
The number of vehicles per household and the parking demand between “FTN Bus Only” and
“FTN Station Only” are not statistically different, but the two parking supply results are
statistically different (Table 24)36. This observation corroborates with the interviews with key
informants that suggested a lack of recognition in practice by municipalities and developers of
the relationship between parking demand for sites close to frequent bus corridors. This pattern
persists even when sites located in the City of Vancouver and UBC were excluded (Table 25).
Table 24. Residential Parking Supply and Demand in Strata Sites by Proximity to the FTN
Geography Stalls
Per DU
(HHS)
Stalls
Per DU
(PFS)
Vehicles per
Household
(HHS)
Parked
Vehicles Per
DU (HHS)
Parked
Vehicles Per
DU (PFS)
Parking
Oversupply
Range
Beyond FTN 1.39 1.40 1.43 1.25 1.10 11‐27%
FTN Bus Only 1.41 1.43 1.27 1.14 1.05 24‐36%
FTN Station Only 1.28 1.26 1.28 1.16 0.95 10‐33%
FTN Bus and Station 1.30 1.23 1.15 1.06 0.89 23‐38%
All Sites 1.35 1.32 1.27 1.14 0.98 18‐35%
Table 25. Residential Parking Supply and Demand in Strata Sites by Proximity to the FTN, Excluding
Vancouver and UBC
Geography
(Strata sites excl.
CoV/UBC)
Stalls
Per DU
(HHS)
Stalls
Per DU
(PFS)
Vehicles per
Household
(HHS)
Parked
Vehicles Per
DU (HHS)
Parked
Vehicles Per
DU (PFS)
Parking
Oversupply
Range
Beyond FTN 1.39 1.40 1.43 1.25 1.10 11‐27%
FTN Bus Only 1.47 1.44 1.34 1.19 1.08 24‐34%
FTN Station Only 1.28 1.26 1.28 1.16 0.95 10‐33%
FTN Bus and Station 1.42 1.31 1.29 1.18 0.96 20‐36%
All Sites 1.40 1.36 1.35 1.20 1.03 17‐32%
36 A one-way between-groups analysis of variance was conducted to explore the impact of Frequent Transit Network proximity (four groups) on vehicles per household and stalls per unit for strata apartment sites using data from the Household Survey. However, the assumption of homogeneity of variance was violated as determined by Levene’s test. Therefore, the Welch and Brown-Forsythe tests were conducted and showed that there were statistical significant differences between groups at the p < 0.05 level. Post-hoc comparisons using the Games-Howell test indicated that the mean stalls per unit for “FTN Bus Only” was significantly different from “FTN Station Only”. Post-hoc comparisons using the Games-Howell test indicated that the mean vehicles per household for “FTN Bus Only” was not significantly different from “FTN Station Only”.

The Metro Vancouver Apartment Parking Study, Technical Report
September 2012 Page 47
7.3 Residential Parking Supply and Demand by Strata and Number of
Bedrooms The previous analyses were conducted at the “site‐level”. Equally important is to examine the
patterns at the apartment unit level, which is how many municipalities set their parking bylaws.
As shown in Table 26, parking supply, parking demand, and the number of vehicles per
households all increase with the number bedrooms (unit type). Households living in units with
bachelor suites and one‐bedroom units generally have at most one vehicle to park. Households
living in two‐bedroom units on average have fewer than 1.4 vehicles to park.
Table 26. Residential Parking Supply and Demand in Strata Sites by Unit Type
Unit Type
(Strata sites)
Household
Responses
Stalls Per DU
(HHS)
Vehicles Per DU
(HHS)
Parked Vehicles
Per DU (HHS)
Bachelor Suites 41 0.93 0.88 0.73
1‐Bedroom Units 390 1.11 1.09 0.96
2‐Bedroom Units 797 1.42 1.33 1.22
3‐Bedroom Units 118 1.84 1.57 1.37
4 Plus‐Bedroom
Units
3 Small
sample size
Small
sample size
Small
sample size
7.4 Residential Parking Supply and Demand by Strata, Number of
Bedrooms, and the Frequent Transit Network It is important to test the robustness of the relationship between parking demand and proximity
to the Frequent Transit Network at the “unit type level” (see Appendix 11 for analysis based on
apartment unit floorspace).
For 1‐bedroom apartment units, the number of vehicles per household and parking demand are
lower in sites close to the Frequent Transit Network. One‐bedroom units may be able to
support much lower minimum parking requirements than is typical in current parking bylaws.
Table 27. Residential Parking Supply and Demand in Strata One‐Bedroom Units
One‐Bedroom Strata
Geography
(Strata sites)
Household
Responses
Stalls Per DU
(HHS)
Vehicles per
Household (HHS)
Parked Vehicles
Per DU (HHS)
Beyond FTN 55 1.15 1.24 1.05
FTN Bus Only 122 1.10 1.09 0.90
FTN Station 213 1.11 1.05 0.96

The Metro Vancouver Apartment Parking Study, Technical Report
September 2012 Page 48
For 2‐bedroom units, the parking supply in sites near frequent bus corridors is statistically higher
than in sites near stations, even though the parking demands do not justify such a supply
variance37. Overall, two‐bedroom units near the Frequent Transit Network may be able to
support lower minimum parking requirements than is stipulated in current parking bylaws.
Table 28. Residential Parking Supply and Demand in Strata Two‐Bedroom Units
Two‐Bedroom Strata
Geography
(Strata sites)
Household
Responses
Stalls Per DU
(HHS)
Vehicles per
Household (HHS)
Parked Vehicles
Per DU (HHS)
Beyond FTN 229 1.39 1.45 1.26
FTN Bus Only 249 1.51 1.35 1.25
FTN Station 319 1.37 1.24 1.16
For 3‐bedroom units, the relationship between parking demand and proximity to the FTN is
inconsistent. Households living close to frequent bus corridors have the fewest number of
vehicles and lowest parking demand; households near stations have more vehicles and higher
parking demand. The inconsistency may be due to the smaller number of responses from 3‐
bedroom households or it may be evidence that beyond the 2‐bedroom threshold, the
relationship between parking demand and proximity to the FTN is counter‐influenced by other
factors.
Table 29. Residential Parking Supply and Demand in Strata Three‐Bedroom Units
Three‐Bedroom Strata
Geography
(Strata sites)
Household
Responses
Stalls Per DU
(HHS)
Vehicles per
Household (HHS)
Parked Vehicles
Per DU (HHS)
Beyond FTN 23 1.91 1.70 1.61
FTN Bus Only 47 1.79 1.40 1.23
FTN Station 48 1.85 1.67 1.40
It should be noted that about 1 in 10 strata households in the survey reported parking one or
more vehicles on a nearby street (see Appendix 13). Further investigation is warranted so that
effect parking management strategies can be prepared and that impacts on neighbourhoods can
be prevented or mitigated.
37 A one-way between-groups analysis of variance was conducted to explore the impact of Frequent Transit Network proximity (three groups) on vehicles per household and stalls per unit for strata two-bedroom units using data from the Household Survey. However, the assumption of homogeneity of variance was violated as determined by Levene’s test. Therefore, the Welch and Brown-Forsythe tests were conducted and showed that there were statistical significant differences between groups at the p < 0.05 level. Post-hoc comparisons using the Games-Howell test indicated that the mean stalls per unit for “FTN Bus Only” was significantly different from “FTN Station”. Post-hoc comparisons using the Games-Howell test indicated that the mean vehicles per household for “FTN Bus Only” was not significantly different from “FTN Station”.

The Metro Vancouver Apartment Parking Study, Technical Report
September 2012 Page 49
7.5 Market Rental Sites Because the sample size is smaller for the market rental household responses, disaggregated
analysis is limited. In general, observed parking demand does not exceed one vehicle. In
particular, the evidence suggests that market rental sites could support low minimum parking
requirements and/or parking maximums.
Table 30. Residential Parking Supply and Demand in Market Rental Sites by Proximity to the FTN
Surveyed Market
Rental Sites by FTN
Household
Responses
Stalls
Per
DU
(HHS)
Stalls
Per
DU
(PFS)
Vehicles
per
Household
(HHS)
Parked
Vehicles
Per DU
(HHS)
Parked
Vehicles
Per DU
(PFS)
Parking
Oversupply
Range
FTN Bus Only 35 0.97 1.12 1.00 0.91 0.82 7‐37%
FTN Bus and Station 92 0.76 0.94 0.77 0.65 0.48 17‐96%

The Metro Vancouver Apartment Parking Study, Technical Report
September 2012 Page 50
7.6 Visitor Parking Supply and Demand Although visitor parking was not a focus of the study, some municipal partners requested that
some data be collected on visitor parking demand. Consequently, three strata sites were
surveyed on Saturday, November 19, 2011. The sites were chosen primarily for their suburban
contexts and ease of access (no separate gates). The sites are mixed‐use developments; the
parkades have assigned parking for the attached retail and commercial tenants (but only the
parking supply and demand for the resident‐based visitor parking was counted).
The small sample of observations suggests that the commonly used visitor parking standard of
0.2 visitor stall per dwelling unit may be excessive. Further study is warranted on a larger
sample and at other times and days of the week.
Table 31. Visitor Parking Supply and Demand in Three Strata Sites
Site Location Start Time of
Survey
Visitor Parking
Stalls
Parked Vehicles
in Visitor Stalls
Parking
Demand Rate
Burnaby site
81 units
“FTN Bus and
Station”
11:40AM 16 3 0.04
2:45PM 16 5 0.06
7:00PM 16 2 0.03
9:41PM 16 2 0.03
Port Coquitlam site
138 units
“Beyond FTN”
11:05AM 27 3 0.02
2:00PM 27 0 0.00
6:00PM 27 0 0.00
8:59PM 27 1 0.01
Richmond site
282 units
“FTN Bus and
Station”
12:30PM 39 5 0.02
3:30PM 39 11 0.04
7:30PM 39 2 0.01
10:03PM 39 6 0.02
Also, the Household Survey asked:
“Typically, how often do your visitors have difficulty finding a parking space in your building’s
parking facility?”
Perceived visitor parking challenges were most pronounced in Vancouver/UBC and in the Metro
Core Peninsula, where over one‐half of respondents declared that their visitors frequently have
difficulty finding a parking space in the on‐site parkade (Figure 7). This is consistent with
expectations.
Individual submitted comments were also examined. A cluster of comments about visitor
parking difficulty in specific sites in the City of North Vancouver and New Westminster were
identified. In these instances, supply may or may not be the problem. Rather, site‐specific

The Metro Vancouver Apartment Parking Study, Technical Report
September 2012 Page 51
designs, such as stall dimensions that are too narrow and restrictions on on‐street parking, were
cited. Further study may be warranted.
65% 65%
56% 58% 58%
49%
31%
21% 18%
22% 21%14%
21%
20%
7%8%
11% 10%
15%15%
11%
7% 9% 10% 10% 13% 15%
38%
0%
10%
20%
30%
40%
50%
60%
70%
80%
90%
100%
Richm
ond
North
east
Secto
r+
Surre
y/Delt
a/W
hite
Rock/L
angle
y
Burna
by/N
W
North
Sho
re
Vanco
uver
/UBC
Met
ro C
ore
Almost Always
Often
Occasionally
Almost Never
Figure 7. Visitor Parking Challenges by Subregion

The Metro Vancouver Apartment Parking Study, Technical Report
September 2012 Page 52
7.7 Carshare Participation “Is your household a member of a car share program, such as car2go, Modo, Zipcar, or through
your strata?” (Yes or No)
Vancouver/UBC and the Metro Core Peninsula showed the highest rate of at least one
household member being a member of a carshare program. This result is not surprising when
the three major carshare providers (i.e., car2go, Modo, and Zipcar) in the region have most of
their stalls within the Vancouver/UBC subregion. In the case of car2go, the current operating
area is exclusively within the City of Vancouver.
Demand for carshare programs is likely a function of the availability of such services. Also, the
availability of such services is likely contingent on activity centres that are close to one another
and in areas where walk access is convenient.
3.4%3.0%
1.1%0.5%
0.8%
15.7%
14.7%
0%
2%
4%
6%
8%
10%
12%
14%
16%
18%
Burnaby/NW North Shore Northeast Sector+ Richmond Surrey/Delta/WhiteRock/Langley
Vancouver/UBC Metro Core
Per
cen
t o
f S
urv
ey H
ou
seh
old
Re
spo
nd
ents
Figure 8. Carshare Participation by Subregion

The Metro Vancouver Apartment Parking Study, Technical Report
September 2012 Page 53
Table 32. Carshare Participation by Subregion
Subregion Households with Membership in
a Carshare Program
Total Households
Burnaby/NW 13 385
North Shore 3 101
Northeast Sector+ 2 190
Richmond 1 218
Surrey/Delta/White
Rock/Langley
1 122
Vancouver/UBC 57 364
Metro Core Peninsula 25 170
Total 102 1,550
Households with membership in a carshare program also have fewer vehicles as shown below
by stratifying the responses within Vancouver and UBC.
Table 33. Carshare Membership and Household Vehicle Rates
Strata Sites in Vancouver and
UBC (including Metro Core
Peninsula)
Carshare Member? Number of Vehicles Per
Household
0‐Bedroom Yes (n=5) 0.00
No (n=28) 0.96
1‐Bedroom Yes (n=14) 0.79
No (n=129) 0.95
2‐Bedroom Yes (n=16) 0.63
No (n=125) 1.18

The Metro Vancouver Apartment Parking Study, Technical Report
September 2012 Page 54
7.8 Location Preferences “Which features were most important to you when you chose your current
apartment/townhouse? (Select top 3)”
One of the more interesting findings from the Household Survey is the degree that proximity to
public transit was an important factor for residents when choosing their current residence.
Price, proximity to transit, and proximity to shops, services, and entertainment were
consistently cited as the top three factors. About one‐half of respondents stated transit was
very important. This pattern was robust at the subregional level and by owner‐occupied or
renter households. The outlier was the Metro Core peninsula, where households consistently
ranked proximity to transit lower in favour of proximity to jobs or building amenities (see
Appendix 14 for the subregional breakdowns).
The relatively lower ranking for resident and visitor parking availability may be due in part to the
general expectation that parking is always bundled with an apartment unit, and therefore
parking is not seen as an optional feature or amenity.
7
21
45
79
98
118
277
292
309
394
502
739
782
1080
0 200 400 600 800 1000 1200
Pets
View
Visitor parking availability
Other
Close to road access
Close to school
Parking availability
Close to parks/recreation
Close to friends/family
Building amenities
Close to job
Close to shops/services
Close to public transit
Price
Figure 9. Frequency of Factors Cited as Most Important by Residents

The Metro Vancouver Apartment Parking Study, Technical Report
September 2012 Page 55
7.9 Willingness to Forego Parking Stalls “If provided the opportunity, would you have purchased/rented your current
apartment/townhouse without a parking stall, if it meant having a lower purchase/rental price
for your unit?” (Yes, Maybe/Unsure, No)
Municipalities require parking and developers supply parking all to satisfy real or perceived
parking demand. The Household Survey provides evidence that certain market segments are
more willing to give up their parking stalls.
A high proportion (36 percent) of 0‐vehicle households living in strata sites having at least one
parking stall would have given up those stalls if it meant having a lower purchase price or rent.
Households having at least one vehicle are considerably less willing to give up their stalls. Note
also the relatively high proportion of respondents who were undecided.
Table 34. Household Vehicle Rate in Strata Sites and Willingness to Forego Parking Stalls
Willingness to Forego Parking Stalls
Number of Vehicles
per Household
(Strata sites)
No Maybe/Unsure Yes
0 vehicles
(n=86)
34% 30% 36%
1 or more vehicles
(n=1,256)
78% 19% 3%
7.10 Key Lessons Learned Based on the evidence from the two surveys, the following lessons have been learned:
Residential parking supply in strata apartments generally exceed parking demand in the range of 18‐35 percent across the region.
Residential parking demand is lower near TransLink’s Frequent Transit Network. For apartments near the Frequent Transit Network, the parking demand range is 0.89 – 1.06 vehicles per apartment unit; whereas for apartments further away from the Frequent Transit Network, the parking demand range is 1.10 – 1.25 vehicles per apartment unit.
Residential parking demand near Frequent Transit Network bus stops are similar to demand near SkyTrain/SeaBus stations, but the parking supply is higher.
Vehicle holdings and parking demand for apartment renters are much lower than for owners.
This is consistent with prior research. In purpose‐built market rental sites, the parking
demand range is 0.58 ‐ 0.72 vehicles per apartment unit.

The Metro Vancouver Apartment Parking Study, Technical Report
September 2012 Page 56
Visitor parking supply may be over supplied. Observed parking demand rates were below 0.1 stall per apartment unit, compared to the typical municipal requirement of 0.2 visitor stall per apartment unit.
Participation in carshare programs was highest in Vancouver (16%) and UBC (15%), where carshare programs predominantly operate. Households with carshare memberships have fewer vehicles than do non‐members.
Proximity to transit was consistently cited by over half of the households surveyed as one of
the top three factors when choosing their current home.

The Metro Vancouver Apartment Parking Study, Technical Report
September 2012 Page 57
8 Apartment Parking Near the Frequent Transit Network Updating parking requirements for apartments is not something that is regularly completed for
various reasons. This study provides objective evidence that communities and developers can
use when determining the appropriate amount of parking in new apartment developments. In
this section, Metro Vancouver staff provides eight opportunity areas to effectively plan and
manage apartment parking near the Frequent Transit Network.
The greatest opportunities for change are new apartment sites near the Frequent Transit
Network (generally within 400 metres of a frequent bus stop and/or within 800 metres of a
SkyTrain station). High density communities with a robust network of frequent transit services
offer the greatest opportunities to put these findings into practice. For suburban communities
lacking the coverage of frequent transit services, these opportunities may be treated as long‐
term goals.
In the long‐run, the benefits of having refined parking requirements and implementing parking
management will be more efficient and livable neighbourhoods in Urban Centres and Frequent
Transit Development Areas, improvements to housing affordability and housing choice, and
greater use of sustainable transportation choices.
8.1.1 Treat On‐Site and Street Parking as a System
A more holistic approach toward parking supply and parking demand management for new
apartment projects is warranted. Attention should be paid to the availability, type, and relative
permanence of street parking (e.g., free, paid, permit‐only, and/or time‐limited) and surrounded
land uses, in association with any reductions in on‐site parking requirements.
8.1.2 Encourage Parking Supply to Match Demand Near the Frequent Transit
Network
Parking requirements should be set based on actual or expected demands with further
reductions based on transportation demand management measures or other site‐specific
conditions. The evidence provides support for any municipality wanting to explore reducing
current minimum apartment parking requirements near the Frequent Transit Network.
Reduced minimums provide flexibility for developers to meet market demand. For example, in
Seattle, even though it is optional to provide parking in new apartment developments within
400 metres of frequent transit service, experience has shown that the actual parking supplied
ranges from 0.6 to 1.0 stall per unit.
The evidence also supports municipalities wanting to explore introducing parking maximums
near the Frequent Transit Network. Maximums provide a degree of assurance that parking will
not be grossly oversupplied near high quality transit. Setting a range between the minimum and
maximum rates provides flexibility for development sites near the Frequent Transit Network.

The Metro Vancouver Apartment Parking Study, Technical Report
September 2012 Page 58
For example, in Toronto, the min‐max requirement for new apartments on surface transit
corridors is 0.7‐1.6 stalls per unit.
8.1.3 Encourage Parking Unbundling/Opt‐Out
In metropolitan Vancouver, the prevailing practice of developers is to bundle the cost of one or
more parking stalls in the base price (purchase or rental) of an apartment unit. Unbundling the
price of a parking stall from the apartment unit would provide consumers with a choice and an
opportunity to realize some modest improvement in housing affordability, especially for
households that do not own a vehicle. Further, unbundling can potentially provide an incentive
for consumers to re‐evaluate whether buying a new vehicle, or even a second one, is necessary.
Residents requiring parking would have the option to purchase or rent a stall separately.
While unbundling is the norm and the market fully expects and accepts it in Toronto and Seattle,
in metropolitan Vancouver the practice has been primarily limited to downtown Vancouver.
One possible way to expand this concept to other areas of the region, in particular close to the
Frequent Transit Network, is for developers to allow consumers to “opt out” of a pre‐bundled
parking and apartment unit package. In this scenario, the consumer can weigh the relative
benefits of owning a parking stall versus paying a lower price for the apartment and exploring
transportation alternatives. While municipalities can encourage unbundling or parking opt‐out,
it is the development community who must take a leadership role in this matter.
8.1.4 Encourage Rental Apartments Near the Frequent Transit Network
Generally, market and non‐market renters have lower vehicle ownership rates than do
apartment owners. In order to maximize affordability and efficiency in apartment buildings,
municipalities should encourage rental housing in Urban Centres and Frequent Transit
Development Areas. Household expenditures on transportation should inherently be lower in
locations near transit as there is a reduced need to own or operate a private personal vehicle.
Reduced parking reduces the cost of development. Municipalities could encourage rental
apartment units near transit by reducing or waiving parking requirements as part of an incentive
package as appropriate, and encouraging inclusion of rental apartment units in new
developments through policy or housing agreements.
8.1.5 Encourage Expansion of Carshare Programs where Feasible
Carshare programs hold enormous potential to shape behaviour and expectations about car
ownership, and to complement reductions in residential and visitor parking requirements in new
apartment projects. In metropolitan Vancouver, some municipalities, such as Vancouver and
New Westminster, request carshare vehicles/stalls in lieu of parking. Further investigation is
warranted to establish appropriate substitution rates between carshare vehicles/stalls and
regular parking stalls.

The Metro Vancouver Apartment Parking Study, Technical Report
September 2012 Page 59
Municipalities and developers should actively encourage more carshare providers to explore the
latent market demand beyond current operating boundaries and to identify suitable locations to
achieve synergies with new apartment developments. Emerging Urban Centres and Frequent
Transit Development Areas and other higher density locations near transit are obvious
opportunities for expansion.
Additional supportive municipal actions include designating on‐street parking spaces for
carshare vehicles and providing strata councils with the knowledge, tools, and capacity to
administer their own building‐specific carshare programs if appropriate.
8.1.6 Consider Allowing Amendments to Parking Supply after Pre‐Sales
Parking opt‐out or unbundling would be more attractive to developers if there is greater
flexibility and certainty in municipal processes to allow developers to propose and receive
approval of parking design modifications to an approved project after pre‐sales. It is often after
pre‐sales that the proponent will have actual data which may suggest the extent of parking
demand is different than what was originally assumed. Developers should be able to use this
data to refine the project. One approach could be to allow conditional approval of amended
parking, subject to verification from the developer of parking demand after pre‐sales. Further
investigation into approaches that could allow flexibility is warranted.
8.1.7 Conduct Regular Post‐Occupancy Parking Surveys
Regular and frequent post‐occupancy surveys of apartment projects should be conducted either
by developers or municipalities. Industry groups, such as the Urban Development Institute or
the Urban Land Institute, should leverage its membership resources to assist in the collection of
empirical evidence to support refinements to parking supply requirements and other
innovations. TransLink, as the regional transportation authority, can demonstrate leadership by
providing grants or in‐kind assistance to municipalities to support post‐occupancy surveys.
Metro Vancouver, as demonstrated by this study, could provide research assistance as
appropriate to close the knowledge gap.
8.1.8 Coordinate Frequent Transit Network Expansion
One common concern expressed by developers and municipalities was that in order for any
parking reductions to be fully embraced, much greater certainty in the location and staging of
the Frequent Transit Network, especially high‐capacity transit, is needed. (The Evergreen Line is
often cited because full funding was not confirmed until 2011, nearly eight years after the
preferred alternative was first approved by TransLink.)
These uncertainties can be effectively addressed through improved collaboration, information
sharing, and possible agreements between TransLink, senior governments, and municipal
partners. At a minimum, TransLink and municipalities should continue to collaborate and

The Metro Vancouver Apartment Parking Study, Technical Report
September 2012 Page 60
expand on corridor transit and land use planning, and to share the outcomes early on and
widely to residents and developers.
The important feature to note is that these types of shared commitments and understandings
have benefits for both high‐capacity transit expansion projects, like the Evergreen Line, and
enhancements of local bus service to Frequent Transit Network service levels. New Bus Rapid
Transit, Light Rail Transit, or SkyTrain expansion, are typically high‐capacity upgrades to existing
Frequent Transit Network corridors. Some of the existing bus stop locations on the planned
corridor would have to be rationalized to avoid duplication of infrastructure and service.
Planning, design, and construction could take anywhere from two to five years depending on
the project scope and complexity. If, on the other hand, local bus service is contemplated to be
upgraded to Frequent Transit Network service levels, then confirmation of the timing of
enhancements would be more important. As the study shows, proximity to frequent transit
services, whether bus or rail, makes a difference in household vehicle ownership and parking
demand.
8.2 Other Opportunities to Improve the Efficiency and Livability of
Neighbourhoods
8.2.1 Provision of Shared Parking
There may be opportunities to have shared parking facilities in mixed‐use projects with uses
that require parking at different peak times (of the day or of the week). This could be an office /
residential building, where peak office parking demand occurs during weekdays, and peak
residential and visitor demand occur during weekday evenings and weekends. A single shared
parking facility with fewer stalls could satisfy multiple users.
8.2.2 Provision of Unassigned Parking Stalls
Virtually all residential developments have parking stalls assigned to specific apartment units.
When the apartment occupant does not use the stall, it remains unused even if someone else in
the building is in need of one. Sometimes there may be an informal arrangement between
apartment occupants to rent their stalls. If not, then there is a potential loss of efficiency. If
some or all of the stalls were unassigned, potentially fewer stalls could be provided while still
satisfying the total demand from residents in the building.
8.2.3 Provision of Good Access and Design for Visitor Parking
One of the cited reasons for visitors to not use the designated visitor parking stalls is the design
of the facility. It can be inconvenient for residents to provide visitors with a separate key fob to
access the parking facility or to have to manually open the gate for the visitor. These issues can
be addressed in part by either having the security gate located past the visitor parking area (thus
the visitor parking area is unsecured) or having a double gating system – one for the visitor area
and one for the residents. However, some municipalities do not allow for these different layout
The Metro Vancouver Apartment Parking Study, Technical Report
September 2012 Page 61
and access designs. Municipalities should be flexible to allow such designs to ensure that visitor
parking is more accessible and efficiently used.
8.2.4 Provision of Appropriate Parking Stall Sizes
Another concern expressed in the household survey was parking stall sizes. In some apartment
buildings, the dimensions of residential stalls are narrower than desired for drivers of sport
utility vehicles, minivans, and trucks. In some instances, this has resulted in residents parking in
the visitor stalls, which then forces visitors to park on nearby streets.
8.2.5 Provision of Secured and Appropriately‐Sized Bicycle Parking Facilities
The study does not present evidence to suggest that the presence of an abundance of bicycle
parking spaces will induce residents to switch from driving to bicycling. What the study does
show is that a sizable proportion of bicycle owners surveyed are frustrated by the lack of
secured and sufficient‐sized bicycle parking facilities in their buildings (see Appendix 10).
Increasingly, apartment buildings are including on‐site bicycle parking / storage facilities. Most
municipalities in the region require bicycle parking / storage facilities in new apartment
developments. By providing an adequate supply of bicycle parking, along with appropriate
facilities, for occupants the option of taking their bicycle for more recreational and/or
commuting trips becomes more attractive and an important part of a healthy, active lifestyle.
There may be opportunities to also promote innovative forms of space‐efficient bicycle storage,
such as vertical racks, that would still satisfy bylaw requirements and save buildable floorspace.
8.2.6 Balancing Affordability and Payments‐in‐Lieu‐of‐Parking
Municipalities are enabled under the 2008 Local Government (Green Communities) Statutes
Amendment Act to collect cash‐in‐lieu for on‐site parking and to fund new and existing off‐street
parking spaces or transportation infrastructure that supports walking, bicycling, public transit or
other alternative forms of transportation. Some municipalities in the region already incorporate
this provision into their bylaws.
Payments‐in‐lieu of parking should be paired with realistic base parking requirements. One note
of consideration is that collecting payments‐in‐lieu, depending on the design of the policy, can
erode in part the affordability benefits gained from building less parking.
The flexibility and efficiency of constructing a separate shared parking facility may be most
appropriate in higher density mixed‐use projects, which have users with peak parking demands
at different times of the day, or have greater design challenges in accommodating on‐site
parking.

The Metro Vancouver Apartment Parking Study, Technical Report
September 2012 Page 62
9 Future Studies Given the importance of parking in relation to fostering efficient and livable neighbourhoods
within a sustainable and transit‐oriented region, additional areas of research may be warranted
to bring evidence to bear on important policy and regulatory proposals. Given the shared policy
interests, it is appropriate for Metro Vancouver and TransLink to collaborate and pool resources
to further these initiatives in consultation with municipal partners. Participation by the
development community, such as the Urban Development Institute and Urban Land Institute,
would also be appropriate to ensure relevance of such activities and that key findings are
conveyed widely to stakeholders.
The following initiatives are not listed in any particular order.
9.1 Extensions to the Metro Vancouver Apartment Parking Study Surveying the same buildings (and surrounding streets) over time would help to capture
emerging trends. Almost one in 10 households with vehicles surveyed reported parking a
vehicle on a nearby street. This is happening in light of the general oversupply of parking for
apartments. Further investigation is warranted as to why some residents are choosing to
park on the street so that effect parking management strategies and improved designs can
be developed and incorporated into new apartment developments to pre‐empt or mitigate
impacts on neighbourhoods.
Further exploration of the visitor parking supply and demand would be appropriate given
the preliminary findings that these parking stalls are often under‐utilized. For visitor parking
demand, parking facility surveys could be conducted during weeknights and weekends.
The household survey could be administered more aggressively to attempt to achieve a
higher participation rate. This may be through additional survey follow up mailings and
other techniques. The parking facility survey could also be completed later in the evening /
early morning to gather more accurate results of peak usage. This would provide for a
larger and better dataset allowing for more disaggregated analysis.
The household survey could be expanded further to explore the transportation behaviour
and patterns of households. There is significant gap in the literature and understanding of
how parking supply and travel behaviour are connected.
Future efforts could capture more areas “under‐represented” in this study, such as the
Langleys, Pitt Meadows, and Maple Ridge. Guidance on appropriate parking guidance for
apartments near West Coast Express stations is likely to be useful.

The Metro Vancouver Apartment Parking Study, Technical Report
September 2012 Page 63
9.2 New Areas for Investigation The following are potential new areas for investigation.
A review of current and best practices should be carried out on approaches to treating on‐
site and street parking as a system.
The concept of allowing amendments to parking supply after pre‐sales holds great potential.
Further investigation is warranted on any legal and administrative constraints and
opportunities.
For mixed‐use projects, a better understanding of parking supply and demand by time
period would be useful, in particular to evaluate the practical aspects of shared and
unassigned parking.
Townhouse developments will remain a popular product in this region. The perception of
tandem parking has been both positive and negative, even though this style of parking could
improve housing affordability through more efficient housing forms.
The rapidly aging demographics will cause ripple effects for housing choices and parking
demand. While some age‐related analysis was performed using data from the Household
Survey (see Appendix 12), further investigation on parking demand for older adults,
particularly in buildings catering to older adults may be warranted. Better evidence may
point to appropriate parking guidance for these sites. Also, it is worth exploring the
intentions of older adults who are considering downsizing to apartments and how likely they
could shed their vehicles.
A complete community is more than just singles and couples. Municipalities are increasingly
interested in attracting families to the urban cores close to transit. As the study suggests,
household vehicle ownership rates in larger apartments (floorspace and number of
bedrooms) appear to be less sensitive to transit proximity. Further investigation on the
likelihood of families and larger households to shed vehicles may be warranted. The
obvious implication is that there is a trade‐off between attracting more families (and
therefore larger apartment units) and reducing parking supply.
Given the expense of constructing underground parkades and some of the challenging
geotechnical conditions across the region, it is appropriate to investigate the costs and
benefits of alternative forms of parking, such as automated stacked parking, surface parking
on smaller development sites, etc.
An increasing number of municipalities allow for carshare parking stalls and carshare
vehicles to be provided in lieu or regular parking stalls. Further investigation is warranted
on appropriate substitution rates, effectiveness of carshare programs on changing car
ownership patterns, and the feasibility of expanding carshare programs to more suburban
locations.

The Metro Vancouver Apartment Parking Study, Technical Report
September 2012 Page 64
10 Conclusions and Next Steps
The Metro Vancouver Apartment Parking Study is one of the most comprehensive examinations
of parking supply and demand ever conducted for a metropolitan area. The evidence provided
by the parking surveys, coupled by intelligence from residential developers, municipal planners,
and progressive practices in other cities, strongly supports moving beyond current parking
practices in the region.
Apartment parking supply is measurably higher than parking demand. Providing an excessive
supply of parking represents lost opportunities for maximizing efficient use of land resources,
supporting transportation choices, and achieving modest improvements in housing affordability.
The study points to opportunities for the planning and management of apartment parking near
TransLink’s Frequent Transit Network.
Metro Vancouver’s role is largely leadership through research, outreach, collaboration, and
advocacy. Metro Vancouver is committed to working with stakeholders to best communicate
and advance the study findings. Metro Vancouver will distribute a summary booklet of the
study, present at industry events, and engage one‐on‐one with stakeholders.
Each of these stakeholders has a vested interest in ensuring public and private resources are
optimally used. This shared interest coincides with the broader regional objectives to build
vibrant, efficient, and livable transit‐oriented Urban Centres and Frequent Transit Development
Areas, encourage alternative forms of transportation, and reduce housing development costs.
Opportunities abound for future research related to parking and to further the implementation
of the Regional Growth Strategy and Regional Affordable Housing Strategy. Metro Vancouver
will endeavour to consult, coordinate, and collaborate with municipal partners, TransLink, the
Urban Development Institute, the Urban Land Institute, and the Province.

The Metro Vancouver Apartment Parking Study, Technical Report
September 2012 Page 65
APPENDIX 1: Bibliography Bunt, Paul and Peter Joyce. Car Ownership Patterns Near Rapid Transit Stations. Bunt &
Associates Engineering Ltd. 1998. http://www.citebc.ca/Feb98_Ownership.html
Canada Mortgage and Housing Corporation. Rental Market Report. Fall 2011.
Cansult Limited. City of Toronto Parking Standards Review ‐ Phase Two Apartment
Building/Multi‐residential Block Developments Component, New Zoning By‐Law Project. 2007.
Cervero, Robert, Arlie Adkins, and Cathleen Sullivan. Are TODs Over‐Parked? University of
California Transportation Center. 2009.
City of Toronto. 426 University Avenue – Zoning By‐law Amendment and Site Plan Approval
Applications – Refusal Report. From: Director, Community Planning, Toronto and East York
District, To: Toronto and East York Community Council. May 25, 2009.
http://www.toronto.ca/legdocs/mmis/2009/te/bgrd/backgroundfile‐21943.pdf
Co‐operative Auto Network. The Car Co‐op Social and Environmental Report. 2008.
IBI Group. Parking Standards Review: Examination of Potential Options and Impacts of Car Share
Programs on Parking Standards. Submitted to the City of Toronto. 2009.
Kodransky, Michael and Gabrielle Hermann. Europe’s Parking U‐Turn: From Accommodation to
Regulation. Institute for Transportation & Development Policy. 2011
Martin, Elliot, Susan Shaheen, and Jeffrey Lidicker. Carsharing’s Impact on Household Vehicle Holdings: Results from a North American Shared‐Use Vehicle Survey. University of California, Berkeley. March 15, 2010.
Metro Vancouver. Regional Affordable Housing Strategy. 2007.
Metro Vancouver. Regional Growth Strategy: Metro Vancouver 2040: Shaping Our Future. 2011.
MMM Group. Transportation Assessment and Management Study ‐ Marine Gateway on Canada
Line ‐ Vancouver, BC. For: PCI Developments Corp. November 2009.
http://www.marinegateway.ca/documents/trafficStudy.pdf
Pinsker, Paul. Subject: Parking Requirement Standards for Multiple Residential Use. To: Standing Committee on Transportation and Traffic, From: General Manager of Engineering Services in consultation with the Director of City Plans, Director of Development Services, Director of Legal Services, and Chief Building Official. April 13, 2005. http://vancouver.ca/ctyclerk/cclerk/20050426/tt3.pdf

The Metro Vancouver Apartment Parking Study, Technical Report
September 2012 Page 66
San José State University and Santa Clara Valley Transportation Authority. A Parking Utilization
Survey of Transit‐Oriented Development Residential Properties in Santa Clara County, Volume I:
Technical Report. SJSU/VTA Collaborative Research Project. 2010.
Shoup, Donald. The Trouble With Minimum Parking Requirements. Transportation Research Part
A, Vol. 33A, Nos.7‐8, September/November, 1999.
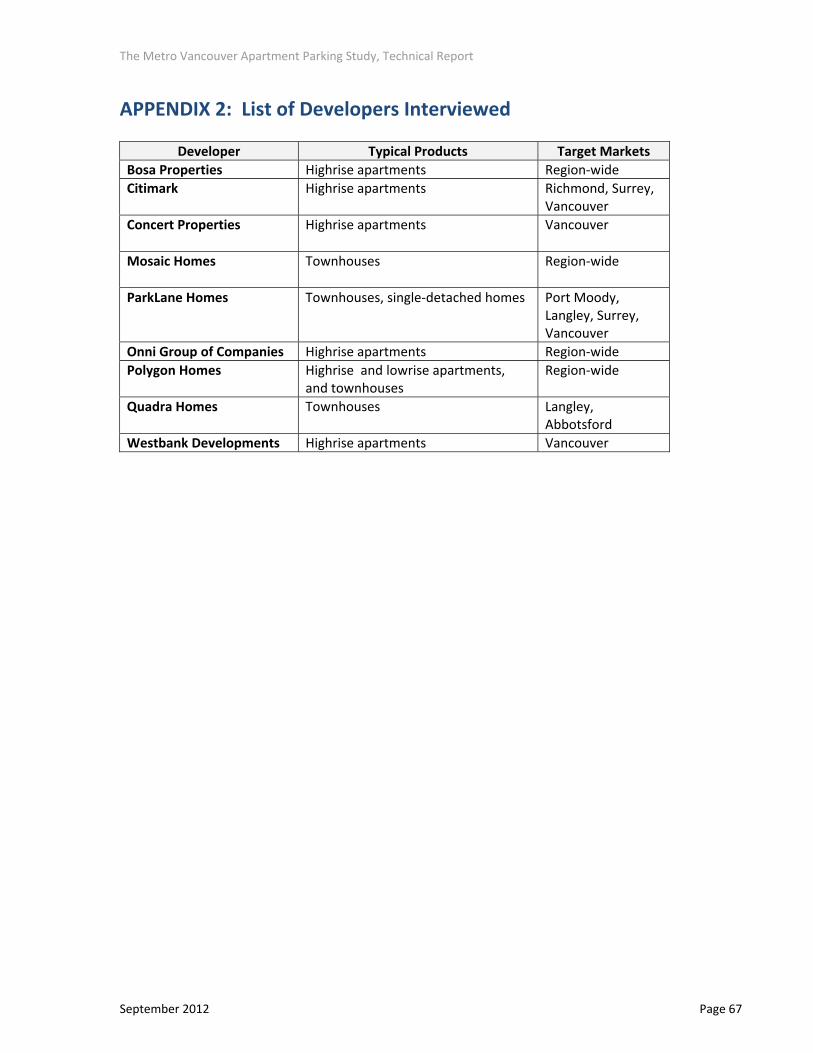
The Metro Vancouver Apartment Parking Study, Technical Report
September 2012 Page 67
APPENDIX 2: List of Developers Interviewed
Developer Typical Products Target Markets
Bosa Properties Highrise apartments Region‐wide
Citimark
Highrise apartments Richmond, Surrey, Vancouver
Concert Properties
Highrise apartments Vancouver
Mosaic Homes
Townhouses Region‐wide
ParkLane Homes Townhouses, single‐detached homes Port Moody, Langley, Surrey, Vancouver
Onni Group of Companies Highrise apartments Region‐wide
Polygon Homes
Highrise and lowrise apartments, and townhouses
Region‐wide
Quadra Homes
Townhouses Langley, Abbotsford
Westbank Developments Highrise apartments Vancouver

The Metro Vancouver Apartment Parking Study, Technical Report
September 2012 Page 68
APPENDIX 3: Interview Questions with Developers
Municipal Regulations
1. Do you believe that reductions in multi‐unit residential parking supply requirements could offer a significant opportunity to reduce development costs?
2. Do you believe that municipal parking regulations for apartments and townhouses in the region are generally reasonable? Do some municipalities require too many or too few parking stalls?
3. What has been your experience in obtaining a variance from the municipal parking regulations for individual projects?
Project Design
4. What are the key factors you use to determine appropriate levels of parking stalls per apartment unit or townhouse unit (plus visitor parking)?
5. When determining parking needs, how do you take into account proximity to transit and transit technology / service levels (local bus, limited‐stop bus, SkyTrain, etc.)?
6. What do you use as a rule‐of‐thumb to define proximity to transit: 400 metres, 800 metres? Does that vary by transit technology?
7. What is the marginal or average construction cost per parking stall (underground, above grade structure)?
8. Prior to construction, do you adjust the number of parking stalls in a building after pre‐sales have been completed? How easy is it to accommodate a change in parking facility design and approvals at that stage?
9. What is the typical number of parking stalls provided per residential unit in your recent projects? Would this differ if there were no municipal parking requirements or reduced municipal parking requirements?
Consumer Preference, Project Financing, and Marketing
10. How would reductions in parking supply requirements affect project financing or marketing?11. Do you sell or rent parking stalls independent (un‐bundled) of the residential unit in any of
your projects? Do you have surplus parking to sell/rent? 12. Are consumers willing to buy residential units without a parking stall? Or with un‐assigned
parking? 13. Do many consumers buy more parking stalls than they immediately need for possible future
needs, or to preserve future rental or resale potential? 14. Have you offered transportation incentives in lieu of parking, such as co‐op car parking, co‐
op vehicles, carpool parking, extra bike storage, transit passes, to reduce parking needs? If so, what has your experience been? What challenges have you faced in marking / explaining such features to consumers? Did you encounter any issues with financial lenders?
15. Do you conduct post‐occupancy surveys of unit owners/occupants, asking about their vehicle ownership or parking usage?
16. What else could be done to make housing development more affordable?

The Metro Vancouver Apartment Parking Study, Technical Report
September 2012 Page 69
APPENDIX 4: Municipal Questionnaire
1. Do you believe that the current multi‐unit residential municipal parking regulations are providing for an appropriate level of parking?
2. Does your municipality have provisions for reduced parking requirements for mixed use, multi‐unit residential developments near transit and/or low income units? If so: a. How does your municipality establish allowable reductions for:
i. Mixed use / shared parking projects ii. Near Transit iii. Low income
b. How well do these reductions work? Does your municipality receive parking related complaints post‐occupancy of projects with reduced parking?
3. Do you receive requests for reductions in parking requirements from developers? How do you evaluate these requests?
4. Is on‐street parking availability/management considered when setting on‐site parking regulations or evaluating requested variances?
5. Does your municipality encourage developers to offer transportation incentives in lieu of parking, such as co‐op car parking, co‐op vehicles, carpool parking, bike storage, transit passes, to reduce parking needs?
6. How frequently are municipal parking regulations reviewed and adjusted, and what is the process?

The Metro Vancouver Apartment Parking Study, Technical Report
September 2012 Page 70
APPENDIX 5: City of Seattle Multifamily Parking Code
Residential Use Previous Minimum
Parking Requirement
Revised Minimum Parking
Requirement (2010)
Nominal Standards
Multifamily residential 1 space per DU 1 space per DU
Single‐family dwelling units 1 space per DU 1 space per DU
Location Criteria
Residential uses in commercial and
multifamily zones within urban centers or
within the Station Area Overlay District
(SAOD)
No minimum
requirement
No minimum requirement
Residential uses in commercial and
multifamily zones within urban villages
that are not within urban centers or the
Station Area Overlay District, AND the
residential use is located within 1,320 feet
of frequent transit service
‐‐ No minimum requirement
Income or Location + Income Criteria
Low‐income elderly multifamily residential
uses not located in urban centers or within
SAOD
1 space for each 6 DU 1 space for each 6 DU
Low‐income disabled multifamily
residential uses not located in urban
centers or within SAOD
1 space for each 4 DU 1 stall/4 DU; deleted
reference to urban centers
and SAOD
Low‐income elderly/low‐income disabled
multifamily residential uses not located in
urban centers or within SAOD
1 space for each 5 DU 1 space for each 5 DU;
deleted reference to urban
centers and SAOD
Multifamily residential uses: for each DU
rented to and occupied by a household
with an income at the time of its initial
occupancy at or below 30% AMI, for the
life of the building
‐‐ 1, 2 bedrooms = 0.33
stall/DU
3+ bedrooms = 1 stall/DU
Multifamily residential uses: for each DU
rented to and occupied by a household
with an income at the time of its initial
occupancy of 30‐50% AMI, for the life of
the building
‐‐ 1,2 bedrooms = 0.75
stall/DU
3+ bedrooms = 1 stall/DU

The Metro Vancouver Apartment Parking Study, Technical Report
September 2012 Page 71
APPENDIX 6: Survey Sites
Municipality
Site Name Address Parking Facility Survey and/or Household
Survey
Burnaby
Altura 3855 PENDER ST Both
Arcadia East 7178 COLLIER ST Both
Cortina 6888 SOUTHPOINT DR Both
Crystal Residences 6028 WILLINGDON AVE Both
6088 WILLINGDON AVE
Emerson 7063 HALL AVE Both
Jackson House 4788 BRENTWOOD DR Both
Montage 4728 DAWSON ST Both
OMA2 4250 DAWSON ST Both
Patterson Park 4155 CENTRAL BLVD Both
Silhouette Towers 9868 CAMERON ST Both
9888 CAMERON ST
Tandem 3 4182 DAWSON ST Both
The Harris 4768 BRENTWOOD DR Both
Thomson House 4799 BRENTWOOD DR Both
Tramonto 4365 HASTINGS ST Both
Watercolours 2289 YUKON CRES Both
Coquitlam
Claremont
1175 THE HIGH ST Both
1177 THE HIGH ST
1179 THE HIGH ST
1185 THE HIGH ST
1187 THE HIGH ST
1189 THE HIGH ST
1191 THE HIGH ST
1193 THE HIGH ST
1197 THE HIGH ST
1199 THE HIGH ST
Tamarisk 2958 SILVER SPRINGS BLVDBoth 2966 SILVER SPRINGS BLVD
2968 SILVER SPRINGS BLVD
Tantalus 2951 SILVER SPRINGS BLVD Both
2959 SILVER SPRINGS BLVD
Delta Oliva 1315 56 ST Both
Langley City
Brydon Walk 5454 198 ST Both
The Southbrook 5474 198 ST Both
Maple Ridge Westbrooke 12020 207A ST Household Survey
New Westminster
Anvil 200 KEARY ST Both
Carnarvon 410 CARNARVON ST Both
420 CARNARVON ST
The Grove 245 ROSS DR Both
255 ROSS DR
265 ROSS DR
270 FRANCIS WAY
275 ROSS DR
285 ROSS DR

The Metro Vancouver Apartment Parking Study, Technical Report
September 2012 Page 72
Municipality
Site Name Address Parking Facility Survey and/or Household
Survey
290 FRANCIS WAY
The Point 610 VICTORIA ST Both
North Vancouver City
Avondale
1468 ST. ANDREWS AVE Both
307 15TH ST E
308 14TH ST E
309 15TH ST E
310 14TH ST E
311 15TH ST E
312 14TH ST E
313 15TH ST E
314 14TH ST E
315 15TH ST E
316 14TH ST E
317 15TH ST E
318 14TH ST E
319 15TH ST E
320 14TH ST E
321 15TH ST E
322 14TH ST E
323 15TH ST E
324 14TH ST E
325 15TH ST E
327 15TH ST E
329 15TH ST E
331 15TH ST E
Esplanade West 168 ESPLANADE E Both
Mira in the Park 683 VICTORIA PK W Both
The Silva 121 16TH ST W Both
Vista 29 188 29TH ST W Both
Vista Place I and II
1301 Civic Place Mews Blvd Both
1303 Civic Place Mews Blvd
1305 Civic Place Mews Blvd
1309 Civic Place Mews Blvd
1313 Civic Place Mews Blvd
1317 Civic Place Mews Blvd
1320 CHESTERFIELD AVE
1321 Civic Place Mews Blvd
1322 CHESTERFIELD AVE
1324 CHESTERFIELD AVE
1325 Civic Place Mews Blvd
1326 CHESTERFIELD AVE
1328 CHESTERFIELD AVE
1329 Civic Place Mews Blvd
158 13TH ST W
Pitt Meadows
Keystone 12350 HARRIS RD Household Survey
Origin 11950 HARRIS RD Household Survey
Port Coquitlam
Verde 2484 WILSON AVE Both
Villagio 1 and 2 2627 SHAUGHNESSY ST Both

The Metro Vancouver Apartment Parking Study, Technical Report
September 2012 Page 73
Municipality
Site Name Address Parking Facility Survey and/or Household
Survey
2628 MAPLE ST
Port Moody
Libra A and B 101 MORRISSEY RD Both
201 MORRISSEY RD
Lighthouse at Rocky Point 84 GRANT ST Both
The Sentinel 290 NEWPORT DR Both
The Sinclair 235 GUILDFORD WAY Both
The Square at Saint Johns 3240 ST JOHNS ST Both
3250 ST JOHNS ST
3260 ST JOHNS ST
Tides 300 KLAHANIE DR Both
400 KLAHANIE DR
500 KLAHANIE DR
Richmond
Acqua 5811 NO. 3 RD Both
7911 ACKROYD RD
Copper Sky East and West 4500 WESTWATER DR Both
4600 WESTWATER DR
Emporio 6351 BUSWELL ST Both
Magnolia and Casaurina 9180 HEMLOCK DR Both
9188 HEMLOCK DR
Meridian Gate
9199 TOMICKI AVE Both
9288 ODLIN RD
9299 TOMICKI AVE
Ocean Walk 7535 ALDERBRIDGE WAY Both
7555 ALDERBRIDGE WAY
7575 ALDERBRIDGE WAY
Paloma 1 6068 NO. 3 RD Both
Red2 9233 FERNDALE RD Household Survey
The Fullerton 9171 FERNDALE RD Both
The Village at Imperial Landing 4111 BAYVIEW ST Household Survey
4211 BAYVIEW ST
4233 BAYVIEW ST
4280 MONCTON ST
Lotus 5900 ALDERBRIDGE WAY Both
5908 ALDERBRIDGE WAY
7371 WESTMINSTER HWY
7373 WESTMINSTER HWY
Surrey
Access 1, 2 10838 CITY PKY Both
10866 CITY PKY
Access 3 10822 CITY PKY Household Survey
Escada 10058 153 ST Both
10066 153 ST
15322 101 AVE
15388 101 AVE
Maxxine Wright 13733 92 AVENUE Both
Quattro 2 13789 107A AVE Both
The Morgan 15918 26 AVE Both
15988 26 AVE
The Observatory 10899 UNIVERSITY DR Both

The Metro Vancouver Apartment Parking Study, Technical Report
September 2012 Page 74
Municipality
Site Name Address Parking Facility Survey and/or Household
Survey
The Villas at Strawberry Hill 12088 75A AVE Household Survey
UBC
Chaucer Hall 2250 WESBROOK MALL Both
Galleria 5568 KINGS RD Both
5632 KINGS RD
5692 KINGS RD
Vancouver
600 Drake 600 Drake Both
Avila
1550 COAL HARBOUR QUAY Both
502 CARDERO ST
506 CARDERO ST
510 CARDERO ST
560 CARDERO ST
Brava 1155 SEYMOUR ST Both
1199 SEYMOUR ST
City Gate Housing Co‐op 188 MILROSS AV Both
Collingwood House Co‐op 3547 EUCLID AV Household Survey
5398 TYNE ST
Europa 63 KEEFER PL Both
First 1808 1ST AVE W Both
Fraser Pointe I 3033 N.E. KENT AVENUE Both
Fraser Pointe II 3083 N.E. KENT AVENUE Parking Facility Survey
Heather Place
706 13th Avenue West Both
714 13th Avenue West
725 14th Avenue West
726 13th Avenue West
733 14th Avenue West
734 13th Avenue West
744 13th Avenue West
745 14th Avenue West
754 13th Avenue West
755 14th Avenue West
764 13th Avenue West
774 13th Avenue West
785 14th Avenue West
Lanesborough 3088 41ST AVE W Household Survey
3188 41ST AVE W
Loft 495 495 6TH AVE W Both
Mayfair 189 ONTARIO PL Household Survey
Olympic Village Parcel 5 122 WALTER HARDWICK AVE Household Survey
Olympic Village Parcel 9 80 WALTER HARDWICK AVE Household Survey
Residences on Seventh 228 7 AVE E Both
Solo, Duo, Treo
2228 MARSTRAND AVE Both
2288 MARSTRAND AVE
2688 VINE ST
Strathearn Court 1873 Spyglass Place Both
1893 Spyglass Place
Tapestry 2851 HEATHER ST Both
750 12TH AVE W
The 501 501 PACIFIC ST Both

The Metro Vancouver Apartment Parking Study, Technical Report
September 2012 Page 75
Municipality
Site Name Address Parking Facility Survey and/or Household
Survey
The Bradford 3535 CROWLEY DR Both
The Carina 1233 CORDOVA ST W Both (Parking Facility Survey counted Calisto;
shared parkade)
The Hudson 610 GRANVILLE Parking Facility Survey
The Melbourne 3433 CROWLEY DR Both (Parking Facility Survey counted
Alexander Court; shared parkade)
The Remington 3528 VANNESS AVENUE Parking Facility Survey
The Rise 425 8TH AVE W Both
450 7TH AVE W
485 8TH AVE W
The View 2150 HASTINGS ST E Both
The Vine
2228 BROADWAY W Both
2268 BROADWAY W
2288 BROADWAY W
The Westridge 4170 NANAIMO ST Both
4180 NANAIMO ST
Wessex Gate / Earls Court 3408 CROWLEY DR Both
3428 CROWLEY DR
White Rock
Miramar Tower A 15152 RUSSELL AVE Both
Miramar Tower B 1473 JOHNSTON RD Both

The Metro Vancouver Apartment Parking Study, Technical Report
September 2012 Page 76
APPENDIX 7: Household Survey Instrument

The Metro Vancouver Apartment Parking Study, Technical Report
September 2012 Page 77

The Metro Vancouver Apartment Parking Study, Technical Report
September 2012 Page 78
APPENDIX 8: Parking Demand in Urban Centres (Household
Survey Responses)
Regional City Centres (29 sites; excluding Metro Core Peninsula)
Unit Type Stalls per
Household
Vehicles per
Household
Parked Vehicles
per Household
1‐Bedroom Outside RCC (n=234) 1.14 1.11 0.97
Inside RCC (n=85) 1.08 1.16 1.02
2‐Bedroom Outside RCC (n=588) 1.44 1.37 1.25
Inside RCC (n=161) 1.35 1.30 1.19
3‐Bedroom Outside RCC (n=71) 1.90 1.55 1.39
Inside RCC (n=36) 1.75 1.64 1.36
Richmond Regional City Centre (8 sites)
Unit Type Stalls per
Household
Vehicles per
Household
Parked Vehicles
per Household
1‐Bedroom Outside RCC (n=18) 1.17 1.11 0.83
Inside RCC (n=28) 1.14 1.18 1.07
2‐Bedroom Outside RCC (n=76) 1.49 1.50 1.34
Inside RCC (n=64) 1.41 1.28 1.22
3‐Bedroom Outside RCC (n=13) 1.85 1.46 1.38
Inside RCC (n=16) 1.81 1.63 1.56
Municipal Town Centres (22 sites)
Unit Type Stalls per
Household
Vehicles per
Household
Parked Vehicles
per Household
1‐Bedroom Outside MTC (n=139) 1.14 1.05 0.92
Inside MTC (n=95) 1.13 1.19 1.03
2‐Bedroom Outside MTC (n=328) 1.38 1.34 1.22
Inside MTC (n=260) 1.52 1.42 1.28
3‐Bedroom Outside MTC (n=50) 1.96 1.58 1.40
Inside MTC (n=21) 1.76 1.48 1.38
Brentwood, Lougheed, Edmonds Municipal Town Centres (11 sites)
Unit Type Stalls per
Household
Vehicles per
Household
Parked Vehicles
per Household
1‐Bedroom Outside RCC (n=34) 1.18 1.15 1.06
Inside RCC (n=60) 1.13 1.15 1.02
2‐Bedroom Outside RCC (n=75) 1.36 1.39 1.25
Inside RCC (n=135) 1.35 1.36 1.23
3‐Bedroom Outside RCC (n=17) 1.88 1.65 1.41
Inside RCC (n=13) 1.69 1.62 1.54
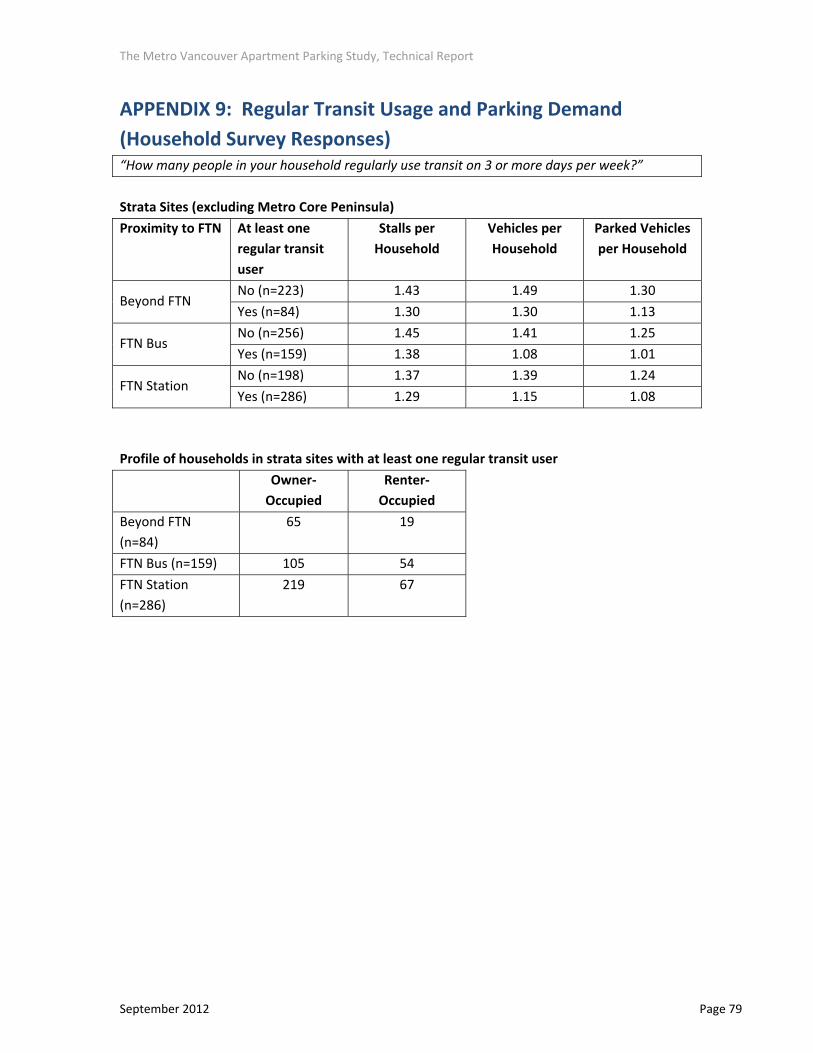
The Metro Vancouver Apartment Parking Study, Technical Report
September 2012 Page 79
APPENDIX 9: Regular Transit Usage and Parking Demand
(Household Survey Responses) “How many people in your household regularly use transit on 3 or more days per week?”
Strata Sites (excluding Metro Core Peninsula)
Proximity to FTN At least one
regular transit
user
Stalls per
Household
Vehicles per
Household
Parked Vehicles
per Household
Beyond FTN No (n=223) 1.43 1.49 1.30
Yes (n=84) 1.30 1.30 1.13
FTN Bus No (n=256) 1.45 1.41 1.25
Yes (n=159) 1.38 1.08 1.01
FTN Station No (n=198) 1.37 1.39 1.24
Yes (n=286) 1.29 1.15 1.08
Profile of households in strata sites with at least one regular transit user
Owner‐
Occupied
Renter‐
Occupied
Beyond FTN
(n=84)
65 19
FTN Bus (n=159) 105 54
FTN Station
(n=286)
219 67

The Metro Vancouver Apartment Parking Study, Technical Report
September 2012 Page 80
APPENDIX 10: Bicycle Ownership and Storage (Household Survey
Responses) “How many bicycles does your household own?”
Subregion No Bicycles 1 or more bicycles
Burnaby/NW (n=384) 58% 42%
North Shore (n=100) 56% 44%
Northeast Sector+ (n=190) 45% 55%
Richmond (n=218) 61% 39%
South of Fraser (n=121) 57% 43%
Vancouver/UBC (n=364) 32% 68%
Metro Core Peninsula
(n=170) 44% 56%
Total (n=1,547) 49% 51%
“If your household owns 1 or more bicycles, does your household use the buildings’ bicycle
parking facility?” (Yes, No – please explain)
Subregion Yes No
Burnaby/NW (n=160) 60% 40%
North Shore (n=44) 30% 70%
Northeast Sector+ (n=105) 45% 55%
Richmond (n=86) 34% 66%
South of Fraser (n=52) 52% 48%
Vancouver/UBC (n=246) 25% 75%
Metro Core Peninsula
(n=95) 53% 47%
Total (n=788) 41% 59%

The Metro Vancouver Apartment Parking Study, Technical Report
September 2012 Page 81
Frequency of stated reasons for not using the bicycle parking facility (note: 73 households did
not specify a reason):
116
96
31
12 106 5 5 3
0
20
40
60
80
100
120
140
No bikefacility
Bike facilityis not
trustworthyand/or
unwilling tostore
expensivebike withothers
No morespace in bike
facility
Don't know ifone exists
Unwilling topay an extrafee for a rack
installation
Bike facilitywas
converted togeneral
storage orwas
promixed butnever built
Unwilling topay an extra
fee foraccess to
bike facility
Inconvenient Other
Places where people store their bicycles, if not in a bicycle facility (note: 187 households did not
specify a storage location):
4745
26
20
0
10
20
30
40
50
60
70
80
Store in locker Store in ownapartment/patio/yard
Stored offsite Store in vehicle parkingstall (incl. rack or other)

The Metro Vancouver Apartment Parking Study, Technical Report
September 2012 Page 82
APPENDIX 11: Apartment Floorspace v. Vehicles Per Household
(Household Survey Responses)
Strata versus Market Rental
0.93
1.60
1.34
1.27
1.17
1.00
0.86
0.74
0.00
0.20
0.40
0.60
0.80
1.00
1.20
1.40
1.60
1.80
Less than 600 sqft 600-799 sqft 800-999 sqft 1000-1199 sqft 1200 and higher sqft
Strata Market Rental
Strata Sites by the Frequent Transit Network
1.59
1.67
1.411.421.38
0.93
1.311.22
1.12
0.00
0.20
0.40
0.60
0.80
1.00
1.20
1.40
1.60
1.80
Less than 600 sqft 600-799 sqft 800-999 sqft 1000-1199 sqft 1200 and higher sqft
Beyond FTN Near FTN

The Metro Vancouver Apartment Parking Study, Technical Report
September 2012 Page 83
Strata Sites by the Frequent Transit Network (disaggregated by “FTN Bus Only” and “FTN
Station”)
1.48
1.67
1.411.421.38
1.08
1.371.171.17
0.00
0.20
0.40
0.60
0.80
1.00
1.20
1.40
1.60
1.80
2.00
Less than 600 sqft 600-799 sqft 800-999 sqft 1000-1199 sqft 1200 and higher sqft
Beyond FTN FTN Bus Only FTN Station

The Metro Vancouver Apartment Parking Study, Technical Report
September 2012 Page 84
APPENDIX 12: Demographics and Parking Demand (Household
Survey Responses)
One‐Person Households in Strata Sites
Age Cohort Number of
Households
Stalls per
Household
Vehicles per
Household
Parked Vehicles
per Household
25‐34 years 132 1.07 0.92 0.87
35‐64 years 207 1.16 0.94 0.90
65+ years 67 1.19 0.91 0.88
Two‐Person Households in Strata Sites
Age Cohort Number of
People in Age
Cohort
Stalls per
Household
Vehicles per
Household
Parked Vehicles
per Household
25‐34 years One (n=103) 1.38 1.44 1.22
Two (n=207) 1.39 1.47 1.25
35‐64 years One (n=122) 1.41 1.39 1.25
Two (n=171) 1.45 1.39 1.27
65+ years One (n=36) 1.56 1.33 1.28
Two (n=82) 1.57 1.38 1.29
Three‐Person Households in Strata Sites
Age Cohort Number of
People in Age
Cohort
Stalls per
Household
Vehicles per
Household
Parked Vehicles
per Household
25‐34 years One (n=40) 1.60 1.60 1.38
Two (n=66) 1.42 1.47 1.27
35‐64 years One (n=44) 1.43 1.39 1.27
Two (n=86) 1.60 1.57 1.36
65+ years One (n=13) 1.54 1.77 1.46
Two (n=8) 1.88 1.88 1.75

The Metro Vancouver Apartment Parking Study, Technical Report
September 2012 Page 85
APPENDIX 13: Street Parking (Household Survey Responses)
Subregion
Percent of Strata Households with at
least one vehicle parked on a nearby
street
Burnaby/NW (n=369) 12%
North Shore (n=97) 12%
Northeast Sector+ (n=183) 15%
Richmond (n=204) 10%
South of Fraser (n=117) 15%
Vancouver/UBC (n=167) 7%
Metro Core Peninsula
(n=111) 8%
Total (n=1,248) 11%

The Metro Vancouver Apartment Parking Study, Technical Report
September 2012 Page 86
APPENDIX 14: Frequency of Factors Cited as Most Important for
Choosing Current Home (Household Survey Responses)
Burnaby/New Westminster
0 50 100 150 200 250 300
Price
Friends and Family
Job
School
Transit
Road
Parks
Shops
Building
Residential Parking
Visitor Parking
North Shore
0 10 20 30 40 50 60 70
Price
Friends and Family
Job
School
Transit
Road
Parks
Shops
Building
Residential Parking
Visitor Parking

The Metro Vancouver Apartment Parking Study, Technical Report
September 2012 Page 87
Northeast Sector+
0 20 40 60 80 100 120 140
Price
Friends and Family
Job
School
Transit
Road
Parks
Shops
Building
Residential Parking
Visitor Parking
Richmond
0 50 100 150 200
Price
Friends and Family
Job
School
Transit
Road
Parks
Shops
Building
Residential Parking
Visitor Parking

The Metro Vancouver Apartment Parking Study, Technical Report
September 2012 Page 88
Surrey/Delta/White Rock/Langleys
0 20 40 60 80 100 120
Price
Friends and Family
Job
School
Transit
Road
Parks
Shops
Building
Residential Parking
Visitor Parking
Vancouver/UBC
0 50 100 150 200 250 300
Price
Friends and Family
Job
School
Transit
Road
Parks
Shops
Building
Residential Parking
Visitor Parking

The Metro Vancouver Apartment Parking Study, Technical Report
September 2012 Page 89
Metro Core Peninsula
0 20 40 60 80 100 120 140
Price
Friends and Family
Job
School
Transit
Road
Parks
Shops
Building
Residential Parking
Visitor Parking
6256423