risk sharing agreements - advance hta sharing agreements panos kanavos warsaw, 26 september 2014...
TRANSCRIPT

Risk sharing agreements
Panos Kanavos Warsaw, 26 September 2014
Advance-HTA Capacity building workshop

Background
Increasing cost of new medicines
Presence of a significant degree of uncertainty at the time of making coverage decisions
Need for innovative solutions to make new drugs available to patients while ensuring the long-term financial sustainability of healthcare systems

Constructing RSAs – Key sources of uncertainty
• Uncertainty around clinical evidence • More robust clinical evidence is needed about who is likely to benefit
most
• Uncertainty around cost-effectiveness • Average cost-effectiveness is higher than country’s WTP
• Uncertainty around budget impact • Budget impact is too high if all potentially eligible patients are
treated
• Uncertainty around price • Not clear how pricing strategy results in a price that is significantly
higher than BAT
• Uncertainty around eligible patient population • Not clear who is likely to benefit most • Not clear how many patients exist in this indication

Risk Sharing and Managed Entry Agreements
• Uncertainty around clinical evidence • More robust clinical evidence is needed about who is likely to benefit
most
• Uncertainty around cost-effectiveness • Average cost-effectiveness is higher than country’s WTP
• Uncertainty around budget impact • Budget impact is too high if all potentially eligible patients are
treated
• Uncertainty around price • Not clear how pricing strategy results in a price that is significantly higher
than BAT
• Uncertainty around eligible patient population • Not clear who is likely to benefit most • Not clear how many patients exist in this indication
WHY?
Financial Outcomes-
related
Combination
of both

Payer option flow diagram
Payer options
Payer adopts: no new evidence required
(YES)
Payer refuses to adopt (NO)
Manufacturer has option to reapply
with more evidence
Use only in research
Payer adopts with additional evidence
(CED) (YES BUT)
CED with negotiation. No pre-specified agreement
CED linked to performance agreement
Outcomes based
Utilization uncertainty
Outcomes uncertainty
Non-outcomes based
Budget cap
Price discount

Coverage with Evidence Development
• Product is covered or reimbursed when used
under controlled circumstances:
– RCTs
– Utilisation Management Schemes (UMS)
– Evidence-providing Registries
• Examples
– Coverage of CRC agent by Medicare via RCT and
UMS
– Coverage of prostate cancer “vaccine” by Medicare
via building evidence-providing registry

Conditional Coverage
• Price and reimbursement are (temporary) granted but failure to achieve set targets can result in price and reimbursement changes and/or rebates
• Examples
– Pfizer on statins in the UK
– UK NICE MS scheme
– France: Acomplia

Outcome Guarantee
• Rebates or free product are given by the manufacturer when outcomes are not achieved for individual patients
• Presupposes ability to monitor eligible patients well
• Example: Bortezomib case in UK through NICE guidance (case study separately)

Price and Volume (Budget) Agreements
• A penalty is foreseen when a new drug is overshooting a pre-set budget (PxQ)
• Penalty can take the form of – Rebate or payback
– Lower price for volume above agreed limit
– Lower future price
• Variety of payback clauses – Supplier is fully accountable
– Prescriber and supplier are jointly accountable
– Rebate/Payback to be shared among suppliers
• Examples: Australia, France, Italy, Austria, Portugal

Risks addressed by individual scheme types
Right
patients
Uncertain
clinical
value
Low cost
effectiven
ess
Budget
overspend
Coverage with
ED
Yes Yes Yes x
Conditional
coverage
Yes Yes Yes Yes
Outcome
guarantee
Yes Yes Yes x
Price-volume
deal
x x X Yes

Main objectives of MEAs
BI: Budget impact CE: Cost-effectiveness
Source: Ferrario & Kanavos, 2013

Common elements of MEAs
PVAs: Price-volume agreements pp: per person
Source: Ferrario & Kanavos, 2013

Therapeutic classes ATC groups (according to ATC-index 2011) A: Alimentary tract and metabolism B: Blood and blood forming organs C: Cardiovascular system D: Dermatologicals G: Genito urinary system and sex hormones H: Systemic hormonal preparations, excl. sex hormones and insulins J: Anti-infectives for systemic use L: Antineoplastic and immuno-modulating agents M: Musculo-skeletal system N: Nervous system R: Respiratory system S: Sensory organs; V: Various ATC_Mix: There was one case in Italy where a particular AIFA-note contained medicines from different ATC-groups.
Source: Ferrario & Kanavos, 2013

Duration
The average duration of MEAs varies between Member States, ranging from one year in Belgium (renewable) to up to four years in the Netherlands or for an indefinite period of time subject to review (France, Malta, UK).
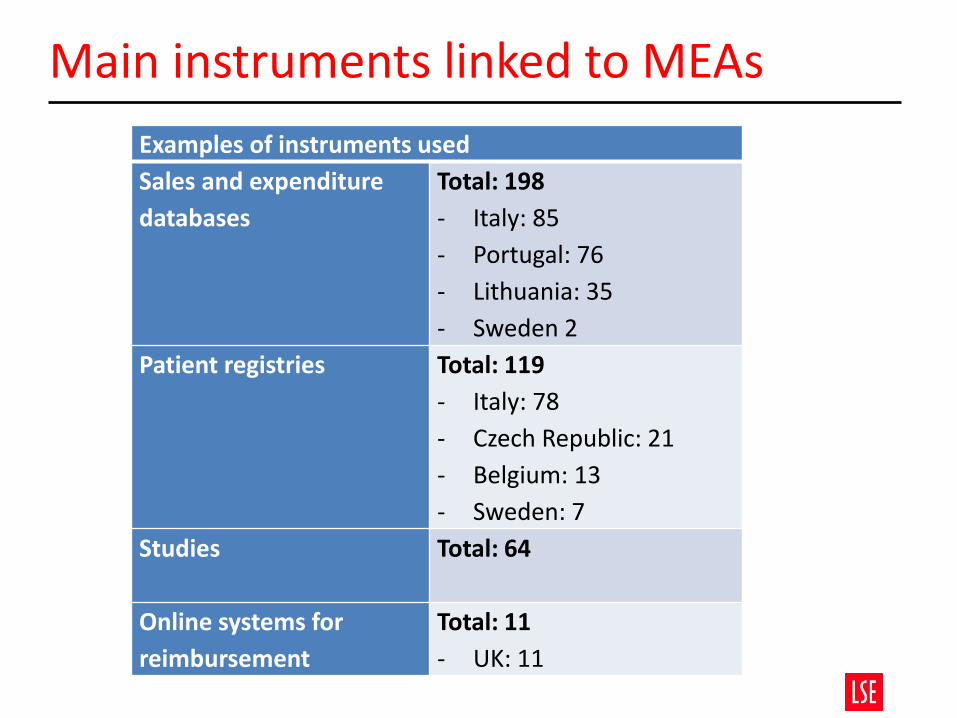
Main instruments linked to MEAs
Examples of instruments used
Sales and expenditure
databases
Total: 198
- Italy: 85
- Portugal: 76
- Lithuania: 35
- Sweden 2
Patient registries Total: 119
- Italy: 78
- Czech Republic: 21
- Belgium: 13
- Sweden: 7
Studies Total: 64
Online systems for
reimbursement
Total: 11
- UK: 11

Actors involved in implementing MEAs
Main stakeholders involved
• Payers, drug assessment agencies, and physicians
Responsibility for negotiating the agreement with the manufacturer
• Payers (e.g. NIHDI in Belgium), drug assessment agencies (e.g. AIFA in Italy, TLV in Sweden) or DoH (UK)
Responsibility for filling in the patient registries
• Physicians usually in collaboration with other stakeholders (e.g. monitoring registries in Italy are managed by AIFA; an advisor physician from the National Health Insurer controls the implementation of MEAs in Belgium)
Responsibility for data provision
• Manufacturers

Taxonomy: A framework for analysing and evaluating MEAs

Ob
ject
ive
Managed entry schemes
Performance-based agreements Financial schemes
Utilisation in the real life
Evidence regarding decision uncertainty
Performance based reimbursement
Coverage with evidence development
Outcome guarantees
Patient elegibility with conditional treatment continuation
Discounts
Utilisation capping Price/volume
Mo
nit
ori
ng
In
str
um
en
ts
Imp
act
Total cost for all
patients
Total cost per patient
Initial discount
on all doses or
free initial doses
for eligible
patients
Reimburseme
nt for higher
than
forecasted
expenditure
Cap on number of doses/total
cost reimbursed per patient
after which the manufacturer
assumes the cost
Discount or free doses
after the agreed
spending/volume
threshold is reached Reassessment which may
lead to price change,
conclusion of new
agreements, or new
reimbursement decision
Discount if drug is
not effective or
less effective than
expected
Reimbursement if drug
is not effective
Treatment interruption if drug
is not effective according to
pre-established targets
Combination
of financial
and
performance
elements

Value Proposition
A strong Value Proposition will be payer-centric in nature, and will contain compelling evidence that – Showcases all dimensions of value (medical/therapeutic-, patient
reported outcome- and economic benefits)
– Reflects the full impact of the innovation to payers and HTAs and
– Translates the clinical profile into a compelling cost/effectiveness ratio
• Using comprehensive and good quality evidence
Leveraging critical value dimensions with a view to constructing tailor-made RSA plans
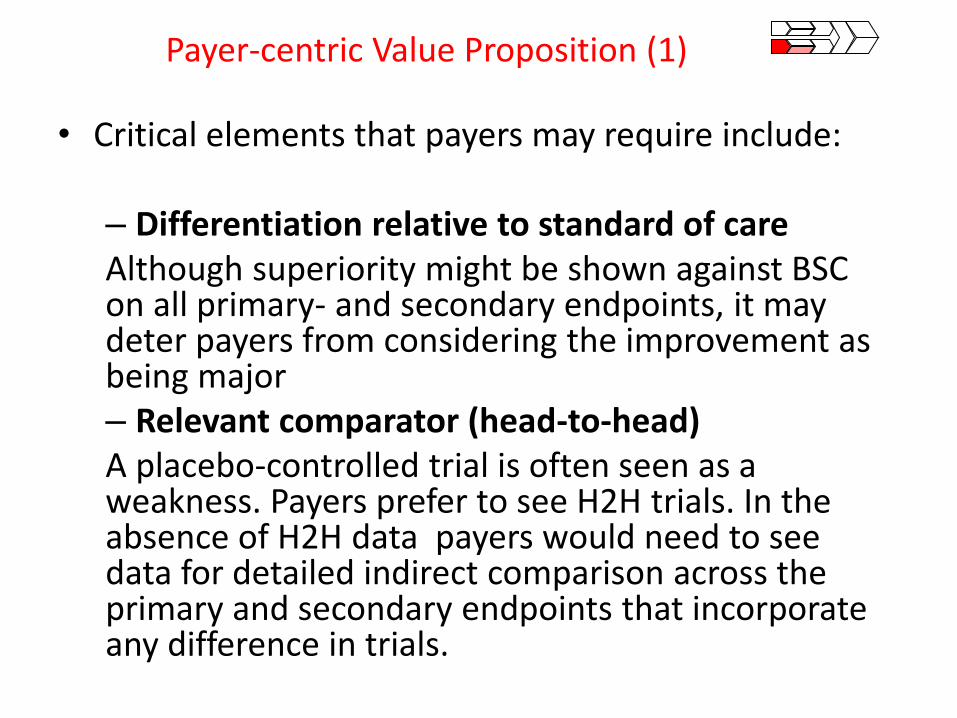
Payer-centric Value Proposition (1)
• Critical elements that payers may require include:
– Differentiation relative to standard of care Although superiority might be shown against BSC on all primary- and secondary endpoints, it may deter payers from considering the improvement as being major – Relevant comparator (head-to-head) A placebo-controlled trial is often seen as a weakness. Payers prefer to see H2H trials. In the absence of H2H data payers would need to see data for detailed indirect comparison across the primary and secondary endpoints that incorporate any difference in trials.

Payer-centric Value Proposition (2)
– Quality of evidence The non-significant claim on overall survival will negatively impact the value perception for payers. Without a clear statistical superiority claim for overall survival, payers will consider new therapies at most comparable to existing ones despite new therapies showing considerable additional benefits on other attributes – Data collection If time horizon is not long enough to capture full clinical- and economic impact of disease payers may demand long-term (real life) data – Comparative efficacy/effectiveness Measures of effect in “real-life” conditions: Clinical- and cost effectiveness data in real-world vs. a clinical setting – Cost effectiveness data Evidence used for the NICE submission but possible other additional
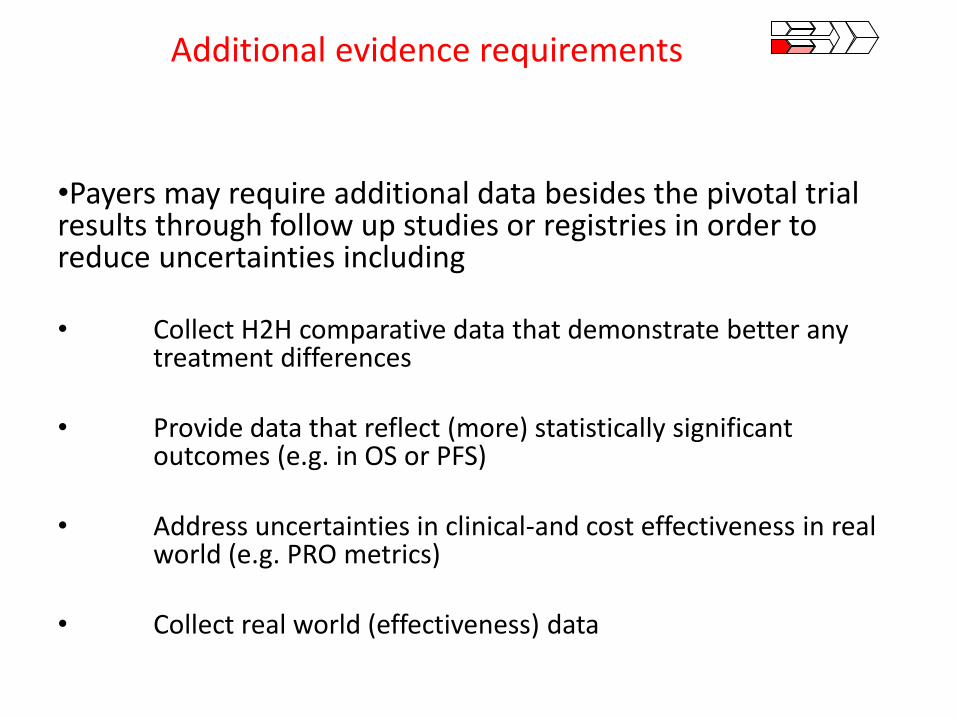
Additional evidence requirements
•Payers may require additional data besides the pivotal trial results through follow up studies or registries in order to reduce uncertainties including
• Collect H2H comparative data that demonstrate better any treatment differences
• Provide data that reflect (more) statistically significant outcomes (e.g. in OS or PFS)
• Address uncertainties in clinical-and cost effectiveness in real
world (e.g. PRO metrics)
• Collect real world (effectiveness) data

Value is multi-dimensional…

…a practical and necessary set of dimensions should be considered
Efficacy
Direct endpoints
Survival
Disease progression
Disease recovery
Clinical events
Symptoms scores
HRQoL
Indirect endpoints
Validated endpoints
Non-validated endpoints
Safety
Adverse drug events
Tolerability
Contraindications and special warnings
Innovation
Mechanism of Action (MoA)
Patient convenience
Socioeconomic
Public health
Direct costs
Indirect costs

Comparative presentation of value drivers
Value drivers
GRECOTINIB vs. HELLASOMAB
Inferior Not stat. dif. Superior
Efficacy
Overall Survival (OS) Median
Overall Survival (OS) Mean
Skeletal Related Effects (SRE) Time to first
Skeletal Related Effects (SRE) Incidence
Objective Response Rate (ORR)
Radiographic Progression Free Survival (rPFS) Median time to
Modified Progression Free Survival (mPFS) Median time to
Biomarker Response
Time to treatment discontinuation (TTTD) Patients proportion
Radiographic Progression Free Survival (rPFS) Patient proportion free of
progression
?
Biomarker Progression Patient proportion free of
progression
?
Skeletal Related Effects (SRE) Rate ?
Biomarker Progression Median time to ?
Safety
Adverse events Hypokalemia
Tolerability Hepatotoxicity
Adverse events Bone pain ?
Innovation
Mechanism of Action (MoA)
Patient convenience Special instructions
Socioeconomic
Direct medical costs Outpatient visits
Value for money Cost effectiveness
Value for money Cost minimisation

Health Insurer’s Point of View
Health Insurers might be willing to confirm the content of the Value Proposition or willing to build their own version reflecting or adjusting for their own perspective.
• Most of the data should be available through the peer review literature
• -If not published their credibility might be questioned • -Insurers might conduct their own systematic literature review(s) to • ensure all critical evidence is incorporated
• Other sources might be required for the collection of real world effectiveness data and resource use (cost of illness) data
• -Registries and observational studies

Constructing RSAs
• The content of the value proposition can then inform the discussions surrounding the development of potential RSA options.
• Aim is to leverage Uncertainties (clinical, cost-
effectiveness, other) of the technology in order to decrease the risk of a worst-off clinical benefit-risk ratio (BRR) or incremental cost effectiveness ratio (ICER) in real settings.
• Need to make a series of hypothetical scenarios on
expected volumes and expected prices.

Volume expectations
Expectations on volume are needed to inform RSAs.
• Follow-on products: epidemiological data on
disease prevalence should be available • -WHO, CDC, national databases, peer review literature
• First-in-class: data on disease prevalence might not be available
• -Conduct primary data collection activities such as • observational and descriptive studies, e.g. national registries
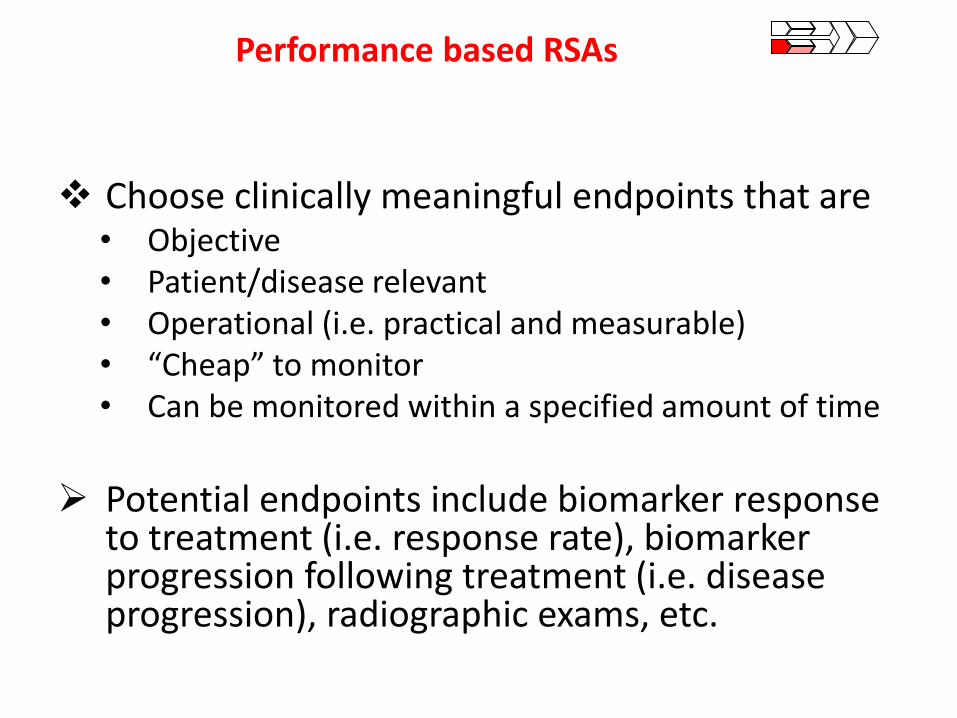
Performance based RSAs
Choose clinically meaningful endpoints that are • Objective • Patient/disease relevant • Operational (i.e. practical and measurable) • “Cheap” to monitor • Can be monitored within a specified amount of time
Potential endpoints include biomarker response
to treatment (i.e. response rate), biomarker progression following treatment (i.e. disease progression), radiographic exams, etc.

Financial based RSAs
Simpler than performance based agreements
Make use of confidential discounts between the manufacturer and the payer
Sales cap based on price-volume agreement
Based on the grounds of budget impact
Potential options include the application of single discounts, multiple discounts (e.g. 100% discount for the first 3 mo, 50% discount for the next 3 mo, ending up paying full price), and revenue or sales caps