risk-targeted maps for seismic design. a brief review of
TRANSCRIPT
Ro. J. Techn. Sci. − Appl. Mechanics, Vol. 62, N° 1, P. 80−97, Bucharest, 2017
RISK-TARGETED MAPS FOR SEISMIC DESIGN. A BRIEF REVIEW OF THE STATE-OF-THE-ART
RADU VACAREANU , VERONICA COLIBA
Abstract. The uniform hazard approach is currently used for almost all seismic design maps enforced worldwide. That being the case, the seismic risk of buildings designed according to uniform hazard values of ground motions parameters cannot be uniform all over the territory, as the slopes of the hazard curves can differ from a site to another. The aim of this study is to present and assess different methodologies concerning risk-targeted seismic design maps and to differentiate the parameters that can influence the overall shape and site-specific values of such maps.
Key words: earthquake, hazard curves, risk-targeted, seismic risk.
1. INTRODUCTION
In the last decade, the methodology that employs the use of risk-targeted maps for the design of new structures has been highly emphasized as being the best method in order to obtain the same risk of failure of buildings all over a given territory. This methodology employs the convolution between seismic hazard curves and fragility functions in order to assess the annual probability of failure of structures designed according to codes.
Recent papers concerning the topic under review have been published, such as Fiorini et al. [1] for Italy, Silva et al. [2] for Europe, Douglas et al. [3] for France and the first published article on the subject, Luco et al. [4] for the conterminous US. For Romania, the first attempts to obtain risk-targeted maps were made in Vacareanu et al. [5, 6] and in Coliba et al. [7], considering different values for the parameters that influence the results.
One of the most important advantage of developing risk-targeted maps is that it uses all the information contained in a hazard curve, as oppose to the method that employs a uniform hazard, that uses one value associated with a certain mean return period (MRP) for a given site.
The maps are obtained by quantifying the value of a ground motion intensity parameter associated to an acceptable level of risk. The effective risk is computed by integrating the hazard curves, obtained through a probabilistic assessment of the seismic hazard, with the first derivative of fragility functions. The value of the
Technical University of Civil Engineering of Bucharest, Seismic Risk Assessment Research Centre,. E-mails: [email protected], [email protected]
Vacareanu, R. and Coliba, V., 2017. Risk-targeted maps for seismic design. A brief review of the state-of-the-art. Romanian Journal of Technical Sciences − Applied Mechanics, 62(1), pp.80−97.
2 Risk-targeted maps for seismic design. A brief review of the state-of-the-art 81
ground motion intensity parameter for an acceptable level of risk is obtained iteratively. According to Douglas & Gkimprixis [8], this methodology has three major advantages, as oppose to the classical methodology of employing uniform hazard values of ground motion intensity parameter, namely: transparency, assurance that one has the same risk of failure all over a territory and possibility to compare the natural hazards (e.g. earthquakes vs wind). But, one has to set a priori a level of seismic risk that is acceptable to the society, economically feasible and cost-efficient for the design lifetime of the building.
The development of risk-targeted design maps is generally based on three parameters: hazard curves (for every considered site) that describes the mean annual frequency of exceedance of various values of a ground motion parameter, fragility functions that show the probability of a structure of being in a certain damage state or to exceed it for various values of a ground motion parameter, and the target acceptable risk (described by the annual probability of collapse/failure) decided by the building officials/decision makers. One has to mention that failure/ collapse means the exceedance of any given limit state for the building/structure.
2. PROBABILISTIC SEISMIC HAZARD ASSESSMENT
The outcome of the probabilistic seismic hazard assessment (PSHA) can be expressed through different means. The main outcome of the computations for a given site is the hazard curve, that indicate the annual rate of exceedance various values of a ground motion intensity parameter [9]. The probabilistic computations combine the frequency of occurrence of earthquakes with various magnitudes and locations with the probabilities of exceedance of ground motion parameter intensities given the occurrence of earthquakes. The hazard curves are obtained for different seismic sources and then combined in order to express the aggregated hazard for a certain site. The probability of exceeding a certain level y, of a ground motion intensity parameter is calculated for a seismic event, in a certain location and then it is multiplied by the probability that the seismic event occurs in the same exact location. The process is repeated for all magnitudes, all possible source-site distances and all intensities of ground motion parameter, each with its own probability.
The different results of PSHA used in previous studies for obtaining uniform seismic risk maps are reviewed hereinafter. Luco et al. [4] uses, for the 2003 and 2009 NEHRP (National Earthquake Hazards Reduction Program) Provisions for conterminous US, the PSHA results obtained by United States Geological Survey, as reported in [4]. In Fiorini et al. [1], the PSHA input from the hazard curves developed by INGV (Italian Institute of Geophysics and Volcanology) in 2004, are the values of horizontal peak ground accelerations corresponding to nine mean return periods, from 30 to 2475 years. In the case of Europe, in Silva et al. [11], the input concerning the seismic hazard is the one developed in SHARE project (Seismic Hazard Harmonization in Europe – Danciu et al. [15]), where the seismic

Radu Vacareanu, Veronica Coliba 3 82
hazard maps are in terms of peak ground acceleration and spectral ordinates of up to 10 seconds, and exceeding probabilities between 1% and 50% in 50 years [11]. For Romania, the risk-targeted seismic design maps are based on hazard curves obtained from the most recent probabilistic seismic hazard assessment, performed within the BIGSEES (http://infp.infp.ro/bigsees/default.htm) research project. The input is provided by the hazard curves for 200 sites distributed all over the Romanian territory [16]. The same hazard curves are employed in all of the three studies for Romania (Vacareanu et al. [5, 6] and Coliba et al. [7]). For France, in Douglas et al. [3], two studies are used as input for the seismic hazard, one developed by GEO-TER (Géologie Tectonique Environnement et Risques), where uniform hazard maps (in terms of peak ground accelerations) are computed for different values of mean return periods (100, 475, 975 and 1975 years) and a study performed by GEPP (Groupe d’Etudes et de Propositions pour la Prévention du risque sismique en France), where maps for a mean return period of 475 years are considered; later on, the results of this study became part of the French National Annex of the Eurocode 8 [18].
3. FRAGILITY FUNCTIONS AND THEIR VARIABILITY
In the evaluation of seismic risk, the structural capacity of a building is defined by the median thresholds between limit states, along with their uncertainties. Different criteria have been proposed for defining the thresholds, depending on the typology of elements at risk and by the method employed to derive fragility functions. The most common way to define the adverse consequences of an earthquake is to classify them according to five damage states: none, slight, moderate, extensive and complete.
Different methodologies are employed to obtain fragility functions, varying in difficulty from very complex (analytical methods) to fairly simple and subjective (empirical). They are grouped in four categories: empirical, analytical, based on expert opinion and hybrid. The empirical methods are based on post-earthquake assessments of the seismic damage. The analytical methodologies estimate the distribution of damage by simulating the response of structural systems subjected to seismic action. The ground motions to which the systems are subjected to are represented by response spectra (static) or by time histories of recorded, generated or simulated ground motions (dynamic).
The methodologies based on expert opinion are developed by aggregating the opinion of experts on the expected seismic behaviour of the elements at risk, that judge the probability of failure in accordance to the magnitude of the seismic event [10]. The hybrid methodologies use the first three ones combined (or two by two), by intertwining each other in order to obtain a better evaluation.
One of the issues that arises is the typology of buildings for which the fragility functions are computed. Ideally, they should be based on the seismic design code in force (e.g. P100-1/2013 [19] for Romania) and should consider all

4 Risk-targeted maps for seismic design. A brief review of the state-of-the-art 83
types of buildings by employing a median curve in order to account for the epistemic uncertainties.
The fragility function is the probability distribution of the seismic capacity of a given building typology conditional upon the values of a ground motion parameter or intensity measure. Usually, the seismic capacity of a building/ structure can be expressed in a probabilistic manner. If one considers the lognormal distribution of probability, the uncertainty concerning the seismic capacity of a structure is quantified by the logarithmic standard deviation β.
In the case of the United States, nonlinear structural analyses have been performed in order to quantify this value and the standard deviation was found to be 0.8 [4]. The use of large values for the standard deviation in regions with a high level of seismicity leads to extremely large collapse probabilities, which seems unrealistic [2]. In Luco et al. [4], several typical buildings have been analyzed, in order to compute median fragility curves, concluding with the fact that there is a collapse probability of 10% for a mean return period of 2475 years with a standard deviation of 0.8. In Douglas et al. (2013), a logarithmic standard deviation of 0.5 was used. Silva et al. [2] used a value of 0.5 for the 2014 study, following with an update in 2016 [11], where the value is increased to 0.6. Fiorini et al. [1] makes a comparison between the values for the standard deviation adopted in Luco et al. [4] and Silva et al. [2], namely 0.8 and 0.5 respectively. In the case of Romania, the first study Vacareanu et al. [5] uses values of 0.6 (same as the second study [6]) and 0.8 for the logarithmic standard deviation, following with a value of 0.5 for the third study, in Coliba et al. [7].
4. ACCEPTABLE COLLAPSE PROBABILITY
The failure/collapse is defined in this paper as the exceedance of any given limit state. The annual probability of failure/collapse is equal to the probability of exceedance of a limit state in any given year. One of the most important aspects to be considered is the acceptable or target level of risk. This level is set by the decision of building officials [7].
In literature, these values differ on national or regional bases. For the conterminous US, in Luco et al. [4], a collapse probability of 1% in 50 years (around 2·10-4 annually) was used; for France, in Douglas et al. [3], a value of 10-5 is specified. For Italy, in Fiorini et al. [1] two target values were used: 1% in 50 years along with a 0.8 value for the logarithmic standard deviation that describes the fragility function, and 0.05% in 50 years with a 0.5 standard deviation. Concerning the European continent, a value of 5·10-6 was established to be appropriate [11].
The first risk-targeted maps for Romania were developed in Vacareanu et al. [5], which considered values of 0.6 and 0.8 for the logarithmic standard deviation and collapse probabilities of 2·10-4, previously employed in Luco et al. [4] for the conterminous US and in Silva et al. [11] for Europe. The second study [6] uses a

Radu Vacareanu, Veronica Coliba 5 84
slightly different methodology, by using as input for each site the target annual collapse probability obtained for Focsani city. This city was chosen due to its proximity to the Vrancea intermediary-depth seismic source, the main source of seismicity of Romania, as well as for the fact that the highest annual probability of failure is obtained for Focsani. For a value of 0.6 for logarithmic standard deviation and peak ground acceleration value with mean return period of 475 years considered as 0.5 and 0.1 quantiles of fragility functions, the collapse probabilities are 1.04·10-2 and 1.65·10-3 [6]. The third study uses a value of annual probability of failure of 5·10-3 [7]. Different values were used in other papers: 1.3·10-6 in Vanzi et al. [12], equal to the collapse probability from EN 1990 [13] for gravitational loads, and between 10-5 and 10-7 in Ulrich et al. [14]. According to Silva et al. [11], the difference between these values demonstrates that there isn’t an agreement in the international scientific community on this matter. One has to mention that, besides the US provisions, no other regulations set a value for the acceptable seismic risk.
5. COMPUTATION OF RISK-TARGETED MAPS
In order to compute the annual collapse probability, in this paper one uses the method described in Douglas et al. (2013), based on Kennedy (2011). The annual probability of collapse is computed through the convolution integral of the seismic hazard of the site with the fragility functions of the buildings, by the use of any of the following relations:
|
0
d( ) d
dF a
F AP
P H a aa
∞
= ∫ (1)
|0
d ( ) d ,dA
F F aH aP P a
a
∞
= − ∫ (2)
where: PF |a is the fragility function (probability of exceeding a given limit state conditional on the ground motion intensity parameter a), HA(a) is the hazard curve (annual rate of exceedance of a certain ground motion intensity parameter a).
Consequently, in order to obtain a uniform target risk for any number of given sites, one needs the seismic hazard curves for the sites and the fragility curves of the buildings/structures [7].
It is necessary to establish a link between the design ground acceleration and the fragility functions used for integrating the risk equation. For a fragility function following a lognormal distribution, only one point is necessary (if the standard deviation is fixed) to define the whole fragility curve. Considering different values for the mean return period (or annual rate of exceedance, the values being interchangeable), the corresponding peak ground accelerations (PGAs) are

6 Risk-targeted maps for seismic design. A brief review of the state-of-the-art 85
obtained from the hazard curves. The corresponding PGA values are considered as inferior quantiles (percentiles) of the lognormal distribution (e.g. 0.02, which shows that there is a 0.02 probability that the considered limit state is exceeded for values lower than the corresponding quantile value), which, along with the value of the logarithmic standard deviation, allow to obtain the median value and to completely define the fragility function [5]. A pertinent choice is the design value of the ground motion intensity parameter and the probability of a building to attain the fixed limit when it is subjected to it [8].
Afterwards, under the Poisson assumption, the annual rate of failure is converted into an annual probability of failure (Pf) and it is compared with the target value. The interactive process continue until computed probability is (within a given tolerance) equal to the target risk [7].
6. RESULTS
For France, the results of the iterative computation of uniform seismic risk, in terms of peak ground acceleration, are detailed for six cities in order to emphasize the differences between the values by employing both methodologies, uniform hazard versus uniform risk. The values are represented in Table 1 [3].
Table 1
Peak ground accelerations for a collapse probability of 10-5 and a standard deviation of 0.5 [3]
Paris Lyon Nantes Nice Grenoble Lourdes agRmin [m/s2] - 0.70 1.10 1.10 1.60 1.60 exact 0.35 1.03 1.18 1.46 2.17 2.74 agRmax [m/s2] 0.70 1.10 1.60 1.60 3.00 3.00 PGA [m/s2] 0.47 0.92 1.02 1.26 1.81 2.04 MRP [years] 911 343 320 310 294 198
In Table 1, agRmin is the lower limit of the peak ground acceleration range, exact is the exact value of the peak ground acceleration, agRmax is the upper limit of the peak ground acceleration range, PGA is the value corresponding to mean return period of 475 years, and MRP is the return period corresponding to PGAs [3].
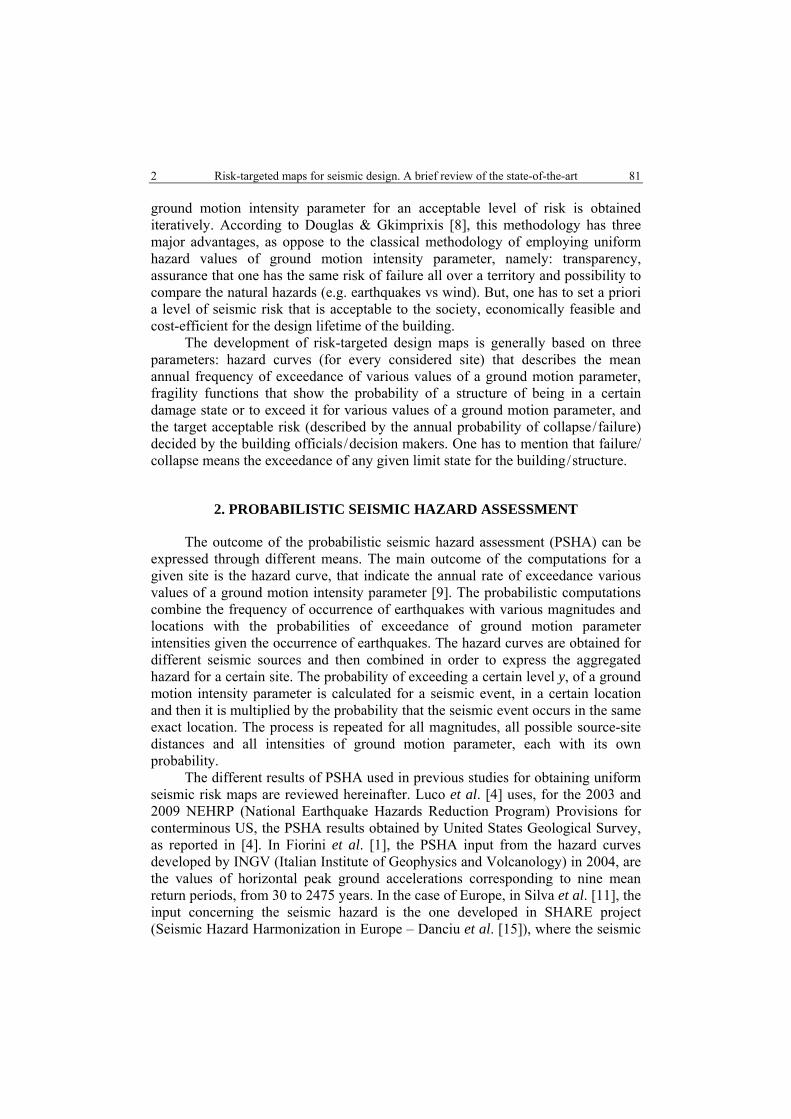
Except for Paris, the risk-targeted PGA values are slightly smaller; consequently, they are associated with mean return periods smaller than 475 years. The resulting map is illustrated in Fig. 1, in terms of PGA, for a collapse probability of 10-5 and a logarithmic standard deviation describing the fragility functions of 0.5 [3].
Radu Vacareanu, Veronica Coliba 7 86
Fig. 1 – Risk-targeted map for France,
in terms of PGA [m/s2] (Douglas et al. [3]).
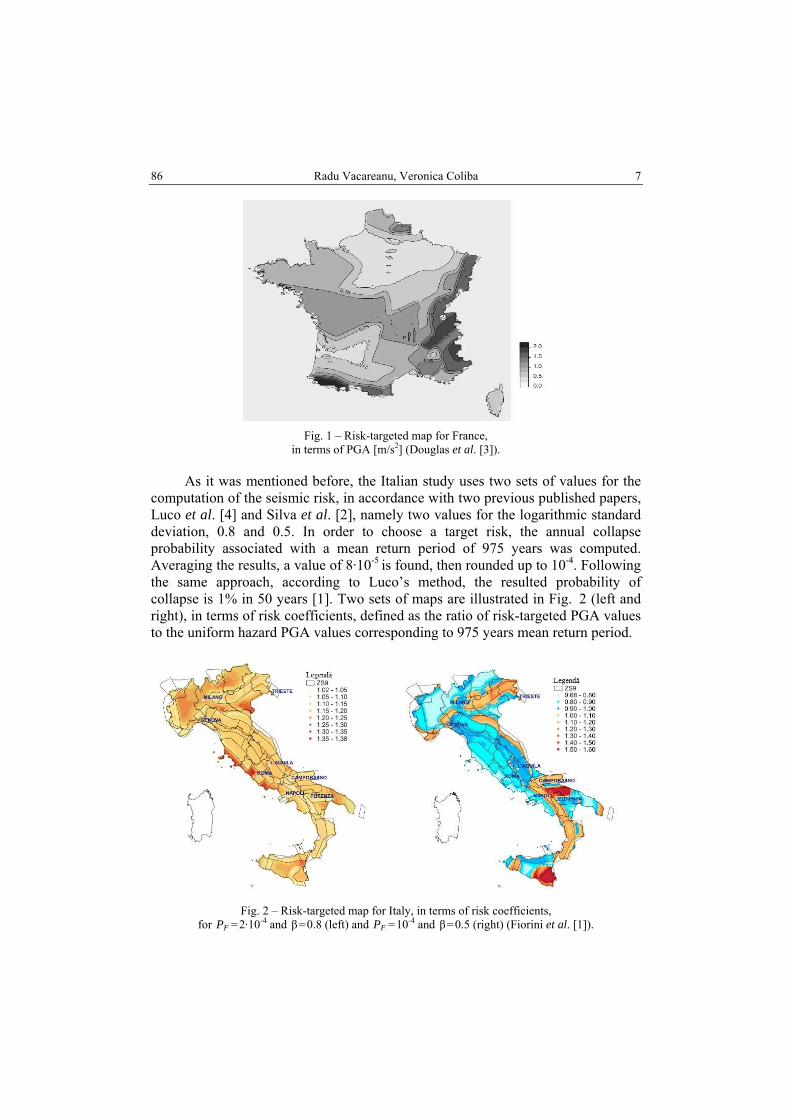
As it was mentioned before, the Italian study uses two sets of values for the computation of the seismic risk, in accordance with two previous published papers, Luco et al. [4] and Silva et al. [2], namely two values for the logarithmic standard deviation, 0.8 and 0.5. In order to choose a target risk, the annual collapse probability associated with a mean return period of 975 years was computed. Averaging the results, a value of 8·10-5 is found, then rounded up to 10-4. Following the same approach, according to Luco’s method, the resulted probability of collapse is 1% in 50 years [1]. Two sets of maps are illustrated in Fig. 2 (left and right), in terms of risk coefficients, defined as the ratio of risk-targeted PGA values to the uniform hazard PGA values corresponding to 975 years mean return period.
Fig. 2 – Risk-targeted map for Italy, in terms of risk coefficients,
for PF =2·10-4 and β=0.8 (left) and PF =10-4 and β=0.5 (right) (Fiorini et al. [1]).
8 Risk-targeted maps for seismic design. A brief review of the state-of-the-art 87
Following Luco’s parameters, the results show a need to increase the design ground motions in order to attain the target annual collapse probability, as most of the risk coefficients are above 1 (in particular the area surrounding Milan city). With the use of Silva’s parameters, the results show the exact opposite, all of the values being below 1 in most of the regions, apart from some that require an increase in design ground motions in order to reach the target annual collapse probability of 10-4.
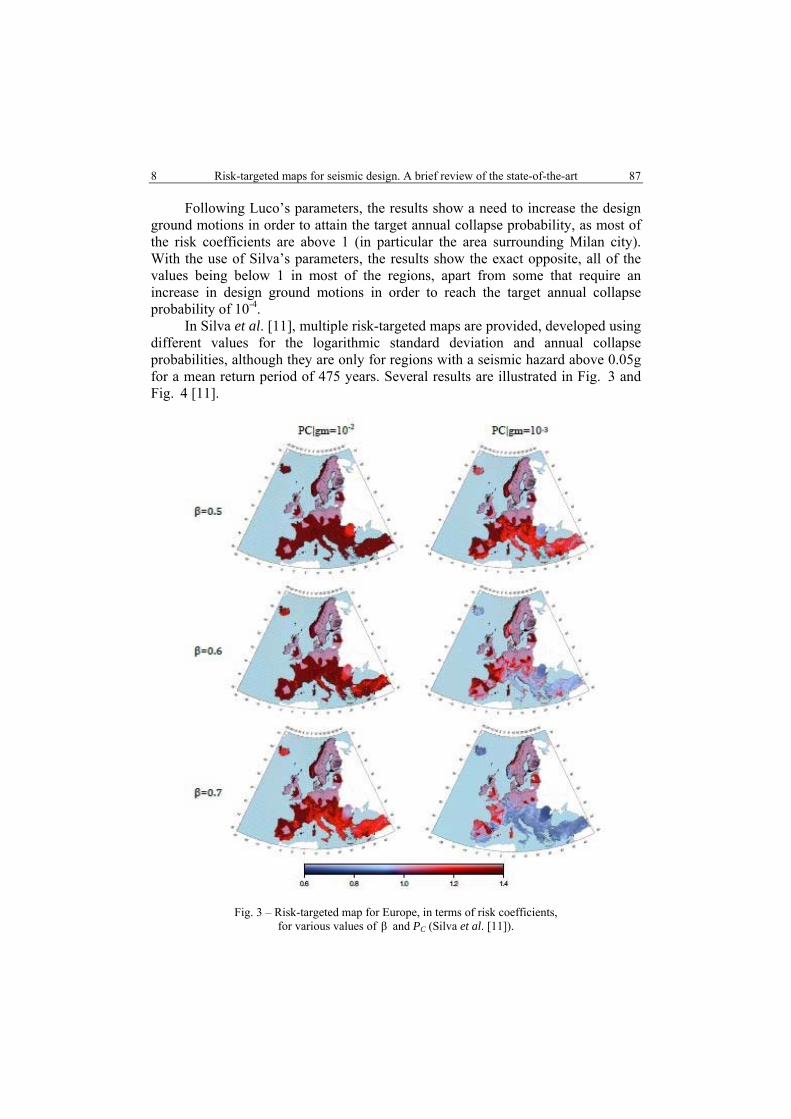
In Silva et al. [11], multiple risk-targeted maps are provided, developed using different values for the logarithmic standard deviation and annual collapse probabilities, although they are only for regions with a seismic hazard above 0.05g for a mean return period of 475 years. Several results are illustrated in Fig. 3 and Fig. 4 [11].
Fig. 3 – Risk-targeted map for Europe, in terms of risk coefficients,
for various values of β and PC (Silva et al. [11]).
Radu Vacareanu, Veronica Coliba 9 88
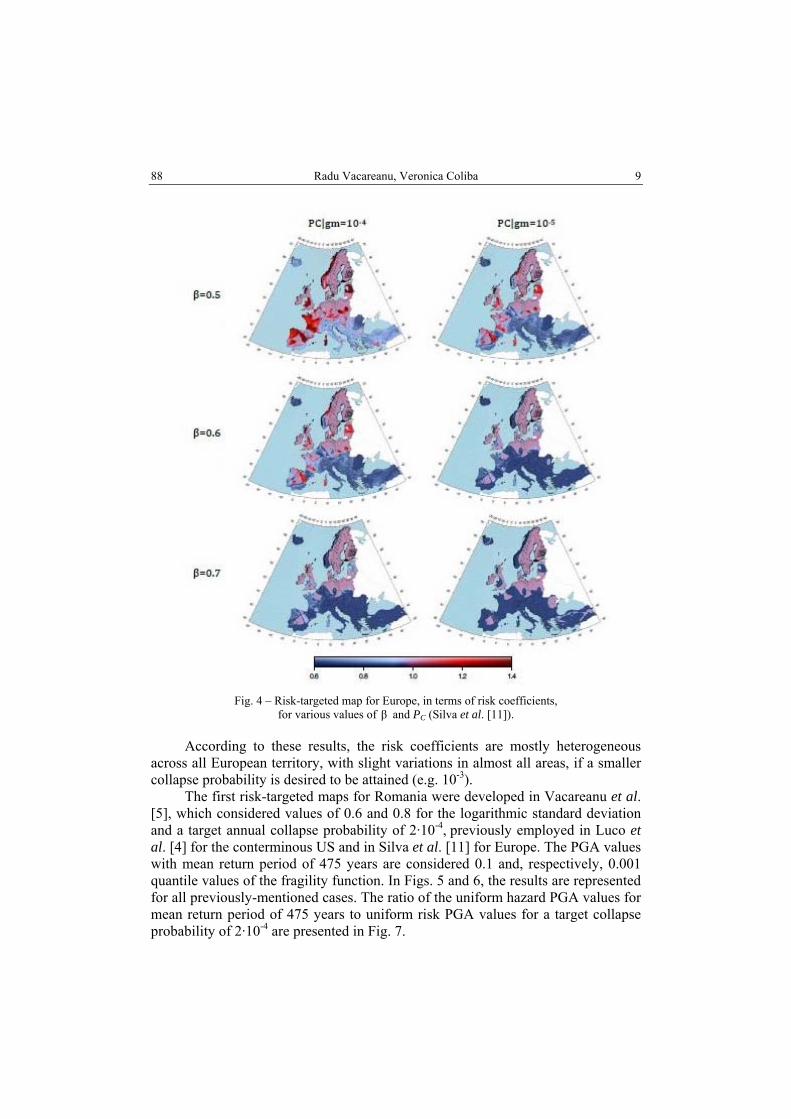
Fig. 4 – Risk-targeted map for Europe, in terms of risk coefficients,
for various values of β and PC (Silva et al. [11]).
According to these results, the risk coefficients are mostly heterogeneous across all European territory, with slight variations in almost all areas, if a smaller collapse probability is desired to be attained (e.g. 10-3).
The first risk-targeted maps for Romania were developed in Vacareanu et al. [5], which considered values of 0.6 and 0.8 for the logarithmic standard deviation and a target annual collapse probability of 2·10-4, previously employed in Luco et al. [4] for the conterminous US and in Silva et al. [11] for Europe. The PGA values with mean return period of 475 years are considered 0.1 and, respectively, 0.001 quantile values of the fragility function. In Figs. 5 and 6, the results are represented for all previously-mentioned cases. The ratio of the uniform hazard PGA values for mean return period of 475 years to uniform risk PGA values for a target collapse probability of 2·10-4 are presented in Fig. 7.
10 Risk-targeted maps for seismic design. A brief review of the state-of-the-art 89
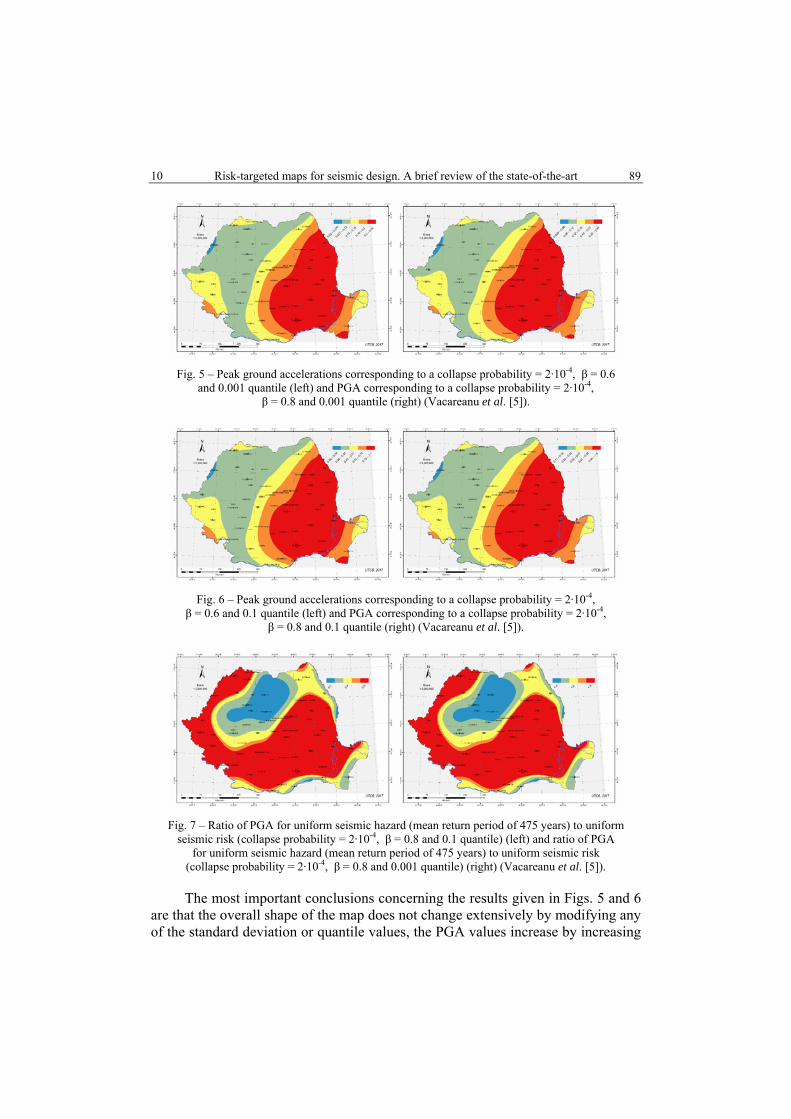
Fig. 5 – Peak ground accelerations corresponding to a collapse probability = 2·10-4, β = 0.6
and 0.001 quantile (left) and PGA corresponding to a collapse probability = 2·10-4, β = 0.8 and 0.001 quantile (right) (Vacareanu et al. [5]).
Fig. 6 – Peak ground accelerations corresponding to a collapse probability = 2·10-4,
β = 0.6 and 0.1 quantile (left) and PGA corresponding to a collapse probability = 2·10-4, β = 0.8 and 0.1 quantile (right) (Vacareanu et al. [5]).
Fig. 7 – Ratio of PGA for uniform seismic hazard (mean return period of 475 years) to uniform
seismic risk (collapse probability = 2·10-4, β = 0.8 and 0.1 quantile) (left) and ratio of PGA for uniform seismic hazard (mean return period of 475 years) to uniform seismic risk
(collapse probability = 2·10-4, β = 0.8 and 0.001 quantile) (right) (Vacareanu et al. [5]).
The most important conclusions concerning the results given in Figs. 5 and 6 are that the overall shape of the map does not change extensively by modifying any of the standard deviation or quantile values, the PGA values increase by increasing

Radu Vacareanu, Veronica Coliba 11 90
the standard deviation and the shape of the map resembles the one obtained in Pavel et al. [17] for uniform hazard approach [5].
The study presented in [6] uses a slightly different methodology, by using as target risk for each site the annual probability of collapse for Focsani. This city was chosen due to its proximity to the Vrancea intermediary-depth seismic source, the most important source of seismicity for Romania, as well as for the fact that in this location the largest probabilities are obtained. Considering that the PGA value for Focsani corresponding to a mean return period of 475 years is 0.5, respectively 0.1 quantiles of fragility function, and a logarithmic standard deviation of 0.6, the annual collapse probabilities for Focsani are 1.04·10-2, respectively 1.65·10-3 [6]. The results of the study presented in [6] are depicted in Figs. 8 and 9.
Fig. 8 – Risk-targeted map for a target annual collapse probability of 1.04·10-2, β = 0.6 and 0.5 quantile (left) and 0.1 quantile (right) (Vacareanu et al. [6]).
Fig. 9 – Risk-targeted map for a target annual collapse probability of 1.65·10-3, β = 0.6 and 0.5 quantile (left) and 0.1 quantile (right) (Vacareanu et al. [6]).
The most important observations regarding the results given in Figs. 8 and 9 are that the appearance of the maps does not change by setting different quantile values, besides the fact that the PGA values decrease by almost three times (for 0.1 quantile and 0.001 quantile); the same trend that was also noticed in Vacareanu et al. [5]. The results show that by employing the indirect method (considering a target

12 Risk-targeted maps for seismic design. A brief review of the state-of-the-art 91
annual collapse probability), the overall shape of the map does not change considerably; the only differences noticed are in the values of peak ground acceleration.
The third study for Romania, Coliba et al. [7], uses a target annual probability of collapse of 5·10-3; the results are presented in Fig. 10.
Fig. 10 – Risk-targeted map, in terms of PGA (g), for a target annual collapse probability of 5·10-3 (Coliba et al. [7]).
For any given site, the risk coefficient is computed as the ratio of the uniform seismic hazard PGA values to uniform seismic risk PGA values, as follows:
uniform risk ground motion parameter value .uniform hazard ground motion parameter valueRC = (3)
The maps in Fig. 11 represent the risk coefficients, computed as the ratio of PGA values for a target annual collapse probability of 5·10-3 to the PGA values with 10%, respectively 20% exceedance probability in 50 years. The results show that, generally, the PGA values associated with a uniform seismic risk, compared to the PGA values with an exceedance probability of 10% in 50 years, would increase in fore-arc regions of the Carpathian Arc (including Vrancea) and would moderately decrease in back-arc regions. As for the PGA values with 20% exceedance probability in 50 years, the risk coefficients increase all over the Romania territory with values ranging from 1.11 to 1.4 [7].
Radu Vacareanu, Veronica Coliba 13 92
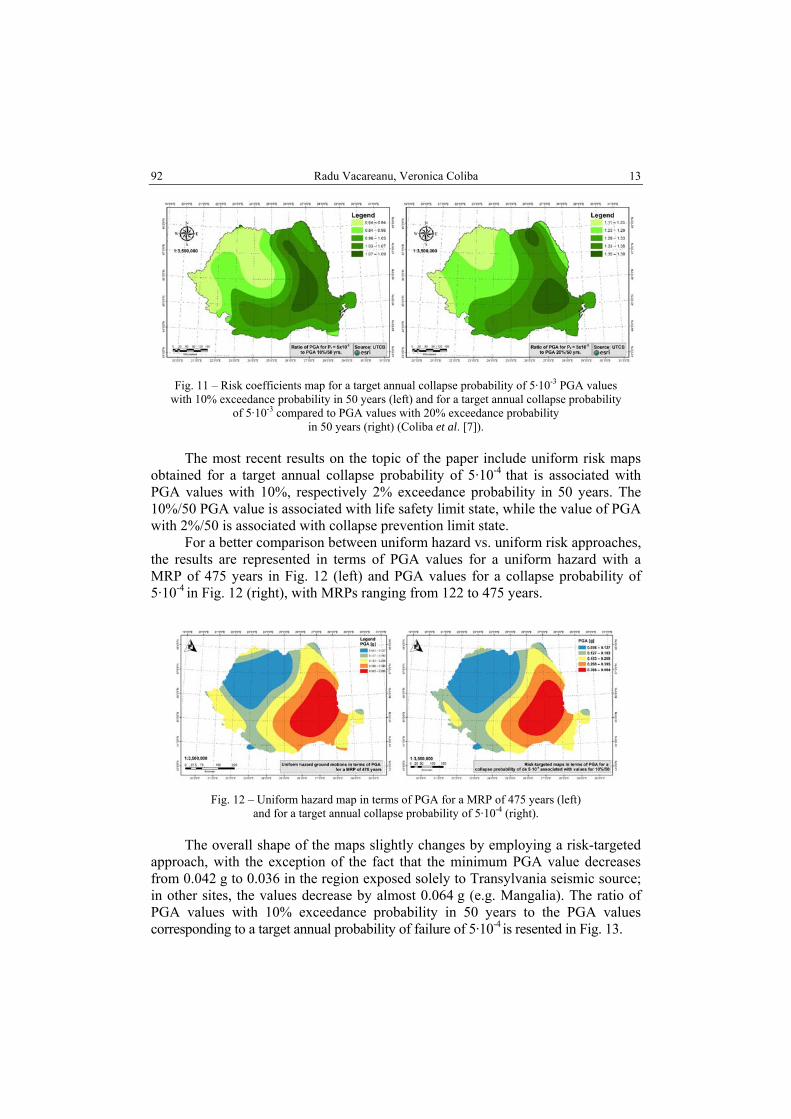
Fig. 11 – Risk coefficients map for a target annual collapse probability of 5·10-3 PGA values
with 10% exceedance probability in 50 years (left) and for a target annual collapse probability of 5·10-3 compared to PGA values with 20% exceedance probability
in 50 years (right) (Coliba et al. [7]).
The most recent results on the topic of the paper include uniform risk maps obtained for a target annual collapse probability of 5·10-4 that is associated with PGA values with 10%, respectively 2% exceedance probability in 50 years. The 10%/50 PGA value is associated with life safety limit state, while the value of PGA with 2%/50 is associated with collapse prevention limit state.
For a better comparison between uniform hazard vs. uniform risk approaches, the results are represented in terms of PGA values for a uniform hazard with a MRP of 475 years in Fig. 12 (left) and PGA values for a collapse probability of 5·10-4 in Fig. 12 (right), with MRPs ranging from 122 to 475 years.
Fig. 12 – Uniform hazard map in terms of PGA for a MRP of 475 years (left)
and for a target annual collapse probability of 5·10-4 (right).
The overall shape of the maps slightly changes by employing a risk-targeted approach, with the exception of the fact that the minimum PGA value decreases from 0.042 g to 0.036 in the region exposed solely to Transylvania seismic source; in other sites, the values decrease by almost 0.064 g (e.g. Mangalia). The ratio of PGA values with 10% exceedance probability in 50 years to the PGA values corresponding to a target annual probability of failure of 5·10-4 is resented in Fig. 13.
14 Risk-targeted maps for seismic design. A brief review of the state-of-the-art 93
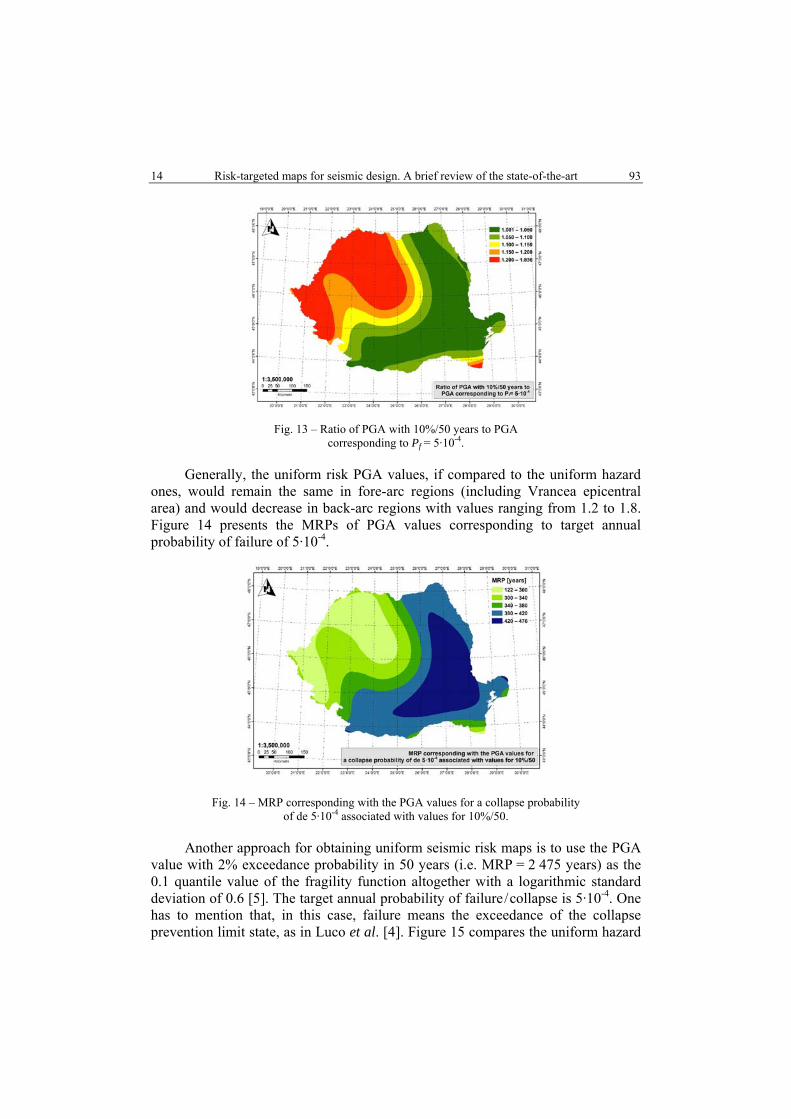
Fig. 13 – Ratio of PGA with 10%/50 years to PGA
corresponding to Pf = 5·10-4.
Generally, the uniform risk PGA values, if compared to the uniform hazard ones, would remain the same in fore-arc regions (including Vrancea epicentral area) and would decrease in back-arc regions with values ranging from 1.2 to 1.8. Figure 14 presents the MRPs of PGA values corresponding to target annual probability of failure of 5·10-4.
Fig. 14 – MRP corresponding with the PGA values for a collapse probability of de 5·10-4 associated with values for 10%/50.
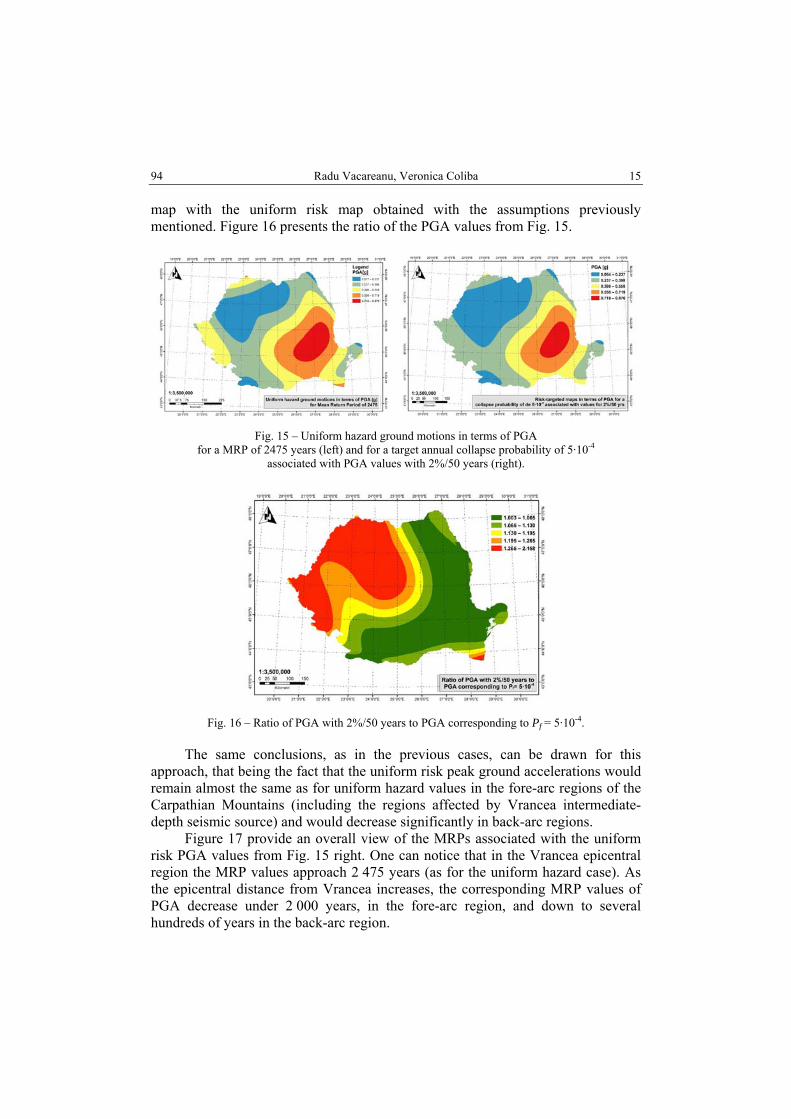
Another approach for obtaining uniform seismic risk maps is to use the PGA value with 2% exceedance probability in 50 years (i.e. MRP = 2 475 years) as the 0.1 quantile value of the fragility function altogether with a logarithmic standard deviation of 0.6 [5]. The target annual probability of failure/collapse is 5·10-4. One has to mention that, in this case, failure means the exceedance of the collapse prevention limit state, as in Luco et al. [4]. Figure 15 compares the uniform hazard
Radu Vacareanu, Veronica Coliba 15 94
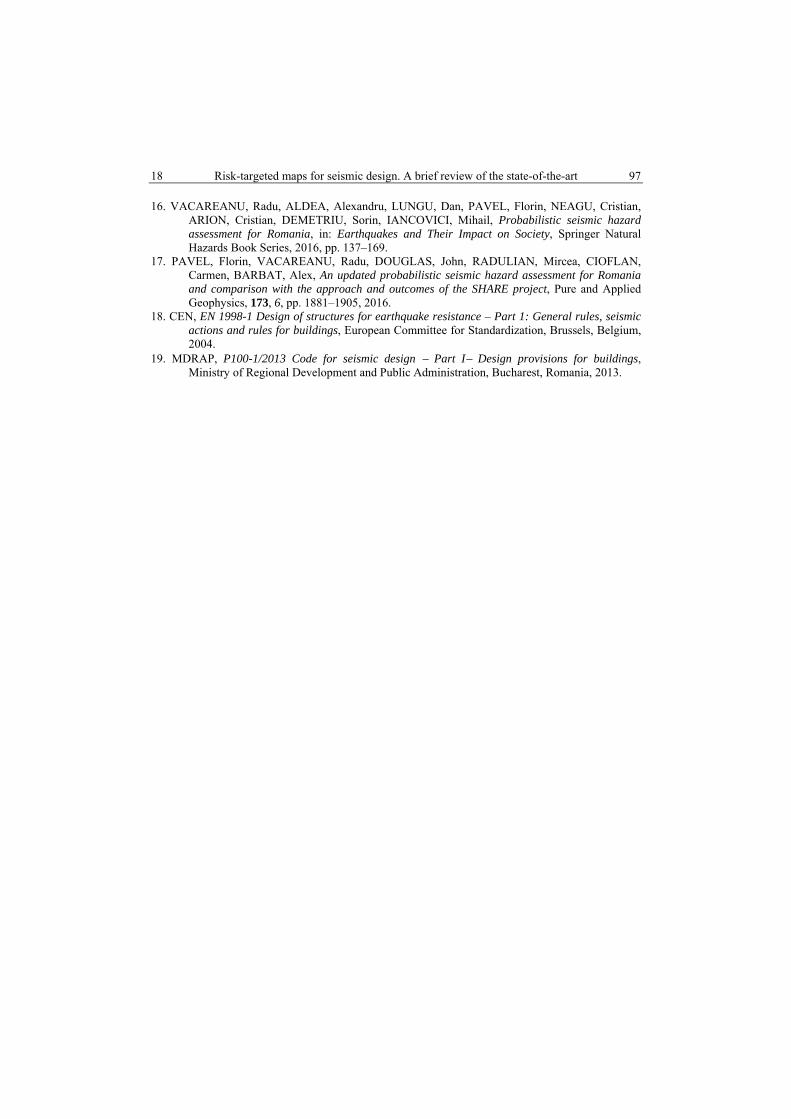
map with the uniform risk map obtained with the assumptions previously mentioned. Figure 16 presents the ratio of the PGA values from Fig. 15.
Fig. 15 – Uniform hazard ground motions in terms of PGA
for a MRP of 2475 years (left) and for a target annual collapse probability of 5·10-4 associated with PGA values with 2%/50 years (right).
Fig. 16 – Ratio of PGA with 2%/50 years to PGA corresponding to Pf = 5·10-4.
The same conclusions, as in the previous cases, can be drawn for this approach, that being the fact that the uniform risk peak ground accelerations would remain almost the same as for uniform hazard values in the fore-arc regions of the Carpathian Mountains (including the regions affected by Vrancea intermediate-depth seismic source) and would decrease significantly in back-arc regions.
Figure 17 provide an overall view of the MRPs associated with the uniform risk PGA values from Fig. 15 right. One can notice that in the Vrancea epicentral region the MRP values approach 2 475 years (as for the uniform hazard case). As the epicentral distance from Vrancea increases, the corresponding MRP values of PGA decrease under 2 000 years, in the fore-arc region, and down to several hundreds of years in the back-arc region.

16 Risk-targeted maps for seismic design. A brief review of the state-of-the-art 95
Fig. 17 – MRP corresponding to PGA 2%/50 years values
for a target annual collapse probability of 5·10-4.
7. CONCLUSIONS
The current knowledge on the probabilistic seismic hazard assessment, structural modelling and evaluation of a building’s expected seismic performance offers an in-depth understanding of the seismic risk, which should not be disregarded in the design of new buildings and in the rehabilitation of old ones. The results presented in this paper show that, even though the same mean return period for the design values of ground motion parameters is considered, the annual collapse probability of new buildings differs from region to region. The main source of this difference stems from the various gradients of the seismic hazard curves. The slope of the seismic hazard curve is given primarily by the slope of the earthquake recurrence law (seismicity) and of the ground motion prediction equations used in PSHA. Moreover, the difference is because the collapse of a structure is not strictly related to the design PGA, but also to other ground motion intensity parameters. Thus, even though the design value of the ground motion parameter might be the same for two new buildings located on different sites, the associated annual collapse probabilities can differ significantly because of the slopes of seismic hazard curves for the two sites.
Based on the brief state of the art presented and on the results compared in this paper, it is crucial for the building professionals and officials and code drafters to agree upon and establish uniform demands for the input data (i.e. MRPs of PGA values coupled with relevant limit states, corresponding quantiles of fragility curves, target annual probability of collapse) and uniform procedures for obtaining risk-targeted maps.
As for Romania, it is the opinion of the authors of this paper that the most appropriate and feasible approach is to use the PGA values with 2% exceedance probability in 50 years as the 10% quantile of the fragility function and to set the

Radu Vacareanu, Veronica Coliba 17 96
target annual probability of failure to 5·10-4 (thus providing uniform risk PGA values close to PGA values with 2%/50 years, in Vrancea epicentral area), or 2·10-4 (as for conterminous US, but providing values higher than 2%/50 years PGA in Vrancea epicentral area).
Received on April 13, 2017
REFERENCES
1. FIORINI, E., BAZZURRO, P., SILVA, V., Preliminary results of risk-targeted design maps for Italy, Second European Conference on Earthquake Engineering and Seismology, Istanbul, Turkey, August 25–29, 2014.
2. SILVA, V., CROWLEY, H., BAZZURRO, P., Risk-targeted hazard maps for Europe, Second European Conference on Earthquake Engineering and Seismology, Istanbul, Turkey, August 25–29, 2014.
3. DOUGLAS, John, ULRICH, Thomas, NEGULESCU, Caterina, Risk-targeted seismic design maps for mainland France, Natural Hazards, 65, 3, pp. 1999−2013, 2013.
4. LUCO, N., ELLINGWOOD, B., HAMBURGER, R.O., HOOPER, J.D., KIMBALL, J.K., KIRCHER, C.A., Risk-targeted versus current seismic design maps for the conterminous United States, SEAOC 2007 Convention Proceedings.
5. VACAREANU, Radu, PAVEL, Florin, CRACIUN, Ionut, COLIBA, Veronica, ARION, Cristian, ALDEA, Alexandru, NEAGU, Cristian, Risk-targeted maps for Romania, Journal of Seismology, (submitted), 2017a.
6. VACAREANU, R., PAVEL, F., COLIBA, V., CRACIUN, I., Risk-targeted seismic design maps for Romania, Proceedings of the 6th National Conference on Earthquake Engineering and 2nd National Conference on Earthquake Engineering and Seismology, CONSPRESS, Bucharest, Romania, 2017b, pp. 453–460.
7. COLIBA, V., VACAREANU, R., PAVEL, F., CRACIUN, I., Uniform risk-targeted seismic design maps for Romania, Proceedings of the 6th National Conference on Earthquake Engineering and 2nd National Conference on Earthquake Engineering and Seismology, CONSPRESS, Bucharest, Romania, 2017, pp. 249–256.
8. DOUGLAS, J., GKIMPRIXIS, A., Using targeted risk in seismic codes: A summary of the state-of-the-art and outstanding issues, Proceedings of the 6th National Conference on Earthquake Engineering and 2nd National Conference on Earthquake Engineering and Seismology, CONSPRESS, Bucharest, Romania, 2017, pp. 3–10.
9. KRAMER, S.L., Geotechnical earthquake engineering, Prentice Hall, Upper Saddle River, New Jersey, 1996.
10. PORTER, K., A beginner’s guide to fragility, vulnerability, and risk, University of Colorado Boulder, 2017.
11. SILVA, Vitor, CROWLEY, Helen, BAZZURRO, Paolo, Exploring risk-targeted hazard maps for Europe, Earthquake Spectra, 32, 2, pp. 1165–1186, 2016.
12. VANZI, Ivo, MARANO, Giuseppe-Carlo, MONTI, Giorgio, NUTI, Camillo, A synthetic formulation for the Italian seismic hazard and code implications for the seismic risk, Soil Dynamics and Earthquake Engineering, 77, pp. 111–122, 2015.
13. CEN, Eurocode 0: Basis of structural design, EN 1990: 2004, Brussels, Belgium, 2004. 14. ULRICH, Thomas, NEGULESCU, Caterina, DOUGLAS, John, Fragility curves for risk-targeted
seismic design maps, Bull Earthquake Engineering, 12, 4, pp. 1479–1491, 2014. 15. DANCIU, L., WOESSNER, J., GIARDINI, D., SHARE Consortium, A community-based
probabilistic seismic hazard maps for the Euro-Mediterranean region, Congress on Recent Advances in Earthquake Engineering and Structural Dynamics, Vienna, Austria, 2012.
18 Risk-targeted maps for seismic design. A brief review of the state-of-the-art 97
16. VACAREANU, Radu, ALDEA, Alexandru, LUNGU, Dan, PAVEL, Florin, NEAGU, Cristian, ARION, Cristian, DEMETRIU, Sorin, IANCOVICI, Mihail, Probabilistic seismic hazard assessment for Romania, in: Earthquakes and Their Impact on Society, Springer Natural Hazards Book Series, 2016, pp. 137–169.
17. PAVEL, Florin, VACAREANU, Radu, DOUGLAS, John, RADULIAN, Mircea, CIOFLAN, Carmen, BARBAT, Alex, An updated probabilistic seismic hazard assessment for Romania and comparison with the approach and outcomes of the SHARE project, Pure and Applied Geophysics, 173, 6, pp. 1881–1905, 2016.
18. CEN, EN 1998-1 Design of structures for earthquake resistance – Part 1: General rules, seismic actions and rules for buildings, European Committee for Standardization, Brussels, Belgium, 2004.
19. MDRAP, P100-1/2013 Code for seismic design − Part I− Design provisions for buildings, Ministry of Regional Development and Public Administration, Bucharest, Romania, 2013.