riverside county public transportation: annual countywide
TRANSCRIPT

Riverside County Public
Transportation:
Annual Countywide
Performance Report forFY 2015/2016
June 2017
Prepared by:


RIVERSIDE COUNTY PUBLIC TRANSPORTATION: ANNUAL COUNTYWIDE PERFORMANCE REPORT
FY 2015/2016
P A G E | I
RIVERSIDE COUNTY PUBLIC TRANSPORTATION: ANNUAL COUNTYWIDE PERFORMANCE REPORT
FY 2015/16
Table of Contents
Introduction to This Report .......................................................................................................................... 1
A Context for Public Transportation ............................................................................................................. 1
New Transit Initiatives .................................................................................................................................. 2
Perris Valley Line Commences! ................................................................................................................. 2
Federal “Rides to Wellness” Grant Secured for Blythe ............................................................................. 2
SunLine “Cap and Trade” Grant Success ................................................................................................... 3
RCTC Completes 3rd Coordinated Public Transit-Human Services Transportation Plan ........................... 3
RTA Built Environment Enhancements to Promote Downtown Mobility................................................. 4
Performance Reporting Purposes ................................................................................................................. 5
Into the Measures ......................................................................................................................................... 5
1. Policy and Compliance ....................................................................................................................... 5
2. Utilization........................................................................................................................................... 8
3. Accessibility and Coverage .............................................................................................................. 10
4. Connectivity ..................................................................................................................................... 17
5. Resources ......................................................................................................................................... 17
Summary of How We Are Doing ................................................................................................................. 19
What Do This Year’s Indicators Suggest for Riverside County Public Transit? ........................................ 19
Appendices .................................................................................................................................................. 22
Appendix A – Definitions, Data Sets, and References ......................................................................... 23
Appendix B – Public Transit Trips Provided, All Modes ...................................................................... 24
Appendix C – Bus Stop Location Counts by Operators Supporting Table 4 (Transfer Locations) ....... 25
Appendix D – Public Transit Fleet Size Over Four Fiscal Years ............................................................ 29

RIVERSIDE COUNTY PUBLIC TRANSPORTATION: ANNUAL COUNTYWIDE PERFORMANCE REPORT FY 2015/2016
P A G E | II
List of Figures and Tables
Figure 1 – Historical Farebox Expereince - Riverside County Public Transit Providers………………………………7
Figure 2 - Riverside Transit Agency – 74% Population Coverage within ¾ of a Mile………………………..….12
Figure 2 – SunLine Transit Agency – 82% Population Coverage within ¾ of a Mile…………………………………13
Figure 3 – Corona Cruiser – 73% Population Coverage within ¾ of a Mile………………………………………………14
Figure 4 – Pass Transit – 92% Population Coverage within ¾ of a Mile…………………………………………………..15
Figure 5 – Palo Verde Valley Transit – 90% Population Coverage within ¾ of a Mile……………………………...16
Figure 6 – Riverside County Transit Trips by Mode over Six Reporting Periods…………………………….…….….20
Figure 7 - Riverside County Transit Trips, Population and Trips Per Capita………………..…………………….…….20
Table 1 - Countywide Transportation Development Act (TDA), Audited Farebox Recovery FY 15/16……….6
Table 2 - Public Transit Trips per Capita……………………………………………………………………………………………………8
Table 3 – Per Capita Trip Rates Contrasted with Other Areas…………………………………………………………………..9
Table 4–Bus and Rail Transfer Location Counts for Riverside County...…...…………………………..………..………17
Table 5 – Public Transportation Resources in Riverside County: Commission Allocated State and Local
Transit Funding, Vehicles and Vehicles Revenue Miles…………………………………………………………………..18
Table 6 -Summary of County Transit Performance…………………………………………………………………………………19

RIVERSIDE COUNTY PUBLIC TRANSPORTATION: ANNUAL COUNTYWIDE PERFORMANCE REPORT FY 2015/2016
P A G E | 1
RIVERSIDE COUNTY PUBLIC TRANSPORTATION: ANNUAL COUNTYWIDE PERFORMANCE REPORT
FY 2015/2016
Introduction to This Report
This fourth iteration of the RIVERSIDE COUNTY PUBLIC TRANSPORTATION ANNUAL COUNTYWIDE PERFORMANCE
REPORT, FY 2014/2015 (COUNTYWIDE REPORT) examines the performance of public transportation services
of rail, bus, demand response and specialized transportation in Riverside County. The report is written to
comply with Public Utilities Code Section 99244 reporting requirements and to develop a meaningful
picture of public transportation services across Riverside County for policy makers and others.
The COUNTYWIDE REPORT documents capital and operating resources that support public transportation
programs within Riverside County. Its performance measures describe how we are improving or sustaining
the mobility of Riverside County travelers.
Two timeframes are considered:
reporting year of FY 2015/2016 audited transit expenditure and performance in five key
areas;
recent, program year of FY 2016/2017 transit initiatives of import and interest.
Together, reporting year performance and program year initiatives describe Riverside County’s public
transportation investment and its use.
A Context for Public Transportation
This COUNTYWIDE REPORT encompasses the historic start-up of a new rail service, securing a highly
competitive Federal grant and addressing built environment barriers to transit use. In addition, two
critical issues outside of the control of the transit operators frame this year’s report, suggesting future
challenges.
First, the funding picture for public transportation is increasingly complex. Even in advance of any
changes to the Federal level funding, after a long period of increasing revenues, state and local funding
levels are now flat or almost so. State operating funds from the California Transportation Development
Act, Local Transportation Act Funds of $76.7 million, State Transit Assistance Funds of $12 million and
local Measure A receipts of $16.3 million are flattening, comparable to prior year levels. This represents a
significant change from the steady increases to each fund since the 2008/2009 Recession. Although the
county’s population has continued to grow, at 2.2% between 2014 and 2015, receipts not growing
suggests cautious spending. Flat funding and continued population growth strain the ability of RCTC and
its transit providers to develop new services or expand the frequency or coverage of existing services.

RIVERSIDE COUNTY PUBLIC TRANSPORTATION: ANNUAL COUNTYWIDE PERFORMANCE REPORT FY 2015/2016
P A G E | 2
Secondly, there is early evidence of declining public transit ridership in Riverside County. Although still
limited in Riverside County, this emerging trend has presented across the country, and elsewhere in
California with many public transit operators seeing significant ridership dips. For Los Angeles County bus
and rail ridership declined by 8.9% for FY 16 below prior year levels, despite some increases with the
opening of new rail services. Region-wide, other operators have seen declines of 10% to 14% over the
prior year. 1 Contributing factors are multiple: these include low gasoline prices, an improving economy,
a surge in personal automobile purchases and increased access to California drivers’ licenses.
Declining ridership makes it harder for operators to meet their required minimum TDA mandated farebox
standards. It should be noted that of all metrics utilized in this report, farebox recovery is the only legally
required standard to be met.
Both trends of flat revenue and declining ridership will bear watching and will likely force adjustments in
operations and policy as RCTC and its transit providers move forward.
New Transit Initiatives
Perris Valley Line Commences!
The new Perris Valley line commenced service in June 2016, the first
extension of the Metrolink network since 1994. The 91/PVL continues
Metrolink rail service for an additional 24 miles from the downtown
Riverside station to south Perris, with four new stations at Riverside
Hunter Park, Moreno Valley/ March Field, Downtown Perris and South
Perris. At the end of the first three months of service, ridership was 17%
of the entire 91/PVL Metrolink line, moving towards a goal of 24%. There are six in-bound and six out-
bound trains on weekdays between South Perris and downtown Riverside. Half of these runs provide a
direct, one-seat ride into downtown Los Angeles. There is, as yet, no weekend Metrolink train service
from South Perris.
Federal “Rides to Wellness” Grant Secured for Blythe
RCTC, in partnership with the City of Blythe, sought and successfully won a Federal Transit
Administration Rides to Wellness Grant, an 18-month pilot project that will provide three-
times weekly service between Blythe and Coachella Valley medical facilities 110 miles to the
east. The federal grant’s goals for the new Blythe Wellness Express are ambitious:
to increase access to health care;
to improve health outcomes; and
1 SCAG Regional Transit Technical Advisory Committee, March 29, 2017; Transit Ridership Update; pp. 36-39.

RIVERSIDE COUNTY PUBLIC TRANSPORTATION: ANNUAL COUNTYWIDE PERFORMANCE REPORT FY 2015/2016
P A G E | 3
to reduce healthcare costs.
The Blythe Wellness Express project was among just 18 successful
grantees selected from over 80 applicants across the country. This pilot
service, providing trips between Blythe and the Coachella Valley, is a
partnership of RCTC, the City of Blythe, the Palo Verde Community
Hospital and other local organizations. Service initiates July 5, 2017.
SunLine “Cap and Trade” Grant Success
On April 2017, the SunLine Transit Agency was awarded $12.5 million from the California Climate
Investments, a statewide initiative funded with proceeds from the State’s Cap-and-Trade Program. The
initiative’s goal is to fund projects that reduce greenhouse gas emissions with a portion of funding
required to benefit disadvantaged communities.
SunLine received funding to purchase five zero-emission hydrogen fuel cell buses and to upgrade a
hydrogen-fueling station in the Coachella Valley. New Flyer will build the zero-emission buses while the
Hydrogenics Corporation will upgrade the hydrogen fueling station for the agency. SunLine intends to
operate these new buses on two routes serving the City of Indio and the
unincorporated area of Mecca. These routes cover areas designated as
“disadvantaged communities” thus funds will contribute to improved public
health, quality of life, and economic opportunity in this portion of Riverside
County.
RCTC Completes 3rd COORDINATED PUBLIC TRANSIT-
HUMAN SERVICES TRANSPORTATION PLAN
During 2016 RCTC undertook a full update of the RIVERSIDE COUNTY COORDINATED PUBLIC
TRANSIT-HUMAN SERVICES TRANSPORTATION PLAN. After an almost year-long public involvement
process and outreach to stakeholders across the County, collaborating with each of the
County’s public transit providers, this 2016 COORDINATED PLAN UPDATE provide a current
road map for addressing mobility needs of more vulnerable groups – older adults, persons
with disabilities, persons of limited income, of limited English proficiency and military veterans.
The 2016 PLAN documented a transit and transportation network that has expanded since the 2012
UPDATE. Nonetheless, ten categories of network gaps and areas of
unmet need were identified. These were addressed through five
mobility goals and twenty-three accompanying strategies to improve
mobility to the Plan’s target groups:
Grow Mobility Options
Connect and Coordinate Services
Promote Safety and Comfort

RIVERSIDE COUNTY PUBLIC TRANSPORTATION: ANNUAL COUNTYWIDE PERFORMANCE REPORT FY 2015/2016
P A G E | 4
Improve Health Access
Promote and Improve Communication
This 2016 COORDINATED PLAN will be used to seek funding for: discretionary projects from the FTA Section
5310 program; from other state and federal funding sources as they become available; and to aid the
county’s transit providers in identifying strategies that improve mobility of the Plan’s target groups.
RTA Built Environment Enhancements to Promote
Downtown Mobility
The Downtown Riverside Stop Improvement
Project was designed to address the long-term
growth in transit service that RTA expects in the
upcoming years. The project supports physical
changes in the downtown area at key
destinations, supporting on-street boarding and
transfers throughout downtown, in anticipation
of a bus layover location on Vine Street near the
Riverside-Downtown Metrolink Station. In 2015,
RTA initiated the planning and public input
project phases. Construction of bus stops and
associated improvements was underway
between November and March.
RTA upgraded a total of 26 bus stops with
improvements that include the installation of
shelters, benches, trash receptacles, solar
lighting, and improved bus route and schedule
information.
On January 8, 2017, RTA discontinued service to
the Riverside Downtown Terminal and
implemented its downtown operating plan. A
total of ten local and five commuter RTA bus
routes, Omnitrans Route 215, and SunLine
Commuter Link 220 travel through the downtown area, enabling convenient access to key destinations in
the downtown area through the completion of the bus stop improvement project and new operating plan.

RIVERSIDE COUNTY PUBLIC TRANSPORTATION: ANNUAL COUNTYWIDE PERFORMANCE REPORT FY 2015/2016
P A G E | 5
Performance Reporting Purposes
This fourth RIVERSIDE COUNTY PUBLIC TRANSPORTATION ANNUAL PERFORMANCE REPORT, FY 2015/2016, describes
the County’s transit provider experience in relation to key performance areas. In addition to compliance
with governing law, the COUNTYWIDE REPORT will:
Present a countywide view of transit performance.
Provide a snapshot in time, a benchmark group of measures by which to monitor change.
Use outcome-based performance methodologies to comply with PL 114-94 Fixing America’s
Surface Transportation Act (FAST Act) and the California Transportation Development Act.
Provide an expandable performance measurement framework.
Into the Measures
Riverside County public transportation is funded with a mix of federal, state and local dollars. RCTC has
responsibility for the programming of federal funding that public transit operators receive and for
providing oversight on regulatory compliance. RCTC does not touch these funds as they are forwarded
directly to the operators. RCTC is directly responsible for managing the state Transportation Development
Act (TDA) funds and Local Measure A receipts. However, the public transit operators in receipt of federal
transit funding, including Federal Transit Administration (FTA) Section 5307 and 5311, directly manage
their Federal funds, with the exception that RCTC has administrative and operational responsibility for rail
funding allocated to Riverside County by the U.S. Dept. of Transportation.
This COUNTYWIDE REPORT continues its focus only on the state and local funds received by Riverside County
to consider performance indicators in relation to those funds. The measures selected provide a
comprehensive picture of performance. Individual provider experience is reported for the measures of:
fare box recovery, trips by mode and transit coverage. Two vehicle-related indicators, along with
resource indicators of transfer locations, funding, vehicles and vehicle revenue miles, are presented for
the three geographic regions of the county - Western Riverside, the Coachella Valley and the Palo Verde
Valley. The trips per capita indicator is considered by provider, by region and for the entire county.
Appendix A presents the definitions used in this COUNTYWIDE REPORT’S performance measurement.
1. Policy and Compliance
This is the only COUNTYWIDE REPORT measure for which there is a regulatory requirement. This measure of
the Farebox Recovery Ratio has its basis in existing California law under the Transportation Development
Act (TDA). California transit operators much achieve established minimum contributions to operating
costs from their riders’ fares, called farebox. Section 6633.2 of the TDA statutorily requires minimum
contributions from passenger fares to ensure basic efficiencies and protect continued funding of public
transit programs receiving Local Transportation Funds (LTF). Expressed as the farebox recovery ratio,

RIVERSIDE COUNTY PUBLIC TRANSPORTATION: ANNUAL COUNTYWIDE PERFORMANCE REPORT FY 2015/2016
P A G E | 6
standards vary for rural and urban providers to reflect the proportion of total operating costs that must
be covered from passenger fares.
Table 1 presents the farebox recovery ratios for each Riverside County transit provider who receives TDA
Local Transportation Funds for the reporting year 2015/2016. Farebox standards for these state-
mandated minimums are 20% for urban transit providers and 10% for rural or demand response-only
providers. However, Riverside County has established “blended” minimum standards, approved by
Caltrans, that reflect the combined urban and rural proportions of each operators’ respective service area.
These below-20% required minimums reflect the mix of urban and rural areas each operator serves.
Agency farebox recovery ratios:
Reflect the interaction of factors that include ridership, agency policy and operating costs;
Are heavily influenced by ridership as more riders will generate increased fare revenue while
declining ridership will bring down the fare contribution to operating costs;
Reflect critical agency policy as transit fares are a key policy area determined by the transit
provider;
Are influenced by attention to operating costs as systems operating efficiently will have lower
expenses with fares representing comparatively higher proportions of total costs, higher
farebox ratios.
TABLE 1, COUNTYWIDE TRANSPORTATION DEVELOPMENT ACT (TDA) AUDITED FAREBOX RECOVERY, FY 15/16
Each of the reporting public operators met their fare box standards, although for the City of Beaumont
we do not have a current audit. The remaining operators each exceeded their minimum standards, which
are 10% for Banning, PVVTA and the City of Riverside and 20% for the City of Corona. The two largest
operators, RTA and SunLine, have blended fare box standards just over 17% and each met this with healthy
24.3% and 22.6% fare box recovery ratios respectively.
COUNTYWIDE BANNING BEAUMONT CORONA PVVTA RIVERSIDE RTA SUNLINE COUNTYWIDE
2015 2016 2016 [3] 2016 2016 2016 2016 2016 2016
Total Operating Revenue
from Passenger Fares [1] $22,847,887 224,463$ 454,895$ 123,021$ 376,960$ 14,263,722$ 7,134,367$ 22,577,428$
Total Operating
Expenses, Net Farebox [2] $96,144,717 1,663,164$ 2,242,025$ 1,017,367$ 3,323,668$ 58,672,060$ 31,617,861$ 98,536,145$
Standard — Minimum
Farebox Recovery
Requirement, Per TDA
and RCTC Adopted Policy
No Standard 10% 20% 10% 10% 17.44% 17.80% No Standard
Actual — Farebox
Recovery Ratio/Operator23.8% 13.5% 20.3% 12.1% 11.3% 24.3% 22.6% 22.9%
Meeting Requirement Meets Meets Meets Meets Meets Meets
[1] Per RCTC Policy: Operators may supplement fare revenues with local funds and support such as Measure A.
[2] Net farebox is based upon agency policy, in conformance with TDA rules and RCTC adopted policy.
Source: Annual Financial Statements with Independent Auditor's Report For the Year Ending June 30, 2016 — All Operators' Final Transit Services Fund , except for Beaumont.
Audit Results
All Operators
No
da
ta p
rov
ide
d
[3] The City of Beaumont has not completed its required annual audit which has resulted in the suspension of payments to the City. The audit also provides the data
necessary to calcluate farebox recover in this table.

RIVERSIDE COUNTY PUBLIC TRANSPORTATION: ANNUAL COUNTYWIDE PERFORMANCE REPORT FY 2015/2016
P A G E | 7
How Are We Doing?
To meet farebox recovery standards, the transit providers in Riverside County work continuously to
manage policies related to fare, operations and operating costs. Missing data from one provider, in Table
1 above, does not significantly alter the likely declining ridership trend evidenced in declining farebox with
a countywide actual of 22.9% versus the prior period’s 23.8% farebox recovery.
To understand the historical picture, Figure 1 following depicts the farebox recovery ratios over four
reporting cycles, for each of the County’s public operators. The operator-specific, farebox standard is
identified by the red bar in Figure 1. This begins to describe the picture of declining ridership that is
reflected in declining farebox receipts. While each of the audited providers met their minimum farebox
standards, the future is of concern, as farebox directly reflects ridership levels. Farebox decline was
evidenced this year by two providers - PVVTA and RTA.
Meeting standards will become increasingly difficult so long as the current trend of declining transit
ridership continues. SunLine, benefitting from RCTC’s blended farebox policy, was able to increase farebox
by adding some new local and eligible funding sources to the farebox pot, even in the face of some
ridership decline. Operators are working aggressively to introduce a mix of strategies to attract new
ridership, including RTA’s focus on its downtown services and SunLine’s new marketing campaign and
website targeted to younger riders.
FIGURE 1, HISTORICAL FARE BOX EXPERIENCE – RIVERSIDE COUNTY PUBLIC TRANSIT PROVIDERS

RIVERSIDE COUNTY PUBLIC TRANSPORTATION: ANNUAL COUNTYWIDE PERFORMANCE REPORT FY 2015/2016
P A G E | 8
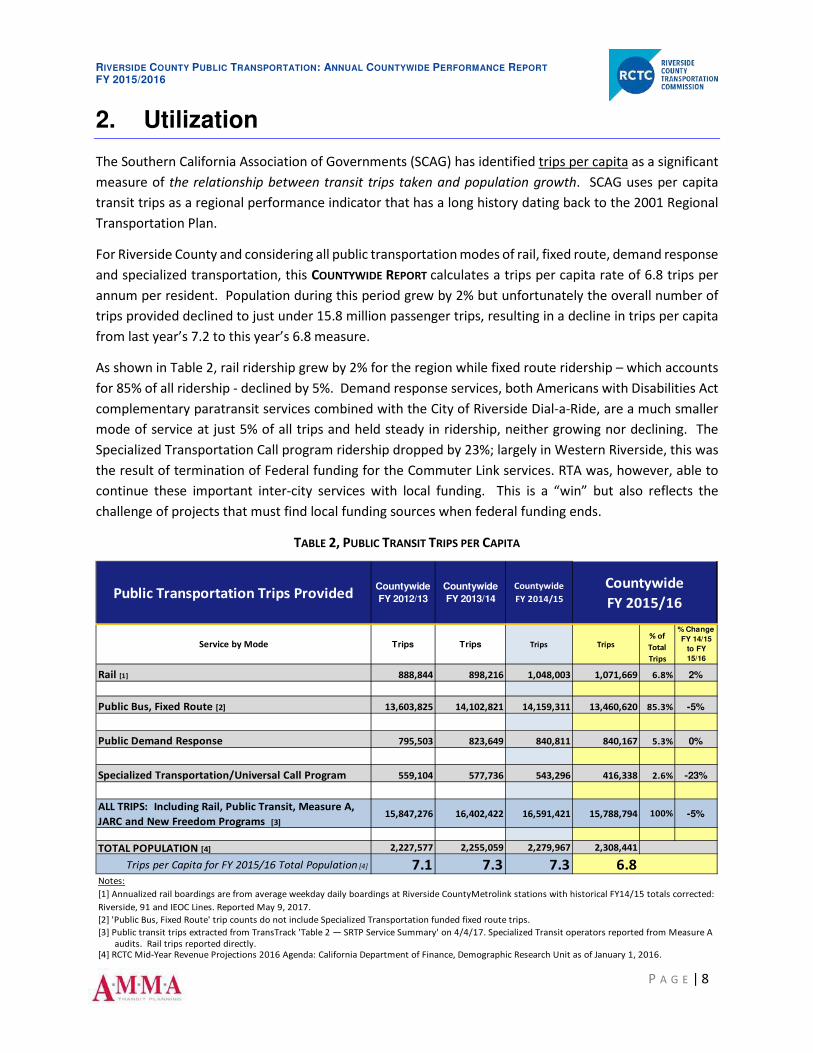
2. Utilization
The Southern California Association of Governments (SCAG) has identified trips per capita as a significant
measure of the relationship between transit trips taken and population growth. SCAG uses per capita
transit trips as a regional performance indicator that has a long history dating back to the 2001 Regional
Transportation Plan.
For Riverside County and considering all public transportation modes of rail, fixed route, demand response
and specialized transportation, this COUNTYWIDE REPORT calculates a trips per capita rate of 6.8 trips per
annum per resident. Population during this period grew by 2% but unfortunately the overall number of
trips provided declined to just under 15.8 million passenger trips, resulting in a decline in trips per capita
from last year’s 7.2 to this year’s 6.8 measure.
As shown in Table 2, rail ridership grew by 2% for the region while fixed route ridership – which accounts
for 85% of all ridership - declined by 5%. Demand response services, both Americans with Disabilities Act
complementary paratransit services combined with the City of Riverside Dial-a-Ride, are a much smaller
mode of service at just 5% of all trips and held steady in ridership, neither growing nor declining. The
Specialized Transportation Call program ridership dropped by 23%; largely in Western Riverside, this was
the result of termination of Federal funding for the Commuter Link services. RTA was, however, able to
continue these important inter-city services with local funding. This is a “win” but also reflects the
challenge of projects that must find local funding sources when federal funding ends.
TABLE 2, PUBLIC TRANSIT TRIPS PER CAPITA
Service by Mode Trips Trips Trips Trips % of
Total
Trips
% Change
FY 14/15
to FY
15/16
Rail [1] 888,844 898,216 1,048,003 1,071,669 6.8% 2%
Public Bus, Fixed Route [2] 13,603,825 14,102,821 14,159,311 13,460,620 85.3% -5%
Public Demand Response 795,503 823,649 840,811 840,167 5.3% 0%
Specialized Transportation/Universal Call Program 559,104 577,736 543,296 416,338 2.6% -23%
ALL TRIPS: Including Rail, Public Transit, Measure A,
JARC and New Freedom Programs [3]15,847,276 16,402,422 16,591,421 15,788,794 100% -5%
TOTAL POPULATION [4] 2,227,577 2,255,059 2,279,967 2,308,441
Trips per Capita for FY 2015/16 Total Population [4] 7.1 7.3 7.3 6.8Notes:
[2] 'Public Bus, Fixed Route' trip counts do not include Specialized Transportation funded fixed route trips.
audits. Rail trips reported directly. [4] RCTC Mid-Year Revenue Projections 2016 Agenda: California Department of Finance, Demographic Research Unit as of January 1, 2016.
Countywide
FY 2015/16
[3] Public transit trips extracted from TransTrack 'Table 2 — SRTP Service Summary' on 4/4/17. Specialized Transit operators reported from Measure A
[1] Annualized rail boardings are from average weekday daily boardings at Riverside CountyMetrolink stations with historical FY14/15 totals corrected:
Riverside, 91 and IEOC Lines. Reported May 9, 2017.
Public Transportation Trips Provided Countywide
FY 2014/15
Countywide
FY 2013/14
Countywide
FY 2012/13

RIVERSIDE COUNTY PUBLIC TRANSPORTATION: ANNUAL COUNTYWIDE PERFORMANCE REPORT FY 2015/2016
P A G E | 9
Appendix B details ridership by mode and by service, reflecting the changes in ridership over time
between modes and among services.
How Are We Doing?
The trips per capita measure provides insight into levels of public transportation consumption in relation
to a transit agency’s service area population. That said, Riverside County’s public transit operators provide
services through a mix of urban, low-density suburban, and rural areas located in this inland desert region
of Southern California. Environmental factors, population densities, and the provision of service all
influence how many public transit trips are taken – and can be provided – in this vast county. This measure
cannot be used to compare the productivity of Riverside County to other transit systems but simply to
contrast this county’s experience with other providers whose operating characteristics, population,
service area size or population density are comparable.
Table 3 following presents the trips per capita measure for the three Riverside County transit operators
that report to the National Transit Database (NTD). The unlinked passenger trips for the Riverside County
transit agencies are as reported in their FY 14/15 audits while peer agency data was directly obtained
from the 2015 NTD reporting year. The Table 3 unlinked passenger trips for all transit agencies reflect only
trips taken on fixed-route bus service (i.e. motor bus, commuter bus, rapid bus) and do not include trips
on rail and other modes these providers operate.
TABLE 3 – PER CAPITA TRIP RATES CONTRASTED WITH OTHER AREAS
When combined, the Riverside County transit operators who report to the NTD provided 6.0 trips per
capita (top line of Table 3) over a combined service area of almost 4,500 square miles. This combined
2015 National Transit DatabasePopulation
per Square
Mile
Motor Bus Statistics Only (In persons)
Riverside Countywide Annual Performance Report \* 2,279,967 13,699,416 6.0 4,499 507
SunLine Transit Agency (from Countywide Report) 423,644 4,322,671 10.2 1,120 378
Riverside Transit Agency (from Countywide Report) 1,700,356 8,812,145 5.2 2,725 624
Corona Cruiser (from Countywide Report) 160,000 152,728 1.0 41 3,902
NTD Motor Bus Statistics Only
King County Department of Transportation, Washington 2,117,125 102,302,980 48.3 2,134 992
Los Angeles County MTA dba Metro 8,626,817 342,979,105 39.8 1,513 5,702
Long Beach Transit 796,609 28,060,212 35.2 98 8,129
Denver Regional Transportation Department, Colorado 2,876,000 76,657,870 26.7 2,340 1,229
Montebello Bus Lines 315,074 7,588,606 24.1 151 2,087
San Diego MTS 2,462,707 54,243,654 22.0 720 3,420
San Mateo County Transit District 737,100 13,467,166 18.3 97 7,599
Santa Clara Valley Transportation Authority 1,880,876 33,040,872 17.6 346 5,436
Orange County Transit Authority 3,070,485 47,021,445 15.3 465 6,603
Central Florida Transportation Authority (LYNX), Florida 2,005,728 28,497,550 14.2 2,540 790
Sacramento Regional Transit 1,035,779 13,697,260 13.2 231 4,484
Antelope Valley Transit Authority 349,050 3,430,656 9.8 1,200 291
Omnitrans (San Bernardino County) 1,455,086 13,922,152 9.6 463 3,143
North County Transit District, San Diego 849,420 8,030,008 9.5 403 2,108
Victor Valley Transit Authority (San Bernardino County) 334,988 2,013,986 6.0 424 790
Valley Metro, Phoenix, Arizona 3,629,114 17,168,400 4.7 732 4,958
Source: National Transit Database (http://www.ntdprogram.gov/ntdprogram/profiles.htm) NTD Transit Profiles/Transit Agency Search/2015
\* Source: As documented in this report and inclusive of some NTD-reported data, but including additional data sources.
Service Area
Population
Unlinked
Passenger Trips
Trips per
Capita
Service Area
Square
Mileage

RIVERSIDE COUNTY PUBLIC TRANSPORTATION: ANNUAL COUNTYWIDE PERFORMANCE REPORT FY 2015/2016
P A G E | 10
service area is primarily low density, calculated at 507 persons per square mile, akin to somewhat less
than the Victor Valley Transit Authority but more than the Antelope Valley Transit Authority service areas.
Riverside County’s 6.0 indicator of motor bus only trips is indicative of transit service operating in relatively
large service areas of low density population. This grows to 6.3 trips per capita when including rail,
demand response and specialized transportation unlinked passenger trips. Operators with trips per capita
in the range of 10 trips per annum and below serve the areas of Lancaster/Palmdale, San Bernardino
Valley, North San Diego County, the Victor Valley and the Phoenix region-wide Valley Metro, all similar in
their relatively low population density.
3. Accessibility and Coverage
Given the large areas that Riverside County public transportation operators must service, a measure of
transit coverage is important. The measure of population coverage as presented is defined in this
COUNTYWIDE REPORT as the percentage of residents living within ¾ of a mile of public fixed-route transit
service. This population coverage measure excludes dial-a-ride services of which there are several general
public demand response programs operating, particularly low-density areas of western Riverside County.
This ¾ mile metric is greater than the typical ¼ mile walkable distance that is commonly used by transit
planners to measure service accessibility. It suggests transit’s sphere of influence as the ¾ mile envelope
is consistent with the Americans with Disabilities Act (ADA) requirement for the provision of
complementary paratransit to eligible persons with disabilities.
The indicator enumerates total population living within ¾ mile of local fixed route service or with ¾ mile
of a commuter express service bus stop, to establish the proportion of total service area population per
the 2010 Census 2 within that envelope. This accessibility measure presents a “30,000 foot-level”
assessment of public transit’s fixed route coverage in each service area. It says nothing about the
frequency of service available or the days and hours of coverage. Five maps follow depicting each transit
provider’s service area, current route structures, the population served within ¾ of a mile of the route
footprint and the proportion of the service area’s total population. This analysis was limited to persons
living within Riverside County, related to routes serving at or across Riverside County lines.
How Are We Doing?
Operators instituted various service structure changes, some extending their service envelope and
increasing their population coverage levels while others added service within their existing footprint and
therefore did not impact this measure.
2 The 2010 Census population data must be used for this analysis in order to obtain the block level data necessary
to identify the percent of the population with ¾ mile access to fixed route public transit. One consequence of this
is that the measure is not as sensitive to population changes as, for example, the trips per capita measure which
utilizes annual countywide population figures from the California Dept. of Finance. It does, however, reflect service
area changes made by the operators over time, as population is held constant.

RIVERSIDE COUNTY PUBLIC TRANSPORTATION: ANNUAL COUNTYWIDE PERFORMANCE REPORT FY 2015/2016
P A G E | 11
Riverside Transit Agency, Figure 2, reports a 74% population coverage level for Western Riverside County’s
population of 1.7 million. This is unchanging, consistent with prior years’ level of coverage. Changes
within the RTA network did not impact the overall service footprint and included:
the merging of Route 7 with Route 8 in Lake Elsinore
combining Routes 31 and 35 for a new Route 31 for more direct weekday service between
Hemet, San Jacinto and Moreno Valley without need for a transfer.
New Route 26 connects the Orangecrest community of Moreno Valley with Metrolink and the
Moreno Valley Mall
New Route 52 establishes the new Hunter Park Metrolink to UCR shuttle
New Route 54 connects Riverside Downtown with the Metrolink station and downtown
Riverside destinations.
The SunLine Transit Agency, Figure 3, reports an 82% population coverage level, which is an 8% increase
over the 76% population coverall level reported in the first, 2012/2013 COUNTYWIDE REPORT. Current year
changes within the network included:
new Line 20 connecting Desert Hot Springs and Palm Desert
extended service on Lines 80 and 81 to Shadow Hills in Indio
extended service on Line 24 in Palm Springs to the Walmart at Ramon Road and San Luis Rey
where it connects with Line 32
extended service on Line 90 to west Harrison Street, extending Avenue 52 service in
Coachella.
extended Lines 91 and 95 to improve service to College of the Desert Mecca/Thermal campus.
Corona Transit, Figure 4, with no changes to its route structure, reports a continued 73% population
coverage level.
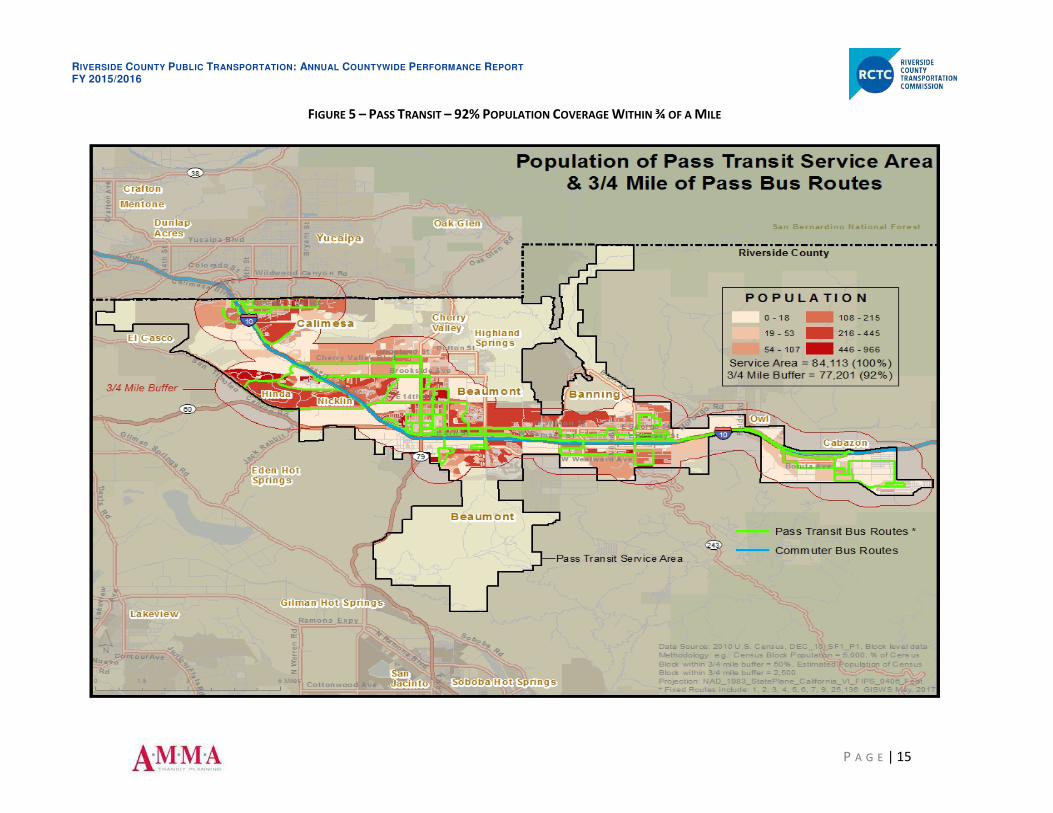
Pass Transit, Figure 5, increased from last year’s 84% to this year’s rate of 92% population coverage level,
almost a 10% increase. The City of Beaumont implemented the new Route 136 with weekday service to
Calimesa, further extending Pass Transit service. Although Banning made no service changes in this year,
it is anticipating some during FY 16/17.
Palo Verde Valley Transit, Figure 6, made no changes to their route structure during this reporting year,
reflecting a continued 90% population coverage level although initiation of its new Blythe Wellness
Express will greatly extend the reach of its public transportation program for Blythe residents.

RIVERSIDE COUNTY PUBLIC TRANSPORTATION: ANNUAL COUNTYWIDE PERFORMANCE REPORT FY 2015/2016
P A G E | 12
FIGURE 2 – RIVERSIDE TRANSIT AGENCY – 74% POPULATION COVERAGE WITHIN ¾ OF A MILE

RIVERSIDE COUNTY PUBLIC TRANSPORTATION: ANNUAL COUNTYWIDE PERFORMANCE REPORT FY 2015/2016
P A G E | 13
FIGURE 3 – SUNLINE TRANSIT AGENCY – 82% POPULATION COVERAGE WITHIN ¾ OF A MILE

RIVERSIDE COUNTY PUBLIC TRANSPORTATION: ANNUAL COUNTYWIDE PERFORMANCE REPORT FY 2015/2016
P A G E | 14
FIGURE 4 – CORONA CRUISER – 73% POPULATION COVERAGE WITHIN ¾ OF A MILE
RIVERSIDE COUNTY PUBLIC TRANSPORTATION: ANNUAL COUNTYWIDE PERFORMANCE REPORT FY 2015/2016
P A G E | 15
FIGURE 5 – PASS TRANSIT – 92% POPULATION COVERAGE WITHIN ¾ OF A MILE

RIVERSIDE COUNTY PUBLIC TRANSPORTATION: ANNUAL COUNTYWIDE PERFORMANCE REPORT FY 2015/2016
P A G E | 16
FIGURE 6 – PALO VERDE VALLEY TRANSIT – 90% POPULATION COVERAGE WITHIN ¾ OF A MILE

RIVERSIDE COUNTY PUBLIC TRANSPORTATION: ANNUAL COUNTYWIDE PERFORMANCE REPORT FY 2015/2016
P A G E | 17
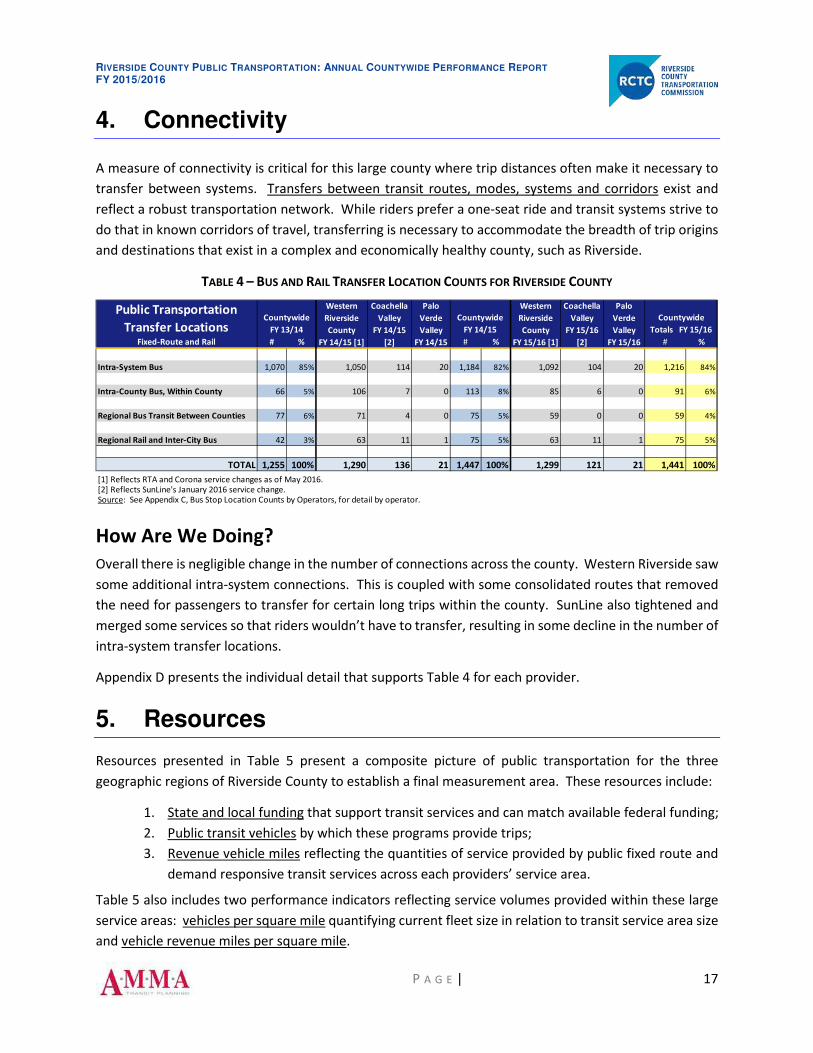
4. Connectivity
A measure of connectivity is critical for this large county where trip distances often make it necessary to
transfer between systems. Transfers between transit routes, modes, systems and corridors exist and
reflect a robust transportation network. While riders prefer a one-seat ride and transit systems strive to
do that in known corridors of travel, transferring is necessary to accommodate the breadth of trip origins
and destinations that exist in a complex and economically healthy county, such as Riverside.
TABLE 4 – BUS AND RAIL TRANSFER LOCATION COUNTS FOR RIVERSIDE COUNTY
How Are We Doing?
Overall there is negligible change in the number of connections across the county. Western Riverside saw
some additional intra-system connections. This is coupled with some consolidated routes that removed
the need for passengers to transfer for certain long trips within the county. SunLine also tightened and
merged some services so that riders wouldn’t have to transfer, resulting in some decline in the number of
intra-system transfer locations.
Appendix D presents the individual detail that supports Table 4 for each provider.
5. Resources
Resources presented in Table 5 present a composite picture of public transportation for the three
geographic regions of Riverside County to establish a final measurement area. These resources include:
1. State and local funding that support transit services and can match available federal funding;
2. Public transit vehicles by which these programs provide trips;
3. Revenue vehicle miles reflecting the quantities of service provided by public fixed route and
demand responsive transit services across each providers’ service area.
Table 5 also includes two performance indicators reflecting service volumes provided within these large
service areas: vehicles per square mile quantifying current fleet size in relation to transit service area size
and vehicle revenue miles per square mile.
Public Transportation
Transfer LocationsFixed-Route and Rail # % # % # %
Intra-System Bus 1,070 85% 1,050 114 20 1,184 82% 1,092 104 20 1,216 84%
Intra-County Bus, Within County 66 5% 106 7 0 113 8% 85 6 0 91 6%
Regional Bus Transit Between Counties 77 6% 71 4 0 75 5% 59 0 0 59 4%
Regional Rail and Inter-City Bus 42 3% 63 11 1 75 5% 63 11 1 75 5%
TOTAL 1,255 100% 1,290 136 21 1,447 100% 1,299 121 21 1,441 100%
[1] Reflects RTA and Corona service changes as of May 2016.[2] Reflects SunLine's January 2016 service change.Source: See Appendix C, Bus Stop Location Counts by Operators, for detail by operator.
Countywide
FY 13/14
Western
Riverside
County
FY 15/16 [1]
Coachella
Valley
FY 15/16
[2]
Palo
Verde
Valley
FY 15/16
Countywide
Totals FY 15/16
Western
Riverside
County
FY 14/15 [1]
Coachella
Valley
FY 14/15
[2]
Palo
Verde
Valley
FY 14/15
Countywide
FY 14/15

RIVERSIDE COUNTY PUBLIC TRANSPORTATION: ANNUAL COUNTYWIDE PERFORMANCE REPORT FY 2015/2016
P A G E | 18
TABLE 5 – PUBLIC TRANSPORTATION RESOURCES IN RIVERSIDE COUNTY:
COMMISSION ALLOCATED STATE AND LOCAL TRANSIT FUNDING, VEHICLES AND VEHICLES REVENUE MILES
How Are We Doing?
State and local funding is up only 4%, now $72.6 million in FY 15/16, slowing the rates of increase that
have been much more robust in previous years when the region began rebounding from the 2008/2009
Recession. This trend will limit the region’s ability to expand its public transportation, bus and rail,
network.
Fleet size remains essentially constant, at 495 transit vehicles countywide. Some older RTA vehicles were
retired during this period and not replaced, now with RTA’s substantially new-vehicle fleet that was
acquired during the previous two fiscal years. SunLine added a few vehicles to both its fixed route and
demand response fleets. The Western Riverside 0.16 vehicles per square mile for its 2,300-square mile
service area is somewhat higher than the comparable 0.11 for the Coachella Valley’s 1,100- square mile
service area, reflecting the larger fleet in Western Riverside although also covering a larger service area.
Palo Verde Valley Transit’s eight-vehicle fleet, in relation to its 1,042-square mile service area, doesn’t yet
register on this indicator with a service area that encompasses distances traveled to outlying communities
by the PVVTA Rural Rider.
Vehicle revenue miles increased by 7%, an encouraging trend and very much to the credit of the transit
providers who were able to stretch existing resources farther. This directly increases services – increased
frequencies and slightly expanded routes – and is reflected as well in a 7% improvement in the vehicle
revenue miles per square mile indicator.
Western
Riverside
County
Coachella
Valley
Palo Verde
Valley
$61,835,874 $69,988,653 50,266,640$ 21,521,932$ 852,425$ $ 72,640,997 4%
Programmed LTF and Measure A Transit, FY 2015/16,
exclusive of state and local rail funding
484 494 374 113 8 495 0%
RTA, City of Riverside, Corona, Banning, Beaumont, SunLine,
Palo Verde Valley
16,856,113 17,830,287 14,557,378 4,362,449 166,423 19,086,249 7%
RTA, City of Riverside, Corona, Banning, Beaumont, SunLine,
Palo Verde Valley
4,499 4,499 2,337 1,120 1,042 4,499 0%
0.11 0.11 0.16 0.10 0.01 0.11 0%
3,747 3,963 6,229 3,895 160 4,242 7%
FY 15-16
Countywide
Totals
%
Change
from FY
14/15
Transit Vehicles (fixed route and paratransit; no taxis) [1]
Vehicle Revenue Miles (fixed route and paratransit) [2]
Transit Service Area Square Mileage (Total County=7,206) [
FY 13-14
Countywide
Totals
Public Transportation Resources,
Three Time Periods
FY 14-15
Countywide
Totals
State and Local Transit Funding,
Excluding all Federal Funds
Measure - Vehicles per Square Mile
Measure - Vehicle Revenue Miles Per Square Mile
[3] Square mileage: for total county from U.S. Census Quick Facts; SRTP for SunLine; GIS analysis for RTA presented in Figure 1; for PVVTA presented in Figure 3.
[1] Transit Vehicles: reported directly by operators on April 6, 2017, to RCTC staff.
[2] Revenue Miles: extracted from TransTrack 'Table 2 — SRTP Service Summary' on April 20, 2017.

RIVERSIDE COUNTY PUBLIC TRANSPORTATION: ANNUAL COUNTYWIDE PERFORMANCE REPORT FY 2015/2016
P A G E | 19
Summary of How We Are Doing
In summation, this ANNUAL COUNTYWIDE REPORT presents an encouraging picture of the transportation
network serving Riverside County residents related to farebox compliance, service area coverage and
increased revenue miles of service provided. The picture is also a sobering one related to flattening
income and trends of declining ridership.
Table 6 summarizes this year’s key markers to contrast with prior reporting year experience.
TABLE 6 – SUMMARY OF COUNTYWIDE TRANSIT PERFORMANCE
What Do This Year’s Indicators Suggest for Riverside County Public
Transit?
Concerns about Farebox and Ridership Compliance with farebox recovery standards was met
and exceeded by each of the reporting providers during this period, but it is notable that for two years in
a row there has been a slight decline in the countywide farebox recovery, now 22.9% overall. If there is
continued decline in ridership, as has been seen through this year across the country and elsewhere in
Southern California, this can begin to have farebox compliance implications.
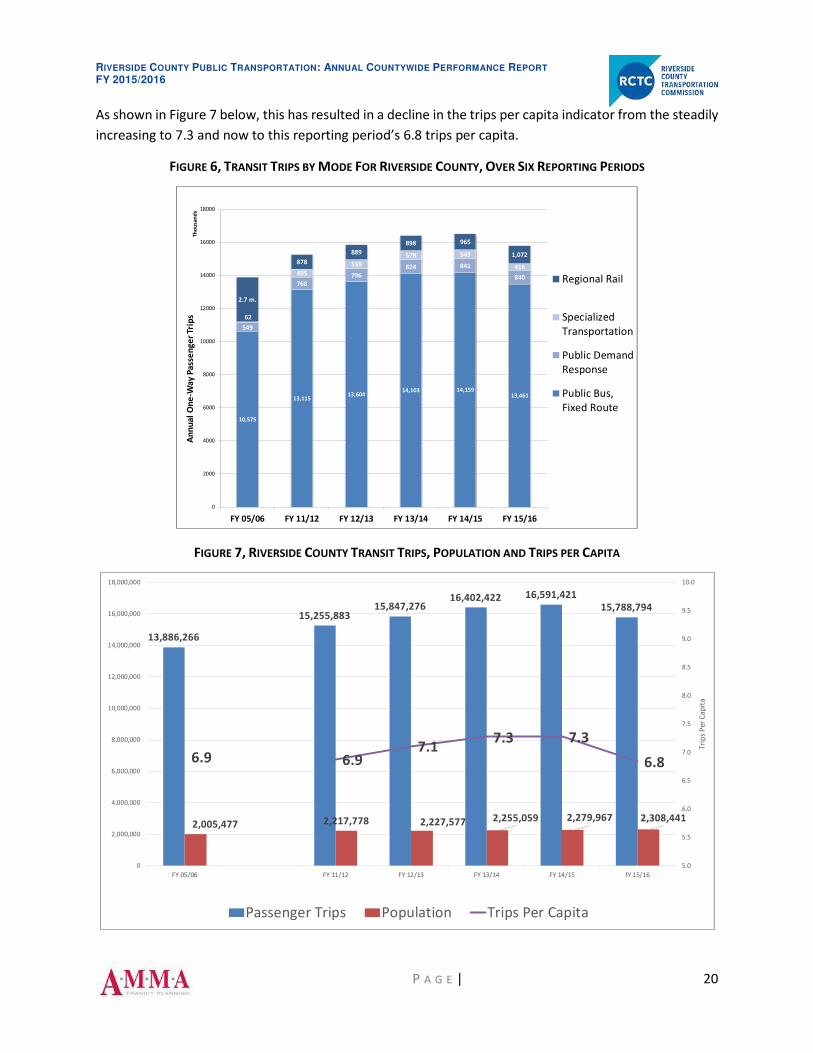
Figure 6 following reflects the current ridership picture and shows the beginning pattern of ridership
decline in transit use, after years of steady ridership growth. While rail and demand response transit have
grown slightly or stayed steady, countywide we have seen a 5% decline in transit unlinked passenger trips.
FY 2012/13 FY 2013/14 FY 2014/15 FY 2015/16% Chng from
FY 14/15
Farebox Recovery Ratio 25.5% 23.3% 23.8% 22.9%
Total Transit Trips, including Metrolink 15,847,276 16,402,422 16,591,421 15,788,794 -5%
Bus only trips 14,958,432 15,504,206 15,543,418 14,717,125 -5%
Metrolink only trips 888,844 898,216 1,048,003 1,071,669 2%
Transit Trips Per Capita 7.1 7.3 7.3 6.8
Transit Accessibility and Coverage not available 76% 76% 77% 1%
Countywide Average 3/4 Mile Population Access to Fixed Route
Bus Stop Transfer Connections 1,315 1,255 1,447 1,441 0%
Intra-System 88% 85% 82% 84% 3%
Intra-County Bus, Within County 3% 5% 8% 6% -19%
Regional Bus Transit Between Counties 6% 6% 5% 4% -16%
Regional Rail and National Inter-City Bus 3% 3% 5% 5% 55%
FY 14/15 Transportation Resources
State and Local Operating Funds $53,903,436 $61,835,874 $69,988,653 $72,640,997 0%
Public Transit Vehicles (Fixed Route and Paratransit) 447 484 494 495 0%
Vehicle Revenue Miles (Fixed Route and Paratransit) 16,132,145 16,856,113 17,830,287 19,086,249 7%
Square Miles of Transit Service Area 4,887 4,499 4,499 4,499 no change
Vehicles Per Square Mile 0.09 0.11 0.11 0.11 0%
Vehicle Revenue Miles Per Square Mile 3,301 3,747 3,963 4,242 7%
-6%
Riverside County Public Transportation
Summary of Countywide Performance
-4%
RIVERSIDE COUNTY PUBLIC TRANSPORTATION: ANNUAL COUNTYWIDE PERFORMANCE REPORT FY 2015/2016
P A G E | 20
As shown in Figure 7 below, this has resulted in a decline in the trips per capita indicator from the steadily
increasing to 7.3 and now to this reporting period’s 6.8 trips per capita.
FIGURE 6, TRANSIT TRIPS BY MODE FOR RIVERSIDE COUNTY, OVER SIX REPORTING PERIODS
FIGURE 7, RIVERSIDE COUNTY TRANSIT TRIPS, POPULATION AND TRIPS PER CAPITA
10,575
13,11513,604
14,103 14,15913,461
549
768
796
824 841
840
62
495
559
578 543
416
2.7 m.
878
889
898 965
1,072
0
2000
4000
6000
8000
10000
12000
14000
16000
18000
FY 05/06 FY 11/12 FY 12/13 FY 13/14 FY 14/15 FY 15/16
An
nu
al
On
e-W
ay
Pa
sse
ng
er
Trip
sT
ho
usa
nd
s
Regional Rail
Specialized
Transportation
Public Demand
Response
Public Bus,
Fixed Route
13,886,266
15,255,88315,847,276
16,402,422 16,591,421
15,788,794
2,005,477 2,217,778 2,227,577 2,255,059 2,279,967 2,308,441
6.9 6.97.1
7.3 7.3
6.8
5.0
5.5
6.0
6.5
7.0
7.5
8.0
8.5
9.0
9.5
10.0
0
2,000,000
4,000,000
6,000,000
8,000,000
10,000,000
12,000,000
14,000,000
16,000,000
18,000,000
FY 05/06 FY 11/12 FY 12/13 FY 13/14 FY 14/15 fY 15/16
Tri
ps
Pe
r C
ap
ita
Passenger Trips Population Trips Per Capita

RIVERSIDE COUNTY PUBLIC TRANSPORTATION: ANNUAL COUNTYWIDE PERFORMANCE REPORT FY 2015/2016
P A G E | 21
Continued Responsiveness to Customer Needs
Despite flattening revenue growth, the County’s public transit providers put into place numerous
initiatives that are responsive to the mobility needs their consumers confront. New grants were a part
of this. The smallest provider, Palo Verde Valley Transit, was successful in securing a competitive Federal
grant to meet health access trip needs identified in RCTC’s COORDINATED PUBLIC TRANSIT-HUMAN SERVICES
TRANSPORTATION PLAN. SunLine Transit was successful in an equally competitive State Cap and Trade grant,
enabling it to continue its leadership in alternate fuel buses and to establish new routes in now unserved
areas of the City of Indio and unincorporated Mecca.
Additional transit service has been added, instituted by RTA, Banning’s PASS Transit service and SunLine
to extend existing routes, to interlink routes that reduce passengers’ need for transfers and to support
new connections to rail services. These added services are reflected in the 7% increase countywide in
revenue service miles and in the 1% increase in the service area covered, increasing from 76% to 77% of
the county’s transit service area population now living within ¾ of a mile of a fixed route transit line or a
Commuter Link transit stop.
Moving Forward
Riverside County’s public transit operators are already confronting the challenges the industry faces.
These ironically include an increasingly healthy local economy that has decreased the pool of traditionally
transit-dependent riders. Moving forward means more initiatives to attract new potential riders by
providing fast, convenient and easy-to-use transit services. The increased presence of ride hail services of
Uber and Lyft, among others, will further impact mobility choices of Riverside County residents and by
extension its public operators in ways that are not yet understood. The transit providers can anticipate
the continuing challenge of balancing coverage versus frequency that plays out with such ferocity in the
large service area expanses of Riverside County.
RCTC’s development of the forthcoming LONG-RANGE TRANSPORTATION PLAN FOR RIVERSIDE COUNTY during
2017/2018 will need to address these and other challenges to help guide the County’s policy makers,
transit administrators and residents towards a robust, multi-modal transportation future.

RIVERSIDE COUNTY PUBLIC TRANSPORTATION: ANNUAL COUNTYWIDE PERFORMANCE REPORT FY 2015/2016
P A G E | 22
Appendices
Appendix A – Definitions, Data Sets and References
Appendix B – Public Transportation Trips Provided, All Modes - Six Fiscal Years
Appendix C – Bus Stop Location Counts by Operators Supporting Table 4
(Transfer Locations)
Appendix D – Public Transit Fleet Size Over Four Years

RIVERSIDE COUNTY PUBLIC TRANSPORTATION: ANNUAL COUNTYWIDE PERFORMANCE REPORT FY 2015/2016
P A G E | 23
Appendix A – Definitions, Data Sets, and References
Data Element Anticipated Data Sources Definition
Passenger trips - TransTrack data – extracted from Table
2 – SRTP Service Summary on April 4,
2017.
- Metrolink boardings separately
calculated from SCRAA data.
- One-way passenger boardings of
fixed-route, paratransit, deviated
fixed-route;
- Metrolink boardings at Riverside
County stations only.
Operating expense FY 2015/16 Annual Financial Statements
with Independent Auditor’s Report
Definition from March 2008 adopted
Commission policy, all operating
expense object classes exclusive of
depreciation and amortization, vehicle
lease expense. PUC 99247(a)
Fare revenue FY 2015/16 Annual Financial Statements
with Independent Auditor’s Report
- Definition from March 2008 adopted
Commission policy:
- Fare revenue plus supplemental fare
revenues from local support, which
may include interest, advertising, etc.
as provided for in PUC 6611.3
Transit route
structure
Active service operating along a fixed-
route or deviated fixed-route as of June
30th.
GIS shape files for active routes
County population
data at the block level
2010 US Census - Total county population
- Block level data for most current
decennial census
Transit transfer data:
Intra-system
Inter-system
Inter-county
Transfer locations at which routes
connect; each location counted only once;
counts validated by operator
Calculated by each operator, these
count each stop-level transfer location
one time for each operator, as of June
30, 2016.
Vehicle revenue miles TransTrack data – extracted from Table 2
– SRTP Service Summary on April 4, 2017
- Annual revenue service miles as of
June 30, 2016
- Or total vehicle service miles, inclusive
of deadhead.
Square mileage US Census County square mileage
Operator service area square mileage
reported in NTD
Whatever is reported to NTD, by
operator.
Vehicle revenue hours TransTrack data – extracted from Table 2
– SRTP Service Summary on April 4, 2017
Annual revenue service hours as of June
30, 2016
Accessibility and
coverage GIS
calculation for Figures
2 thru 6
The methodology used to calculate population within the ¾ mile buffers and service
areas is included on each map. Using the local California State Plan Coordinate system
with distance units measured in feet, buffer and service area polygons for each set of
transit routes were first overlaid on top of the area’s 2010 US census blocks. Then,
2010 census population counts for each block intersecting these polygons were
applied to the corresponding buffer or service area using an area-ratio calculation. If,
for example, only ¼ of the area of a census block fell within the buffer or service area
then only ¼ of the population of that census block was applied to it. The sum of all
these census block calculations, in turn, comprised the population estimate for the
corresponding buffer or service area.

RIVERSIDE COUNTY PUBLIC TRANSPORTATION: ANNUAL COUNTYWIDE PERFORMANCE REPORT FY 2015/2016
P A G E | 24
Appendix B – Public Transit Trips Provided, All Modes
Public Transportation Trips
Provided
Service by Mode [1] Trips%of Total
TripsTrips
% of
Total
Trips
# of
Vehicles
in Active
Service
Trips
% of
Total
Trips
# of
Vehicles
in Active
Service
Trips
% of
Total
Trips
# of
Vehicles
in Active
Service
Trips
% of
Total
Trips
# of
Vehicles
in Active
Service
Trips
% of
Total
Trips
Rail [2] 2,700,117 19% 878,438 6% 888,844 6% 898,216 5% 1,048,003 6% 1,071,669 7%
RCTC Commuter Rail - Riverside 1,101,646 215,864 208,230 175,032 160,388 157,748
RCTC Commuter Rail - Inland Empire Orange County 1,066,541 455,510 500,786 553,520 626,557 610,482
RCTC Commuter Rail - 91 531,930 207,064 179,828 169,664 261,058 303,439
Public Bus, Fixed Route [3] 10,575,445 76% 13,115,046 86% 269 13,603,825 86% 380 14,102,821 86% 306 14,159,311 85% 305 13,460,620 85%
RTA FR 5,718,234 6,555,135 94 6,861,830 191 7,155,365 124 7,203,364 122 7,081,410
SunLine FR 3,474,361 4,436,917 69 4,494,549 69 4,643,147 71 4,645,097 76 4,316,234
RTA Contract FR 916,366 1,635,377 80 1,713,555 90 1,744,652 79 1,753,518 78 1,534,671
Banning FR 183,265 127,499 5 138,503 5 146,981 5 135,244 7 127,524
Corona FR 146,983 153,783 4 163,054 4 169,745 6 168,303 6 152,728
Beaumont FR 89,962 164,390 9 190,589 13 198,499 13 204,112 11 202,826
Palo Verde Valley FR 46,274 41,945 8 41,745 8 44,432 8 49,673 5 45,227
Public Demand Response 548,845 4% 767,883 5% 206 795,503 5% 219 823,649 5% 188 840,811 5% 187 840,167 5%
RTA DAR 199,322 372,322 125 384,442 106 398,636 98 406,000 102 413,968
Riverside Special Transportation Services DAR 145,223 174,058 29 172,725 47 182,878 36 175,276 32 167,439
SunLine DAR 83,956 124,720 31 136,208 45 139,042 33 153,183 37 164,024
Corona DAR 58,892 61,285 12 65,635 12 68,852 12 66,015 9 63,162
Beaumont DAR 28,656 18,786 4 18,710 3 16,899 3 18,640 3 10,910
RTA Taxi 18,536 7,648 - 8,539 - 8,271 - 11,963 - 10,594
Banning DAR 9,463 9,064 5 9,244 6 9,071 6 9,734 4 10,070
Specialized Transportation/
Universal Call Program [4]61,859 0.4% 494,516 3% 45 559,104 4% 54 577,736 4% 50 543,296 3% 46 416,338 3%
Fixed Route: RTA Extended Services - 101,038 108,180 68,726 50,851 - 27,033
RTA Commuter Link - 58,466 64,171 62,542 73,635 - 0
SunLine Commuter Link 220 - - 12,868 14,528 13,952 - 6,437
SunLine Line 95 North Shore - - - 26,603 15,605 - 36,295
Paratransit/ Community Shuttle Services:
Boys & Girls Club of Southwest County - 57,044 13 49,135 16 41,676 14 38,767 13 40,663
Care-A-Van/ HOPE Bus 9,295 20,115 10 25,060 12 29,845 13 22,394 9 22,203
Care Connexxus 13,755 15,829 4 17,597 5 16,333 5 17,296 - 18,273
City of Norco - Senior Shuttle 2,606 1,130 1 2,066 1 1,956 1 2,189 1 2,984
CVAG Roy's Desert Resource Center - 38,945 2 46,561 2 45,272 2 17,288 - -
Forest Folk, Inc. 4,842 0 - 0 - 0 - 0 1 2,270
Friends of Moreno Valley Senior Center Inc., 4,842 5,364 1 4,941 1 3,002 1 4,574 1 4,313
Inland AIDS Project 1,974 2,377 2 2,354 2 2,342 1,723 - 2,046
Operation Safehouse - 524 1 309 1 624 1 765 1 1,406
Riverside County Regional Medical Center RCRMC - 10,071 10 9,208 10 5,835 10 7,640 17 7,629
County of Riverside Department of Mental Health - - - 1,408
United States Veterans Initiative - - - - 4 5,217 3 2,333 3 3,774
Wildomar Senior Community - 440 1 446 - - - - - -
Mileage Reimbursement (one-way trips
supported):
Crt. App'td Spec. Advocates-CASA/Voice for Children - 9,380 6,696 5,702 - n/a -
Voices for Children - 0 0 0 - n/a 3,222
TRIP - Partnership to Preserve Independent Living
(West County) 24,39382,383 83,831 87,850 89,828
n/a59,302
TRIP - Partnership to Preserve Independent Living
(East County)- - - 19,779
n/a-
Bus Passes/Taxi Vouchers/ Vanpool Trips:
Community Connect/ TAP Bus Pass Trips - 65,263 62,742 65,212 71,230 n/a 74,818
RCTC Commuter benefits/ Coachella Van Pool Trips - 19,037 17,700 18,740 - n/a -
RTA - Travel Training 5,026 39,334 65,354 81,031 n/a 94,213
RTA - Dial A Ride Plus 0 n/a 1,558
SunLine Taxi Voucher Program - 2,084 5,905 10,377 12,416 n/a 6,491
Mobility Management and Travel Training Projects:
Care Connexxus - Driver Sensitivity Training - n/a n/a n/a n/a n/a
Community Connect/ 211 - n/a n/a n/a n/a n/a
Blindness Support - Travel Training - n/a n/a n/a n/a n/a
RTA Travel Training - n/a n/a n/a n/a n/a
ALL TRIPS: Including Rail, Public Transit, Measure
A JARC and New Freedom 13,886,266 100% 15,255,883 100% 520 15,847,276 100% 653 16,402,422 100% 544 16,591,421 100% 538 15,788,794 100%
TOTAL POPULATION2,005,477 2,217,778 2,227,577 2,255,059 2,279,967 2,308,441
Trips per Capita for 2006 Total Population [5] 6.9 Trips per Capita for 2012 Total Population [6] 6.9 Trips per Capita for 2013 Total Population [7]
Trips per Capita for 2014 Total Population [8] 7.2 Trips per Capita for 2015 Total Population [9] 7.3
Trips per Capita for 2016 Total Population [10] 6.8Notes:
[1] Public transit operator ridership data extracted from TransTrack 'Table 2 — SRTP Service Summary' on April 4, 2017. Vehicle data reported directly from operators on April 6, 2017.
2007 Coordinated Plan
FY 05/06
[2] FY13-14 Annualized from average weekday daily boardings at Riverside County stations: Riverside, 91 and Inland Empire-Orange County Lines.
RCTC's Annual Report
FY 13/14FY 12/13
RCTC's Annual Report
7.1
FY 11/12
RCTC Coordinated Plan RCTC's Annual Report
FY 14/15
[4] Specialized Transportation ridership and vehicle data reported directly by specialized transportation operators. RTA and SunLine included in public bus [3]
[5] through [9] RCTC Fiscal Year Mid-Year Revenue Projections - Department of Finance January 1st: Demographic Research Unit county population
FY14-15 and FY 15-16 Annualized from average weekday AND average weekend daily boardings from SCRRA reported monthly ridership at Riverside County stations. There is no weekend service on the Riverside line.
RCTC's Annual Report
FY 15/16
[3] Public bus, fixed route trips for RTA and SunLine do not include Specialized Transportation funded fixed route trips: RTA Extended, Commuterlink and RTA Travel Training, SunLine CommuterLink and Line 95, and
Community Connect TAP/RTA.

RIVERSIDE COUNTY PUBLIC TRANSPORTATION: ANNUAL COUNTYWIDE PERFORMANCE REPORT FY 2015/2016
P A G E | 25
Appendix C – Bus Stop Location Counts by Operators Supporting Table 4 (Transfer Locations)
RTA Routes and Connections/ Transfer Locations As at Jan 2017
INTRA SYSTEM INTRA-COUNTY REGIONAL
ROUTES/ S 1 3 8 10 11 12 13 14 15 16 18 19 20 21 22 23 24 26 27 29 30 31 32 33 40 41 42 49 50 51 52 54 55 61 74 79 202 204 206 208 210 212 216 217 Highla
nder Shuttl
e
Corona C
ruise
r
Corona C
ruise
r Red
Corona C
ruise
r Blu
e
PassTra
nsit
Temecu
la T
rolle
y
Metr
olink
AMTRA
K
Om
ni 2
Gre
yhound
Om
nitrans8
2
Om
nitrans
215
Om
nitrans
325
Om
niTra
ns 61,6
5,66,6
7,68,8
0
NCTD
Coast
er
SunLine 2
20
NCTD
NCTD
Sprin
ter
MTS
OCTA
794
OCTA
24,4
2,46,5
0,51,5
5
Foothill
Tra
sit
1 1 3 4 4 4 5 2 1 1 1 1 1 1 1 3 2 2 2 2 3 2 2 1 2 1 2 1 1 1 1 58
3 1 1 1 1 2 3 1 10
8 1 1 1 1 4
10 3 3 3 4 3 1 1 1 1 1 1 1 2 1 1 1 2 1 2 1 34
11 1 3 2 2 1 1 1 1 1 13
12 4 3 4 3 6 1 2 1 1 1 1 1 1 1 2 1 2 1 36
13 4 3 4 3 5 1 2 2 1 1 1 1 1 1 1 1 1 2 1 2 1 1 40
14 4 4 3 3 3 1 1 1 2 1 1 1 1 1 2 1 1 1 1 1 2 1 1 1 2 41
15 5 3 6 5 3 1 2 1 1 1 1 1 2 1 1 1 1 2 2 1 1 1 1 1 45
16 2 1 1 1 1 1 1 2 3 2 1 1 1 18
18 3 1 3 2 1 1 1 1 1 1 15
19 2 1 3 2 1 1 1 2 2 3 1 2 1 1 1 1 25
20 1 1 2 1 1 1 1 2 2 1 2 1 2 1 19
21 1 1 2 2 1 2 1 2 1 1 1 1 16
22 1 1 1 1 2 2 1 1 1 2 2 1 1 1 1 2 1 1 1 1 2 1 2 1 1 1 33
23 1 2 2 3 3 1 1 1 1 15
24 2 2 2 3 1 10
26 1 1 1 1 2 2 2 1 1 1 1 1 15
27 1 1 1 1 1 1 1 1 2 2 1 1 1 3 1 1 1 3 1 2 2 1 1 1 32
29 1 1 1 1 1 1 1 2 1 2 1 1 1 1 1 1 1 1 20
30 2 1 1 1 2 1 1 1 10
31 1 1 1 2 1 1 1 2 2 1 1 2 1 1 2 2 2 2 1 27
32 1 2 3 2 3 1 2 2 16
33 3 2 3 1 3 2 1 1 16
40 1 1 1 1 1 5
41 1 3 2 1 1 1 9
42 1 1 2 1 2 1 1 1 10
49 1 1 1 1 1 1 1 1 2 1 1 1 1 1 1 1 17
50 1 1 1 1 4
51 3 1 1 1 2 2 2 1 1 1 1 16
52 2 2 1 2 3 2 1 13
54 2 1 1 1 1 2 1 1 1 1 1 1 1 2 1 1 1 1 1 22
55 2 2 2 3 1 1 1 2 14 .
61 3 2 1 1 2 2 2 1 1 1 16
74 1 1 3 2 2 3 3 1 2 2 3 2 3 2 2 32
79 3 3 1 1 1 2 1 3 2 3 1 1 1 1 3 27
202 1 1 1 2 1 1 1 1 1 1 2 1 14
204 2 1 1 1 1 1 2 1 1 1 2 2 1 1 2 1 1 1 1 1 2 1 28
206 1 1 1 1 1 1 2 1 1 1 1 1 1 14
208 2 1 1 1 1 1 1 1 1 2 2 1 1 2 1 1 1 1 1 1 1 1 1 2 1 1 1 1 3 3 1 1 3 1 1 2 48
210 3 2 1 2 2 1 1 1 1 1 1 1 1 2 1 1 1 2 3 3 1 1 1 6 1 2 43
212 2 1 1 1 1 1 1 2 2 1 1 2 2 1 1 1 1 1 3 1 1 3 3 1 2 2 1 1 1 42
216 2 1 2 2 2 2 2 1 1 1 1 1 2 1 1 1 1 1 1 1 2 1 1 1 1 33
217 1 1 1 2 2 1 1 2 1 2 3 1 1 1 2 1 1 1 1 26
OCTA 794 1 1 1 3
48 4 4 33 12 35 38 36 39 17 14 23 18 14 31 15 10 31 18 9 24 16 16 5 9 10 16 4 15 14 15 30 27 7 22 11 41 32 37 25 22 0 1 6 6 2 0 30 8 1 12 8 10 2 2 1 16 3 2 1 1 2 1 962TOTALS BY TYPE OF CONNECTION Intra System 847 Intra-County 15 Regional Rail 51 Regional Bus 49
NOTE: Some routes connect only in one direction, do not necessarily make a meaningful connection on the route's reverse dirction.

RIVERSIDE COUNTY PUBLIC TRANSPORTATION: ANNUAL COUNTYWIDE PERFORMANCE REPORT FY 2015/2016
P A G E | 26
SunLine Routes and Connections/ Transfer Locations as of January 2017INTRA-SYSTEM INTRA-COUNTY REGIONAL RAIL/INTER-CITY
Routes 14 15 20 24 30 32 53 54 70 80 81 90 91 95 111 220 Pass T
ransit
Metr
olink
AMTRA
K
Gre
yhound
14 1 1 1 2 1 1 7
15 1 1 2
**** 20 1 1 1 1 1 1 1
24 1 1 1 1 4
30 2 1 2 2 7
32 1 1 2 1 1 1 1 1 9
53 1 1 2 1 1 6
*** 54 1 1 1 2 2 1 1 1 2 1 1 14
70 1 1 1 3
80 2 3 1 1 1 1 9
81 2 3 1 1 1 1 1 10
90 1 1 1 2 1 1 7
91 1 1 1 2 1 1 7
** 95 1 1 1 1 1 1 6
111 1 1 1 2 1 1 2 1 1 1 1 1 1 1 3 19
* 220 1 1 1 1 1 1 1 1 1 9
7 2 3 7 9 5 14 2 9 9 7 7 6 17 5 1 1 8 2 126TOTALS BY TYPE OF CONNECTION Intra-System 104 Inter-Co. 6 Regional 11 121
* Effective date: September 10, 2012
** Effective date: September 2, 2013
*** Effective date: January 6, 2014
**** Effective date: January 3, 2016
SunLine's Route #220 to the Metrolink station at downtown Riverside supports out-of-county connections to San Bernardino, Los Angeles and San Diego Counties through the host of transfer options afforded at each of these stops.

RIVERSIDE COUNTY PUBLIC TRANSPORTATION: ANNUAL COUNTYWIDE PERFORMANCE REPORT FY 2015/2016
P A G E | 27
Pass Transit Routes and Connections/ Transfer LocationsREGIONL RAILINTRA-SYSTEM INTRA-COUNTY REGIONAL BUS
Route #s 1 2 3 4 5 6 7 9 120 Total I
ntra-S
ystem
RTA 1
4
RTA 3
1
SunLin
e 220
/RTA
210
Total I
ntra-C
ounty
Om
ni 1
Om
ni 2
Om
ni 202
Om
ni 325
MARTA
Big
Bear
MARTA
RIM
VVTA 1
5
Total R
egional B
us
Met
rolin
k -S
an B
ernar
dino
AMTRAK
Gre
yhound
Total R
egional B
us/Rail
1 1 1
2 54 9 9 8 8 4 4 3 1 2 1 103
3 8 9 11 9 9 2 2 1 1 1 53
4 8 9 11 8 8 1 1 1 1 1 49
5 2 1 3
6 2 1 3
7 0 4 2 1 0 0 4 0 11
9 1 1 2 1 1 1 2 1 10
120 1 3 1 1 1 1 0 1 1 1 2 3 1 1 1 1 1 2 1 2 26
72 26 25 23 27 27 9 12 6 1 9 8 3 1 1 1 1 1 2 1 3 0 259TOTALS BY TYPE OF CONNECTION Intra-System Bus 227 Intra-County Bus 18 Regional Bus 10 Regional Rail/ Intercity Bus 4 259
INTRA-SYSTEM INTRA-COUNTY
Corona Cruiser Routes and
Connections/ Transfer LocationsREGIONAL RAIL/ INTERCITY BUS
Routes Red Blue RTA SunLin
e
Metr
olink
AMTRA
K
Gre
yhound
Red 9 23 3 35
Blue 9 29 5 43
Intra-System Intra-County Regional
18 52 8 78TOTALS BY
TYPE OF
CONNECTION

RIVERSIDE COUNTY PUBLIC TRANSPORTATION: ANNUAL COUNTYWIDE PERFORMANCE REPORT FY 2015/2016
P A G E | 28
PVVTA Routes and Connections/ Transfer LocationsINTRA-COUNTYINTRA-SYSTEM REGIONAL RAIL
Routes 1 2 3 4 5 RTASunLin
e
Metro
link
AMTRAK
Greyhound
1 3 1 2 1 7
2 3 1 2 6
3 1 1 1 3
4 2 2 1 5
5 0
TOTALS 6 6 3 5 0 0 0 0 0 1 21Note: Route 5 is a weekend route and is the only route in operation. No other routes are available to transfer to.
Quartzsite Transit Services in Arizona connects paratransit services into Blythe/PVVTA Monday-Friday.

RIVERSIDE COUNTY PUBLIC TRANSPORTATION: ANNUAL COUNTYWIDE PERFORMANCE REPORT FY 2015/2016
P A G E | 29
Appendix D – Public Transit Fleet Size Over Four Fiscal Years
Public Transit Vehicles
4-Year History
Western Riverside County 339 372 382 374 -2%
Fixed Route 198 217 227 224
Demand Response 141 155 155 150
Coachella Valley 100 104 104 113 9%
Fixed Route 69 69 71 76
Demand Response 31 35 33 37
Palo Verde Valley 8 8 8 8 0%
Fixed Route 8 8 8 5
FY
2012/2013 [1]
FY
2013/2014 [1]
% Change
from Prior
Year
0%
FY
2014/2015 [2]
494
FY
2015/2016
Transit Vehicles only (fixed-route and demand response, excluding taxis)
RTA, City of Riverside, Corona, Banning, Beaumont, SunLine, Palo Verde Valley
[2] Excludes support vehicles and includes vehicles active as of June 30, 2016
Source: Vehicle information di rectly reported by operators Apri l 6, 2017.
495Countywide Totals 447 484
[1] Revised reporting from prior year reports ; excludes support vehicles .